predictive modeling using sas group presentation… · predictive modeling using sas . ... is...
TRANSCRIPT
Copyright © 2006, SAS Institute Inc. All rights reserved.
Predictive Modeling using SAS
Copyright © 2006, SAS Institute Inc. All rights reserved.
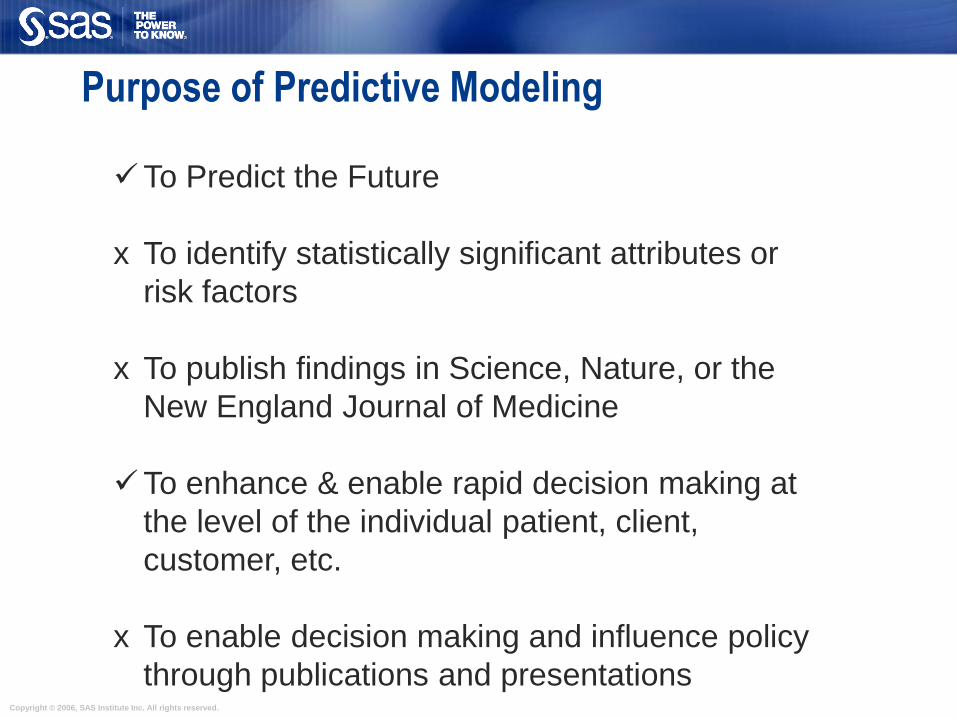
Purpose of Predictive Modeling
To Predict the Future
x To identify statistically significant attributes or
risk factors
x To publish findings in Science, Nature, or the
New England Journal of Medicine
To enhance & enable rapid decision making at
the level of the individual patient, client,
customer, etc.
x To enable decision making and influence policy
through publications and presentations

Copyright © 2006, SAS Institute Inc. All rights reserved.
Challenges: Opportunistic Data
Copyright © 2006, SAS Institute Inc. All rights reserved.
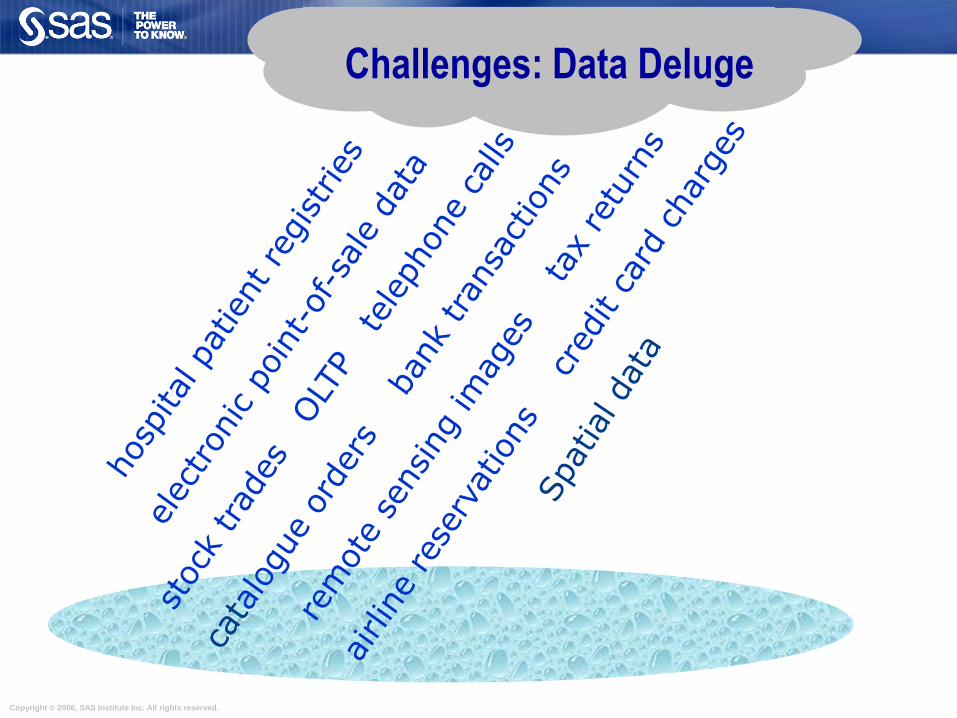
Challenges: Data Deluge

Copyright © 2006, SAS Institute Inc. All rights reserved.
cking #cking ADB NSF dirdep SVG bal
Y 1 468.11 1 1876 Y 1208Y 1 68.75 0 0 Y 0Y 1 212.04 0 6 0
. . 0 0 Y 4301y 2 585.05 0 7218 Y 234Y 1 47.69 2 1256 238Y 1 4687.7 0 0 0
. . 1 0 Y 1208Y . . . 1598 0
1 0.00 0 0 0Y 3 89981.12 0 0 Y 45662Y 2 585.05 0 7218 Y 234
Challenges: Errors, Outliers, and Missings

Copyright © 2006, SAS Institute Inc. All rights reserved.
OK
Rare Condition
Challenges: Rare Events
Copyright © 2006, SAS Institute Inc. All rights reserved.
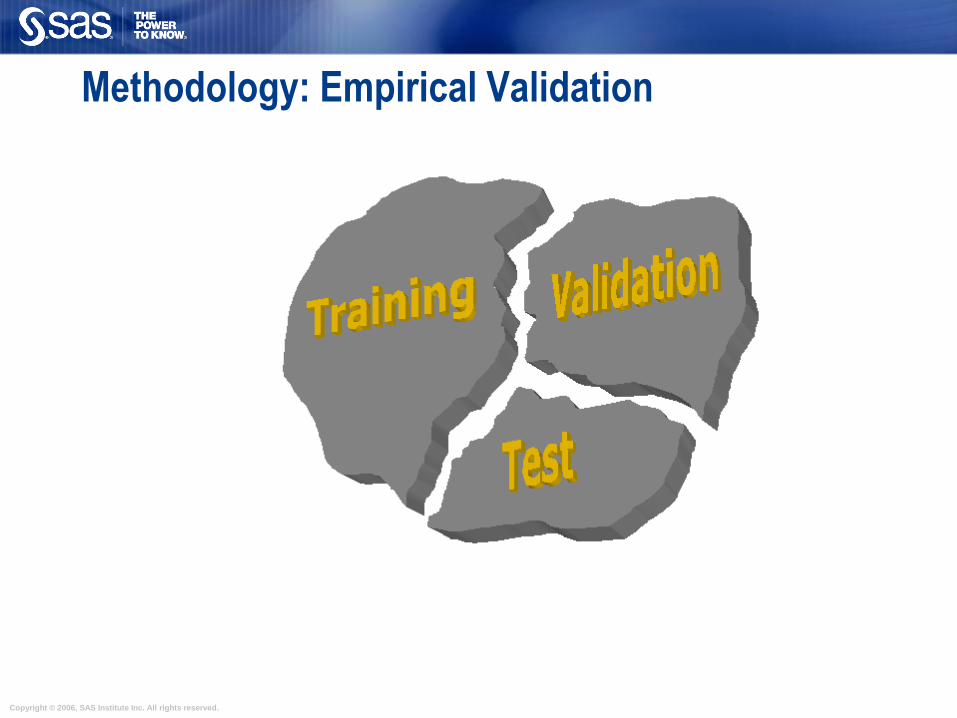
Methodology: Empirical Validation

Copyright © 2006, SAS Institute Inc. All rights reserved.
Methodology: Diversity of Algorithms
Copyright © 2006, SAS Institute Inc. All rights reserved.
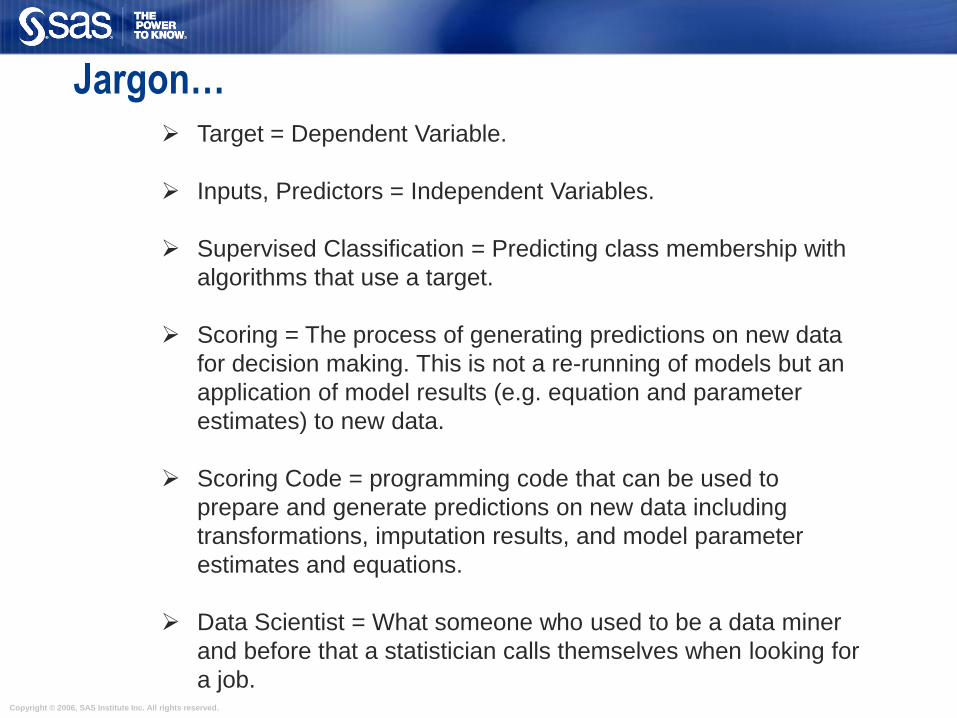
Jargon… Target = Dependent Variable.
Inputs, Predictors = Independent Variables.
Supervised Classification = Predicting class membership with
algorithms that use a target.
Scoring = The process of generating predictions on new data
for decision making. This is not a re-running of models but an
application of model results (e.g. equation and parameter
estimates) to new data.
Scoring Code = programming code that can be used to
prepare and generate predictions on new data including
transformations, imputation results, and model parameter
estimates and equations.
Data Scientist = What someone who used to be a data miner
and before that a statistician calls themselves when looking for
a job.

Copyright © 2006, SAS Institute Inc. All rights reserved.
Binary Target Example: Predicting Low Birth Weight
North Carolina Birth Records from North Carolina
Center for Health Statistics
7.2% low birth weight births ( < 2500 grams) excluding
multiple births
An oversampled (50% LBWT) development set of
17,063 births from 2000 and test set of 16,656 births
from 2001
Data contains Information on parents ethnicity, age,
education level and marital status
Data contains information on mothers health condition
and reproductive history.

Copyright © 2006, SAS Institute Inc. All rights reserved.
Training
Validation
2000 2001
TEST
Predicting the Future with Data Splitting
Models are fit to Training Data, compared and
selected on Validation and tested on a future Test
set.

Copyright © 2006, SAS Institute Inc. All rights reserved.
PREDICTORS
• Parent socio-,eco-, demo- graphics, health and behaviour
•Age, edu, race, medical conditions, smoking etc.
•Prior pregnancy related data
•# pregnancies, last outcome, prior pregnancies etc.
•Medical History for pregnancy
•Hypertension, cardiac disease, etc.
•Obstetric procedures
•Amniocentesis, ultrasound, etc.
•Events of Labor
•Breech, fetal distress etc.
•Method of delivery
•Vaginal, c-section etc.
•New born characteristics
•congenital anomalies (spinabifida, heart), APGAR
score, anemia
Scenario: an early warning system for LBWT

Copyright © 2006, SAS Institute Inc. All rights reserved.
•Parent socio-,eco,- demo- graphics and behaviour
•Prior pregnancy related data
•Medical History for pregnancy
•Obstetric procedures
•Events of Labor
•Method of delivery
•New born characteristics
Time
Beware of Temporal Infidelity…..

Copyright © 2006, SAS Institute Inc. All rights reserved.
1 0
1
0
Predicted**
TP
FP
FN
TN AN
AP
PP PN n
Accuracy =
(TP+TN)/n
Sensitivity =
TP/AP
Specificity =
TN/AN
Lift =
(TP/PP)/π1
** - Where Predicted 1=(Pred Prob > Cutoff)
Model Assessments for Binary Targets

Copyright © 2006, SAS Institute Inc. All rights reserved.
TP
TN
FN
FP
TP
TN
FN
FP
TP
TN
FN
FP
TP
TN
FN
FP
TP
TN
FN
FP
TP
TN
FN
FP
Explore measures across a range of cutoffs
Lift Charts ROC Charts
Assessment Charts for Binary TargetsL
ift
Depth 1-SP
SE

Copyright © 2006, SAS Institute Inc. All rights reserved.
0.0
1.0
0.0 1.0
weak model strong model
Receiver Operator Curves
A measure of a model’s predictive performance, or model’s ability to discriminate between
target class levels. Areas under the curve range from 0.5 to 1.0.
A concordance statistic: for every pair of observations with different outcomes (LBWT=1,
LBWT=0) AuROC measures the probability that the ordering of the predicted probabilities
agrees with the ordering of the actual target values.
…Or the probability that a low birth weight baby (LBWT=1) has a higher predicted probability
of low birth weight than a normal birth weight baby (LBWT=0).

Copyright © 2006, SAS Institute Inc. All rights reserved.
Key Features of SAS STAT Code: Data Partition
SURVEYSELECT is used to partition data into Training (67%) and Validation
(33%) sets.
The OUTALL option provides one dataset with a variable, SELECTED that
indicates dataset membership.
Stratification on the target, LBWT ensures equal representation of low birth
weight cases in training and validation sets.

Copyright © 2006, SAS Institute Inc. All rights reserved.
Key Features of SAS STAT Code: Imputation
STDIZE will do missing value replacement (REPONLY) and is applied to the
Training data.
The OUTSTAT option saves a dataset to be used to insert results (score) into
Validation and Test sets.
The METHOD=IN (MED) uses the imputation information from the training
data to score the Validation and Test data.
Copyright © 2006, SAS Institute Inc. All rights reserved.
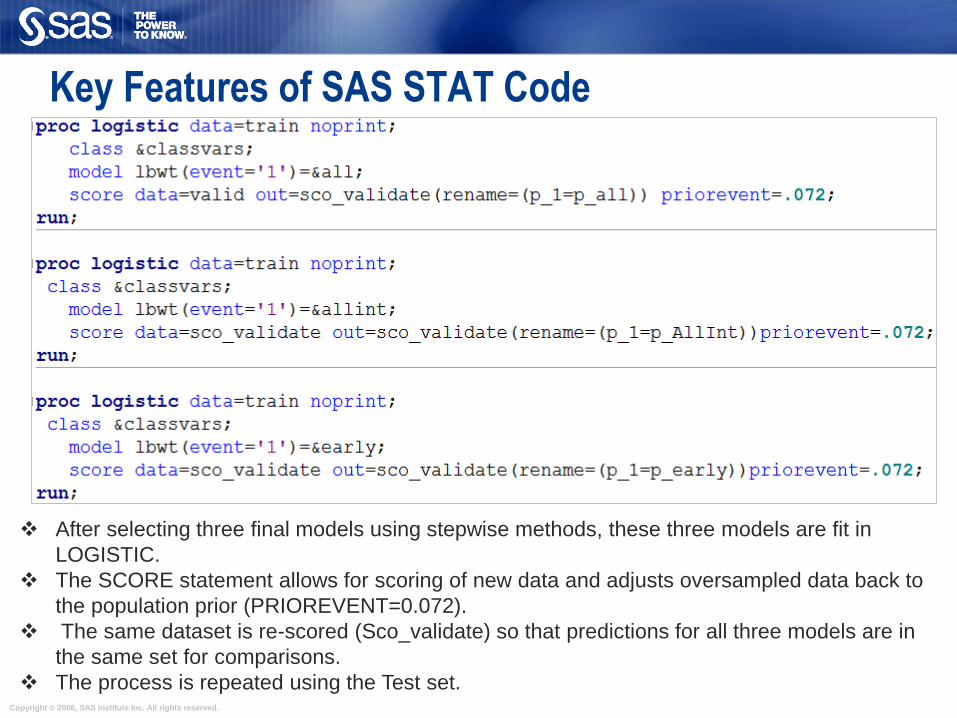
Key Features of SAS STAT Code
After selecting three final models using stepwise methods, these three models are fit in
LOGISTIC.
The SCORE statement allows for scoring of new data and adjusts oversampled data back to
the population prior (PRIOREVENT=0.072).
The same dataset is re-scored (Sco_validate) so that predictions for all three models are in
the same set for comparisons.
The process is repeated using the Test set.
Copyright © 2006, SAS Institute Inc. All rights reserved.
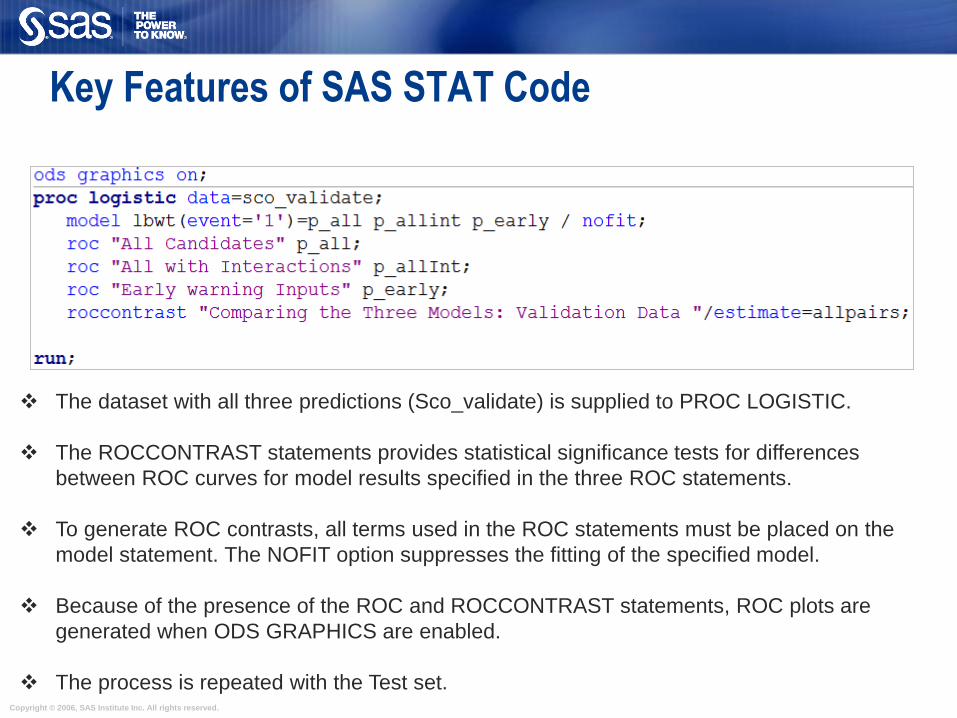
Key Features of SAS STAT Code
The dataset with all three predictions (Sco_validate) is supplied to PROC LOGISTIC.
The ROCCONTRAST statements provides statistical significance tests for differences
between ROC curves for model results specified in the three ROC statements.
To generate ROC contrasts, all terms used in the ROC statements must be placed on the
model statement. The NOFIT option suppresses the fitting of the specified model.
Because of the presence of the ROC and ROCCONTRAST statements, ROC plots are
generated when ODS GRAPHICS are enabled.
The process is repeated with the Test set.
Copyright © 2006, SAS Institute Inc. All rights reserved.
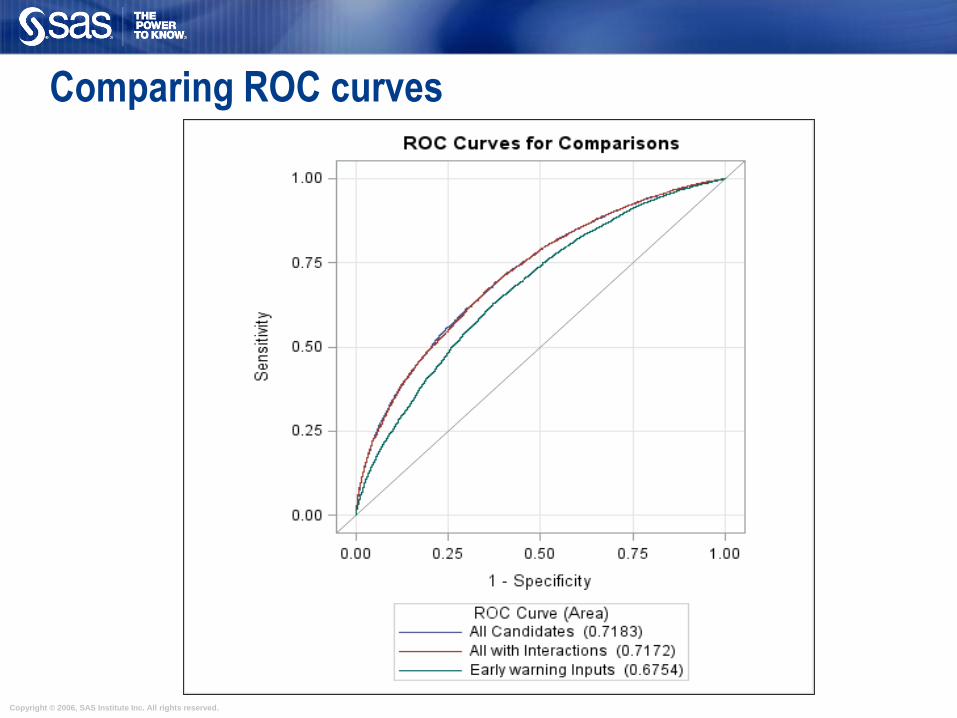
Comparing ROC curves

Copyright © 2006, SAS Institute Inc. All rights reserved.
Comparing ROC curves

Copyright © 2006, SAS Institute Inc. All rights reserved.
DEMONSTRATION

Copyright © 2006, SAS Institute Inc. All rights reserved.
Interval Target Example: Predicting Donation Amounts
A veterans’ organization seeks continued contributions
from lapsing donors. Use lapsing-donor donation
amounts from an earlier campaign to predict future
donations.
Inputs include information on previous donation
behavior by donors and solicitations by the charity.
For example…DEMVARS: socioeconomic/demographic
information, GIFTVARS: donation amount attributes,
CNTVARS: donation frequency information,
PROMVARS: Solicitation frequencies.

Copyright © 2006, SAS Institute Inc. All rights reserved.
Key Features of SAS STAT Code
GLMSELECT fits interval target models and can process validation and test datasets, or
perform cross validation for smaller datasets. It can also perform data partition using the
PARTITION statement.
GLMSELECT supports a class statement similar to PROC GLM but is designed for
predictive modeling.
Selection methods include Backward, Forward, Stepwise, LAR and LASSO.
Models can be tuned with the CHOOSE= option to select the step in a selection routine
using e.g. AIC, SBC, Mallow’s CP, or validation data error. CHOOSE=VALIDATE selects
that step that minimizes Validation data error.
SELECT= determines the order in which effects enter or leave the model. Options include,
for example: ADJRSQ, AIC, SBC, CP, CV, RSQUARE and SL. SL uses the traditional
approach of significance level.

Copyright © 2006, SAS Institute Inc. All rights reserved.
Model Tuning using Validation ASE

Copyright © 2006, SAS Institute Inc. All rights reserved.
Final Model Fitting and Score Code in GLM
GLMSELECT does not provide hypothesis test results and model diagnostics.
The model selected by GLMSELECT can be refit in PROC GLM.
PLOTS=DIAGNOSTICS requests diagnostic plots.
The new CODE statement requests score code that can be applied to a new set with the
%INCLUDE statement. SOURCE2 prints the scoring action to the log.
The following procedures support a CODE statement as of V12.1: GENMOD, GLIMMIX,
GLM, GLMSELECT, LOGISTIC, MIXED, PLM, and REG.
Copyright © 2006, SAS Institute Inc. All rights reserved.
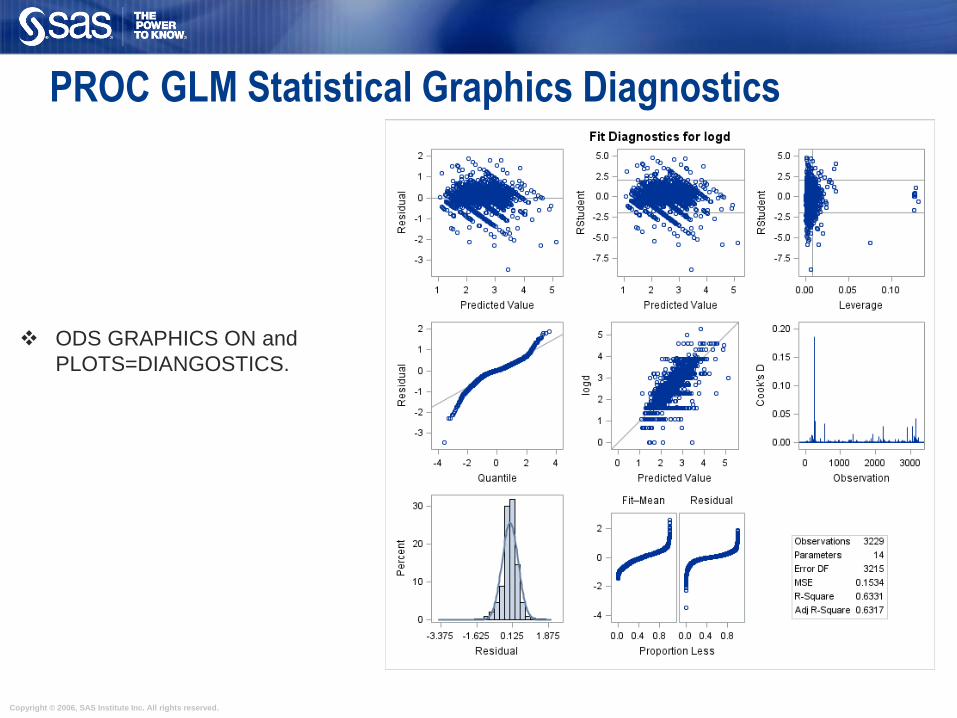
PROC GLM Statistical Graphics Diagnostics
ODS GRAPHICS ON and
PLOTS=DIANGOSTICS.

Copyright © 2006, SAS Institute Inc. All rights reserved.
Predictive Modeling: Foundation SAS or Enterprise Miner

Copyright © 2006, SAS Institute Inc. All rights reserved.
DEMONSTRATION

Copyright © 2006, SAS Institute Inc. All rights reserved.
Thank You!
Lorne Rothman, PhD, P.Stat.Principal [email protected]