spm2: spatial predictive modeling
TRANSCRIPT

Package ‘spm2’October 8, 2021
Title Spatial Predictive Modeling
Version 1.1.0
Date 2021-10-01
Description An updated and extended version of 'spm' package, by introducing some fur-ther novel functions for modern statistical methods (i.e., generalised linear models, glmnet, gen-eralised least squares), support vector machine, kriging methods (i.e., simple kriging, univer-sal kriging, block kriging, kriging with an external drift), and novel hybrid methods (228 hy-brids plus numerous variants) of modern statistical methods or machine learning meth-ods with mathematical and/or univariate geostatistical methods for spatial predictive mod-elling. For each method, two functions are provided, with one function for assessing the predic-tive errors and accuracy of the method based on cross-validation, and the other for generat-ing spatial predictions. It also contains a couple of functions for data preparation and predic-tive accuracy assessment.
Depends R (>= 2.10)
Imports spm, gstat, sp, randomForest, psy, gbm, stats, ranger, MASS,nlme, glmnet, e1071
License GPL (>= 2)
LazyData true
RoxygenNote 7.1.1
Encoding UTF-8
Suggests knitr, rmarkdown
NeedsCompilation no
Author Jin Li [aut, cre]
Maintainer Jin Li <[email protected]>
Repository CRAN
Date/Publication 2021-10-08 17:40:02 UTC
R topics documented:bees . . . . . . . . . . . . . . . . . . . . . . . . . . . . . . . . . . . . . . . . . . . . . 2ccr . . . . . . . . . . . . . . . . . . . . . . . . . . . . . . . . . . . . . . . . . . . . . . 5
1
2 bees
cran-comments . . . . . . . . . . . . . . . . . . . . . . . . . . . . . . . . . . . . . . . 6datasplit . . . . . . . . . . . . . . . . . . . . . . . . . . . . . . . . . . . . . . . . . . . 7decimaldigit . . . . . . . . . . . . . . . . . . . . . . . . . . . . . . . . . . . . . . . . . 8gbmkrigeidwcv . . . . . . . . . . . . . . . . . . . . . . . . . . . . . . . . . . . . . . . 9gbmkrigeidwpred . . . . . . . . . . . . . . . . . . . . . . . . . . . . . . . . . . . . . . 13glmcv . . . . . . . . . . . . . . . . . . . . . . . . . . . . . . . . . . . . . . . . . . . . 16glmidwcv . . . . . . . . . . . . . . . . . . . . . . . . . . . . . . . . . . . . . . . . . . 18glmidwpred . . . . . . . . . . . . . . . . . . . . . . . . . . . . . . . . . . . . . . . . . 21glmkrigecv . . . . . . . . . . . . . . . . . . . . . . . . . . . . . . . . . . . . . . . . . 23glmkrigeidwcv . . . . . . . . . . . . . . . . . . . . . . . . . . . . . . . . . . . . . . . 26glmkrigeidwpred . . . . . . . . . . . . . . . . . . . . . . . . . . . . . . . . . . . . . . 30glmkrigepred . . . . . . . . . . . . . . . . . . . . . . . . . . . . . . . . . . . . . . . . 32glmnetcv . . . . . . . . . . . . . . . . . . . . . . . . . . . . . . . . . . . . . . . . . . 35glmpred . . . . . . . . . . . . . . . . . . . . . . . . . . . . . . . . . . . . . . . . . . . 37glscv . . . . . . . . . . . . . . . . . . . . . . . . . . . . . . . . . . . . . . . . . . . . . 38glsidwcv . . . . . . . . . . . . . . . . . . . . . . . . . . . . . . . . . . . . . . . . . . . 40glsidwpred . . . . . . . . . . . . . . . . . . . . . . . . . . . . . . . . . . . . . . . . . . 42glskrigecv . . . . . . . . . . . . . . . . . . . . . . . . . . . . . . . . . . . . . . . . . . 44glskrigeidwcv . . . . . . . . . . . . . . . . . . . . . . . . . . . . . . . . . . . . . . . . 47glskrigeidwpred . . . . . . . . . . . . . . . . . . . . . . . . . . . . . . . . . . . . . . . 51glskrigepred . . . . . . . . . . . . . . . . . . . . . . . . . . . . . . . . . . . . . . . . . 53glspred . . . . . . . . . . . . . . . . . . . . . . . . . . . . . . . . . . . . . . . . . . . . 56krigecv . . . . . . . . . . . . . . . . . . . . . . . . . . . . . . . . . . . . . . . . . . . 57krigepred . . . . . . . . . . . . . . . . . . . . . . . . . . . . . . . . . . . . . . . . . . 60rfkrigeidwcv . . . . . . . . . . . . . . . . . . . . . . . . . . . . . . . . . . . . . . . . . 62rfkrigeidwpred . . . . . . . . . . . . . . . . . . . . . . . . . . . . . . . . . . . . . . . 65sponge2 . . . . . . . . . . . . . . . . . . . . . . . . . . . . . . . . . . . . . . . . . . . 68spongelonglat . . . . . . . . . . . . . . . . . . . . . . . . . . . . . . . . . . . . . . . . 71svmcv . . . . . . . . . . . . . . . . . . . . . . . . . . . . . . . . . . . . . . . . . . . . 72svmidwcv . . . . . . . . . . . . . . . . . . . . . . . . . . . . . . . . . . . . . . . . . . 74svmidwpred . . . . . . . . . . . . . . . . . . . . . . . . . . . . . . . . . . . . . . . . . 77svmkrigecv . . . . . . . . . . . . . . . . . . . . . . . . . . . . . . . . . . . . . . . . . 79svmkrigeidwcv . . . . . . . . . . . . . . . . . . . . . . . . . . . . . . . . . . . . . . . 83svmkrigeidwpred . . . . . . . . . . . . . . . . . . . . . . . . . . . . . . . . . . . . . . 86svmkrigepred . . . . . . . . . . . . . . . . . . . . . . . . . . . . . . . . . . . . . . . . 90svmpred . . . . . . . . . . . . . . . . . . . . . . . . . . . . . . . . . . . . . . . . . . . 93
Index 95
bees A dataset of bees count data and relevant information in oilseed Bras-sica fields in an Australian temperate landscape.
Description
This dataset contains 212 samples of 61 variables including three bee species, inflorescence, tem-perature, wid speed and various derived landscape variables.

bees 3
Usage
data("bees")
Format
A data frame with 212 observations on the following 61 variables.
transid a factor with levels G1 G10 G11 G12 G13 G14 G15 G16 G1D1 G1D10 G1D11 G1D12 G1D13G1D14 G1D15 G1D16 G1D17 G1D2 G1D3 G1D4 G1D5 G1D6 G1D7 G1D8 G1D9 G1G1 G1G10 G1G11G1G12 G1G13 G1G14 G1G15 G1G16 G1G17 G1G2 G1G3 G1G4 G1G5 G1G6 G1G7 G1G8 G1G9 G2G2H1 G2H10 G2H11 G2H2 G2H3 G2H4 G2H5 G2H6 G2H7 G2H8 G2H9 G2S1 G2S10 G2S11 G2S2 G2S3G2S4 G2S5 G2S6 G2S7 G2S8 G2S9 G3 G4 G5 G6 G7 G8 G9 GCH1 GCH10 GCH11 GCH12 GCH13GCH14 GCH15 GCH16 GCH17 GCH18 GCH2 GCH3 GCH4 GCH5 GCH6 GCH7 GCH8 GCH9 GCS1 GCS10GCS11 GCS12 GCS13 GCS14 GCS15 GCS16 GCS17 GCS18 GCS2 GCS3 GCS4 GCS5 GCS6 GCS7 GCS8GCS9 H1 H10 H11 H12 H13 H14 H15 H16 H2 H3 H4 H5 H6 H7 H8 H9 MC1G1 MC1G2 MC1G3 MC1G4MC1G5 MC1G6 MC1G7 MC1G8 MC1G9 MC1H1 MC1H2 MC1H3 MC1H4 MC1H5 MC1H6 MC1H7 MC1H8MC1H9 MC2AH1 MC2AH10 MC2AH11 MC2AH12 MC2AH13 MC2AH14 MC2AH15 MC2AH16 MC2AH17MC2AH18 MC2AH2 MC2AH3 MC2AH4 MC2AH5 MC2AH6 MC2AH7 MC2AH8 MC2AH9 MC2AS1 MC2AS10MC2AS11 MC2AS12 MC2AS13 MC2AS14 MC2AS15 MC2AS16 MC2AS17 MC2AS18 MC2AS2 MC2AS3MC2AS4 MC2AS5 MC2AS6 MC2AS7 MC2AS8 MC2AS9 MC2BB1 MC2BB10 MC2BB11 MC2BB12 MC2BB13MC2BB14 MC2BB15 MC2BB16 MC2BB17 MC2BB2 MC2BB3 MC2BB4 MC2BB5 MC2BB6 MC2BB7 MC2BB8MC2BB9 MC2BG1 MC2BG10 MC2BG11 MC2BG12 MC2BG13 MC2BG14 MC2BG15 MC2BG16 MC2BG17MC2BG2 MC2BG3 MC2BG4 MC2BG5 MC2BG6 MC2BG7 MC2BG8 MC2BG9
transsurv a numeric vector
plotsurv a numeric vector
paddock a numeric vector
plot a factor with levels G1-1 G1-10 G1-11 G1-12 G1-13 G1-14 G1-15 G1-16 G1-17 G1-2 G1-3G1-4 G1-5 G1-6 G1-7 G1-8 G1-9 G21 G210 G211 G22 G23 G24 G25 G26 G27 G28 G29 GC1GC10 GC11 GC12 GC13 GC14 GC15 GC16 GC17 GC18 GC2 GC3 GC4 GC5 GC6 GC7 GC8 GC9 MC-1MC-10 MC-11 MC-12 MC-13 MC-14 MC-15 MC-16 MC-2 MC-3 MC-4 MC-5 MC-6 MC-7 MC-8 MC-9MC1-1 MC1-2 MC1-3 MC1-4 MC1-5 MC1-6 MC1-7 MC1-8 MC1-9 MC2-A1 MC2-A10 MC2-A11MC2-A12 MC2-A13 MC2-A14 MC2-A15 MC2-A16 MC2-A17 MC2-A18 MC2-A2 MC2-A3 MC2-A4MC2-A5 MC2-A6 MC2-A7 MC2-A8 MC2-A9 MC2-B1 MC2-B10 MC2-B11 MC2-B12 MC2-B13 MC2-B14MC2-B15 MC2-B16 MC2-B17 MC2-B2 MC2-B3 MC2-B4 MC2-B5 MC2-B6 MC2-B7 MC2-B8 MC2-B9
obs a factor with levels Andrew Barbara Micah Sonia Steve
hbee a numeric vector
nbee a numeric vector
hover a numeric vector
date a numeric vector
sx a numeric vector
fx a numeric vector
sy a numeric vector
fy a numeric vector
loc a factor with levels 100 150 200 400 450 edge

4 bees
pair a factor with levels I O
inf a numeric vector
rankinf a numeric vector
dupl a numeric vector
temp a numeric vector
windspeed a numeric vector
winddir a factor with levels N NE NNE NNW NW
cloudc a numeric vector
disttoedgecalc a numeric vector
disttoedgemeasured a numeric vector
w100 a numeric vector
w200 a numeric vector
w300 a numeric vector
w400 a numeric vector
w500 a numeric vector
w600 a numeric vector
w700 a numeric vector
w800 a numeric vector
w900 a numeric vector
w1000 a numeric vector
w1500 a numeric vector
w2000 a numeric vector
c100 a numeric vector
c200 a numeric vector
c300 a numeric vector
c400 a numeric vector
c500 a numeric vector
c1000 a numeric vector
c1500 a numeric vector
area a numeric vector
perimeter a numeric vector
gyration a numeric vector
paratio a numeric vector
shape a numeric vector
fractaldimention a numeric vector
circumscircle a numeric vector
contiguity a numeric vector

ccr 5
links100 a numeric vector
links200 a numeric vector
links300 a numeric vector
links400 a numeric vector
links500 a numeric vector
links1000 a numeric vector
links1500 a numeric vector
links2000 a numeric vector
windspeed2 a numeric vector
Details
For details, please see the source. This dataset was published as an appendix of the paper listed inthe source. Where the long and lat were reprojected to easting and northing
Source
The data source is [https://doi.org/10.25919/5f17b34638cca] or [https://data.csiro.au/collections/collection/CIcsiro:45533],which provides bees count data and relevant predictive variables along with a brief description of thedata. The detailed descriptions of the data are available in: "Arthur, A. D., et al. (2010). "Influenceof woody vegetation on pollinator densities in oilseed Brassica fields in an Australian temperatelandscape." Basic and Applied Ecology 11: 406-414."
References
Arthur, A. D., Li, J., Henry, S., Cunningham, S.A. (2010). "Influence of woody vegetation on polli-nator densities in oilseed Brassica fields in an Australian temperate landscape." Basic and AppliedEcology 11: 406-414.
ccr Correct classification rate for predictive models based on cross -validation
Description
This function is to calculates correct classification rate (ccr) for categorical data with the observed(obs) data specified as factor. It based on the differences between the predicted values for and theobserved values of validation samples for cross-validation. For 0 and 1 data, the observed valuesneed to be specified as factor in order to use this accuracy measure. It is modified from the function’pred.acc’ in ’spm’ package.
Usage
ccr(obs, pred)
6 cran-comments
Arguments
obs a vector of observation values of validation samples.
pred a vector of prediction values of predictive models for validation samples.
Value
A list with the following component: ccr (correct classification rate) for categorical data.
Author(s)
Jin Li
References
Jin Li (2019). spm: Spatial Predictive Modeling. R package version 1.2.0. https://CRAN.R-project.org/package=spm.
Examples
set.seed(1234)x <- as.factor(sample(letters[1:2], 30, TRUE))y <- sample(x, 30)ccr(x, y)
cran-comments Note on notes
Description
This is an updated and extended version of ‘spm‘ package. The change in package name from‘spm‘ to ‘spm2‘ is due to the change in Author’s support from Geoscience Australia to Data2ActionAustralia.
## R CMD check results 0 errors | 0 warnings | 0 notes
Author(s)
Jin Li

datasplit 7
datasplit Split data for k-fold cross-validation
Description
This function is a data splitting function for k-fold cross- validation and uses a stratified randomsampling technique. It resamples the training data based on sample quantiles.
Usage
datasplit(trainy, k.fold = 10)
Arguments
trainy a vector of response, must have a length equal to sample size.
k.fold integer; number of folds in the cross-validation. if > 1, then apply k-fold crossvalidation; the default is 10, i.e., 10-fold cross validation that is recommended.
Value
A list of samples each with an index of k-fold number.
Note
This function is largely based on rfcv in randomForest.
Author(s)
Jin Li
References
A. Liaw and M. Wiener (2002). Classification and Regression by randomForest. R News 2(3),18-22.
Examples
library(spm)data(petrel)idx1 <- datasplit(petrel[, 3], k.fold = 10)table(idx1)
8 decimaldigit
decimaldigit Digit number after decimal point for a numeric variable
Description
This function is to derive the digit number after decimal point for a numeric variable (e.g., lat andlong).
Usage
decimaldigit(x, dechar = ".", nint = NA, ndec = NA, pad.left = TRUE)
Arguments
x one or more decimal numbers.
dechar The character used to separate the decimal part of a number.
nint The number of characters to which the integer part of the numbers should bepadded.
ndec The number of characters to which the decimal part of the numbers should bepadded.
pad.left Whether the left (integer) side of the numbers should be padded as well as theright.
Value
A list of integer number to show digit number after decimal point of x.
Note
This function is modified from decimal.align in ’prettyR’ package.
Author(s)
Jin Li
References
Jim Lemon and Philippe Grosjean (2019). ’prettyR’: Pretty Descriptive Stats. R package version2.1.1. https://CRAN.R-project.org/package=prettyR.
Examples
x<-c(0.1, 2.2, 3.03, 44.444, 555.0005, 6666.66666)decimaldigit(x)
gbmkrigeidwcv 9
gbmkrigeidwcv Cross validation, n-fold and leave-one-out for the hybrid methods ofgeneralized boosted regression modeling (’gbm’), ’kriging’ and in-verse distance weighted (’IDW’).
Description
This function is a cross validation function for 38 hybrid methods of ’gbm’, ’kriging’ and ’IDW’,including the average of ’gbmkrige’ and ’gbmidw’ (’gbmkrigegbmidw’) and the average of ’gbm’,’gbmkrige’ and ’gbmidw’ (’gbmgbmkrigegbmidw’), where ’kriging’ methods include ordinarykriging (’OK’), simple kriging (’SK’), block ’OK’ (’BOK’) and block ’SK’(’BSK’) and ’IDW’also covers ’NN’ and ’KNN’. The data splitting is based on a stratified random sampling method(see the ’datasplit’ function for details).
Usage
gbmkrigeidwcv(longlat,trainx,trainy,var.monotone = rep(0, ncol(trainx)),family = "gaussian",n.trees = 3000,learning.rate = 0.001,interaction.depth = 2,bag.fraction = 0.5,train.fraction = 1,n.minobsinnode = 10,transformation = "none",weights = rep(1, nrow(trainx)),keep.data = FALSE,verbose = TRUE,delta = 1,formula = res1 ~ 1,vgm.args = "Sph",anis = c(0, 1),alpha = 0,block = 0,beta,nmaxkrige = 12,idp = 2,nmaxidw = 12,hybrid.parameter = 2,lambda = 1,validation = "CV",cv.fold = 10,predacc = "VEcv",

10 gbmkrigeidwcv
n.cores = 8,...
)
Arguments
longlat a dataframe contains longitude and latitude of point samples.
trainx a dataframe or matrix contains columns of predictive variables.
trainy a vector of the response variable.
var.monotone an optional vector, the same length as the number of predictors, indicating whichvariables have a monotone increasing (+1), decreasing (-1), or arbitrary (0) re-lationship with the outcome. By default, a vector of 0 is used.
family either a character string specifying the name of the distribution to use or a listwith a component name specifying the distribution and any additional parame-ters needed. See gbm for details. By default, "gaussian" is used.
n.trees the total number of trees to fit. This is equivalent to the number of iterationsand the number of basis functions in the additive expansion. By default, 3000 isused.
learning.rate a shrinkage parameter applied to each tree in the expansion. Also known asstep-size reduction.
interaction.depth
the maximum depth of variable interactions. 1 implies an additive model, 2implies a model with up to 2-way interactions, etc. By default, 2 is used.
bag.fraction the fraction of the training set observations randomly selected to propose thenext tree in the expansion. By default, 0.5 is used.
train.fraction The first train.fraction * nrows(data) observations are used to fit the gbm and theremainder are used for computing out-of-sample estimates of the loss function.
n.minobsinnode minimum number of observations in the trees terminal nodes. Note that this isthe actual number of observations not the total weight. By default, 10 is used.
transformation transform the residuals of ’gbm’ to normalize the data for ’krige’; can be "sqrt"for square root, "arcsine" for arcsine, "log" or "none" for non transformation.By default, "none" is used.
weights an optional vector of weights to be used in the fitting process. Must be positivebut do not need to be normalized. If keep.data = FALSE in the initial call togbm then it is the user’s responsibility to resupply the weights to gbm.more. Bydefault, a vector of 1 is used.
keep.data a logical variable indicating whether to keep the data and an index of the datastored with the object. Keeping the data and index makes subsequent calls togbm.more faster at the cost of storing an extra copy of the dataset. By default,’FALSE’ is used.
verbose If TRUE, gbm will print out progress and performance indicators. By default,’TRUE’ is used.
delta numeric; to avoid log(0) in the log transformation. The default is 1.
gbmkrigeidwcv 11
formula formula defining the response vector and (possible) regressor. an object (i.e.,’variogram.formula’) for ’variogram’ or a formula for ’krige’. see ’variogram’and ’krige’ in ’gstat’ for details. The default is ’formula = res1 ~ 1’.
vgm.args arguments for ’vgm’, e.g. variogram model of response variable and anisotropyparameters. see ’vgm’ in ’gstat’ for details. By default, "Sph" is used.
anis anisotropy parameters: see notes ’vgm’ in ’gstat’ for details.
alpha direction in plane (x,y). see variogram in ’gstat’ for details.
block block size. see ’krige’ in ’gstat’ for details.
beta for simple kriging. see ’krige’ in ’gstat’ for details.
nmaxkrige for a local predicting: the number of nearest observations that should be usedfor a prediction or simulation, where nearest is defined in terms of the space ofthe spatial locations. By default, 12 observations are used.
idp a numeric number specifying the inverse distance weighting power.
nmaxidw for a local predicting: the number of nearest observations that should be usedfor a prediction or simulation, where nearest is defined in terms of the space ofthe spatial locations. By default, 12 observations are used.
hybrid.parameter
the default is 2 that is for ’gbmkrigegbmidw’; for ’gbmgbmkrigegbmidw’, itneeds to be 3.
lambda, ranging from 0 to 2; the default is 1 for ’gbmkrigegbmidw’ and ’gbmgbmkrigegb-midw’; and if it is < 1, more weight is placed on ’krige’, otherwise more weightis placed on ’idw’; and if it is 0, ’idw’ is not considered and the resultant meth-ods is ’gbmkrige’ when the default ’hybrid.parameter’ is used; and if it is 2, thenthe resultant method is ’gbmidw’ when the default ’hybrid.parameter’ is used.
validation validation methods, include ’LOO’: leave-one-out, and ’CV’: cross-validation.
cv.fold integer; number of folds in the cross-validation. if > 1, then apply n-fold crossvalidation; the default is 10, i.e., 10-fold cross validation that is recommended.
predacc can be either "VEcv" for vecv or "ALL" for all measures in function pred.acc.
n.cores The number of CPU cores to use. See gbm for details. By default, 8 is used.
... other arguments passed on to ’randomForest’, ’krige’ and ’gstat’.
Value
A list with the following components: me, rme, mae, rmae, mse, rmse, rrmse, vecv and e1; or vecvonly
Note
This function is largely based on ’gbmcv’ in ’spm’, and ’krigecv’ in ’spm2’.
Author(s)
Jin Li

12 gbmkrigeidwcv
References
Li, J., Potter, A., Huang, Z., and Heap, A. (2012). Predicting Seabed Sand Content across the Aus-tralian Margin Using Machine Learning and Geostatistical Methods, Geoscience Australia, Record2012/48, 115pp.
Li, J., Heap, A., Potter, A., and Danilel, J.J. (2011). Predicting Seabed Mud Content across theAustralian Margin II: Performance of Machine Learning Methods and Their Combination withOrdinary Kriging and Inverse Distance Squared, Geoscience Australia, Record 2011/07, 69pp.
Greg Ridgeway with contributions from others (2015). gbm: Generalized Boosted Regression Mod-els. R package version 2.1.1. https://CRAN.R-project.org/package=gbm
Pebesma, E.J., 2004. Multivariable geostatistics in S: the gstat package. Computers & Geosciences,30: 683-691.
Examples
library(spm)# gbmgbmokgbmidwdata(sponge)longlat <- sponge[, 1:2]set.seed(1234)gbmgbmkrigegbmidwcv1 <- gbmkrigeidwcv(longlat = longlat,trainx = sponge[, -3], trainy = sponge[, 3], family = "poisson", interaction.depth = 3,transformation = "none", formula = res1 ~ 1, vgm.args = "Sph",nmaxkrige = 12, idp = 2, nmaxidw = 12, hybrid.parameter = 3, validation = "CV",predacc = "ALL", n.cores = 8)gbmgbmkrigegbmidwcv1
# gbmokgbmidw for count datadata(sponge)longlat <- sponge2[, 1:2]y = sponge[, 3]trainx = sponge[, -3]set.seed(1234)n <- 20 # number of iterations,60 to 100 is recommended.VEcv <- NULLfor (i in 1:n) {
gbmkrigegbmidwcv1 <- gbmkrigeidwcv(longlat = longlat,trainx = trainx, trainy = y, family = "poisson", interaction.depth = 3,transformation = "none", formula = res1 ~ 1, vgm.args = ("Sph"),nmaxkrige = 12, idp = 2, nmaxidw = 12, hybrid.parameter = 2, validation = "CV",predacc = "VEcv", n.cores = 8)VEcv [i] <- gbmkrigegbmidwcv1}plot(VEcv ~ c(1:n), xlab = "Iteration for gbmokgbmidw", ylab = "VEcv (%)")points(cumsum(VEcv) / c(1:n) ~ c(1:n), col = 2)abline(h = mean(VEcv), col = 'blue', lwd = 2)

gbmkrigeidwpred 13
gbmkrigeidwpred Generate spatial predictions using the hybrid methods of generalizedboosted regression modeling (’gbm’), ’kriging’ and inverse distanceweighted (’IDW’).
Description
This function is for generating spatial predictions using the hybrid methods of ’gbm’, ’kriging’ and’IDW’, including all methods implemented in ’gbmkrigeidwcv’.
Usage
gbmkrigeidwpred(longlat,trainx,predx,trainy,longlatpredx,var.monotone = rep(0, ncol(trainx)),family = "gaussian",n.trees = 3000,learning.rate = 0.001,interaction.depth = 2,bag.fraction = 0.5,train.fraction = 1,n.minobsinnode = 10,transformation = "none",weights = rep(1, nrow(trainx)),keep.data = FALSE,verbose = TRUE,delta = 1,formula = res1 ~ 1,vgm.args = "Sph",anis = c(0, 1),alpha = 0,block = 0,beta,nmaxkrige = 12,idp = 2,nmaxidw = 12,hybrid.parameter = 2,lambda = 1,cv.fold = 10,n.cores = 8,...
)

14 gbmkrigeidwpred
Arguments
longlat a dataframe contains longitude and latitude of point samples.
trainx a dataframe contains longitude (long), latitude (lat), predictive variables and theresponse variable of point samples.
predx a dataframe or matrix contains columns of predictive variables for the grids tobe predicted.
trainy a vector of the response variable in the formula, that is, the left part of the for-mula.
longlatpredx a dataframe contains longitude and latitude of point locations (i.e., the centersof grids) to be predicted.
var.monotone an optional vector, the same length as the number of predictors, indicating whichvariables have a monotone increasing (+1), decreasing (-1), or arbitrary (0) re-lationship with the outcome. By default, a vector of 0 is used.
family either a character string specifying the name of the distribution to use or a listwith a component name specifying the distribution and any additional parame-ters needed. See gbm for details. By default, "gaussian" is used.
n.trees the total number of trees to fit. This is equivalent to the number of iterationsand the number of basis functions in the additive expansion. By default, 3000 isused.
learning.rate a shrinkage parameter applied to each tree in the expansion. Also known asstep-size reduction.
interaction.depth
the maximum depth of variable interactions. 1 implies an additive model, 2implies a model with up to 2-way interactions, etc. By default, 2 is used.
bag.fraction the fraction of the training set observations randomly selected to propose thenext tree in the expansion. By default, 0.5 is used.
train.fraction The first ’train.fraction * nrows(data)’ observations are used to fit the gbm andthe remainder are used for computing out-of-sample estimates of the loss func-tion.
n.minobsinnode minimum number of observations in the trees terminal nodes. Note that this isthe actual number of observations not the total weight. By default, 10 is used.
transformation transform the residuals of ’gbm’ to normalise the data; can be "sqrt" for squareroot, "arcsine" for arcsine, "log" or "none" for non transformation. By default,"none" is used.
weights an optional vector of weights to be used in the fitting process. Must be positivebut do not need to be normalized. If keep.data = FALSE in the initial call togbm then it is the user’s responsibility to resupply the weights to gbm.more. Bydefault, a vector of 1 is used.
keep.data a logical variable indicating whether to keep the data and an index of the datastored with the object. Keeping the data and index makes subsequent calls togbm.more faster at the cost of storing an extra copy of the dataset. By default,’FALSE’ is used.
verbose If TRUE, gbm will print out progress and performance indicators. By default,’TRUE’ is used.
gbmkrigeidwpred 15
delta numeric; to avoid log(0) in the log transformation. The default is 1.
formula formula defining the response vector and (possible) regressor. an object (i.e.,’variogram.formula’) for ’variogram’ or a formula for ’krige’. see ’variogram’and ’krige’ in ’gstat’ for details. The default is ’formula = res1 ~ 1’.
vgm.args arguments for ’vgm’, e.g. variogram model of response variable and anisotropyparameters. see ’vgm’ in ’gstat’ for details. By default, "Sph" is used.
anis anisotropy parameters: see notes ’vgm’ in ’gstat’ for details.
alpha direction in plane (x,y). see variogram in ’gstat’ for details.
block block size. see ’krige’ in ’gstat’ for details.
beta for simple kriging. see ’krige’ in ’gstat’ for details.
nmaxkrige for a local predicting: the number of nearest observations that should be usedfor a prediction or simulation, where nearest is defined in terms of the space ofthe spatial locations. By default, 12 observations are used.
idp a numeric number specifying the inverse distance weighting power.
nmaxidw for a local predicting: the number of nearest observations that should be usedfor a prediction or simulation, where nearest is defined in terms of the space ofthe spatial locations. By default, 12 observations are used.
hybrid.parameter
the default is 2 that is for ’gbmkrigegbmidw’; for ’gbmgbmkrigegbmidw’, itneeds to be 3.
lambda, ranging from 0 to 2; the default is 1 for ’gbmkrigegbmidw’ and ’gbmgbmkrigegb-midw’; and if it is < 1, more weight is placed on ’krige’, otherwise more weightis placed on ’idw’; and if it is 0, ’idw’ is not considered and the resultant meth-ods is ’gbmkrige’ when the default ’hybrid.parameter’ is used; and if it is 2, thenthe resultant method is ’gbmidw’ when the default ’hybrid.parameter’ is used.
cv.fold integer; number of folds in the cross-validation. if > 1, then apply n-fold crossvalidation; the default is 10, i.e., 10-fold cross validation that is recommended.
n.cores The number of CPU cores to use. See gbm for details. By default, 6 is used.
... other arguments passed on to ’gbm’, ’krige’ and ’gstat’.
Value
A dataframe of longitude, latitude, and predictions.
Author(s)
Jin Li
References
Li, J., Potter, A., Huang, Z., and Heap, A. (2012). Predicting Seabed Sand Content across the Aus-tralian Margin Using Machine Learning and Geostatistical Methods, Geoscience Australia, Record2012/48, 115pp.

16 glmcv
Li, J., Heap, A., Potter, A., and Danilel, J.J. (2011). Predicting Seabed Mud Content across theAustralian Margin II: Performance of Machine Learning Methods and Their Combination withOrdinary Kriging and Inverse Distance Squared, Geoscience Australia, Record 2011/07, 69pp.
Greg Ridgeway with contributions from others (2015). gbm: Generalized Boosted Regression Mod-els. R package version 2.1.1. https://CRAN.R-project.org/package=gbm
Pebesma, E.J., 2004. Multivariable geostatistics in S: the gstat package. Computers & Geosciences,30: 683-691.
Examples
library(spm)
data(sponge)data(sponge.grid)longlat <- sponge[, 1:2]
set.seed(1234)
gbmkrigeidwpred1 <- gbmkrigeidwpred(longlat = longlat, trainx = sponge[, -3],predx = sponge.grid, trainy = sponge[, 3], longlatpredx = sponge.grid[, c(1:2)],family = "poisson", interaction.depth = 3, transformation = "none", formula = res1 ~ 1,vgm.args = "Sph", nmaxkrige = 12, idp = 2, nmaxidw = 12, hybrid.parameter = 3,n.cores = 8)
names(gbmkrigeidwpred1)
range(gbmkrigeidwpred1$predictions)
glmcv Cross validation, n-fold and leave-one-out for generalised linear mod-els (’glm’)
Description
This function is a cross validation function for ’glm’ method in ’stats’ package.
Usage
glmcv(formula = NULL,trainxy,y,family = "gaussian",validation = "CV",cv.fold = 10,

glmcv 17
predacc = "VEcv",...
)
Arguments
formula a formula defining the response variable and predictive variables.
trainxy a dataframe contains predictive variables and the response variable of point sam-ples. The location information, longitude (long), latitude (lat), need to be in-cluded in the ’trainx’ for spatial predictive modeling.
y a vector of the response variable in the formula, that is, the left part of the for-mula.
family a description of the error distribution and link function to be used in the model.See ’?glm’ for details.
validation validation methods, include ’LOO’: leave-one-out, and ’CV’: cross-validation.
cv.fold integer; number of folds in the cross-validation. if > 1, then apply n-fold crossvalidation; the default is 10, i.e., 10-fold cross validation that is recommended.
predacc can be either "VEcv" for vecv or "ALL" for all measures in function pred.acc.
... other arguments passed on to ’glm’.
Value
A list with the following components: me, rme, mae, rmae, mse, rmse, rrmse, vecv and e1; or vecvonly
Note
This function is largely based on ’rfcv’ in ’randomForest’ and ’glm’ in ’stats’.
Author(s)
Jin Li
References
A. Liaw and M. Wiener (2002). Classification and Regression by randomForest. R News 2(3),18-22.
Examples
library(spm)
data(petrel)gravel <- petrel[, c(1, 2, 6:9, 5)]model <- log(gravel + 1) ~ lat + bathy + I(long^3) + I(lat^2) + I(lat^3)set.seed(1234)glmcv1 <- glmcv(formula = model, gravel, log(gravel[, 7] +1), validation = "CV",

18 glmidwcv
predacc = "ALL")glmcv1 # Since the default 'family' is used, it is actually a 'lm' model.
data(sponge)model <- sponge ~ easting + I(easting^2)set.seed(1234)glmcv1 <- glmcv(formula = model, sponge, sponge[, 3], family = poisson,validation = "CV", predacc = "ALL")glmcv1
# For glmmodel <- gravel / 100 ~ lat + bathy + I(long^3) + I(lat^2) + I(lat^3)set.seed(1234)n <- 20 # number of iterations,60 to 100 is recommended.VEcv <- NULLfor (i in 1:n) {glmcv1 <- glmcv(formula = model, gravel, gravel[, 7] / 100, family =binomial(link=logit), validation = "CV", predacc = "VEcv")VEcv [i] <- glmcv1}plot(VEcv ~ c(1:n), xlab = "Iteration for GLM", ylab = "VEcv (%)")points(cumsum(VEcv) / c(1:n) ~ c(1:n), col = 2)abline(h = mean(VEcv), col = 'blue', lwd = 2)
glmidwcv Cross validation, n-fold and leave-one-out for the hybrid methodof generalised linear models (’glm’) and inverse distance weighted(’IDW’) (’glmidw’)
Description
This function is a cross validation function for the hybrid method of ’glm’ and ’idw’ using ’gstat’(glmidw) (see reference #1), where the data splitting is based on a stratified random samplingmethod (see the ’datasplit’ function for details).
Usage
glmidwcv(formula = NULL,longlat,trainxy,y,family = "gaussian",idp = 2,nmaxidw = 12,validation = "CV",cv.fold = 10,

glmidwcv 19
predacc = "VEcv",...
)
Arguments
formula a formula defining the response variable and predictive variables for ’glm’.longlat a dataframe contains longitude and latitude of point samples.trainxy a dataframe contains longitude (long), latitude (lat), predictive variables and the
response variable of point samples.y a vector of the response variable in the formula, that is, the left part of the for-
mula.family a description of the error distribution and link function to be used in the model.
See ’?glm’ for details.idp a numeric number specifying the inverse distance weighting power.nmaxidw for a local predicting: the number of nearest observations that should be used
for a prediction or simulation, where nearest is defined in terms of the space ofthe spatial locations. By default, 12 observations are used.
validation validation methods, include ’LOO’: leave-one-out, and ’CV’: cross-validation.cv.fold integer; number of folds in the cross-validation. if > 1, then apply n-fold cross
validation; the default is 10, i.e., 10-fold cross validation that is recommended.predacc can be either "VEcv" for vecv or "ALL" for all measures in function pred.acc.... other arguments passed on to ’glm’ and ’gstat’.
Value
A list with the following components: me, rme, mae, rmae, mse, rmse, rrmse, vecv and e1; or vecvonly.
Note
This function is largely based on ’rfcv’ in ’randomForest’, ’idwcv’ in ’spm’and ’glm’ in ’stats’.
Author(s)
Jin Li
References
Li, J., Alvarez, B., Siwabessy, J., Tran, M., Huang, Z., Przeslawski, R., Radke, L., Howard, F. andNichol, S. (2017). "Application of random forest, generalised linear model and their hybrid methodswith geostatistical techniques to count data: Predicting sponge species richness." EnvironmentalModelling & Software 97: 112-129.
A. Liaw and M. Wiener (2002). Classification and Regression by randomForest. R News 2(3),18-22.
Pebesma, E.J., 2004. Multivariable geostatistics in S: the gstat package. Computers & Geosciences,30: 683-691.

20 glmidwcv
Examples
library(spm)
data(petrel)gravel <- petrel[, c(1, 2, 6:9, 5)]longlat <- petrel[, c(1, 2)]model <- log(gravel + 1) ~ lat + bathy + I(long^3) + I(lat^2) + I(lat^3)y <- log(gravel[, 7] +1)
set.seed(1234)glmidwcv1 <- glmidwcv(formula = model, longlat = longlat, trainxy = gravel,y = y, idp = 2, nmaxidw = 12, validation = "CV", predacc = "ALL")glmidwcv1 # Since the default 'family' is used, actually a 'lm' model is used.
data(spongelonglat)longlat <- spongelonglat[, 7:8]model <- sponge ~ long + I(long^2)y = spongelonglat[, 1]set.seed(1234)glmidwcv1 <- glmidwcv(formula = model, longlat = longlat, trainxy = spongelonglat,y = y, family = poisson, idp = 2, nmaxidw = 12, validation = "CV",predacc = "ALL")glmidwcv1
# glmidw for count datadata(spongelonglat)longlat <- spongelonglat[, 7:8]model <- sponge ~ . # use all predictive variables in the datasety = spongelonglat[, 1]set.seed(1234)n <- 20 # number of iterations,60 to 100 is recommended.VEcv <- NULLfor (i in 1:n) {glmidwcv1 <- glmidwcv(formula = model, longlat = longlat, trainxy = spongelonglat,y = y, family = poisson, idp = 2, nmaxidw = 12, validation = "CV",predacc = "VEcv")VEcv [i] <- glmidwcv1}plot(VEcv ~ c(1:n), xlab = "Iteration for GLM", ylab = "VEcv (%)")points(cumsum(VEcv) / c(1:n) ~ c(1:n), col = 2)abline(h = mean(VEcv), col = 'blue', lwd = 2)
# glmidw for percentage datalibrary(MASS)longlat <- petrel[, c(1, 2)]model <- gravel / 100 ~ lat + bathy + I(long^3) + I(lat^2) + I(lat^3)set.seed(1234)n <- 20 # number of iterations,60 to 100 is recommended.VEcv <- NULLfor (i in 1:n) {glmidwcv1 <- glmcv(formula = model, longlat = longlat, trainxy = gravel,

glmidwpred 21
y = gravel[, 7] / 100, family = binomial(link=logit), idp = 2, nmaxidw = 12,validation = "CV", predacc = "VEcv")VEcv [i] <- glmidwcv1}plot(VEcv ~ c(1:n), xlab = "Iteration for GLM", ylab = "VEcv (%)")points(cumsum(VEcv) / c(1:n) ~ c(1:n), col = 2)abline(h = mean(VEcv), col = 'blue', lwd = 2)
glmidwpred Generate spatial predictions using the hybrid method of gener-alised linear models (’glm’) and inverse distance weighted (’IDW’)(’glmidw’)
Description
This function is for generating spatial predictions using the hybrid method of ’glm’ and ’idw’(’glmidw’) (see reference #1).
Usage
glmidwpred(formula = NULL,longlat,trainxy,y,longlatpredx,predx,family = "gaussian",idp = 2,nmaxidw = 12,...
)
Arguments
formula a formula defining the response variable and predictive variables for ’glm’.
longlat a dataframe contains longitude and latitude of point samples. The location in-formation must be named as ’long’ and ’lat’.
trainxy a dataframe contains longitude (long), latitude (lat), predictive variables and theresponse variable of point samples. That is, the location information must benamed as ’long’ and ’lat’.
y a vector of the response variable in the formula, that is, the left part of the for-mula.
longlatpredx a dataframe contains longitude and latitude of point locations (i.e., the centersof grids) to be predicted.

22 glmidwpred
predx a dataframe or matrix contains columns of predictive variables for the grids tobe predicted.
family a description of the error distribution and link function to be used in the model.See ’?glm’ for details.
idp a numeric number specifying the inverse distance weighting power.
nmaxidw for a local predicting: the number of nearest observations that should be usedfor a prediction or simulation, where nearest is defined in terms of the space ofthe spatial locations. By default, 12 observations are used.
... other arguments passed on to ’glm’.
Value
A dataframe of longitude, latitude, and predictions.
Author(s)
Jin Li
References
Li, J., Alvarez, B., Siwabessy, J., Tran, M., Huang, Z., Przeslawski, R., Radke, L., Howard, F. andNichol, S. (2017). "Application of random forest, generalised linear model and their hybrid methodswith geostatistical techniques to count data: Predicting sponge species richness." EnvironmentalModelling & Software 97: 112-129.
Pebesma, E.J., 2004. Multivariable geostatistics in S: the gstat package. Computers & Geosciences,30: 683-691.
Examples
library(spm)data(petrel)data(petrel.grid)
gravel <- petrel[, c(1, 2, 6:9, 5)]longlat <- petrel[, c(1, 2)]model <- log(gravel + 1) ~ lat + bathy + I(long^3) + I(lat^2) + I(lat^3)y <- log(gravel[, 7] +1)
glmidwpred1 <- glmidwpred(formula = model, longlat = longlat, trainxy = gravel,y = y, longlatpredx = petrel.grid[, c(1:2)], predx = petrel.grid, idp = 2,nmaxidw = 12)# Since the default 'family' is used, actually a 'lm' model is used.
names(glmidwpred1)
# Back transform 'glmidwpred$predictions' to generate the final predictionsglmidwpred1$predictions.bt <- exp(glmidwpred1$predictions) - 1range(glmidwpred1$predictions.bt)
glmkrigecv 23
glmkrigecv Cross validation, n-fold and leave-one-out for the hybrid method ofgeneralised linear models (’glm’) and ’krige’ (’glmkrige’)
Description
This function is a cross validation function for the hybrid method of ’glm’ and ’krige’ (glmkrige),where ’krige’ methods include ordinary kriging (’OK’), simple kriging (’SK’), block ’OK’ (’BOK’)and block ’SK’(’BSK’) (see reference #1 for further info).
Usage
glmkrigecv(formula.glm = NULL,longlat,trainxy,y,family = "gaussian",transformation = "none",delta = 1,formula.krige = res1 ~ 1,vgm.args = c("Sph"),anis = c(0, 1),alpha = 0,block = 0,beta,nmaxkrige = 12,validation = "CV",cv.fold = 10,predacc = "VEcv",...
)
Arguments
formula.glm a formula defining the response variable and predictive variables for ’glm’.
longlat a dataframe contains longitude and latitude of point samples.
trainxy a dataframe contains longitude (long), latitude (lat), predictive variables and theresponse variable of point samples.
y a vector of the response variable in the formula, that is, the left part of the for-mula.
family a description of the error distribution and link function to be used in the model.See ’?glm’ for details.
24 glmkrigecv
transformation transform the residuals of ’glm’ to normalise the data; can be "sqrt" for squareroot, "arcsine" for arcsine, "log" or "none" for non transformation. By default,"none" is used.
delta numeric; to avoid log(0) in the log transformation. The default is 1.
formula.krige formula defining the response vector and (possible) regressor. an object (i.e.,’variogram.formula’) for ’variogram’ or a formula for ’krige’. see ’variogram’and ’krige’ in ’gstat’ for details.
vgm.args arguments for ’vgm’, e.g. variogram model of response variable and anisotropyparameters. see ’vgm’ in ’gstat’ for details. By default, "Sph" is used.
anis anisotropy parameters: see notes ’vgm’ in ’gstat’ for details.
alpha direction in plane (x,y). see variogram in ’gstat’ for details.
block block size. see ’krige’ in ’gstat’ for details.
beta for simple kriging. see ’krige’ in ’gstat’ for details.
nmaxkrige for a local predicting: the number of nearest observations that should be usedfor a prediction or simulation, where nearest is defined in terms of the space ofthe spatial locations. By default, 12 observations are used.
validation validation methods, include ’LOO’: leave-one-out, and ’CV’: cross-validation.
cv.fold integer; number of folds in the cross-validation. if > 1, then apply n-fold crossvalidation; the default is 10, i.e., 10-fold cross validation that is recommended.
predacc can be either "VEcv" for vecv or "ALL" for all measures in function pred.acc.
... other arguments passed on to ’glm’ and ’krige’.
Value
A list with the following components: me, rme, mae, rmae, mse, rmse, rrmse, vecv and e1; or vecvonly
Note
This function is largely based on ’rfcv’ in ’randomForest’, ’krigecv’ in ’spm2’and ’glm’ in ’stats’.
Author(s)
Jin Li
References
Li, J., Alvarez, B., Siwabessy, J., Tran, M., Huang, Z., Przeslawski, R., Radke, L., Howard, F. andNichol, S. (2017). "Application of random forest, generalised linear model and their hybrid methodswith geostatistical techniques to count data: Predicting sponge species richness." EnvironmentalModelling & Software 97: 112-129.
Pebesma, E.J., 2004. Multivariable geostatistics in S: the gstat package. Computers & Geosciences,30: 683-691.
glmkrigecv 25
Examples
library(spm)
data(petrel)
gravel <- petrel[, c(1, 2, 6:9, 5)]longlat <- petrel[, c(1, 2)]model <- log(gravel + 1) ~ lat + bathy + I(long^3) + I(lat^2) + I(lat^3)y <- log(gravel[, 7] +1)set.seed(1234)glmkrigecv1 <- glmkrigecv(formula.glm = model, longlat = longlat, trainxy = gravel,y = y, transformation = "none", formula.krige = res1 ~ 1, vgm.args = "Sph",nmaxkrige = 12, validation = "CV", predacc = "ALL")glmkrigecv1 # Since the default 'family' is used, actually a 'lm' model is used.
data(spongelonglat)longlat <- spongelonglat[, 7:8]model <- sponge ~ long + I(long^2)y = spongelonglat[, 1]set.seed(1234)glmkrigecv1 <- glmkrigecv(formula.glm = model, longlat = longlat, trainxy =spongelonglat, y = y, family = poisson, transformation = "arcsine",formula.krige = res1 ~ 1, vgm.args = ("Sph"), nmaxkrige = 12,validation = "CV", predacc = "ALL")glmkrigecv1
# glmok for count datadata(spongelonglat)longlat <- spongelonglat[, 7:8]model <- sponge ~ . # use all predictive variables in the datasety = spongelonglat[, 1]set.seed(1234)n <- 20 # number of iterations,60 to 100 is recommended.VEcv <- NULLfor (i in 1:n) {glmkrigecv1 <- glmkrigecv(formula.glm = model, longlat = longlat, trainxy = spongelonglat,y = y, family = poisson, formula.krige = res1 ~ 1, vgm.args = ("Sph"), nmaxkrige = 12,validation = "CV", predacc = "VEcv")VEcv [i] <- glmkrigecv1}plot(VEcv ~ c(1:n), xlab = "Iteration for GLM", ylab = "VEcv (%)")points(cumsum(VEcv) / c(1:n) ~ c(1:n), col = 2)abline(h = mean(VEcv), col = 'blue', lwd = 2)
# glmok for percentage datalibrary(MASS)longlat <- petrel[, c(1, 2)]model <- gravel / 100 ~ lat + bathy + I(long^3) + I(lat^2) + I(lat^3)set.seed(1234)n <- 20 # number of iterations,60 to 100 is recommended.VEcv <- NULL

26 glmkrigeidwcv
for (i in 1:n) {glmkrigecv1 <- glmkrigecv(formula.glm = model, longlat = longlat, trainxy = gravel,y = gravel[, 7] / 100, family = binomial(link=logit), formula.krige = res1 ~ 1,vgm.args = ("Sph"), nmaxkrige = 12, validation = "CV", predacc = "VEcv")VEcv [i] <- glmkrigecv1}plot(VEcv ~ c(1:n), xlab = "Iteration for GLM", ylab = "VEcv (%)")points(cumsum(VEcv) / c(1:n) ~ c(1:n), col = 2)abline(h = mean(VEcv), col = 'blue', lwd = 2)
glmkrigeidwcv Cross validation, n-fold and leave-one-out for the hybrid methodsof generalised linear models (’glm’), ’kriging’ and inverse distanceweighted (’IDW’).
Description
This function is a cross validation function for 38 hybrid methods of ’glm’, ’kriging’ and ’IDW’,including the average of ’glmkrige’ and ’glmidw’ (’glmkrigeglmidw’) and the average of ’glm’,’glmkrige’ and ’glmidw’ (’glmglmkrigeglmidw’), where ’kriging’ methods include ordinary krig-ing (’OK’), simple kriging (’SK’), block ’OK’ (’BOK’) and block ’SK’(’BSK’) and ’IDW’ alsocovers ’NN’ and ’KNN’ (for details, see reference #1). This function can also be sued for 38 hybridmethods of ’lm’, ’kriging’ and ’IDW’.
Usage
glmkrigeidwcv(formula.glm = NULL,longlat,trainxy,y,family = "gaussian",transformation = "none",delta = 1,formula.krige = res1 ~ 1,vgm.args = c("Sph"),anis = c(0, 1),alpha = 0,block = 0,beta,nmaxkrige = 12,idp = 2,nmaxidw = 12,hybrid.parameter = 2,lambda = 1,validation = "CV",

glmkrigeidwcv 27
cv.fold = 10,predacc = "VEcv",...
)
Arguments
formula.glm a formula defining the response variable and predictive variables for ’glm’.
longlat a dataframe contains longitude and latitude of point samples.
trainxy a dataframe contains longitude (long), latitude (lat), predictive variables and theresponse variable of point samples.
y a vector of the response variable in the formula, that is, the left part of the for-mula.
family a description of the error distribution and link function to be used in the model.See ’?glm’ for details.
transformation transform the residuals of ’glm’ to normalise the data for ’krige’; can be "sqrt"for square root, "arcsine" for arcsine, "log" or "none" for non transformation.By default, "none" is used.
delta numeric; to avoid log(0) in the log transformation. The default is 1.
formula.krige formula defining the response vector and (possible) regressor. an object (i.e.,’variogram.formula’) for ’variogram’ or a formula for ’krige’. see ’variogram’and ’krige’ in ’gstat’ for details.
vgm.args arguments for ’vgm’, e.g. variogram model of response variable and anisotropyparameters. see ’vgm’ in ’gstat’ for details. By default, "Sph" is used.
anis anisotropy parameters: see notes ’vgm’ in ’gstat’ for details.
alpha direction in plane (x,y). see variogram in ’gstat’ for details.
block block size. see ’krige’ in ’gstat’ for details.
beta for simple kriging. see ’krige’ in ’gstat’ for details.
nmaxkrige for a local predicting: the number of nearest observations that should be usedfor a prediction or simulation, where nearest is defined in terms of the space ofthe spatial locations. By default, 12 observations are used.
idp a numeric number specifying the inverse distance weighting power.
nmaxidw for a local predicting: the number of nearest observations that should be usedfor a prediction or simulation, where nearest is defined in terms of the space ofthe spatial locations. By default, 12 observations are used.
hybrid.parameter
the default is 2 that is for ’glmkrigeglmidw’; for ’glmglmkrigeglmidw’, it needsto be 3.
lambda, ranging from 0 to 2; the default is 1 for ’glmkrigeglmidw’ and ’glmglmkrigeglmidw’;and if it is < 1, more weight is placed on ’krige’, otherwise more weight isplaced on ’idw’; and if it is 0, ’idw’ is not considered and the resultant methodsis ’glmkrige’ when the default ’hybrid.parameter’ is used; and if it is 2, then theresultant method is ’glmidw’ when the default ’hybrid.parameter’ is used.

28 glmkrigeidwcv
validation validation methods, include ’LOO’: leave-one-out, and ’CV’: cross-validation.
cv.fold integer; number of folds in the cross-validation. if > 1, then apply n-fold crossvalidation; the default is 10, i.e., 10-fold cross validation that is recommended.
predacc can be either "VEcv" for vecv or "ALL" for all measures in function pred.acc.
... other arguments passed on to ’glm’, ’krige’ and ’gstat’.
Value
A list with the following components: me, rme, mae, rmae, mse, rmse, rrmse, vecv and e1; or vecvonly
Note
This function is largely based on ’rfcv’ in ’randomForest’, ’krigecv’ in ’spm2’and ’glm’ in ’stats’.
Author(s)
Jin Li
References
Li, J., Alvarez, B., Siwabessy, J., Tran, M., Huang, Z., Przeslawski, R., Radke, L., Howard, F. andNichol, S. (2017). "Application of random forest, generalised linear model and their hybrid methodswith geostatistical techniques to count data: Predicting sponge species richness." EnvironmentalModelling & Software 97: 112-129.
A. Liaw and M. Wiener (2002). Classification and Regression by randomForest. R News 2(3),18-22.
Pebesma, E.J., 2004. Multivariable geostatistics in S: the gstat package. Computers & Geosciences,30: 683-691.
Examples
library(spm)# glmokglidwdata(petrel)gravel <- petrel[, c(1, 2, 6:9, 5)]longlat <- petrel[, c(1, 2)]model <- log(gravel + 1) ~ lat + bathy + I(long^3) + I(lat^2) + I(lat^3)y <- log(gravel[, 7] +1)set.seed(1234)glmkrigeglmidwcv1 <- glmkrigeidwcv(formula.glm = model, longlat = longlat,trainxy = gravel, y = y, transformation = "none", formula.krige = res1 ~ 1,vgm.args = "Sph", nmaxkrige = 12, idp = 2, nmaxidw = 12, validation = "CV",predacc = "ALL")
glmkrigeglmidwcv1 # Since the default 'family' is used, actually a 'lm' model is used.
# glmokglmidwdata(spongelonglat)longlat <- spongelonglat[, 7:8]

glmkrigeidwcv 29
model <- sponge ~ long + I(long^2)y = spongelonglat[, 1]set.seed(1234)glmkrigeglmidwcv1 <- glmkrigeidwcv(formula.glm = model, longlat = longlat,trainxy = spongelonglat, y = y, family = poisson, transformation = "arcsine",formula.krige = res1 ~ 1, vgm.args = ("Sph"), nmaxkrige = 12, idp = 2,nmaxidw = 12, validation = "CV", predacc = "ALL")glmkrigeglmidwcv1
# glmglmokglmidwdata(spongelonglat)longlat <- spongelonglat[, 7:8]model <- sponge ~ long + I(long^2)y = spongelonglat[, 1]set.seed(1234)glmglmkrigeglmidwcv1 <- glmkrigeidwcv(formula.glm = model, longlat = longlat,trainxy = spongelonglat, y = y, family = poisson, transformation = "arcsine",formula.krige = res1 ~ 1, vgm.args = ("Sph"), nmaxkrige = 12, idp = 2,nmaxidw = 12, hybrid.parameter = 3, validation = "CV", predacc = "ALL")glmglmkrigeglmidwcv1
# glmokglidw for count datadata(spongelonglat)longlat <- spongelonglat[, 7:8]model <- sponge ~ . # use all predictive variables in the datasety = spongelonglat[, 1]set.seed(1234)n <- 20 # number of iterations,60 to 100 is recommended.VEcv <- NULLfor (i in 1:n) {glmkrigeglmidwcv1 <- glmkrigeidwcv(formula.glm = model, longlat = longlat,trainxy = spongelonglat, y = y, family = poisson, formula.krige = res1 ~ 1,vgm.args = ("Sph"), nmaxkrige = 12, idp = 2, nmaxidw = 12, validation = "CV",predacc = "VEcv")VEcv [i] <- glmkrigeglmidwcv1}plot(VEcv ~ c(1:n), xlab = "Iteration for GLM", ylab = "VEcv (%)")points(cumsum(VEcv) / c(1:n) ~ c(1:n), col = 2)abline(h = mean(VEcv), col = 'blue', lwd = 2)
# glmokglmidw for percentage datalibrary(MASS)longlat <- petrel[, c(1, 2)]model <- gravel / 100 ~ lat + bathy + I(long^3) + I(lat^2) + I(lat^3)set.seed(1234)n <- 20 # number of iterations,60 to 100 is recommended.VEcv <- NULLfor (i in 1:n) {glmkrigeglmidwcv1 <- glmkrigeidwcv(formula.glm = model, longlat = longlat,trainxy = gravel, y = gravel[, 7] / 100, family = binomial(link=logit),formula.krige = res1 ~ 1, vgm.args = ("Sph"), nmaxkrige = 12, idp = 2,nmaxidw = 12, validation = "CV", predacc = "VEcv")VEcv [i] <- glmkrigeglmidwcv1

30 glmkrigeidwpred
}plot(VEcv ~ c(1:n), xlab = "Iteration for GLM", ylab = "VEcv (%)")points(cumsum(VEcv) / c(1:n) ~ c(1:n), col = 2)abline(h = mean(VEcv), col = 'blue', lwd = 2)
glmkrigeidwpred Generate spatial predictions using the hybrid methods of gener-alised linear models (’glm’), ’kriging’ and inverse distance weighted(’IDW’).
Description
This function is for generating spatial predictions using the hybrid methods of ’glm’, ’kriging’ and’IDW’, including all methods implemented in ’glmkrigeidwcv’.
Usage
glmkrigeidwpred(formula.glm = NULL,longlat,trainxy,predx,y,longlatpredx,family = "gaussian",transformation = "none",delta = 1,formula.krige = res1 ~ 1,vgm.args = c("Sph"),anis = c(0, 1),alpha = 0,block = 0,beta,nmaxkrige = 12,idp = 2,nmaxidw = 12,hybrid.parameter = 2,lambda = 1,...
)
Arguments
formula.glm a formula defining the response variable and predictive variables for ’glm’.
longlat a dataframe contains longitude and latitude of point samples.

glmkrigeidwpred 31
trainxy a dataframe contains longitude (long), latitude (lat), predictive variables and theresponse variable of point samples.
predx a dataframe or matrix contains columns of predictive variables for the grids tobe predicted.
y a vector of the response variable in the formula, that is, the left part of the for-mula.
longlatpredx a dataframe contains longitude and latitude of point locations (i.e., the centersof grids) to be predicted.
family a description of the error distribution and link function to be used in the model.See ’?glm’ for details.
transformation transform the residuals of ’glm’ to normalise the data; can be "sqrt" for squareroot, "arcsine" for arcsine, "log" or "none" for non transformation. By default,"none" is used.
delta numeric; to avoid log(0) in the log transformation. The default is 1.
formula.krige formula defining the response vector and (possible) regressor. an object (i.e.,’variogram.formula’) for ’variogram’ or a formula for ’krige’. see ’variogram’and ’krige’ in ’gstat’ for details.
vgm.args arguments for ’vgm’, e.g. variogram model of response variable and anisotropyparameters. see ’vgm’ in ’gstat’ for details. By default, "Sph" is used.
anis anisotropy parameters: see notes ’vgm’ in ’gstat’ for details.
alpha direction in plane (x,y). see variogram in ’gstat’ for details.
block block size. see ’krige’ in ’gstat’ for details.
beta for simple kriging. see ’krige’ in ’gstat’ for details.
nmaxkrige for a local predicting: the number of nearest observations that should be usedfor a prediction or simulation, where nearest is defined in terms of the space ofthe spatial locations. By default, 12 observations are used.
idp a numeric number specifying the inverse distance weighting power.
nmaxidw for a local predicting: the number of nearest observations that should be usedfor a prediction or simulation, where nearest is defined in terms of the space ofthe spatial locations. By default, 12 observations are used.
hybrid.parameter
the default is 2 that is for ’glmkrigeglmidw’; for ’glmglmkrigeglmidw’, it needsto be 3.
lambda, ranging from 0 to 2; the default is 1 for ’glmkrigeglmidw’ and ’glmglmkrigeglmidw’;and if it is < 1, more weight is placed on ’krige’, otherwise more weight isplaced on ’idw’; and if it is 0, ’idw’ is not considered and the resultant methodsis ’glmkrige’ when the default ’hybrid.parameter’ is used; and if it is 2, then theresultant method is ’glmidw’ when the default ’hybrid.parameter’ is used.
... other arguments passed on to ’glm’, ’krige’ and ’gstat’.
Value
A dataframe of longitude, latitude, and predictions.

32 glmkrigepred
Author(s)
Jin Li
References
Li, J., Alvarez, B., Siwabessy, J., Tran, M., Huang, Z., Przeslawski, R., Radke, L., Howard, F. andNichol, S. (2017). "Application of random forest, generalised linear model and their hybrid methodswith geostatistical techniques to count data: Predicting sponge species richness." EnvironmentalModelling & Software 97: 112-129.
Pebesma, E.J., 2004. Multivariable geostatistics in S: the gstat package. Computers & Geosciences,30: 683-691.
Examples
library(spm)
data(petrel)data(petrel.grid)
gravel <- petrel[, c(1, 2, 6:9, 5)]longlat <- petrel[, c(1, 2)]model <- log(gravel + 1) ~ lat + bathy + I(long^3) + I(lat^2) + I(lat^3)y <- log(gravel[, 7] +1)
glmkrigeidwpred1 <- glmkrigeidwpred(formula.glm = model, longlat = longlat, trainxy = gravel,predx = petrel.grid, y = y, longlatpredx = petrel.grid[, c(1:2)],formula.krige = res1 ~ 1, vgm.args = "Sph", nmaxkrige = 12, idp = 2, nmaxidw = 12)# Since the default 'family' is used, actually a 'lm' model is used.
names(glmkrigeidwpred1)
# Back transform 'glmkrigeidwpred$predictions' to generate the final predictionsglmkrigeidw.predictions <- exp(glmkrigeidwpred1$predictions) - 1range(glmkrigeidw.predictions)
glmkrigepred Generate spatial predictions using the hybrid method of generalisedlinear models (’glm’) and ’krige’
Description
This function is for generating spatial predictions using the hybrid method of ’glm’ and ’krige’,including all methods implemented in ’glmkrigecv’. (see reference #1 for further info).
glmkrigepred 33
Usage
glmkrigepred(formula.glm = NULL,longlat,trainxy,predx,y,longlatpredx,family = "gaussian",transformation = "none",delta = 1,formula.krige = res1 ~ 1,vgm.args = c("Sph"),anis = c(0, 1),alpha = 0,block = 0,beta,nmaxkrige = 12,...
)
Arguments
formula.glm a formula defining the response variable and predictive variables for ’glm’.
longlat a dataframe contains longitude and latitude of point samples.
trainxy a dataframe contains longitude (long), latitude (lat), predictive variables and theresponse variable of point samples.
predx a dataframe or matrix contains columns of predictive variables for the grids tobe predicted.
y a vector of the response variable in the formula, that is, the left part of the for-mula.
longlatpredx a dataframe contains longitude and latitude of point locations (i.e., the centersof grids) to be predicted.
family a description of the error distribution and link function to be used in the model.See ’?glm’ for details.
transformation transform the residuals of ’glm’ to normalise the data; can be "sqrt" for squareroot, "arcsine" for arcsine, "log" or "none" for non transformation. By default,"none" is used.
delta numeric; to avoid log(0) in the log transformation. The default is 1.
formula.krige formula defining the response vector and (possible) regressor. an object (i.e.,’variogram.formula’) for ’variogram’ or a formula for ’krige’. see ’variogram’and ’krige’ in ’gstat’ for details.
vgm.args arguments for ’vgm’, e.g. variogram model of response variable and anisotropyparameters. see ’vgm’ in ’gstat’ for details. By default, "Sph" is used.
anis anisotropy parameters: see notes ’vgm’ in ’gstat’ for details.
34 glmkrigepred
alpha direction in plane (x,y). see variogram in ’gstat’ for details.block block size. see ’krige’ in ’gstat’ for details.beta for simple kriging. see ’krige’ in ’gstat’ for details.nmaxkrige for a local predicting: the number of nearest observations that should be used
for a prediction or simulation, where nearest is defined in terms of the space ofthe spatial locations. By default, 12 observations are used.
... other arguments passed on to ’glm’ and ’krige’.
Value
A dataframe of longitude, latitude, and predictions.
Author(s)
Jin Li
References
Li, J., Alvarez, B., Siwabessy, J., Tran, M., Huang, Z., Przeslawski, R., Radke, L., Howard, F. andNichol, S. (2017). "Application of random forest, generalised linear model and their hybrid methodswith geostatistical techniques to count data: Predicting sponge species richness." EnvironmentalModelling & Software 97: 112-129.
Pebesma, E.J., 2004. Multivariable geostatistics in S: the gstat package. Computers & Geosciences,30: 683-691.
Examples
library(spm)
data(petrel)data(petrel.grid)
gravel <- petrel[, c(1, 2, 6:9, 5)]longlat <- petrel[, c(1, 2)]model <- log(gravel + 1) ~ lat + bathy + I(long^3) + I(lat^2) + I(lat^3)y <- log(gravel[, 7] +1)
glmkrigepred1 <- glmkrigepred(formula.glm = model, longlat = longlat, trainxy = gravel,predx = petrel.grid, y = y, longlatpredx = petrel.grid[, c(1:2)],transformation = "none", formula.krige = res1 ~ 1, vgm.args = "Sph", nmaxkrige = 12)# Since the default 'family' is used, actually a 'lm' model is used.
names(glmkrigepred1)
# Back transform 'glmkrigepred$predictions' to generate the final predictionsglmkrige.predictions <- exp(glmkrigepred1$predictions) - 1range(glmkrige.predictions)

glmnetcv 35
glmnetcv Cross validation, n-fold and leave-one-out, for ’glmnet’ in ’glmnet’package
Description
This function is a cross validation function for ’glmnet’ method in ’glmnet’ package.
Usage
glmnetcv(trainx,y,family = "gaussian",alpha = 0.5,relax = FALSE,type.measure = "mse",validation = "CV",cv.fold = 10,predacc = "VEcv",...
)
Arguments
trainx a matrix contains predictive variables of point samples. The location informa-tion, longitude (long), latitude (lat), need to be included in the ’trainx’ for spatialpredictive modelling.
y a vector of the response variable in the formula, that is, the left part of the for-mula.
family a description of the error distribution and link function to be used in the model.See ’?glmnet’ for details.
alpha, an elasticnet mixing parameter, with $0 <= alpha <= 1$. See ’?glmnet’ fordetails.
relax, if TRUE then for each active set in the path of solutions, the model is refitwithout any regularization. See ’?glmnet’ for more information.
type.measure, loss to use for cross-validation. The default is type.measure="mse". See ’?cv.glmnet’for more information.
validation validation methods, include ’LOO’: leave-one-out, and ’CV’: cross-validation.
cv.fold integer; number of folds in the cross-validation. if > 1, then apply n-fold crossvalidation; the default is 10, i.e., 10-fold cross validation that is recommended.
predacc can be either "VEcv" for vecv or "ALL" for all measures in function pred.acc.
... other arguments passed on to ’fields’.

36 glmnetcv
Value
A list with the following components: me, rme, mae, rmae, mse, rmse, rrmse, vecv and e1; or vecvonly
Note
This function is largely based on ’glmcv’ in this ’spm2’ package.
Author(s)
Jin Li
References
A. Liaw and M. Wiener (2002). Classification and Regression by randomForest. R News 2(3),18-22.
Examples
library(spm)
data(petrel)x <- as.matrix(petrel[, c(1, 2, 6:9)])y <- log(petrel[, 5] + 1)set.seed(1234)glmnetcv1 <- glmnetcv(x, y, validation = "CV", predacc = "ALL")glmnetcv1
data(sponge)x <- as.matrix(cbind(sponge$easting, sponge$easting^2))set.seed(1234)glmnetcv1 <- glmnetcv(x, sponge[, 3], family = poisson, validation = "CV",predacc = "ALL")glmnetcv1
# For glmnet with gaussianx <- as.matrix(petrel[, c(1, 2, 6:9)])y <- log(petrel[, 5] + 1)set.seed(1234)n <- 20 # number of iterations,60 to 100 is recommended.VEcv <- NULLfor (i in 1:n) {
glmnetcv1 <- glmnetcv(x, y, validation = "CV", predacc = "VEcv")VEcv [i] <- glmnetcv1}
plot(VEcv ~ c(1:n), xlab = "Iteration for glmnet", ylab = "VEcv (%)")points(cumsum(VEcv) / c(1:n) ~ c(1:n), col = 2)abline(h = mean(VEcv), col = 'blue', lwd = 2)
# For glmnet with binomialx <- as.matrix(cbind(petrel[, c(2, 6)], petrel$long^3, petrel$lat^2, petrel$lat^3))

glmpred 37
set.seed(1234)n <- 20 # number of iterations,60 to 100 is recommended.VEcv <- NULLfor (i in 1:n) {glmnetcv1 <- glmnetcv(x, petrel[, 5] / 100, family = binomial(link=logit),validation = "CV", predacc = "VEcv")VEcv [i] <- glmnetcv1}plot(VEcv ~ c(1:n), xlab = "Iteration for glmnet", ylab = "VEcv (%)")points(cumsum(VEcv) / c(1:n) ~ c(1:n), col = 2)abline(h = mean(VEcv), col = 'blue', lwd = 2)
glmpred Generate spatial predictions using generalised linear models (’glm’)
Description
This function is for generating spatial predictions using ’glm’ method in ’stats’ package.
Usage
glmpred(formula = NULL, trainxy, longlatpredx, predx, family = "gaussian", ...)
Arguments
formula a formula defining the response variable and predictive variables.
trainxy a dataframe contains predictive variables and the response variable of point sam-ples. The location information, longitude (long), latitude (lat), need to be in-cluded in the ’trainx’ for spatial predictive modeling, need to be named as ’long’and ’lat’.
longlatpredx a dataframe contains longitude and latitude of point locations (i.e., the centersof grids) to be predicted.
predx a dataframe or matrix contains columns of predictive variables for the grids tobe predicted.
family a description of the error distribution and link function to be used in the model.See ’?glm’ for details.
... other arguments passed on to ’glm’.
Value
A dataframe of longitude, latitude and predictions.
Author(s)
Jin Li
38 glscv
Examples
library(spm)data(petrel)data(petrel.grid)
gravel <- petrel[, c(1, 2, 6:9, 5)]model <- log(gravel + 1) ~ lat + bathy + I(long^3) + I(lat^2) + I(lat^3)
glmpred1 <- glmpred(formula = model, trainxy = gravel,longlatpredx = petrel.grid[, c(1:2)], predx = petrel.grid)
names(glmpred1)
# Back transform 'glmpred1$pred.glm1' to generate the final predictionsglm.predictions <- exp(glmpred1$pred.glm1) - 1range(glm.predictions)
glscv Cross validation, n-fold and leave-one-out for generalized leastsquares (’gls’)
Description
This function is a cross validation function for ’gls’ method in ’nlme’ package.
Usage
glscv(model = var1 ~ 1,trainxy,y,corr.args = NULL,weights = NULL,validation = "CV",cv.fold = 10,predacc = "VEcv",...
)
Arguments
model a formula defining the response variable and predictive variables.
trainxy a dataframe contains longitude (long), latitude (lat), predictive variables and theresponse variable of point samples. That is, the location information must benames as ’long’ and ’lat’.

glscv 39
y a vector of the response variable in the formula, that is, the left part of the for-mula.
corr.args arguments for ’correlation’ in ’gls’. See ’?corClasses’ in ’nlme’ for details. Bydefault, "NULL" is used. When "NULL" is used, then ’gls’ is actually perform-ing ’lm’.
weights describing the within-group heteroscedasticity structure. Defaults to "NULL",corresponding to homoscedastic errors. See ’?gls’ in ’nlme’ for details.
validation validation methods, include ’LOO’: leave-one-out, and ’CV’: cross-validation.
cv.fold integer; number of folds in the cross-validation. if > 1, then apply n-fold crossvalidation; the default is 10, i.e., 10-fold cross validation that is recommended.
predacc can be either "VEcv" for vecv or "ALL" for all measures in function pred.acc.
... other arguments passed on to ’gls’.
Value
A list with the following components: me, rme, mae, rmae, mse, rmse, rrmse, vecv and e1; or vecvonly
Note
This function is largely based on rfcv in ’randomForest’ and ’gls’ in ’library(nlme)’.
Author(s)
Jin Li
References
Pinheiro, J. C. and D. M. Bates (2000). Mixed-Effects Models in S and S-PLUS. New York,Springer.
Examples
library(spm)library(nlme)
data(petrel)gravel <- petrel[, c(1, 2, 6:9, 5)]range1 <- 0.8nugget1 <- 0.5
model <- log(gravel + 1) ~ long + lat + bathy + dist + I(long^2) + I(lat^2) +I(lat^3) + I(bathy^2) + I(bathy^3) + I(dist^2) + I(dist^3) + I(relief^2) + I(relief^3)
glscv1 <- glscv(model = model, gravel, log(gravel[, 7] +1), validation = "CV",corr.args = corSpher(c(range1, nugget1), form = ~ long + lat, nugget = T),predacc = "ALL")

40 glsidwcv
glscv1
#For glsset.seed(1234)n <- 20 # number of iterations,60 to 100 is recommended.VEcv <- NULLfor (i in 1:n) {glscv1 <- glscv(model = model, gravel, log(gravel[, 7] +1), validation = "CV",
corr.args = corSpher(c(range1, nugget1), form = ~ long + lat,nugget = T), predacc = "VEcv")
VEcv [i] <- glscv1}plot(VEcv ~ c(1:n), xlab = "Iteration for GLS", ylab = "VEcv (%)")points(cumsum(VEcv) / c(1:n) ~ c(1:n), col = 2)abline(h = mean(VEcv), col = 'blue', lwd = 2)
# For lm, that is, gls with 'correlation = NULL'n <- 20 # number of iterations,60 to 100 is recommended.VEcv <- NULLset.seed(1234)for (i in 1:n) {glscv1 <- glscv(model = model, gravel, log(gravel[, 7] +1),validation = "CV", predacc = "VEcv")VEcv [i] <- glscv1}plot(VEcv ~ c(1:n), xlab = "Iteration for GLS", ylab = "VEcv (%)")points(cumsum(VEcv) / c(1:n) ~ c(1:n), col = 2)abline(h = mean(VEcv), col = 'blue', lwd = 2)
glsidwcv Cross validation, n-fold and leave-one-out for the hybrid method ofgeneralized least squares (’gls’) and inverse distance weighted (’idw’)(glsidw)
Description
This function is a cross validation function for the hybrid method of ’gls’ and ’idw’, where the datasplitting is based on a stratified random sampling method (see the ’datasplit’ function for details)
Usage
glsidwcv(model = var1 ~ 1,longlat,trainxy,y,corr.args = NULL,

glsidwcv 41
weights = NULL,idp = 2,nmaxidw = 12,validation = "CV",cv.fold = 10,predacc = "VEcv",...
)
Arguments
model a formula defining the response variable and predictive variables.
longlat a dataframe contains longitude and latitude of point samples.
trainxy a dataframe contains longitude (long), latitude (lat), predictive variables and theresponse variable of point samples. That is, the location information must benames as ’long’ and ’lat’.
y a vector of the response variable in the formula, that is, the left part of the for-mula.
corr.args arguments for ’correlation’ in ’gls’. See ’?corClasses’ in ’nlme’ for details. Bydefault, "NULL" is used. When "NULL" is used, then ’gls’ is actually perform-ing ’lm’.
weights describing the within-group heteroscedasticity structure. Defaults to "NULL",corresponding to homoscedastic errors. See ’?gls’ in ’nlme’ for details.
idp a numeric number specifying the inverse distance weighting power.
nmaxidw for a local predicting: the number of nearest observations that should be usedfor a prediction or simulation, where nearest is defined in terms of the space ofthe spatial locations. By default, 12 observations are used.
validation validation methods, include ’LOO’: leave-one-out, and ’CV’: cross-validation.
cv.fold integer; number of folds in the cross-validation. if > 1, then apply n-fold crossvalidation; the default is 10, i.e., 10-fold cross validation that is recommended.
predacc can be either "VEcv" for vecv or "ALL" for all measures in function pred.acc.
... other arguments passed on to ’gls’ and ’gstat’.
Value
A list with the following components: me, rme, mae, rmae, mse, rmse, rrmse, vecv and e1; or vecvonly.
Note
This function is largely based on rfcv in ’randomForest’ and ’gls’ in ’library(nlme)’.
Author(s)
Jin Li

42 glsidwpred
References
Pinheiro, J. C. and D. M. Bates (2000). Mixed-Effects Models in S and S-PLUS. New York,Springer.
Pebesma, E.J., 2004. Multivariable geostatistics in S: the gstat package. Computers & Geosciences,30: 683-691.
Examples
library(spm)library(nlme)
data(petrel)gravel <- petrel[, c(1, 2, 6:9, 5)]longlat <- petrel[, c(1, 2)]range1 <- 0.8nugget1 <- 0.5model <- log(gravel + 1) ~ long + lat + bathy + dist + I(long^2) + I(lat^2) +I(lat^3) + I(bathy^2) + I(bathy^3) + I(dist^2) + I(dist^3) + I(relief^2) + I(relief^3)
glsidwcv1 <- glsidwcv(model = model, longlat = longlat, trainxy = gravel,y = log(gravel[, 7] +1), idp = 2, nmaxidw = 12, validation = "CV",corr.args = corSpher(c(range1, nugget1), form = ~ lat + long, nugget = T),predacc = "ALL")
glsidwcv1
# For glsidwset.seed(1234)n <- 20 # number of iterations,60 to 100 is recommended.VEcv <- NULLfor (i in 1:n) {glsidwcv1 <- glsidwcv(model = model, longlat = longlat, trainxy = gravel,y = log(gravel[, 7] +1), idp = 2, nmaxidw = 12, validation = "CV",corr.args = corSpher(c(range1, nugget1), form = ~ lat + long, nugget = T),predacc = "VEcv")VEcv [i] <- glsidwcv1}plot(VEcv ~ c(1:n), xlab = "Iteration for GLSIDW", ylab = "VEcv (%)")points(cumsum(VEcv) / c(1:n) ~ c(1:n), col = 2)abline(h = mean(VEcv), col = 'blue', lwd = 2)
glsidwpred Generate spatial predictions using the hybrid method of generalizedleast squares (’gls’) and inverse distance weighted (’IDW’) (’glsidw’)
glsidwpred 43
Description
This function is for generating spatial predictions using the hybrid method of ’gls’ and ’idw’(’glsidw’) (see reference #1).
Usage
glsidwpred(model = var1 ~ 1,longlat,trainxy,y,longlatpredx,predx,corr.args = NULL,weights = NULL,idp = 2,nmaxidw = 12,...
)
Arguments
model a formula defining the response variable and predictive variables.
longlat a dataframe contains longitude and latitude of point samples.
trainxy a dataframe contains longitude (long), latitude (lat), predictive variables and theresponse variable of point samples. That is, the location information must benames as ’long’ and ’lat’.
y a vector of the response variable in the formula, that is, the left part of the for-mula.
longlatpredx a dataframe contains longitude and latitude of point locations (i.e., the centersof grids) to be predicted. The location information must be named as ’long’ and’lat’.
predx a dataframe or matrix contains columns of predictive variables for the grids tobe predicted.
corr.args arguments for ’correlation’ in ’gls’. See ’?corClasses’ in ’nlme’ for details. Bydefault, "NULL" is used. When "NULL" is used, then ’gls’ is actually perform-ing ’lm’.
weights describing the within-group heteroscedasticity structure. Defaults to "NULL",corresponding to homoscedastic errors. See ’?gls’ in ’nlme’ for details.
idp a numeric number specifying the inverse distance weighting power.
nmaxidw for a local predicting: the number of nearest observations that should be usedfor a prediction or simulation, where nearest is defined in terms of the space ofthe spatial locations. By default, 12 observations are used.
... other arguments passed on to ’gls’ and ’gstat’.

44 glskrigecv
Value
A dataframe of longitude, latitude, and predictions.
Author(s)
Jin Li
References
Pinheiro, J. C. and D. M. Bates (2000). Mixed-Effects Models in S and S-PLUS. New York,Springer.
Pebesma, E.J., 2004. Multivariable geostatistics in S: the gstat package. Computers & Geosciences,30: 683-691.
Examples
library(spm)library(nlme)
data(petrel)data(petrel.grid)
gravel <- petrel[, c(1, 2, 6:9, 5)]longlat <- petrel[, c(1, 2)]range1 <- 0.8nugget1 <- 0.5model <- log(gravel + 1) ~ long + lat + bathy + dist + I(long^2) + I(lat^2) +I(lat^3) + I(bathy^2) + I(bathy^3) + I(dist^2) + I(dist^3) + I(relief^2) + I(relief^3)y <- log(gravel[, 7] +1)
glsidwpred1 <- glsidwpred(model = model, longlat = longlat, trainxy = gravel,y = y, longlatpredx = petrel.grid[, c(1:2)], predx = petrel.grid,idp = 2, nmaxidw = 12, corr.args = corSpher(c(range1, nugget1),form = ~ lat + long, nugget = T))
names(glsidwpred1)
# Back transform 'glsidwpred$predictions' to generate the final predictionsglsidw.predictions <- exp(glsidwpred1$predictions) - 1range(glsidw.predictions)
glskrigecv Cross validation, n-fold and leave-one-out for the hybrid method ofgeneralized least squares (’gls’) and kriging (’krige’) (’glskrige’)

glskrigecv 45
Description
This function is a cross validation function for the hybrid method of ’gls’ and ’krige’ (’glskrige’),where the data splitting is based on a stratified random sampling method (see the ’datasplit’ functionfor details)
Usage
glskrigecv(model = var1 ~ 1,longlat,trainxy,y,corr.args = NULL,weights = NULL,transformation = "none",delta = 1,formula.krige = res1 ~ 1,vgm.args = c("Sph"),anis = c(0, 1),alpha = 0,block = 0,beta,nmaxkrige = 12,validation = "CV",cv.fold = 10,predacc = "VEcv",...
)
Arguments
model a formula defining the response variable and predictive variables.
longlat a dataframe contains longitude and latitude of point samples.
trainxy a dataframe contains longitude (long), latitude (lat), predictive variables and theresponse variable of point samples. That is, the location information must benames as ’long’ and ’lat’.
y a vector of the response variable in the formula, that is, the left part of the for-mula.
corr.args arguments for ’correlation’ in ’gls’. See ’?corClasses’ in ’nlme’ for details. Bydefault, "NULL" is used. When "NULL" is used, then ’gls’ is actually perform-ing ’lm’.
weights describing the within-group heteroscedasticity structure. Defaults to "NULL",corresponding to homoscedastic errors. See ’?gls’ in ’nlme’ for details.
transformation transform the residuals of ’gls’ to normalize the data; can be "sqrt" for squareroot, "arcsine" for arcsine, "log" or "none" for non transformation. By default,"none" is used.
46 glskrigecv
delta numeric; to avoid log(0) in the log transformation. The default is 1.
formula.krige formula defining the response vector and (possible) regressor. an object (i.e.,’variogram.formula’) for ’variogram’ or a formula for ’krige’. see ’variogram’and ’krige’ in ’gstat’ for details.
vgm.args arguments for ’vgm’, e.g. variogram model of response variable and anisotropyparameters. see ’vgm’ in ’gstat’ for details. By default, "Sph" is used.
anis anisotropy parameters: see notes ’vgm’ in ’gstat’ for details.
alpha direction in plane (x,y). see variogram in ’gstat’ for details.
block block size. see ’krige’ in ’gstat’ for details.
beta for simple kriging. see ’krige’ in ’gstat’ for details.
nmaxkrige for a local predicting: the number of nearest observations that should be usedfor a prediction or simulation, where nearest is defined in terms of the space ofthe spatial locations. By default, 12 observations are used.
validation validation methods, include ’LOO’: leave-one-out, and ’CV’: cross-validation.
cv.fold integer; number of folds in the cross-validation. if > 1, then apply n-fold crossvalidation; the default is 10, i.e., 10-fold cross validation that is recommended.
predacc can be either "VEcv" for vecv or "ALL" for all measures in function pred.acc.
... other arguments passed on to ’gls’ and ’krige’.
Value
A list with the following components: me, rme, mae, rmae, mse, rmse, rrmse, vecv and e1; or vecvonly.
Note
This function is largely based on rfcv in ’randomForest’, ’krigecv’ in ’spm2’ and ’gls’ in ’li-brary(nlme)’.
Author(s)
Jin Li
References
Pinheiro, J. C. and D. M. Bates (2000). Mixed-Effects Models in S and S-PLUS. New York,Springer.
Pebesma, E.J., 2004. Multivariable geostatistics in S: the gstat package. Computers & Geosciences,30: 683-691.
Examples
library(spm)library(nlme)

glskrigeidwcv 47
data(petrel)gravel <- petrel[, c(1, 2, 6:9, 5)]longlat <- petrel[, c(1, 2)]range1 <- 0.8nugget1 <- 0.5model <- log(gravel + 1) ~ long + lat + bathy + dist + I(long^2) + I(lat^2) +I(lat^3) + I(bathy^2) + I(bathy^3) + I(dist^2) + I(dist^3) + I(relief^2) + I(relief^3)
glskrigecv1 <- glskrigecv(model = model, longlat = longlat, trainxy = gravel,y = log(gravel[, 7] +1), transformation = "none", formula.krige = res1 ~ 1,vgm.args = "Sph", nmaxkrige = 12, validation = "CV",corr.args = corSpher(c(range1, nugget1), form = ~ lat + long, nugget = T),predacc = "ALL")
glskrigecv1
# For glskrigeset.seed(1234)n <- 20 # number of iterations,60 to 100 is recommended.VEcv <- NULLfor (i in 1:n) {glskrigecv1 <- glskrigecv(model = model, longlat = longlat, trainxy = gravel,y = log(gravel[, 7] +1), transformation = "none", formula.krige = res1 ~ 1,vgm.args = "Sph", nmaxok = 12, validation = "CV",corr.args = corSpher(c(range1, nugget1), form = ~ lat + long, nugget = T),predacc = "VEcv")
VEcv [i] <- glskrigecv1}plot(VEcv ~ c(1:n), xlab = "Iteration for GLSOK", ylab = "VEcv (%)")points(cumsum(VEcv) / c(1:n) ~ c(1:n), col = 2)abline(h = mean(VEcv), col = 'blue', lwd = 2)
glskrigeidwcv Cross validation, n-fold and leave-one-out for the hybrid methodsof generalised least squares (’gls’), ’kriging’ and inverse distanceweighted (’IDW’)
Description
This function is a cross validation function for 38 hybrid methods of ’gls’, ’kriging’ and ’IDW’, in-cluding the average of ’glskrige’ and ’glsidw’ (’glskrigeglsidw’) and the average of ’gls’, ’glskrige’and ’glsidw’ (’glsglskrigeglsidw’), where ’kriging’ methods include ordinary kriging (’OK’), sim-ple kriging (’SK’), block ’OK’ (’BOK’) and block ’SK’(’BSK’) and ’IDW’ also covers ’NN’ and’KNN’.. The data splitting is based on a stratified random sampling method (see the ’datasplit’function for details).
Usage
glskrigeidwcv(

48 glskrigeidwcv
model = var1 ~ 1,longlat,trainxy,y,corr.args = NULL,weights = NULL,transformation = "none",delta = 1,formula.krige = res1 ~ 1,vgm.args = c("Sph"),anis = c(0, 1),alpha = 0,block = 0,beta,nmaxkrige = 12,idp = 2,nmaxidw = 12,hybrid.parameter = 2,lambda = 1,validation = "CV",cv.fold = 10,predacc = "VEcv",...
)
Arguments
model a formula defining the response variable and predictive variables.
longlat a dataframe contains longitude and latitude of point samples.
trainxy a dataframe contains longitude (long), latitude (lat), predictive variables and theresponse variable of point samples. That is, the location information must benames as ’long’ and ’lat’.
y a vector of the response variable in the formula, that is, the left part of the for-mula.
corr.args arguments for ’correlation’ in ’gls’. See ’?corClasses’ in ’nlme’ for details. Bydefault, "NULL" is used. When "NULL" is used, then ’gls’ is actually perform-ing ’lm’.
weights describing the within-group heteroscedasticity structure. Defaults to "NULL",corresponding to homoscedastic errors. See ’?gls’ in ’nlme’ for details.
transformation transform the residuals of ’gls’ to normalise the data for ’krige’; can be "sqrt"for square root, "arcsine" for arcsine, "log" or "none" for non transformation.By default, "none" is used.
delta numeric; to avoid log(0) in the log transformation. The default is 1.
formula.krige formula defining the response vector and (possible) regressor. an object (i.e.,’variogram.formula’) for ’variogram’ or a formula for ’krige’. see ’variogram’and ’krige’ in ’gstat’ for details.

glskrigeidwcv 49
vgm.args arguments for ’vgm’, e.g. variogram model of response variable and anisotropyparameters. see ’vgm’ in ’gstat’ for details. By default, "Sph" is used.
anis anisotropy parameters: see notes ’vgm’ in ’gstat’ for details.alpha direction in plane (x,y). see variogram in ’gstat’ for details.block block size. see ’krige’ in ’gstat’ for details.beta for simple kriging. see ’krige’ in ’gstat’ for details.nmaxkrige for a local predicting: the number of nearest observations that should be used
for a prediction or simulation, where nearest is defined in terms of the space ofthe spatial locations. By default, 12 observations are used.
idp a numeric number specifying the inverse distance weighting power.nmaxidw for a local predicting: the number of nearest observations that should be used
for a prediction or simulation, where nearest is defined in terms of the space ofthe spatial locations. By default, 12 observations are used.
hybrid.parameter
the default is 2 that is for ’glskrigeglsidw’; for ’glsglskrigeglsidw’, it needs tobe 3.
lambda, ranging from 0 to 2; the default is 1 for ’glskrigeglsidw’ and ’glsglskrigeglsidw’;and if it is < 1, more weight is placed on ’krige’, otherwise more weight isplaced on ’idw’; and if it is 0, ’idw’ is not considered and the resultant methodsis ’glskrige’ when the default ’hybrid.parameter’ is used; and if it is 2, then theresultant method is ’glsidw’ when the default ’hybrid.parameter’ is used.
validation validation methods, include ’LOO’: leave-one-out, and ’CV’: cross-validation.cv.fold integer; number of folds in the cross-validation. if > 1, then apply n-fold cross
validation; the default is 10, i.e., 10-fold cross validation that is recommended.predacc can be either "VEcv" for vecv or "ALL" for all measures in function pred.acc.... other arguments passed on to ’gls’, ’krige’ and ’gstat’.
Value
A list with the following components: me, rme, mae, rmae, mse, rmse, rrmse, vecv and e1; or vecvonly.
Note
This function is largely based on rfcv in ’randomForest’, ’krigecv’ in ’spm2’ and ’gls’ in ’li-brary(nlme)’.
Author(s)
Jin Li
References
Pinheiro, J. C. and D. M. Bates (2000). Mixed-Effects Models in S and S-PLUS. New York,Springer.
Pebesma, E.J., 2004. Multivariable geostatistics in S: the gstat package. Computers & Geosciences,30: 683-691.
50 glskrigeidwcv
Examples
library(spm)library(nlme)
data(petrel)gravel <- petrel[, c(1, 2, 6:9, 5)]longlat <- petrel[, c(1, 2)]range1 <- 0.8nugget1 <- 0.5model <- log(gravel + 1) ~ long + lat + bathy + dist + I(long^2) + I(lat^2) +I(lat^3) + I(bathy^2) + I(bathy^3) + I(dist^2) + I(dist^3) + I(relief^2) + I(relief^3)
glskrigeidwcv1 <- glskrigeidwcv(model = model, longlat = longlat, trainxy = gravel,y = log(gravel[, 7] +1), transformation = "none", formula.krige = res1 ~ 1,vgm.args = "Sph", nmaxkrige = 12, idp = 2, nmaxidw = 12, validation = "CV",corr.args = corSpher(c(range1, nugget1), form = ~ lat + long, nugget = T),predacc = "ALL")
glskrigeidwcv1
# For glskrigeglsidwset.seed(1234)n <- 20 # number of iterations,60 to 100 is recommended.VEcv <- NULLfor (i in 1:n) {glskrigeidwcv1 <- glskrigeidwcv(model = model, longlat = longlat, trainxy = gravel,y = log(gravel[, 7] +1), transformation = "none", formula.krige = res1 ~ 1,vgm.args = "Sph", nmaxkrige = 12, idp = 2, nmaxidw = 12, validation = "CV",corr.args = corSpher(c(range1, nugget1), form = ~ lat + long, nugget = T),predacc = "VEcv")
VEcv [i] <- glskrigeidwcv1}plot(VEcv ~ c(1:n), xlab = "Iteration for GLSOKGLSIDW", ylab = "VEcv (%)")points(cumsum(VEcv) / c(1:n) ~ c(1:n), col = 2)abline(h = mean(VEcv), col = 'blue', lwd = 2)
# For glsglskrigeglsidwset.seed(1234)n <- 20 # number of iterations,60 to 100 is recommended.VEcv <- NULLfor (i in 1:n) {glskrigeidwcv1 <- glskrigeidwcv(model = model, longlat = longlat, trainxy = gravel,y = log(gravel[, 7] +1), transformation = "none", formula.krige = res1 ~ 1,vgm.args = "Sph", nmaxkrige = 12, idp = 2, nmaxidw = 12, hybrid.parameter = 3,validation = "CV", corr.args = corSpher(c(range1, nugget1), form = ~ lat + long,nugget = T), predacc = "VEcv")
VEcv [i] <- glskrigeidwcv1}plot(VEcv ~ c(1:n), xlab = "Iteration for GLSOKGLSIDW", ylab = "VEcv (%)")points(cumsum(VEcv) / c(1:n) ~ c(1:n), col = 2)abline(h = mean(VEcv), col = 'blue', lwd = 2)

glskrigeidwpred 51
glskrigeidwpred Generate spatial predictions using the hybrid methods of generalisedleast squares (’gls’), ’kriging’ and inverse distance weighted (’IDW’)
Description
This function is for generating spatial predictions using the hybrid methods of ’gls’, ’kriging’ and’IDW’, including all methods implemented in ’glskrigeidwcv’.
Usage
glskrigeidwpred(model = var1 ~ 1,longlat,trainxy,predx,y,longlatpredx,corr.args = NULL,weights = NULL,transformation = "none",delta = 1,formula.krige = res1 ~ 1,vgm.args = c("Sph"),anis = c(0, 1),alpha = 0,block = 0,beta,nmaxkrige = 12,idp = 2,nmaxidw = 12,hybrid.parameter = 2,lambda = 1,...
)
Arguments
model a formula defining the response variable and predictive variables.
longlat a dataframe contains longitude and latitude of point samples.
trainxy a dataframe contains longitude (long), latitude (lat), predictive variables and theresponse variable of point samples. That is, the location information must benames as ’long’ and ’lat’.

52 glskrigeidwpred
predx a dataframe or matrix contains columns of predictive variables for the grids tobe predicted.
y a vector of the response variable in the formula, that is, the left part of the for-mula.
longlatpredx a dataframe contains longitude and latitude of point locations (i.e., the centersof grids) to be predicted. The location information must be named as ’long’ and’lat’.
corr.args arguments for ’correlation’ in ’gls’. See ’?corClasses’ in ’nlme’ for details. Bydefault, "NULL" is used. When "NULL" is used, then ’gls’ is actually perform-ing ’lm’.
weights describing the within-group heteroscedasticity structure. Defaults to "NULL",corresponding to homoscedastic errors. See ’?gls’ in ’nlme’ for details.
transformation transform the residuals of ’gls’ to normalise the data for ’krige’; can be "sqrt"for square root, "arcsine" for arcsine, "log" or "none" for non transformation.By default, "none" is used.
delta numeric; to avoid log(0) in the log transformation. The default is 1.formula.krige formula defining the response vector and (possible) regressor. an object (i.e.,
’variogram.formula’) for ’variogram’ or a formula for ’krige’. see ’variogram’and ’krige’ in ’gstat’ for details.
vgm.args arguments for ’vgm’, e.g. variogram model of response variable and anisotropyparameters. see ’vgm’ in ’gstat’ for details. By default, "Sph" is used.
anis anisotropy parameters: see notes ’vgm’ in ’gstat’ for details.alpha direction in plane (x,y). see variogram in ’gstat’ for details.block block size. see ’krige’ in ’gstat’ for details.beta for simple kriging. see ’krige’ in ’gstat’ for details.nmaxkrige for a local predicting: the number of nearest observations that should be used
for a prediction or simulation, where nearest is defined in terms of the space ofthe spatial locations. By default, 12 observations are used.
idp a numeric number specifying the inverse distance weighting power.nmaxidw for a local predicting: the number of nearest observations that should be used
for a prediction or simulation, where nearest is defined in terms of the space ofthe spatial locations. By default, 12 observations are used.
hybrid.parameter
the default is 2 that is for ’glskrigeglsidw’; for ’glsglskrigeglsidw’, it needs tobe 3.
lambda, ranging from 0 to 2; the default is 1 for ’glskrigeglsidw’ and ’glsglskrigeglsidw’;and if it is < 1, more weight is placed on ’krige’, otherwise more weight isplaced on ’idw’; and if it is 0, ’idw’ is not considered and the resultant methodsis ’glskrige’ when the default ’hybrid.parameter’ is used; and if it is 2, then theresultant method is ’glsidw’ when the default ’hybrid.parameter’ is used.
... other arguments passed on to ’gls’, ’krige’ and ’gstat’.
Value
A dataframe of longitude, latitude, and predictions.

glskrigepred 53
Author(s)
Jin Li
References
Pinheiro, J. C. and D. M. Bates (2000). Mixed-Effects Models in S and S-PLUS. New York,Springer.
Pebesma, E.J., 2004. Multivariable geostatistics in S: the gstat package. Computers & Geosciences,30: 683-691.
Examples
library(spm)library(nlme)
data(petrel)data(petrel.grid)
gravel <- petrel[, c(1, 2, 6:9, 5)]longlat <- petrel[, c(1, 2)]range1 <- 0.8nugget1 <- 0.5model <- log(gravel + 1) ~ long + lat + bathy + dist + I(long^2) + I(lat^2) +I(lat^3) + I(bathy^2) + I(bathy^3) + I(dist^2) + I(dist^3) + I(relief^2) + I(relief^3)y <- log(gravel[, 7] +1)
glskrigeidwpred1 <- glskrigeidwpred(model = model, longlat = longlat, trainxy = gravel,predx = petrel.grid, y = y, longlatpredx = petrel.grid[, c(1:2)],transformation = "none", formula.krige = res1 ~ 1, vgm.args = "Sph", nmaxkrige = 12,idp = 2, nmaxidw = 12, corr.args = corSpher(c(range1, nugget1),form = ~ lat + long, nugget = T))
names(glskrigeidwpred1)
# Back transform 'glskrigeidwpred$predictions' to generate the final predictionsglskrigeidw.predictions <- exp(glskrigeidwpred1$predictions) - 1range(glskrigeidw.predictions)
glskrigepred Generate spatial predictions using the hybrid method of generalizedleast squares (’gls’) and kriging (’krige’) (’glskrige’)
Description
This function is for generating spatial predictions using the hybrid method of ’gls’ and ’krige’(glskrige).

54 glskrigepred
Usage
glskrigepred(model = var1 ~ 1,longlat,trainxy,predx,y,longlatpredx,corr.args = NULL,weights = NULL,transformation = "none",delta = 1,formula.krige = res1 ~ 1,vgm.args = c("Sph"),anis = c(0, 1),alpha = 0,block = 0,beta,nmaxkrige = 12,...
)
Arguments
model a formula defining the response variable and predictive variables.
longlat a dataframe contains longitude and latitude of point samples.
trainxy a dataframe contains longitude (long), latitude (lat), predictive variables and theresponse variable of point samples. That is, the location information must benames as ’long’ and ’lat’.
predx a dataframe or matrix contains columns of predictive variables for the grids tobe predicted.
y a vector of the response variable in the formula, that is, the left part of the for-mula.
longlatpredx a dataframe contains longitude and latitude of point locations (i.e., the centersof grids) to be predicted. The location information must be named as ’long’ and’lat’.
corr.args arguments for ’correlation’ in ’gls’. See ’?corClasses’ in ’nlme’ for details. Bydefault, "NULL" is used. When "NULL" is used, then ’gls’ is actually perform-ing ’lm’.
weights describing the within-group heteroscedasticity structure. Defaults to "NULL",corresponding to homoscedastic errors. See ’?gls’ in ’nlme’ for details.
transformation transform the residuals of ’gls’ to normalize the data; can be "sqrt" for squareroot, "arcsine" for arcsine, "log" or "none" for non transformation. By default,"none" is used.
delta numeric; to avoid log(0) in the log transformation. The default is 1.

glskrigepred 55
formula.krige formula defining the response vector and (possible) regressor. an object (i.e.,’variogram.formula’) for ’variogram’ or a formula for ’krige’. see ’variogram’and ’krige’ in ’gstat’ for details.
vgm.args arguments for ’vgm’, e.g. variogram model of response variable and anisotropyparameters. see ’vgm’ in ’gstat’ for details. By default, "Sph" is used.
anis anisotropy parameters: see notes ’vgm’ in ’gstat’ for details.
alpha direction in plane (x,y). see variogram in ’gstat’ for details.
block block size. see ’krige’ in ’gstat’ for details.
beta for simple kriging. see ’krige’ in ’gstat’ for details.
nmaxkrige for a local predicting: the number of nearest observations that should be usedfor a prediction or simulation, where nearest is defined in terms of the space ofthe spatial locations. By default, 12 observations are used.
... other arguments passed on to ’gls’ and ’krige’.
Value
A dataframe of longitude, latitude, and predictions.
Author(s)
Jin Li
References
Pinheiro, J. C. and D. M. Bates (2000). Mixed-Effects Models in S and S-PLUS. New York,Springer.
Pebesma, E.J., 2004. Multivariable geostatistics in S: the gstat package. Computers & Geosciences,30: 683-691.
Examples
library(spm)library(nlme)
data(petrel)data(petrel.grid)
gravel <- petrel[, c(1, 2, 6:9, 5)]longlat <- petrel[, c(1, 2)]range1 <- 0.8nugget1 <- 0.5model <- log(gravel + 1) ~ long + lat + bathy + dist + I(long^2) + I(lat^2) +I(lat^3) + I(bathy^2) + I(bathy^3) + I(dist^2) + I(dist^3) + I(relief^2) + I(relief^3)y <- log(gravel[, 7] +1)
glskrigepred1 <- glskrigepred(model = model, longlat = longlat, trainxy = gravel,predx = petrel.grid, y = y, longlatpredx = petrel.grid[, c(1:2)],

56 glspred
transformation = "none", formula.krige = res1 ~ 1,vgm.args = "Sph", nmaxkrige = 12, corr.args = corSpher(c(range1, nugget1),form = ~ lat + long, nugget = T))
names(glskrigepred1)
# Back transform 'glskrigepred$predictions' to generate the final predictionsglskrige.predictions <- exp(glskrigepred1$predictions) - 1range(glskrige.predictions)
glspred Generate spatial predictions using generalized least squares (’gls’)
Description
This function is for generating spatial predictions using ’gls’ method in ’nlme’ package.
Usage
glspred(model = var1 ~ 1,trainxy,longlatpredx,predx,corr.args = NULL,weights = NULL,...
)
Arguments
model a formula defining the response variable and predictive variables.
trainxy a dataframe contains longitude (long), latitude (lat), predictive variables and theresponse variable of point samples. That is, the location information must benames as ’long’ and ’lat’.
longlatpredx a dataframe contains longitude and latitude of point locations (i.e., the centersof grids) to be predicted, need to be named as ’long’ and ’lat’.
predx a dataframe or matrix contains columns of predictive variables for the grids tobe predicted.
corr.args arguments for ’correlation’ in ’gls’. See ’?corClasses’ in ’nlme’ for details. Bydefault, "NULL" is used. When "NULL" is used, then ’gls’ is actually perform-ing ’lm’.
weights describing the within-group heteroscedasticity structure. Defaults to "NULL",corresponding to homoscedastic errors. See ’?gls’ in ’nlme’ for details.
... other arguments passed on to ’gls’.

krigecv 57
Value
A dataframe of longitude, latitude and predictions.
Author(s)
Jin Li
References
Pinheiro, J. C. and D. M. Bates (2000). Mixed-Effects Models in S and S-PLUS. New York,Springer.
Examples
library(spm)library(nlme)
data(petrel)data(petrel.grid)
gravel <- petrel[, c(1, 2, 6:9, 5)]range1 <- 0.8nugget1 <- 0.5model <- log(gravel + 1) ~ long + lat + bathy + dist + I(long^2) + I(lat^2)+ I(lat^3) + I(bathy^2) + I(bathy^3) + I(dist^2) + I(dist^3) + I(relief^2) + I(relief^3)
glspred1 <- glspred(model = model, trainxy = gravel,longlatpredx = petrel.grid[, c(1:2)], predx = petrel.grid,corr.args = corSpher(c(range1, nugget1), form = ~ lat + long, nugget = T))
names(glspred1)
# Back transform 'glspred1$predictions' to generate the final predictionsgls.predictions <- exp(glspred1$predictions) - 1range(gls.predictions)
krigecv Cross validation, n-fold and leave-one-out for kriging methods(’krige’)
Description
This function is a cross validation function for kriging methods (’krige’) in ’gstat’.
58 krigecv
Usage
krigecv(longlat,trainy,trainpredx = NULL,validation = "CV",cv.fold = 10,nmax = 12,transformation = "none",delta = 1,formula = var1 ~ 1,vgm.args = ("Sph"),anis = c(0, 1),alpha = 0,block = 0,beta,predacc = "VEcv",...
)
Arguments
longlat a dataframe contains longitude and latitude of point samples.
trainy a vector of response, must have length equal to the number of rows in trainx.
trainpredx a dataframe contains predictive variables of point samples. If longitude andlatitude are going to be used as predictive variables, they should also be includedbut they should be named in names other than ’long’ and ’lat’.
validation validation methods, include ’LOO’: leave-one-out, and ’CV’: cross-validation.
cv.fold integer; number of folds in the cross-validation. if > 1, then apply n-fold crossvalidation; the default is 10, i.e., 10-fold cross validation that is recommended.
nmax for local kriging: the number of nearest observations that should be used for akriging prediction or simulation, where nearest is defined in terms of the spaceof the spatial locations. By default, 12 observations are used.
transformation transform response variable to normalise the data; can be "sqrt" for square root,"arcsine" for arcsine, "log" or "none" for non transformation. By default, "none"is used.
delta numeric; to avoid ’log(0)’ in "log" transformation. The default is 1.
formula formula defining response vector and (possible) regressor. an object (i.e., ’var-iogram.formula’) for ’variogram’ or a formula for ’krige’. see ’variogram’ and’krige’ in the ’gstat’ package for details.
vgm.args arguments for ’vgm’, e.g. variogram model of response variable and anisotropyparameters. see ’vgm’ in the ’gstat’ package for details. By default, "Sph" isused.
anis anisotropy parameters: see notes ’vgm’ in the ’gstat’ package for details.
alpha direction in plane (x,y). see variogram in the ’gstat’ package for details.
krigecv 59
block block size. see ’krige’ in the ’gstat’ package for details.
beta for simple kriging. see ’krige’ in the ’gstat’ package for details.
predacc can be either "VEcv" for vecv or "ALL" for all measures in function pred.acc.
... other arguments passed on to the function ’gstat’.
Value
A list with the following components: me, rme, mae, rmae, mse, rmse, rrmse, vecv and e1; or vecvonly
Note
This function is largely based on rfcv in ’randomForest’ and some functions in ’library(gstat)’.When ’A zero or negative range was fitted to variogram’ occurs, to allow ’gstat’ running, the rangewas set to be positive by using ’min(vgm1$dist)’. In this case, caution should be taken in applyingthis method. If it still occurs for ’okpred’ function, different method may need to be used.
Author(s)
Jin Li
References
Li, J., 2013. Predictive Modelling Using Random Forest and Its Hybrid Methods with GeostatisticalTechniques in Marine Environmental Geosciences, In: Christen, P., Kennedy, P., Liu, L., Ong,K.-L., Stranieri, A., Zhao, Y. (Eds.), The proceedings of the Eleventh Australasian Data MiningConference (AusDM 2013), Canberra, Australia, 13-15 November 2013. Conferences in Researchand Practice in Information Technology, Vol. 146.
A. Liaw and M. Wiener (2002). Classification and Regression by randomForest. R News 2(3),18-22.
Pebesma, E.J., 2004. Multivariable geostatistics in S: the gstat package. Computers & Geosciences,30: 683-691.
Examples
library(sp)library(spm)data(swmud)data(petrel)
set.seed(1234)okcv1 <- krigecv(longlat = swmud[, c(1,2)], trainy = swmud[, 3], nmax = 7, transformation ="arcsine", vgm.args = ("Sph"), predacc = "VEcv")okcv1
set.seed(1234)skcv1 <- krigecv(longlat = swmud[, c(1,2)], trainy = swmud[, 3], nmax = 7, transformation ="arcsine", vgm.args = ("Sph"), predacc = "VEcv", beta = mean(swmud[, 3]))

60 krigepred
skcv1
set.seed(1234)ukcv1 <- krigecv(longlat = swmud[, c(1,2)], trainy = swmud[, 3], nmax = 7, transformation ="arcsine", formula = var1 ~ long + lat, vgm.args = ("Sph"), predacc = "VEcv")ukcv1
set.seed(1234)okcv2 <- krigecv(longlat = swmud[, c(1,2)], trainy = swmud[, 3], validation = "LOO", nmax = 7,transformation = "arcsine", vgm.args = ("Sph"), predacc = "ALL")okcv2
set.seed(1234)n <- 20 # number of iterations,60 to 100 is recommended.VEcv <- NULLfor (i in 1:n) {okcv1 <- krigecv(longlat = petrel[, c(1,2)], trainy = petrel[, 5], nmax = 12,transformation = "arcsine", predacc = "VEcv")VEcv [i] <- okcv1}plot(VEcv ~ c(1:n), xlab = "Iteration for OK", ylab = "VEcv (%)")points(cumsum(VEcv) / c(1:n) ~ c(1:n), col = 2)abline(h = mean(VEcv), col = 'blue', lwd = 2)
set.seed(1234)n <- 20 # number of iterations, 60 to 100 is recommended.measures <- NULLfor (i in 1:n) {okcv1 <- krigecv(longlat = petrel[, c(1,2)], trainy = petrel[, 3], nmax = 12, transformation ="arcsine", predacc = "ALL")measures <- rbind(measures, okcv1$vecv)}plot(measures ~ c(1:n), xlab = "Iteration for OK", ylab = "VEcv (%)")points(cumsum(measures) / c(1:n) ~ c(1:n), col = 2)abline(h = mean(measures), col = 'blue', lwd = 2)
krigepred Generate spatial predictions using kriging methods (’krige’)
Description
This function is to make spatial predictions using kriging methods (’krige’).
Usage
krigepred(trainx,trainy,

krigepred 61
trainx2,nmax = 12,transformation = "none",delta = 1,formula = var1 ~ 1,vgm.args = ("Sph"),anis = c(0, 1),alpha = 0,block = 0,beta,...
)
Arguments
trainx a dataframe contains longitude (long), latitude (lat) and predictive variables ofpoint samples. The location information must be named as ’long’ and ’lat’.
trainy a vector of response, must have length equal to the number of rows in trainx.
trainx2 a dataframe contains longitude (long), latitude (lat) and predictive variables ofpoint locations (i.e., the centres of grids) to be predicted. The location informa-tion must be named as ’long’ and ’lat’ and in the first two columns respectively..
nmax for local kriging: the number of nearest observations that should be used for akriging prediction or simulation, where nearest is defined in terms of the spaceof the spatial locations. By default, 12 observations are used.
transformation transform the response variable to normalise the data; can be "sqrt" for squareroot, "arcsine" for arcsine, "log" or "none" for non transformation. By default,"none" is used.
delta numeric; to avoid log(0) in the log transformation.
formula formula defining the response vector and (possible) regressor. an object (i.e.,’variogram.formula’) for ’variogram’ or a formula for ’krige’. see ’variogram’and ’krige’ in gstat for details.
vgm.args arguments for vgm, e.g. variogram model of response variable and anisotropyparameters. see notes vgm in gstat for details. By default, "Sph" is used.
anis anisotropy parameters: see notes vgm in gstat for details.
alpha direction in plane (x,y). see variogram in gstat for details.
block block size. see krige in gstat for details.
beta for simple kriging. see krige in gstat for details.
... other arguments passed on to gstat.
Value
A dataframe of longitude, latitude, predictions and variances.
62 rfkrigeidwcv
Note
The variances in the output are not transformed back when a transformation is used. This is becausekriging variances are not measuring the uncertainty of predictions but they are indicator of thespatial distribution of sample density. The variances are exported only for interested users; and ifneeded, they can be transformed back from the output.
Author(s)
Jin Li
References
Pebesma, E.J., 2004. Multivariable geostatistics in S: the gstat package. Computers & Geosciences,30: 683-691.
Examples
library(sp)library(spm)data(swmud)data(sw)okpred1 <- krigepred(swmud[, c(1,2)], swmud[, 3], sw, nmax = 7, transformation ="arcsine", vgm.args = ("Sph"))names(okpred1)
rfkrigeidwcv Cross validation, n-fold and leave-one-out for the hybrid methodsof ’random forest’ (’RF’), ’kriging’ and inverse distance weighted(’IDW’)
Description
This function is a cross validation function for 38 hybrid methods of ’RF’, ’kriging’ and ’IDW’,including the average of ’rfkrige’ and ’rfidw’ (’rfkrigerfidw’) and the average of ’rf’, ’rfkrige’ and’rfidw’ (’rfrfkrigerfidw’), where ’kriging’ methods include ordinary kriging (’OK’), simple kriging(’SK’), block ’OK’ (’BOK’) and block ’SK’(’BSK’) and ’IDW’ also covers ’NN’ and ’KNN’..The data splitting is based on a stratified random sampling method (see the ’datasplit’ function fordetails).
Usage
rfkrigeidwcv(longlat,trainx,trainy,

rfkrigeidwcv 63
mtry = function(p) max(1, floor(sqrt(p))),ntree = 500,transformation = "none",delta = 1,formula = res1 ~ 1,vgm.args = c("Sph"),anis = c(0, 1),alpha = 0,block = 0,beta,nmaxkrige = 12,idp = 2,nmaxidw = 12,hybrid.parameter = 2,lambda = 1,validation = "CV",cv.fold = 10,predacc = "VEcv",...
)
Arguments
longlat a dataframe contains longitude and latitude of point samples.trainx a dataframe or matrix contains columns of predictive variables.trainy a vector of the response variable.mtry a function of number of remaining predictor variables to use as the ’mtry’ pa-
rameter in the ’randomForest’ call.ntree number of trees to grow. This should not be set to too small a number, to ensure
that every input row gets predicted at least a few times. By default, 500 is used.transformation transform the residuals of ’rf’ to normalize the data for ’krige’; can be "sqrt" for
square root, "arcsine" for arcsine, "log" or "none" for non transformation. Bydefault, "none" is used.
delta numeric; to avoid log(0) in the log transformation. The default is 1.formula formula defining the response vector and (possible) regressor. an object (i.e.,
’variogram.formula’) for ’variogram’ or a formula for ’krige’. see ’variogram’and ’krige’ in ’gstat’ for details.
vgm.args arguments for ’vgm’, e.g. variogram model of response variable and anisotropyparameters. see ’vgm’ in ’gstat’ for details. By default, "Sph" is used.
anis anisotropy parameters: see notes ’vgm’ in ’gstat’ for details.alpha direction in plane (x,y). see variogram in ’gstat’ for details.block block size. see ’krige’ in ’gstat’ for details.beta for simple kriging. see ’krige’ in ’gstat’ for details.nmaxkrige for a local predicting: the number of nearest observations that should be used
for a prediction or simulation, where nearest is defined in terms of the space ofthe spatial locations. By default, 12 observations are used.

64 rfkrigeidwcv
idp a numeric number specifying the inverse distance weighting power.
nmaxidw for a local predicting: the number of nearest observations that should be usedfor a prediction or simulation, where nearest is defined in terms of the space ofthe spatial locations. By default, 12 observations are used.
hybrid.parameter
the default is 2 that is for ’rfkrigerfidw’; for ’rfrfkrigerfidw’, it needs to be 3.
lambda, ranging from 0 to 2; the default is 1 for ’rfkrigerfidw’ and ’rfrfkrigerfidw’; andif it is < 1, more weight is placed on ’krige’, otherwise more weight is placed on’idw’; and if it is 0, ’idw’ is not considered and the resultant methods is ’rfkrige’when the default ’hybrid.parameter’ is used; and if it is 2, then the resultantmethod is ’rfidw’ when the default ’hybrid.parameter’ is used.
validation validation methods, include ’LOO’: leave-one-out, and ’CV’: cross-validation.
cv.fold integer; number of folds in the cross-validation. if > 1, then apply n-fold crossvalidation; the default is 10, i.e., 10-fold cross validation that is recommended.
predacc can be either "VEcv" for vecv or "ALL" for all measures in function pred.acc.
... other arguments passed on to ’randomForest’, ’krige’ and ’gstat’.
Value
A list with the following components: me, rme, mae, rmae, mse, rmse, rrmse, vecv and e1; or vecvonly
Note
This function is largely based on ’rfcv’ in ’randomForest’, and ’krigecv’ in ’spm2’.
Author(s)
Jin Li
References
Li, J., Potter, A., Huang, Z., and Heap, A. (2012). Predicting Seabed Sand Content across the Aus-tralian Margin Using Machine Learning and Geostatistical Methods, Geoscience Australia, Record2012/48, 115pp.
Li, J., Heap, A., Potter, A., and Danilel, J.J. (2011). Predicting Seabed Mud Content across theAustralian Margin II: Performance of Machine Learning Methods and Their Combination withOrdinary Kriging and Inverse Distance Squared, Geoscience Australia, Record 2011/07, 69pp.
Liaw, A. and M. Wiener (2002). Classification and Regression by randomForest. R News 2(3),18-22.
Pebesma, E.J., 2004. Multivariable geostatistics in S: the gstat package. Computers & Geosciences,30: 683-691.

rfkrigeidwpred 65
Examples
library(spm)# rfrfokrfidwdata(sponge)longlat <- sponge[, 1:2]set.seed(1234)rfrfkrigerfidwcv1 <- rfkrigeidwcv(longlat = longlat,trainx = sponge[, -3], trainy = sponge[, 3], formula = res1 ~ 1, vgm.args = ("Sph"),nmaxkrige = 12, idp = 2, nmaxidw = 12, hybrid.parameter = 3, validation = "CV",predacc = "ALL")rfrfkrigerfidwcv1
# rfokrfidw for count datadata(sponge)longlat <- sponge2[, 1:2]y = sponge[, 3]trainx = sponge[, -3]set.seed(1234)n <- 20 # number of iterations,60 to 100 is recommended.VEcv <- NULLfor (i in 1:n) {rfkrigerfidwcv1 <- rfkrigeidwcv(longlat = longlat,trainx = trainx, trainy = y, formula = res1 ~ 1, vgm.args = ("Sph"),nmaxkrige = 12, idp = 2, nmaxidw = 12, validation = "CV", predacc = "VEcv")VEcv [i] <- rfkrigerfidwcv1}plot(VEcv ~ c(1:n), xlab = "Iteration for rfokrfidw", ylab = "VEcv (%)")points(cumsum(VEcv) / c(1:n) ~ c(1:n), col = 2)abline(h = mean(VEcv), col = 'blue', lwd = 2)
rfkrigeidwpred Generate spatial predictions using the hybrid methods of ’random for-est’ (’RF’), ’kriging’ and inverse distance weighted (’IDW’).
Description
This function is for generating spatial predictions using the hybrid methods of ’RF’, ’kriging’ and’IDW’, including all methods implemented in ’rfkrigeidwcv’.
Usage
rfkrigeidwpred(longlat,trainx,predx,trainy,
66 rfkrigeidwpred
longlatpredx,mtry = function(p) max(1, floor(sqrt(p))),ntree = 500,transformation = "none",delta = 1,formula.krige = res1 ~ 1,vgm.args = c("Sph"),anis = c(0, 1),alpha = 0,block = 0,beta,nmaxkrige = 12,idp = 2,nmaxidw = 12,hybrid.parameter = 2,lambda = 1,...
)
Arguments
longlat a dataframe contains longitude and latitude of point samples.
trainx a dataframe contains longitude (long), latitude (lat), predictive variables and theresponse variable of point samples. That is, the location information must benamed as ’long’ and ’lat’.
predx a dataframe or matrix contains columns of predictive variables for the grids tobe predicted.
trainy a vector of the response variable in the formula, that is, the left part of the for-mula.
longlatpredx a dataframe contains longitude and latitude of point locations (i.e., the centersof grids) to be predicted.
mtry a function of number of remaining predictor variables to use as the ’mtry’ pa-rameter in the ’randomForest’ call.
ntree number of trees to grow. This should not be set to too small a number, to ensurethat every input row gets predicted at least a few times. By default, 500 is used.#’ @param longlatpredx a dataframe contains longitude and latitude of pointlocations (i.e., the centers of grids) to be predicted. The location informationmust be named as ’long’ and ’lat’.
transformation transform the residuals of ’rf’ to normalise the data; can be "sqrt" for squareroot, "arcsine" for arcsine, "log" or "none" for non transformation. By default,"none" is used.
delta numeric; to avoid log(0) in the log transformation. The default is 1.
formula.krige formula defining the response vector and (possible) regressor. an object (i.e.,’variogram.formula’) for ’variogram’ or a formula for ’krige’. see ’variogram’and ’krige’ in ’gstat’ for details.

rfkrigeidwpred 67
vgm.args arguments for ’vgm’, e.g. variogram model of response variable and anisotropyparameters. see ’vgm’ in ’gstat’ for details. By default, "Sph" is used.
anis anisotropy parameters: see notes ’vgm’ in ’gstat’ for details.
alpha direction in plane (x,y). see variogram in ’gstat’ for details.
block block size. see ’krige’ in ’gstat’ for details.
beta for simple kriging. see ’krige’ in ’gstat’ for details.
nmaxkrige for a local predicting: the number of nearest observations that should be usedfor a prediction or simulation, where nearest is defined in terms of the space ofthe spatial locations. By default, 12 observations are used.
idp a numeric number specifying the inverse distance weighting power.
nmaxidw for a local predicting: the number of nearest observations that should be usedfor a prediction or simulation, where nearest is defined in terms of the space ofthe spatial locations. By default, 12 observations are used.
hybrid.parameter
the default is 2 that is for ’rfkrigerfidw’; for ’rfrfkrigerfidw’, it needs to be 3.
lambda, ranging from 0 to 2; the default is 1 for ’rfkrigerfidw’ and ’rfrfkrigerfidw’; andif it is < 1, more weight is placed on ’krige’, otherwise more weight is placed on’idw’; and if it is 0, ’idw’ is not considered and the resultant methods is ’rfkrige’when the default ’hybrid.parameter’ is used; and if it is 2, then the resultantmethod is ’rfidw’ when the default ’hybrid.parameter’ is used.
... other arguments passed on to ’rf’, ’krige’ and ’gstat’.
Value
A dataframe of longitude, latitude, and predictions.
Author(s)
Jin Li
References
Li, J., Potter, A., Huang, Z., and Heap, A. (2012). Predicting Seabed Sand Content across the Aus-tralian Margin Using Machine Learning and Geostatistical Methods, Geoscience Australia, Record2012/48, 115pp.
Li, J., Heap, A., Potter, A., and Danilel, J.J. (2011). Predicting Seabed Mud Content across theAustralian Margin II: Performance of Machine Learning Methods and Their Combination withOrdinary Kriging and Inverse Distance Squared, Geoscience Australia, Record 2011/07, 69pp.
Liaw, A. and M. Wiener (2002). Classification and Regression by randomForest. R News 2(3),18-22.
Pebesma, E.J., 2004. Multivariable geostatistics in S: the gstat package. Computers & Geosciences,30: 683-691.

68 sponge2
Examples
library(spm)
data(sponge)data(sponge.grid)longlat <- sponge[, 1:2]y = sponge[, 3]trainx = sponge[, -3]
set.seed(1234)
rfkrigeidwpred1 <- rfkrigeidwpred(longlat = longlat, trainx = trainx,predx = sponge.grid, trainy = y, longlatpredx = sponge.grid[, c(1:2)],formula.krige = res1 ~ 1, vgm.args = "Sph", nmaxkrige = 12, idp = 2, nmaxidw = 12)
names(rfkrigeidwpred1)
range(rfkrigeidwpred1$predictions)
sponge2 A dataset of sponge species richness in the Timor Sea region, northernAustralia marine margin
Description
This dataset contains 77 samples of 81 variables including easting (longitude), northing (latitude),bathy, backscatter and their derived variables.
Usage
data("sponge2")
Format
A data frame with 77 observations on the following 89 variables.
easting a numeric vector, m
northing a numeric vector, m
species.richness a numeric vector, no unit
mud a numeric vector, percentage
sand a numeric vector, percentage
gravel a numeric vector, percentage
bathy a numeric vector, m

sponge2 69
bs25 a numeric vector, dB
bs10 a numeric vector, dB
bs11 a numeric vector, dB
bs12 a numeric vector, dB
bs13 a numeric vector, dB
bs14 a numeric vector, dB
bs15 a numeric vector, dB
bs16 a numeric vector, dB
bs17 a numeric vector, dB
bs18 a numeric vector, dB
bs19 a numeric vector, dB
bs20 a numeric vector, dB
bs21 a numeric vector, dB
bs22 a numeric vector, dB
bs23 a numeric vector, dB
bs24 a numeric vector, dB
bs26 a numeric vector, dB
bs27 a numeric vector, dB
bs28 a numeric vector, dB
bs29 a numeric vector, dB
bs30 a numeric vector, dB
bs31 a numeric vector, dB
bs32 a numeric vector, dB
bs33 a numeric vector, dB
bs34 a numeric vector, dB
bs35 a numeric vector, dB
bs36 a numeric vector, dB
bs_o a numeric vector, dB
bs_homo_o a numeric vector
bs_entro_o a numeric vector, no unit
bs_var_o a numeric vector, dB^2
bs_lmi_o a numeric vector
bathy_o a numeric vector, m
bathy_lmi_o a numeric vector
tpi_o a numeric vector, no unit
slope_o a numeric vector
plan_cur_o a numeric vector

70 sponge2
prof_cur_o a numeric vector
relief_o a numeric vector
rugosity_o a numeric vector
dist.coast a numeric vector, m
rugosity3 a numeric vector
rugosity5 a numeric vector
rugosity7 a numeric vector
tpi3 a numeric vector, no unit
tpi5 a numeric vector, no unit
tpi7 a numeric vector, no unit
bathy_lmi3 a numeric vector
bathy_lmi5 a numeric vector
bathy_lmi7 a numeric vector
plan_curv3 a numeric vector
plan_curv5 a numeric vector
plan_curv7 a numeric vector
relief_3 a numeric vector
relief_5 a numeric vector
relief_7 a numeric vector
slope3 a numeric vector
slope5 a numeric vector
slope7 a numeric vector
prof_cur3 a numeric vector
prof_cur5 a numeric vector
prof_cur7 a numeric vector
entro3 a numeric vector, no unit
entro5 a numeric vector, no unit
entro7 a numeric vector, no unit
homo3 a numeric vector
homo5 a numeric vector
homo7 a numeric vector
var3 a numeric vector, dB^2
var5 a numeric vector, dB^2
var7 a numeric vector, dB^2
bs_lmi3 a numeric vector
bs_lmi5 a numeric vector
bs_lmi7 a numeric vector

spongelonglat 71
Details
For details, please see the source. This dataset was published as an appendix of the paper listed inthe source. Where the long and lat were reprojected to easting and northing.
Source
see Appendix A-D. Supplementary data at: "http://dx.doi.org/10.1016/j.envsoft.2017.07.016."
References
Li, J., B. Alvarez, J. Siwabessy, M. Tran, Z. Huang, R. Przeslawski, L. Radke, F. Howard, and S.Nichol. 2017. Application of random forest, generalised linear model and their hybrid methodswith geostatistical techniques to count data: Predicting sponge species richness. EnvironmentalModelling & Software, 97: 112-129.
spongelonglat A dataset of sponge species richness in the Timor Sea region, northernAustralia marine margin
Description
This dataset contains 77 samples of 7 predictive variables including longitude, latitude, bathy,backscatter and their derived variables. It is the sponge dataset in ‘spm‘ package, but with longand lat instead of easting and northing.
Usage
data("spongelonglat")
Format
A data frame with 77 observations on the following 8 variables.
sponge a numeric vector
tpi3 a numeric vector
var7 a numeric vector
entro7 a numeric vector
bs34 a numeric vector
bs11 a numeric vector
long a numeric vector
lat a numeric vector
Details
For details, please see sponge dataset in library(spm). Where the long and lat were projected toeasting and northing.

72 svmcv
Source
sponge dataset in library(spm)
References
Li, J., B. Alvarez, J. Siwabessy, M. Tran, Z. Huang, R. Przeslawski, L. Radke, F. Howard, and S.Nichol. 2017. Application of random forest, generalised linear model and their hybrid methodswith geostatistical techniques to count data: Predicting sponge species richness. EnvironmentalModelling & Software, 97: 112-129.
Examples
data(spongelonglat)## maybe str(spongelonglat) ; plot(spongelonglat) ...
svmcv Cross validation, n-fold and leave-one-out for support vector machine(’svm’)
Description
This function is a cross validation function for ’svm’ regression in ’e1071’ package.
Usage
svmcv(formula = NULL,trainxy,y,scale = TRUE,type = NULL,kernel = "radial",degree = 3,gamma = if (is.vector(trainxy)) 1 else 1/ncol(trainxy),coef0 = 0,cost = 1,nu = 0.5,tolerance = 0.001,epsilon = 0.1,validation = "CV",cv.fold = 10,predacc = "VEcv",...
)
svmcv 73
Arguments
formula a formula defining the response variable and predictive variables.
trainxy a dataframe contains predictive variables and the response variable of pointsamples. The location information, longitude (long), latitude (lat), need to beincluded in the ’trainx’ for spatial predictive modelling, need to be named as’long’ and ’lat’.
y a vector of the response variable in the formula, that is, the left part of the for-mula.
scale A logical vector indicating the variables to be scaled (default: TRUE).
type the default setting is ’NULL’. See ’?svm’ for various options.
kernel the default setting is ’radial’. See ’?svm’ for other options.
degree a parameter needed for kernel of type polynomial (default: 3).
gamma a parameter needed for all ’kernels’ except ’linear’ (default: 1/(data dimension)).
coef0 a parameter needed for kernels of type ’polynomial’ and ’sigmoid’(default: 0).
cost cost of constraints violation (default: 1).
nu a parameter needed for ’nu-classification’, ’nu-regression’, and ’one-classification’(default: 0.5).
tolerance tolerance of termination criterion (default: 0.001).
epsilon ’epsilon’ in the insensitive-loss function (default: 0.1).
validation validation methods, include ’LOO’: leave-one-out, and ’CV’: cross-validation.
cv.fold integer; number of folds in the cross-validation. if > 1, then apply n-fold crossvalidation; the default is 10, i.e., 10-fold cross validation that is recommended.
predacc can be either "VEcv" for ’vecv’ or "ALL" for all measures in function pred.acc.
... other arguments passed on to ’svm’.
Value
A list with the following components: me, rme, mae, rmae, mse, rmse, rrmse, vecv and e1; or vecvonly
Note
This function is largely based on ’rfcv’ in ’randomForest’ and ’svm’ in ’e1071’.
Author(s)
Jin Li
References
David Meyer, Evgenia Dimitriadou, Kurt Hornik, Andreas Weingessel and Friedrich Leisch (2020).e1071: Misc Functions of the Department of Statistics, Probability Theory Group (Formerly: E1071),TU Wien. R package version 1.7-4. https://CRAN.R-project.org/package=e1071.

74 svmidwcv
Examples
library(spm)
data(petrel)gravel <- petrel[, c(1, 2, 6:9, 5)]model <- log(gravel + 1) ~ lat + bathy + I(long^3) + I(lat^2) + I(lat^3)set.seed(1234)svmcv1 <- svmcv(formula = model, gravel, log(gravel[, 7] +1), validation = "CV",predacc = "ALL")
svmcv1
data(sponge2)model <- species.richness ~ .set.seed(1234)svmcv1 <- svmcv(formula = model, sponge2[, -4], sponge[, 3], gamma = 0.01, cost = 3.5,scale = TRUE, validation = "CV", predacc = "VEcv")svmcv1
# For svmmodel <- species.richness ~ .set.seed(1234)n <- 20 # number of iterations,60 to 100 is recommended.VEcv <- NULLfor (i in 1:n) {svmcv1 <- svmcv(formula = model, sponge2[, -4], sponge[, 3], gamma = 0.01, cost = 3.5,scale = TRUE, validation = "CV", predacc = "VEcv")VEcv [i] <- svmcv1}plot(VEcv ~ c(1:n), xlab = "Iteration for svm", ylab = "VEcv (%)")points(cumsum(VEcv) / c(1:n) ~ c(1:n), col = 2)abline(h = mean(VEcv), col = 'blue', lwd = 2)
svmidwcv Cross validation, n-fold and leave-one-out for the hybrid methodof support vector machine (’svm’) regression and inverse distanceweighted (’IDW’) (svmidw)
Description
This function is a cross validation function for the hybrid method of ’svm’ regression and ’idw’using ’gstat’ (svmidw), where the data splitting is based on a stratified random sampling method(see the ’datasplit’ function for details).
Usage
svmidwcv(

svmidwcv 75
formula = NULL,longlat,trainxy,y,scale = TRUE,type = NULL,kernel = "radial",degree = 3,gamma = if (is.vector(trainxy)) 1 else 1/ncol(trainxy),coef0 = 0,cost = 1,nu = 0.5,tolerance = 0.001,epsilon = 0.1,idp = 2,nmaxidw = 12,validation = "CV",cv.fold = 10,predacc = "VEcv",...
)
Arguments
formula a formula defining the response variable and predictive variables for ’svm’.
longlat a dataframe contains longitude and latitude of point samples.
trainxy a dataframe contains longitude (long), latitude (lat), predictive variables and theresponse variable of point samples. That is, the location information must benamed as ’long’ and ’lat’.
y a vector of the response variable in the formula, that is, the left part of the for-mula.
scale A logical vector indicating the variables to be scaled (default: TRUE).
type the default setting is ’NULL’. See ’?svm’ for various options.
kernel the default setting is ’radial’. See ’?svm’ for other options.
degree a parameter needed for kernel of type polynomial (default: 3).
gamma a parameter needed for all ’kernels’ except ’linear’ (default: 1/(data dimension)).
coef0 a parameter needed for kernels of type ’polynomial’ and ’sigmoid’(default: 0).
cost cost of constraints violation (default: 1).
nu a parameter needed for ’nu-classification’, ’nu-regression’, and ’one-classification’(default: 0.5).
tolerance tolerance of termination criterion (default: 0.001).
epsilon ’epsilon’ in the insensitive-loss function (default: 0.1).
idp a numeric number specifying the inverse distance weighting power.

76 svmidwcv
nmaxidw for a local predicting: the number of nearest observations that should be usedfor a prediction or simulation, where nearest is defined in terms of the space ofthe spatial locations. By default, 12 observations are used.
validation validation methods, include ’LOO’: leave-one-out, and ’CV’: cross-validation.
cv.fold integer; number of folds in the cross-validation. if > 1, then apply n-fold crossvalidation; the default is 10, i.e., 10-fold cross validation that is recommended.
predacc can be either "VEcv" for ’vecv’ or "ALL" for all measures in function pred.acc.
... other arguments passed on to ’svm’ and ’gstat’.
Value
A list with the following components: me, rme, mae, rmae, mse, rmse, rrmse, vecv and e1; or vecvonly.
Note
This function is largely based on ’rfcv’ in ’randomForest’, ’idwcv’ in ’spm’and ’svm’ in ’e1071’.
Author(s)
Jin Li
References
Li, J., Potter, A., Huang, Z., and Heap, A. (2012). Predicting Seabed Sand Content across the Aus-tralian Margin Using Machine Learning and Geostatistical Methods, Geoscience Australia, Record2012/48, 115pp.
Li, J., Heap, A., Potter, A., and Danilel, J.J. (2011). Predicting Seabed Mud Content across theAustralian Margin II: Performance of Machine Learning Methods and Their Combination withOrdinary Kriging and Inverse Distance Squared, Geoscience Australia, Record 2011/07, 69pp.
David Meyer, Evgenia Dimitriadou, Kurt Hornik, Andreas Weingessel and Friedrich Leisch (2020).e1071: Misc Functions of the Department of Statistics, Probability Theory Group (Formerly: E1071),TU Wien. R package version 1.7-4. https://CRAN.R-project.org/package=e1071.
Pebesma, E.J., 2004. Multivariable geostatistics in S: the gstat package. Computers & Geosciences,30: 683-691.
Examples
library(spm)
data(petrel)gravel <- petrel[, c(1, 2, 6:9, 5)]longlat <- petrel[, c(1, 2)]model <- log(gravel + 1) ~ lat + bathy + I(long^3) + I(lat^2) + I(lat^3)y <- log(gravel[, 7] +1)
set.seed(1234)
svmidwpred 77
svmidwcv1 <- svmidwcv(formula = model, longlat = longlat, trainxy = gravel,y = y, idp = 2, nmaxidw = 12, validation = "CV", predacc = "ALL")svmidwcv1
# svmidw for count datadata(sponge2)model <- species.richness ~ . # use all predictive variables in the datasetlonglat <- sponge2[, 1:2]set.seed(1234)n <- 20 # number of iterations,60 to 100 is recommended.VEcv <- NULLfor (i in 1:n) {svmidwcv1 <- svmidwcv(formula = model, longlat = longlat, trainxy = sponge2[, -4],y = sponge[, 3], gamma = 0.01, cost = 3.5, scale = TRUE, idp = 2, nmaxidw = 12,validation = "CV", predacc = "VEcv")VEcv [i] <- svmidwcv1}plot(VEcv ~ c(1:n), xlab = "Iteration for svmidw", ylab = "VEcv (%)")points(cumsum(VEcv) / c(1:n) ~ c(1:n), col = 2)abline(h = mean(VEcv), col = 'blue', lwd = 2)
svmidwpred Generate spatial predictions using the hybrid method of support vec-tor machine (’svm’) regression and inverse distance weighted (’IDW’)(’svmidw’)
Description
This function is for generating spatial predictions using the hybrid method of ’svm’ and ’idw’(’svmidw’).
Usage
svmidwpred(formula = NULL,longlat,trainxy,y,longlatpredx,predx,scale = TRUE,type = NULL,kernel = "radial",degree = 3,gamma = if (is.vector(trainxy)) 1 else 1/ncol(trainxy),coef0 = 0,cost = 1,

78 svmidwpred
nu = 0.5,tolerance = 0.001,epsilon = 0.1,idp = 2,nmaxidw = 12,...
)
Arguments
formula a formula defining the response variable and predictive variables for ’svm’.
longlat a dataframe contains longitude and latitude of point samples. The location in-formation must be named as ’long’ and ’lat’.
trainxy a dataframe contains longitude (long), latitude (lat), predictive variables and theresponse variable of point samples.
y a vector of the response variable in the formula, that is, the left part of the for-mula.
longlatpredx a dataframe contains longitude and latitude of point locations (i.e., the centersof grids) to be predicted.
predx a dataframe or matrix contains columns of predictive variables for the grids tobe predicted.
scale A logical vector indicating the variables to be scaled (default: TRUE).
type the default setting is ’NULL’. See ’?svm’ for various options.
kernel the default setting is ’radial’. See ’?svm’ for other options.
degree a parameter needed for kernel of type polynomial (default: 3).
gamma a parameter needed for all ’kernels’ except ’linear’ (default: 1/(data dimension)).
coef0 a parameter needed for kernels of type ’polynomial’ and ’sigmoid’(default: 0).
cost cost of constraints violation (default: 1).
nu a parameter needed for ’nu-classification’, ’nu-regression’, and ’one-classification’(default: 0.5).
tolerance tolerance of termination criterion (default: 0.001).
epsilon ’epsilon’ in the insensitive-loss function (default: 0.1). See ’?svm’ for details.
idp a numeric number specifying the inverse distance weighting power.
nmaxidw for a local predicting: the number of nearest observations that should be usedfor a prediction or simulation, where nearest is defined in terms of the space ofthe spatial locations. By default, 12 observations are used.
... other arguments passed on to ’svm’.
Value
A dataframe of longitude, latitude, and predictions.
Author(s)
Jin Li

svmkrigecv 79
References
Li, J., Potter, A., Huang, Z., and Heap, A. (2012). Predicting Seabed Sand Content across the Aus-tralian Margin Using Machine Learning and Geostatistical Methods, Geoscience Australia, Record2012/48, 115pp.
Li, J., Heap, A., Potter, A., and Danilel, J.J. (2011). Predicting Seabed Mud Content across theAustralian Margin II: Performance of Machine Learning Methods and Their Combination withOrdinary Kriging and Inverse Distance Squared, Geoscience Australia, Record 2011/07, 69pp.
David Meyer, Evgenia Dimitriadou, Kurt Hornik, Andreas Weingessel and Friedrich Leisch (2020).e1071: Misc Functions of the Department of Statistics, Probability Theory Group (Formerly: E1071),TU Wien. R package version 1.7-4. https://CRAN.R-project.org/package=e1071.
Pebesma, E.J., 2004. Multivariable geostatistics in S: the gstat package. Computers & Geosciences,30: 683-691.
Examples
library(spm)data(petrel)data(petrel.grid)
gravel <- petrel[, c(1, 2, 6:9, 5)]longlat <- petrel[, c(1, 2)]model <- log(gravel + 1) ~ lat + bathy + I(long^3) + I(lat^2) + I(lat^3)y <- log(gravel[, 7] +1)
svmidwpred1 <- svmidwpred(formula = model, longlat = longlat, trainxy = gravel,y = y, longlatpredx = petrel.grid[, c(1:2)], predx = petrel.grid, idp = 2,nmaxidw = 12)
names(svmidwpred1)
# Back transform 'svmidwpred$predictions' to generate the final predictionssvmidw.predictions <- exp(svmidwpred1$predictions) - 1range(svmidw.predictions)
svmkrigecv Cross validation, n-fold and leave-one-out for the hybrid method ofsupport vector machine (’svm’) regression and ’krige’ (svmkrige)
Description
This function is a cross validation function for the hybrid method of ’svm’ regression and ’krige’(svmkrige), where the data splitting is based on a stratified random sampling method (see the ’datas-plit’ function for details).

80 svmkrigecv
Usage
svmkrigecv(formula.svm = NULL,longlat,trainxy,y,scale = TRUE,type = NULL,kernel = "radial",degree = 3,gamma = if (is.vector(trainxy)) 1 else 1/ncol(trainxy),coef0 = 0,cost = 1,nu = 0.5,tolerance = 0.001,epsilon = 0.1,transformation = "none",delta = 1,formula.krige = res1 ~ 1,vgm.args = c("Sph"),anis = c(0, 1),alpha = 0,block = 0,beta,nmaxkrige = 12,validation = "CV",cv.fold = 10,predacc = "VEcv",...
)
Arguments
formula.svm a formula defining the response variable and predictive variables for ’svm’.
longlat a dataframe contains longitude and latitude of point samples.
trainxy a dataframe contains longitude (long), latitude (lat), predictive variables and theresponse variable of point samples. That is, the location information must benamed as ’long’ and ’lat’.
y a vector of the response variable in the formula.svm, that is, the left part of theformula.svm.
scale A logical vector indicating the variables to be scaled (default: TRUE).
type the default setting is ’NULL’. See ’?svm’ for various options.
kernel the default setting is ’radial’. See ’?svm’ for other options.
degree a parameter needed for kernel of type polynomial (default: 3).
gamma a parameter needed for all ’kernels’ except ’linear’ (default: 1/(data dimension)).
coef0 a parameter needed for kernels of type ’polynomial’ and ’sigmoid’(default: 0).

svmkrigecv 81
cost cost of constraints violation (default: 1).
nu a parameter needed for ’nu-classification’, ’nu-regression’, and ’one-classification’(default: 0.5).
tolerance tolerance of termination criterion (default: 0.001).
epsilon ’epsilon’ in the insensitive-loss function (default: 0.1).
transformation transform the residuals of ’svm’ to normalise the data; can be "sqrt" for squareroot, "arcsine" for arcsine, "log" or "none" for non transformation. By default,"none" is used.
delta numeric; to avoid log(0) in the log transformation. The default is 1.
formula.krige formula defining the response vector and (possible) regressor. an object (i.e.,’variogram.formula’) for ’variogram’ or a formula for ’krige’. see ’variogram’and ’krige’ in ’gstat’ for details.
vgm.args arguments for ’vgm’, e.g. variogram model of response variable and anisotropyparameters. see ’vgm’ in ’gstat’ for details. By default, "Sph" is used.
anis anisotropy parameters: see notes ’vgm’ in ’gstat’ for details.
alpha direction in plane (x,y). see variogram in ’gstat’ for details.
block block size. see ’krige’ in ’gstat’ for details.
beta for simple kriging. see ’krige’ in ’gstat’ for details.
nmaxkrige for a local predicting: the number of nearest observations that should be usedfor a prediction or simulation, where nearest is defined in terms of the space ofthe spatial locations. By default, 12 observations are used.
validation validation methods, include ’LOO’: leave-one-out, and ’CV’: cross-validation.
cv.fold integer; number of folds in the cross-validation. if > 1, then apply n-fold crossvalidation; the default is 10, i.e., 10-fold cross validation that is recommended.
predacc can be either "VEcv" for ’vecv’ or "ALL" for all measures in function pred.acc.
... other arguments passed on to ’svm’ and ’krige’.
Value
A list with the following components: me, rme, mae, rmae, mse, rmse, rrmse, vecv and e1; or vecvonly
Note
This function is largely based on ’rfcv’ in ’randomForest’, ’krigecv’ in ’spm2’and ’svm’ in ’e1071’.
Author(s)
Jin Li

82 svmkrigecv
References
Li, J., Potter, A., Huang, Z., and Heap, A. (2012). Predicting Seabed Sand Content across the Aus-tralian Margin Using Machine Learning and Geostatistical Methods, Geoscience Australia, Record2012/48, 115pp.
Li, J., Heap, A., Potter, A., and Danilel, J.J. (2011). Predicting Seabed Mud Content across theAustralian Margin II: Performance of Machine Learning Methods and Their Combination withOrdinary Kriging and Inverse Distance Squared, Geoscience Australia, Record 2011/07, 69pp.
David Meyer, Evgenia Dimitriadou, Kurt Hornik, Andreas Weingessel and Friedrich Leisch (2020).e1071: Misc Functions of the Department of Statistics, Probability Theory Group (Formerly: E1071),TU Wien. R package version 1.7-4. https://CRAN.R-project.org/package=e1071.
Pebesma, E.J., 2004. Multivariable geostatistics in S: the gstat package. Computers & Geosciences,30: 683-691.
Examples
library(spm)
data(petrel)
gravel <- petrel[, c(1, 2, 6:9, 5)]longlat <- petrel[, c(1, 2)]model <- log(gravel + 1) ~ lat + bathy + I(long^3) + I(lat^2) + I(lat^3)y <- log(gravel[, 7] +1)set.seed(1234)svmkrigecv1 <- svmkrigecv(formula.svm = model, longlat = longlat, trainxy = gravel,y = y, transformation = "none", formula.krige = res1 ~ 1, vgm.args = "Sph",nmaxkrige = 12, validation = "CV", predacc = "ALL")svmkrigecv1
# svmok for count datadata(sponge2)model <- species.richness ~ . # use all predictive variables in the datasetlonglat <- sponge2[, 1:2]set.seed(1234)n <- 20 # number of iterations,60 to 100 is recommended.VEcv <- NULLfor (i in 1:n) {svmkrigecv1 <- svmkrigecv(formula.svm = model, longlat = longlat, trainxy = sponge2[, -4],y = sponge2[, 3], gamma = 0.01, cost = 3.5, scale = TRUE, formula.krige = res1 ~ 1,vgm.args = ("Sph"), nmaxkrige = 12, validation = "CV", predacc = "VEcv")VEcv [i] <- svmkrigecv1}plot(VEcv ~ c(1:n), xlab = "Iteration for svm", ylab = "VEcv (%)")points(cumsum(VEcv) / c(1:n) ~ c(1:n), col = 2)abline(h = mean(VEcv), col = 'blue', lwd = 2)

svmkrigeidwcv 83
svmkrigeidwcv Cross validation, n-fold and leave-one-out for the hybrid methods ofsupport vector machine (’svm’) regression , ’kriging’ and inverse dis-tance weighted (’IDW’).
Description
This function is a cross validation function for 38 hybrid methods of ’svm’, ’kriging’ and ’IDW’,including the average of ’svmkrige’ and ’svmidw’ (’svmkrigesvmidw’) and the average of ’svm’,’svmkrige’ and ’svmidw’ (’svmsvmkrigesvmidw’), where ’kriging’ methods include ordinary krig-ing (’OK’), simple kriging (’SK’), block ’OK’ (’BOK’) and block ’SK’(’BSK’) and ’IDW’ alsocovers ’NN’ and ’KNN’.. The data splitting is based on a stratified random sampling method (seethe ’datasplit’ function for details).
Usage
svmkrigeidwcv(formula.svm = NULL,longlat,trainxy,y,scale = TRUE,type = NULL,kernel = "radial",degree = 3,gamma = if (is.vector(trainxy)) 1 else 1/ncol(trainxy),coef0 = 0,cost = 1,nu = 0.5,tolerance = 0.001,epsilon = 0.1,transformation = "none",delta = 1,formula.krige = res1 ~ 1,vgm.args = c("Sph"),anis = c(0, 1),alpha = 0,block = 0,beta,nmaxkrige = 12,idp = 2,nmaxidw = 12,hybrid.parameter = 2,lambda = 1,validation = "CV",cv.fold = 10,predacc = "VEcv",
84 svmkrigeidwcv
...)
Arguments
formula.svm a formula defining the response variable and predictive variables for ’svm’.
longlat a dataframe contains longitude and latitude of point samples.
trainxy a dataframe contains longitude (long), latitude (lat), predictive variables and theresponse variable of point samples. That is, the location information must benamed as ’long’ and ’lat’.
y a vector of the response variable in the formula, that is, the left part of the for-mula.
scale A logical vector indicating the variables to be scaled (default: TRUE).
type the default setting is ’NULL’. See ’?svm’ for various options.
kernel the default setting is ’radial’. See ’?svm’ for other options.
degree a parameter needed for kernel of type polynomial (default: 3).
gamma a parameter needed for all ’kernels’ except ’linear’ (default: 1/(data dimension)).
coef0 a parameter needed for kernels of type ’polynomial’ and ’sigmoid’(default: 0).
cost cost of constraints violation (default: 1).
nu a parameter needed for ’nu-classification’, ’nu-regression’, and ’one-classification’(default: 0.5).
tolerance tolerance of termination criterion (default: 0.001).
epsilon ’epsilon’ in the insensitive-loss function (default: 0.1).
transformation transform the residuals of ’svm’ to normalise the data for ’krige’; can be "sqrt"for square root, "arcsine" for arcsine, "log" or "none" for non transformation.By default, "none" is used.
delta numeric; to avoid log(0) in the log transformation. The default is 1.
formula.krige formula defining the response vector and (possible) regressor. an object (i.e.,’variogram.formula’) for ’variogram’ or a formula for ’krige’. see ’variogram’and ’krige’ in ’gstat’ for details.
vgm.args arguments for ’vgm’, e.g. variogram model of response variable and anisotropyparameters. see ’vgm’ in ’gstat’ for details. By default, "Sph" is used.
anis anisotropy parameters: see notes ’vgm’ in ’gstat’ for details.
alpha direction in plane (x,y). see variogram in ’gstat’ for details.
block block size. see ’krige’ in ’gstat’ for details.
beta for simple kriging. see ’krige’ in ’gstat’ for details.
nmaxkrige for a local predicting: the number of nearest observations that should be usedfor a prediction or simulation, where nearest is defined in terms of the space ofthe spatial locations. By default, 12 observations are used.
idp a numeric number specifying the inverse distance weighting power.

svmkrigeidwcv 85
nmaxidw for a local predicting: the number of nearest observations that should be usedfor a prediction or simulation, where nearest is defined in terms of the space ofthe spatial locations. By default, 12 observations are used.
hybrid.parameter
the default is 2 that is for ’svmkrigesvmidw’; for ’svmsvmkrigesvmidw’, itneeds to be 3.
lambda, ranging from 0 to 2; the default is 1 for ’svmkrigesvmidw’ and ’svmsvmkrigesvmidw’;and if it is < 1, more weight is placed on ’krige’, otherwise more weight isplaced on ’idw’; and if it is 0, ’idw’ is not considered and the resultant methodsis ’svmkrige’ when the default ’hybrid.parameter’ is used; and if it is 2, then theresultant method is ’svmidw’ when the default ’hybrid.parameter’ is used.
validation validation methods, include ’LOO’: leave-one-out, and ’CV’: cross-validation.
cv.fold integer; number of folds in the cross-validation. if > 1, then apply n-fold crossvalidation; the default is 10, i.e., 10-fold cross validation that is recommended.
predacc can be either "VEcv" for vecv or "ALL" for all measures in function pred.acc.
... other arguments passed on to ’svm’, ’krige’ and ’gstat’.
Value
A list with the following components: me, rme, mae, rmae, mse, rmse, rrmse, vecv and e1; or vecvonly
Note
This function is largely based on ’rfcv’ in ’randomForest’, ’krigecv’ in ’spm2’and ’svm’ in ’e1071’.
Author(s)
Jin Li
References
Li, J., Potter, A., Huang, Z., and Heap, A. (2012). Predicting Seabed Sand Content across the Aus-tralian Margin Using Machine Learning and Geostatistical Methods, Geoscience Australia, Record2012/48, 115pp.
Li, J., Heap, A., Potter, A., and Danilel, J.J. (2011). Predicting Seabed Mud Content across theAustralian Margin II: Performance of Machine Learning Methods and Their Combination withOrdinary Kriging and Inverse Distance Squared, Geoscience Australia, Record 2011/07, 69pp.
David Meyer, Evgenia Dimitriadou, Kurt Hornik, Andreas Weingessel and Friedrich Leisch (2020).e1071: Misc Functions of the Department of Statistics, Probability Theory Group (Formerly: E1071),TU Wien. R package version 1.7-4. https://CRAN.R-project.org/package=e1071.
Pebesma, E.J., 2004. Multivariable geostatistics in S: the gstat package. Computers & Geosciences,30: 683-691.

86 svmkrigeidwpred
Examples
library(spm)# svmokglidwdata(petrel)gravel <- petrel[, c(1, 2, 6:9, 5)]longlat <- petrel[, c(1, 2)]model <- log(gravel + 1) ~ lat + bathy + I(long^3) + I(lat^2) + I(lat^3)y <- log(gravel[, 7] +1)set.seed(1234)svmkrigesvmidwcv1 <- svmkrigeidwcv(formula.svm = model, longlat = longlat,trainxy = gravel, y = y, transformation = "none", formula.krige = res1 ~ 1,vgm.args = "Sph", nmaxkrige = 12, idp = 2, nmaxidw = 12, validation = "CV",predacc = "ALL")
svmkrigesvmidwcv1
# svmsvmoksvmidwdata(sponge2)model <- species.richness ~ . # use all predictive variables in the datasetlonglat <- sponge2[, 1:2]y = sponge[, 3]set.seed(1234)svmsvmkrigesvmidwcv1 <- svmkrigeidwcv(formula.svm = model, longlat = longlat,trainxy = sponge2[, -4], y = y, gamma = 0.01, cost = 3.5, scale = TRUE,formula.krige = res1 ~ 1, vgm.args = ("Sph"), nmaxkrige = 12, idp = 2,nmaxidw = 12, hybrid.parameter = 3, validation = "CV", predacc = "ALL")svmsvmkrigesvmidwcv1
# svmoksvmidw for count datadata(sponge2)model <- species.richness ~ . # use all predictive variables in the datasetlonglat <- sponge2[, 1:2]y = sponge2[, 3]set.seed(1234)n <- 20 # number of iterations,60 to 100 is recommended.VEcv <- NULLfor (i in 1:n) {svmkrigesvmidwcv1 <- svmkrigeidwcv(formula.svm = model, longlat = longlat,trainxy = sponge2[, -4], y = y, gamma = 0.01, cost = 3.5, scale = TRUE,formula.krige = res1 ~ 1, vgm.args = ("Sph"), nmaxkrige = 12, idp = 2,nmaxidw = 12, validation = "CV", predacc = "VEcv")VEcv [i] <- svmkrigesvmidwcv1}plot(VEcv ~ c(1:n), xlab = "Iteration for svm", ylab = "VEcv (%)")points(cumsum(VEcv) / c(1:n) ~ c(1:n), col = 2)abline(h = mean(VEcv), col = 'blue', lwd = 2)

svmkrigeidwpred 87
svmkrigeidwpred Generate spatial predictions using the hybrid methods of supportvector machine (’svm’) regression , ’kriging’ and inverse distanceweighted (’IDW’).
Description
This function is for generating spatial predictions using the hybrid methods of ’svm’, ’kriging’ and’IDW’, including all methods implemented in ’svmkrigeidwcv’.
Usage
svmkrigeidwpred(formula.svm = NULL,longlat,trainxy,predx,y,longlatpredx,scale = TRUE,type = NULL,kernel = "radial",degree = 3,gamma = if (is.vector(trainxy)) 1 else 1/ncol(trainxy),coef0 = 0,cost = 1,nu = 0.5,tolerance = 0.001,epsilon = 0.1,transformation = "none",delta = 1,formula.krige = res1 ~ 1,vgm.args = c("Sph"),anis = c(0, 1),alpha = 0,block = 0,beta,nmaxkrige = 12,idp = 2,nmaxidw = 12,hybrid.parameter = 2,lambda = 1,...
)
Arguments
formula.svm a formula defining the response variable and predictive variables for ’svm’.
88 svmkrigeidwpred
longlat a dataframe contains longitude and latitude of point samples.
trainxy a dataframe contains longitude (long), latitude (lat), predictive variables and theresponse variable of point samples.
predx a dataframe or matrix contains columns of predictive variables for the grids tobe predicted.
y a vector of the response variable in the formula, that is, the left part of the for-mula.
longlatpredx a dataframe contains longitude and latitude of point locations (i.e., the centersof grids) to be predicted.
scale A logical vector indicating the variables to be scaled (default: TRUE).
type the default setting is ’NULL’. See ’?svm’ for various options.
kernel the default setting is ’radial’. See ’?svm’ for other options.
degree a parameter needed for kernel of type polynomial (default: 3).
gamma a parameter needed for all ’kernels’ except ’linear’ (default: 1/(data dimension)).
coef0 a parameter needed for kernels of type ’polynomial’ and ’sigmoid’(default: 0).
cost cost of constraints violation (default: 1).
nu a parameter needed for ’nu-classification’, ’nu-regression’, and ’one-classification’(default: 0.5).
tolerance tolerance of termination criterion (default: 0.001).
epsilon ’epsilon’ in the insensitive-loss function (default: 0.1). See ’?svm’ for details.
transformation transform the residuals of ’svm’ to normalise the data; can be "sqrt" for squareroot, "arcsine" for arcsine, "log" or "none" for non transformation. By default,"none" is used.
delta numeric; to avoid log(0) in the log transformation. The default is 1.
formula.krige formula defining the response vector and (possible) regressor. an object (i.e.,’variogram.formula’) for ’variogram’ or a formula for ’krige’. see ’variogram’and ’krige’ in ’gstat’ for details.
vgm.args arguments for ’vgm’, e.g. variogram model of response variable and anisotropyparameters. see ’vgm’ in ’gstat’ for details. By default, "Sph" is used.
anis anisotropy parameters: see notes ’vgm’ in ’gstat’ for details.
alpha direction in plane (x,y). see variogram in ’gstat’ for details.
block block size. see ’krige’ in ’gstat’ for details.
beta for simple kriging. see ’krige’ in ’gstat’ for details.
nmaxkrige for a local predicting: the number of nearest observations that should be usedfor a prediction or simulation, where nearest is defined in terms of the space ofthe spatial locations. By default, 12 observations are used.
idp a numeric number specifying the inverse distance weighting power.
nmaxidw for a local predicting: the number of nearest observations that should be usedfor a prediction or simulation, where nearest is defined in terms of the space ofthe spatial locations. By default, 12 observations are used.
svmkrigeidwpred 89
hybrid.parameter
the default is 2 that is for ’svmkrigesvmidw’; for ’svmsvmkrigesvmidw’, itneeds to be 3.
lambda, ranging from 0 to 2; the default is 1 for ’svmkrigesvmidw’ and ’svmsvmkrigesvmidw’;and if it is < 1, more weight is placed on ’krige’, otherwise more weight isplaced on ’idw’; and if it is 0, ’idw’ is not considered and the resultant methodsis ’svmkrige’ when the default ’hybrid.parameter’ is used; and if it is 2, then theresultant method is ’svmidw’ when the default ’hybrid.parameter’ is used.
... other arguments passed on to ’svm’, ’krige’ and ’gstat’.
Value
A dataframe of longitude, latitude, and predictions.
Author(s)
Jin Li
References
Li, J., Potter, A., Huang, Z., and Heap, A. (2012). Predicting Seabed Sand Content across the Aus-tralian Margin Using Machine Learning and Geostatistical Methods, Geoscience Australia, Record2012/48, 115pp.
Li, J., Heap, A., Potter, A., and Danilel, J.J. (2011). Predicting Seabed Mud Content across theAustralian Margin II: Performance of Machine Learning Methods and Their Combination withOrdinary Kriging and Inverse Distance Squared, Geoscience Australia, Record 2011/07, 69pp.
David Meyer, Evgenia Dimitriadou, Kurt Hornik, Andreas Weingessel and Friedrich Leisch (2020).e1071: Misc Functions of the Department of Statistics, Probability Theory Group (Formerly: E1071),TU Wien. R package version 1.7-4. https://CRAN.R-project.org/package=e1071.
Pebesma, E.J., 2004. Multivariable geostatistics in S: the gstat package. Computers & Geosciences,30: 683-691.
Examples
library(spm)
data(petrel)data(petrel.grid)
gravel <- petrel[, c(1, 2, 6:9, 5)]longlat <- petrel[, c(1, 2)]model <- log(gravel + 1) ~ lat + bathy + I(long^3) + I(lat^2) + I(lat^3)y <- log(gravel[, 7] +1)
svmkrigeidwpred1 <- svmkrigeidwpred(formula.svm = model, longlat = longlat, trainxy = gravel,predx = petrel.grid, y = y, longlatpredx = petrel.grid[, c(1:2)],formula.krige = res1 ~ 1, vgm.args = "Sph", nmaxkrige = 12, idp = 2, nmaxidw = 12)

90 svmkrigepred
names(svmkrigeidwpred1)
# Back transform 'svmkrigeidwpred$predictions' to generate the final predictionssvmkrigeidw.predictions <- exp(svmkrigeidwpred1$predictions) - 1range(svmkrigeidw.predictions)
svmkrigepred Generate spatial predictions using the hybrid method of support vectormachine (’svm’) regression and ’krige’ (svmkrige)
Description
This function is for generating spatial predictions using the hybrid method of ’svm’ and ’krige’(svmkrige).
Usage
svmkrigepred(formula.svm = NULL,longlat,trainxy,predx,y,longlatpredx,scale = TRUE,type = NULL,kernel = "radial",degree = 3,gamma = if (is.vector(trainxy)) 1 else 1/ncol(trainxy),coef0 = 0,cost = 1,nu = 0.5,tolerance = 0.001,epsilon = 0.1,transformation = "none",delta = 1,formula.krige = res1 ~ 1,vgm.args = c("Sph"),anis = c(0, 1),alpha = 0,block = 0,beta,nmaxkrige = 12,...
)
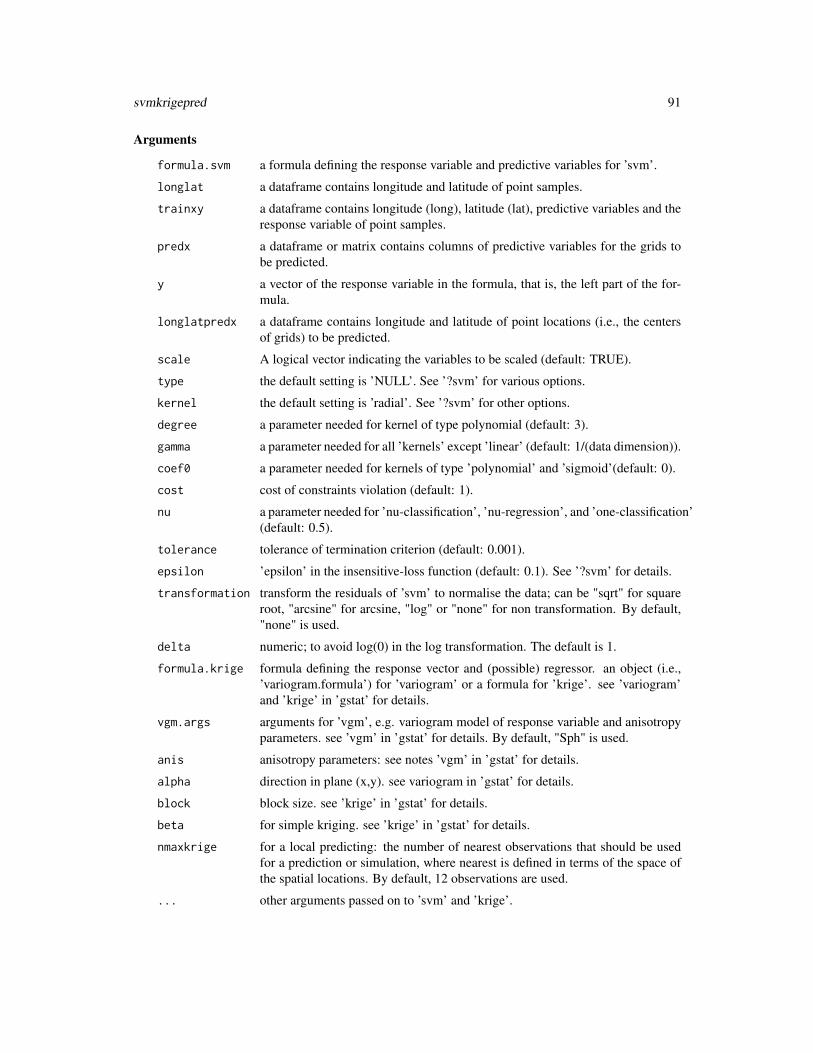
svmkrigepred 91
Arguments
formula.svm a formula defining the response variable and predictive variables for ’svm’.
longlat a dataframe contains longitude and latitude of point samples.
trainxy a dataframe contains longitude (long), latitude (lat), predictive variables and theresponse variable of point samples.
predx a dataframe or matrix contains columns of predictive variables for the grids tobe predicted.
y a vector of the response variable in the formula, that is, the left part of the for-mula.
longlatpredx a dataframe contains longitude and latitude of point locations (i.e., the centersof grids) to be predicted.
scale A logical vector indicating the variables to be scaled (default: TRUE).
type the default setting is ’NULL’. See ’?svm’ for various options.
kernel the default setting is ’radial’. See ’?svm’ for other options.
degree a parameter needed for kernel of type polynomial (default: 3).
gamma a parameter needed for all ’kernels’ except ’linear’ (default: 1/(data dimension)).
coef0 a parameter needed for kernels of type ’polynomial’ and ’sigmoid’(default: 0).
cost cost of constraints violation (default: 1).
nu a parameter needed for ’nu-classification’, ’nu-regression’, and ’one-classification’(default: 0.5).
tolerance tolerance of termination criterion (default: 0.001).
epsilon ’epsilon’ in the insensitive-loss function (default: 0.1). See ’?svm’ for details.
transformation transform the residuals of ’svm’ to normalise the data; can be "sqrt" for squareroot, "arcsine" for arcsine, "log" or "none" for non transformation. By default,"none" is used.
delta numeric; to avoid log(0) in the log transformation. The default is 1.
formula.krige formula defining the response vector and (possible) regressor. an object (i.e.,’variogram.formula’) for ’variogram’ or a formula for ’krige’. see ’variogram’and ’krige’ in ’gstat’ for details.
vgm.args arguments for ’vgm’, e.g. variogram model of response variable and anisotropyparameters. see ’vgm’ in ’gstat’ for details. By default, "Sph" is used.
anis anisotropy parameters: see notes ’vgm’ in ’gstat’ for details.
alpha direction in plane (x,y). see variogram in ’gstat’ for details.
block block size. see ’krige’ in ’gstat’ for details.
beta for simple kriging. see ’krige’ in ’gstat’ for details.
nmaxkrige for a local predicting: the number of nearest observations that should be usedfor a prediction or simulation, where nearest is defined in terms of the space ofthe spatial locations. By default, 12 observations are used.
... other arguments passed on to ’svm’ and ’krige’.
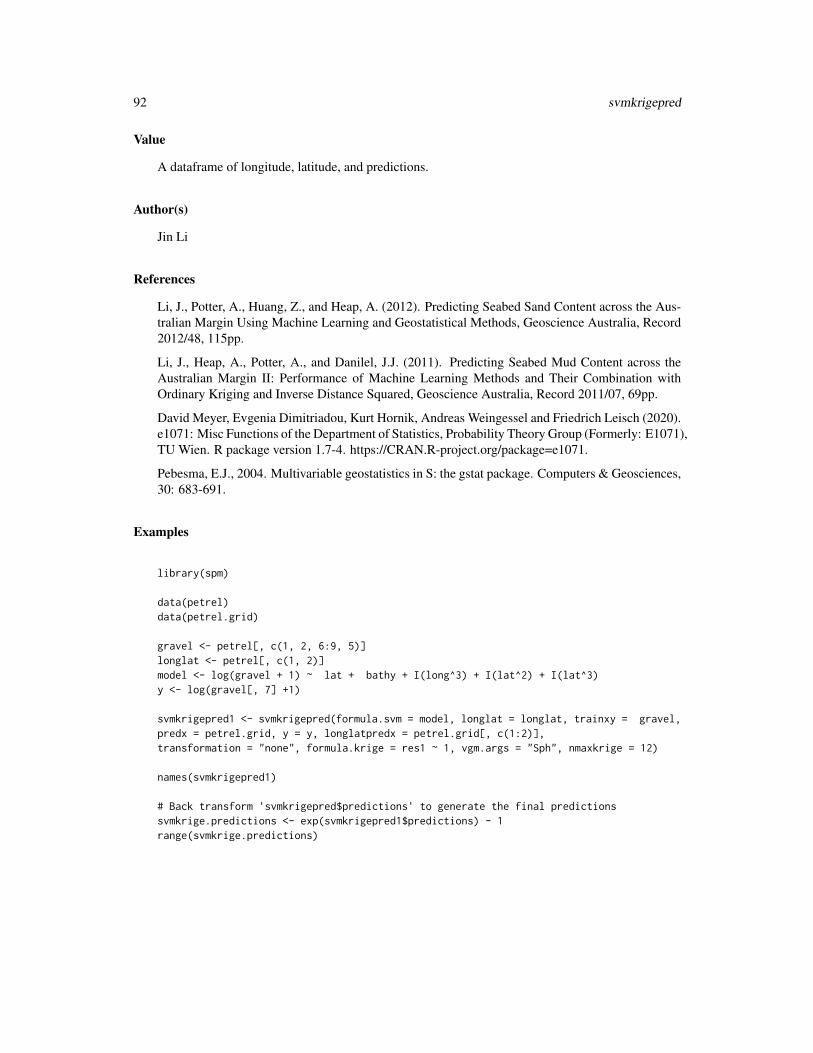
92 svmkrigepred
Value
A dataframe of longitude, latitude, and predictions.
Author(s)
Jin Li
References
Li, J., Potter, A., Huang, Z., and Heap, A. (2012). Predicting Seabed Sand Content across the Aus-tralian Margin Using Machine Learning and Geostatistical Methods, Geoscience Australia, Record2012/48, 115pp.
Li, J., Heap, A., Potter, A., and Danilel, J.J. (2011). Predicting Seabed Mud Content across theAustralian Margin II: Performance of Machine Learning Methods and Their Combination withOrdinary Kriging and Inverse Distance Squared, Geoscience Australia, Record 2011/07, 69pp.
David Meyer, Evgenia Dimitriadou, Kurt Hornik, Andreas Weingessel and Friedrich Leisch (2020).e1071: Misc Functions of the Department of Statistics, Probability Theory Group (Formerly: E1071),TU Wien. R package version 1.7-4. https://CRAN.R-project.org/package=e1071.
Pebesma, E.J., 2004. Multivariable geostatistics in S: the gstat package. Computers & Geosciences,30: 683-691.
Examples
library(spm)
data(petrel)data(petrel.grid)
gravel <- petrel[, c(1, 2, 6:9, 5)]longlat <- petrel[, c(1, 2)]model <- log(gravel + 1) ~ lat + bathy + I(long^3) + I(lat^2) + I(lat^3)y <- log(gravel[, 7] +1)
svmkrigepred1 <- svmkrigepred(formula.svm = model, longlat = longlat, trainxy = gravel,predx = petrel.grid, y = y, longlatpredx = petrel.grid[, c(1:2)],transformation = "none", formula.krige = res1 ~ 1, vgm.args = "Sph", nmaxkrige = 12)
names(svmkrigepred1)
# Back transform 'svmkrigepred$predictions' to generate the final predictionssvmkrige.predictions <- exp(svmkrigepred1$predictions) - 1range(svmkrige.predictions)

svmpred 93
svmpred Generate spatial predictions using support vector machine (’svm’)
Description
This function is for generating spatial predictions using ’svm’ method in ’e1071’ package.
Usage
svmpred(formula = NULL,trainxy,longlatpredx,predx,scale = TRUE,type = NULL,kernel = "radial",degree = 3,gamma = if (is.vector(trainxy)) 1 else 1/ncol(trainxy),coef0 = 0,cost = 1,nu = 0.5,tolerance = 0.001,epsilon = 0.1,...
)
Arguments
formula a formula defining the response variable and predictive variables.
trainxy a dataframe contains predictive variables and the response variable of point sam-ples. The location information, longitude (long), latitude (lat), need to be in-cluded in the ’trainx’ for spatial predictive modeling, need to be named as ’long’and ’lat’.
longlatpredx a dataframe contains longitude and latitude of point locations (i.e., the centersof grids) to be predicted, need to be named as ’long’ and ’lat’.
predx a dataframe or matrix contains columns of predictive variables for the grids tobe predicted.
scale A logical vector indicating the variables to be scaled (default: TRUE).
type the default setting is ’NULL’. See ’?svm’ for various options.
kernel the default setting is ’radial’. See ’?svm’ for other options.
degree a parameter needed for kernel of type polynomial (default: 3).
gamma a parameter needed for all ’kernels’ except ’linear’ (default: 1/(data dimension)).
coef0 a parameter needed for kernels of type ’polynomial’ and ’sigmoid’(default: 0).

94 svmpred
cost cost of constraints violation (default: 1).
nu a parameter needed for ’nu-classification’, ’nu-regression’, and ’one-classification’(default: 0.5).
tolerance tolerance of termination criterion (default: 0.001).
epsilon ’epsilon’ in the insensitive-loss function (default: 0.1). See ’?svm’ for details.
... other arguments passed on to ’svm’.
Value
A dataframe of longitude, latitude and predictions.
Author(s)
Jin Li
References
David Meyer, Evgenia Dimitriadou, Kurt Hornik, Andreas Weingessel and Friedrich Leisch (2020).e1071: Misc Functions of the Department of Statistics, Probability Theory Group (Formerly: E1071),TU Wien. R package version 1.7-4. https://CRAN.R-project.org/package=e1071.
Examples
library(spm)data(petrel)data(petrel.grid)
gravel <- petrel[, c(1, 2, 6:9, 5)]model <- log(gravel + 1) ~ lat + bathy + I(long^3) + I(lat^2) + I(lat^3)
svmpred1 <- svmpred(formula = model, trainxy = gravel,longlatpredx = petrel.grid[, c(1:2)], predx = petrel.grid)
names(svmpred1)
# Back transform 'svmpred1$pred.svm1' to generate the final predictionssvm.predictions <- exp(svmpred1$pred.svm1) - 1range(svm.predictions)
Index
∗ datasetsbees, 2sponge2, 68spongelonglat, 71
bees, 2
ccr, 5cran-comments, 6
datasplit, 7decimaldigit, 8
gbmkrigeidwcv, 9gbmkrigeidwpred, 13glmcv, 16glmidwcv, 18glmidwpred, 21glmkrigecv, 23glmkrigeidwcv, 26glmkrigeidwpred, 30glmkrigepred, 32glmnetcv, 35glmpred, 37glscv, 38glsidwcv, 40glsidwpred, 42glskrigecv, 44glskrigeidwcv, 47glskrigeidwpred, 51glskrigepred, 53glspred, 56
krigecv, 57krigepred, 60
rfkrigeidwcv, 62rfkrigeidwpred, 65
sponge2, 68spongelonglat, 71
svmcv, 72svmidwcv, 74svmidwpred, 77svmkrigecv, 79svmkrigeidwcv, 83svmkrigeidwpred, 86svmkrigepred, 90svmpred, 93
95