power from the brave new oceanpublications.lib.chalmers.se/records/fulltext/196091/196091.pdf ·...
TRANSCRIPT

I
THESIS FOR THE DEGREE OF DOCTOR OF PHILOSOPHY
Power from the Brave New Ocean
Marine Renewable Energy and Ecological Risks
LINUS HAMMAR
Environmental Systems Analysis
CHALMERS UNIVERSITY OF TECHNOLOGY
Gothenburg, Sweden 2014

II
Power from the Brave New Ocean Marine Renewable Energy and Ecological Risks LINUS HAMMAR ISBN 978-91-7385-994-3 © LINUS HAMMAR, 2014 Doktorsavhandlingar vid Chalmers tekniska högskola Ny serie nr 3675 ISSN 0346-718X Environmental Systems Analysis Department of Energy and Environment CHALMERS UNIVERSITY OF TECHNOLOGY SE-41296 Gothenburg Sweden Telephone +46 (0)31 772 10 00 www.chalmers.se Chalmers Reproservice Gothenburg 2014

III
Power from the Brave New Ocean: Marine Renewable Energy and Ecological Risks
Linus Hammar, Environmental Systems Analysis, Chalmers University of Technology
Abstract
This thesis address ecological risks associated with the possible growth of marine renewable energy. Tidal power, wave power, ocean thermal energy conversion (OTEC) and currently expanding offshore wind power are likely to become common components of future seascapes. The world ocean is strongly affected by other marine activities and it is essential that the possible expansion of marine renewables takes place without causing further detriment to the ecosystem. Identifying possible ecological risks at an early stage of technical development facilitates adaptation and supports apposite regulation.
The five studies of this thesis address: (I) stressors from marine renewables in comparison with other human activities that can cause cumulative effects to marine ecosystems; (II) ecological risks of an offshore wind power project in Kattegat; (III) effects of a small tidal turbine on fish movements; and (IV-V) modeling of collision risks of large tidal turbines. Methodological contributions include procedures for handling assessment uncertainties, introduction of fish behavior in collision risk modeling, and stereo-video based in situ measurements of current speed and fish swimming speed.
The results indicate that marine renewables are associated with comparatively many different stressors with potential effects on marine ecosystems. The stressors from offshore wind power, wave power and tidal turbines are quite similar. Most stressors from marine renewables are already common as a cause of existing human activities; however, some are different and may have unprecedented effects. Particular uncertainties regard the ecological effects of OTEC. It was further shown that ecological risks from offshore wind power on cod can be effectively reduced by planning harmful installation procedures so as not to coincide with biologically sensitive periods and that risks for cod are insignificant during the wind power operation phase. For tidal turbines particular uncertainty regards underwater collisions. Here it was found that small turbines are unlikely to pose significant risk to fish. For large turbines the findings indicate that small fish are unlikely to be harmed while large animals may be at risk for collision under poor visibility conditions, such as at night.
Apparent ecological risks of marine renewables vary among the many technical designs and are not known to detail. Positive effects are possible and have not been studied here. By further reducing uncertainties and mitigating risks through technical adaptation, regulation and planning negative effects of expanding marine renewables can be alleviated. This thesis provides some recommendations for research, development and management.
Keywords: Ecological risk assessment, Environmental impact, Fish, Ocean energy, Offshore wind power, Ocean thermal energy conversion, Stereo-video, Tidal power, Wave power.

IV

V
Sammanfattning
Avhandlingen behandlar ekologiska risker av förnybar marin energi. Marin energi omfattar bland annat havsbaserad vindkraft, vågkraft, strömkraft samt OTEC (utvinning av energi från havets temperaturgradient). Bland dessa tekniker är det idag bara havsbaserad vindkraft som är etablerad, men även de andra teknikerna har potential. En framtida utbyggnad av marin energi kommer att innebära att stora områden tas i anspråk av turbiner av olika slag. Eftersom havens ekosystem redan är kraftigt förändrade genom mänsklig påverkan är det viktigt att en sådan utbyggnad inte förvärrar situationen genom negativ miljöpåverkan. Det är särskilt lämpligt att utvärdera risker under ett tidigt skede av den tekniska utvecklingen eftersom tekniska anpassningar då lättare kan göras. Den första studien i avhandlingen är en litteraturbaserad inventering av de stressorer (påverkanskällor) som kan förväntas av de olika marina energi-teknikerna. Det visas de studerade teknikerna förväntas medföra ett förhållandevis stort antal olika stressorer, i jämförelse med andra marina aktiviteter. Detta motiverar att försiktighet iakttas även om antalet stressorer i sig inte säger så mycket om hur stor miljöpåverkan blir i varje enskilt fall. En iakttagelse som kan göras är att vågkraft, strömkraft och havsbaserad vindkraft avger liknande stressorer, vilket motiverar att kunskap från miljöeffekter av vindkraft allmänt kan vara en god indikator för att förstå miljöeffekter av de nyare teknikerna. De flesta stressorer från marina energitekniker liknar de som associeras till andra marina aktiviteter, men det finns vissa undantag där effekter kan vara särskilt svåra att förutse. Särskilda osäkerheter gäller de många stressorerna från OTEC, relaterat till omfördelning av vattenmassa mellan djuphav och ytvatten. En annan osäker och risk-associerad stressor utgörs av strömkraftverkens turbiner. I avhandlingens andra studie görs en ekologisk riskbedömning av havsbaserad vindkraft som planeras i ett lekområde för ett hotat bestånd av torsk. Här vidareutvecklas en metod för att dra slutsatser om risker utifrån viktning av motstående argument. Trots avsaknad av direkta bevis kan välgrundade slutsatser dras. I fallet konkluderas att anläggningsfasen, som innefattar pålningsarbeten, utgör en betydande risk för torskbeståndet om inga försiktighetsåtgärder vidtas. Om pålningsarbeten däremot undantas under torskens rekryteringsperiod blir risken låg. Resultatet visar på att det kan finnas stora miljövinster i att nogsamt och med hänsyn till biologiskt känsliga perioder planera riskfyllda moment under utbyggnaden av marin energi. När den studerade vindkraftsanläggningen väl tagits i drift förväntas den inte utgöra någon risk för torskbeståndet. Den tredje studien behandlar hur fisk påverkas av småskalig strömkraft. En turbin placerades i en tidvattenström i Mocambique och fiskars rörelsemönster analyserades genom stereo-video metodik. Stereo-video innebär att synkroniserade kameror riktas mot samma objekt så att längdmått och avstånd kan beräknas. Härigenom kunde fiskarnas rörelser beskrivas i detalj. Även strömhastighet och fiskars simhastighet kunde mätas upp genom anpassning av denna videoteknik, vilket inte tidigare gjorts och nu kan rekommenderas för framtida beteendestudier i fältmiljö. Genom studien visas att fiskar generellt är skickliga på att undvika kollisioner med den studerade typen av strömkraftverk och att olika arter håller sig på olika stora säkerhetsavstånd. Detta resultat antyder, tillsammans med andra studier, att småskalig strömkraft inte utgör

VI
någon risk för fisk. Det kan emellertid också konstateras att i de fall omfattande system anläggs med tätt placerade turbiner så måste dessa även innehålla passager om ett par meters bredd för att tillåta fisk att obehindrat simma igenom. Detta kan vara viktigt i områden som är betydelsefulla för fiskars vandring. I den fjärde och den femte studien undersöks hur havslevande djur, framförallt fisk, påverkas av stora strömkraftverk. Dessa turbiner kan ha en rotordiameter på upp till 20 m eller vara konstruerade med en 100 m lång cirkulerande vajer. Dessa kraftverk rör sig mycket snabbt genom vattnet, vilket kan vara problematiskt för förbipasserande djur. De utförda studierna består i ett stegvis utvecklande av teoretiska modeller för att beräkna kollisionsrisker. Den modell som föreslås är en syntes av tidigare forskning där de huvudsakliga bidragen består i en ökad helhetssyn och transparens samt införandet av djurens beteende i modellen. I samband med utveckling av modellen insamlades även data över fiskars naturliga beteende i kraftigt strömmande tidvatten. Denna information visar att fiskar undviker de kraftigaste strömmarna, med tydliga förändringar i simbeteende vid en strömhastighet av c:a 0.8 m/s (1.5 knop). Sammantaget indikerar dessa modellbaserade och i huvudsak teoretiska studier att stora strömkraftsverk utgör en mycket liten riskfaktor för småfisk. För stor fisk, av storleksordningen meter, kan stora strömkraftverk emellertid antas medföra en icke obetydlig risk under dåliga siktförhållanden. Det kan därför vara viktigt att öka stora djurs möjligheter att upptäcka strömkraftverk på avstånd, särskilt under nattetid. Det kvarstår mycket forskning innan solida slutsatser kan dras angående miljöpåverkan från de många olika marina energiteknikerna. Bidragen från denna avhandling är några små steg på vägen. Det emellertid är viktigt att industrin tidigt iakttar identifierade risker och anpassar den tekniska utveklingen därefter. Några förslag på angelägna åtgärder ges i denna avhandling. Avhandlingen belyser slutligen nödvändigheten i att havsförvaltning i framtiden sker på regional nivå. Detta för att marina ekosystem påverkas samtidigt av många olika aktiviteter, vilket kan ge upphov till kumulativa effekter som inte kan förutses eller åtgärdas på lokal nivå. Genom en regional planeringsansats kan även de positiva miljöeffekterna av marin energi, såsom rev-effekt och skydd av vissa arter, lättare komma tillgodo. Genom fortsatt forskning, planering och proaktiv riskhantering gynnas förutsättningarna för att på hållbara grunder använda haven som energikälla genom olika marina energitekniker.

VII
List of appended papers
This thesis is based on the following papers, referred to by roman numerals in the text:
I. Hammar L., Gullström M., Dahlgren T., Asplund M.E., and Molander S. Adding stressors from new resource extraction to a busy ocean. Manuscript.
II. Hammar L., Wikström A. and Molander S. (2014) Assessing ecological risks of offshore wind power on Kattegat cod. Renewable Energy 66 414-424
III. Hammar L., Andersson S., Eggertsen L., Haglund J. Gullström M., Ehnberg J.
and Molander S. (2013) Hydrokinetic turbine effects on fish swimming behaviour. PLoS ONE 8(12)
IV. Hammar L. and Ehnberg J. (2013) Who should be afraid of a tidal turbine – the
good the bad or the ugly? 10th
European Wave and Tidal Conference Series, Aalborg.
V. Hammar L., Eggertsen L., Andersson S., Gullström M., Ehnberg J., Arvidsson
R. and Molander S. A probabilistic model for hydrokinetic turbine collision risks: exploring the fate of fish. Manuscript.

VIII
Other contributions
During my doctoral studies I have also contributed to the following papers and peer-reviewed conference papers, which are not included in this thesis:
A. Hammar L., Ehnberg J., Mavume A., Cuamba B. and Molander S. (2012) Renewable Ocean Energy in the Western Indian Ocean. Sustainable and
Renewable Energy Reviews 16(7):4938-4950.
B. Hammar L., Ehnberg J., Mavume A., Francisco F. and Molander S. (2012) Simplified site-screening method for micro tidal current turbines applied in Mozambique. Renewable Energy 44:414-422.
C. Hammar L., Ehnberg J., Eggertsen L., Andersson S. and Molander S. (2012)
Fish-Turbine Interactions Studied by Stereo-Video Methodology. In 1th Asian
Wave and Tidal Conference Series, Jeju Island Korea.
D. Hammar L. and Gullström M. (2011) Applying Ecological Risk Assessment Methodology for Outlining Ecosystem Effects of Ocean Energy Technologies. In 9th
European Wave and Tidal Energy Conference Series, Southampton.
E. Hammar L., Ehnberg J., Gullström G. and Molander S. (2009) Ocean energy in combination with land-based renewable energy sources: appropriate technology for smaller electricity grids in Africa? In 8th
European Wave and Tidal Energy
Conference Series, Uppsala.
F. Ahlborg H. and Hammar L. (2014) Drivers and barriers to rural electrification in Tanzania and Mozambique – Grid-extension, off-grid, and renewable energy technologies. Renewable Energy 61 117-124.
About the title
The title was inspired by the publication Ecological extinction and evolution in the
Brave New Ocean (2008) by Jeremy B.C. Jackson, in turn referring to the dystopia Brave New World (1932) by Aldous Huxley. Jackson offers a gloomy outlook for the marine ecosystems in an ocean increasingly affected and changed by human exploitation of marine resources. By the title of the thesis I wish to highlight that when new technology now enters the ocean, it enters an ocean already under change and with degraded resilience. This may be a motivation for the thesis.

IX
Contents Introduction 1
Power generation in the ocean 1
Ocean exploitation and environmental degradation 2
Aims of the thesis 3
Definitions and scope limitations 4
A guide to the technical systems 4
Environmental effects of marine renewables 8
Point of departure and specific research objectives 15
Environmental assessment frameworks 17
The Ecological Risk Assessment (ERA) framework 18
On receptors, stressors, effects and risk 21
Effects and ecological risks 22
Will marine renewables introduce new stressors in the ocean? 22
Offshore wind power: can we assess with confidence? 23
Will turbines kill a lot of fish? 25
Methodological contributions 31
Weight-of-evidence based ERA: applied on offshore wind power 31
Probabilistic risk analysis: applied on tidal turbines 33
Field study methods: contributions and reflections 36
Discussion and synthesis 39
Understanding uncertainties 39
Marine renewables in the Brave New Ocean 41
Technical adaptations and developments for risk reduction 44
References 46
Acknowledgements 55
Appended papers I-V


Nobody knows what's going to happen. And then we film it.
That's the whole concept!
- Steve Zissou


1
Introduction In this thesis I contextualize and present my research on ecological risks of marine renewable energy. These technologies, utilizing the energy of waves, currents and thermal gradients, may come to play an important role in providing future energy. But they are still very young, most of them never tested at commercial scale, and little is known regarding potential effects to marine ecosystems. Given that the ocean is already under stress from both environmental changes and anthropogenic influences, it is crucial to reduce uncertainties and mitigate risks.
Power generation in the ocean
Marine renewable energy was first explored as tidal mills used by antique and medieval civilizations in Europe and the Middle East (Charlier and Menanteau 1997). From the 19th century generators replaced the mills and the tidal barrage technology was founded. Many small tidal barrages were installed in China during the 20th century (Charlier 2001) followed by a few large tidal barrages in France, Canada and the Soviet Union. But due to environmental concerns and high installation costs this first marine renewable energy technology never had a breakthrough (Charlier and Justus 1993). Wave power was explored in the mid-20th century, including several pilot plants and micro scale implementations (e.g. wave power for lighthouse supply). Ocean thermal energy conversion (OTEC) was invented in the 19th century and the first pilot plant was built 1930 in Cuba, with several other OTEC projects following, although none of them sustained. With the energy crisis in the 1970s the interest in wave power, tidal barrages, OTEC and ocean current power increased and several projects were implemented. Yet, the costs were high and when oil became cheaper the development ceased. Decades later, global climate change awareness and energy security petitions accelerated the interest in renewable energy, eventually spurring the development of modern marine renewables. First out was offshore wind power with Scandinavian installations in 1990. Larger projects were successively commissioned and the offshore wind power industry is now rapidly expanding in the North Sea region (Leung and Yang 2012, 4C Offshore Database 2014). Next in line may be modern wave- and tidal power, both with demonstration projects running and commercial projects consented (Esteban and Leary 2012). This development is largely driven from North America, Europe and East Asia. Recently, a small 1 MW OTEC was built in India (Bhuyan 2008) and other plants (10-20 MW) are under development in Martinique (France) and the Bahamas. OTEC development is currently taking place in the US, France and Japan, though there is a clear potential for implementation in many tropical developing countries. Even the challenging extraction of energy from ocean currents has lately gained new interest (Minesto 2014). As illustrated by Figure 1 the interests in marine renewable energy is now widely spread. However, offshore conditions are rough and often it has proved difficult to make mechanics sturdy enough to withstand the forces. Devices developed for exposed locations need to be adapted both for efficient power generation under normal conditions and to endure when extreme weather rolls in. Though offshore wind power is already established (Leung and Yang 2012), it is yet to be seen whether other marine renewables will succeed at the new, oceanic, frontiers.

2
Figure 1. Indicative global distribution of interest in marine renewables. Red fields denote areas of installed
offshore wind power; light red fields indicate documented ongoing offshore wind power projects (planning phase).
Blue dots show documented wave power, tidal power and OTEC activities (installations, pilot plants and
consents). The map does not mirror installed capacity. Main data sources: 4C Offshore (2014) and Tethys (2014).
With reservation for incomplete data.
Resource potential and predicted growth of marine renewables
The technically extractable resource potential of marine renewable energy is difficult to estimate since little is known about the efficiency of future technology. Based on a large number of studies, each with its own assumptions, a brief estimate is 100 000–150 000 TWh/yr with the largest potential contributions from offshore wind power and OTEC (Sandén et al. In prep). For comparison, the current world supply of electric power was 23 000 TWh/yr in 2013 (BP 2014). Despite large resource potential technology growth is difficult to predict, thus projections vary. A rather well investigated projection based on learning factors from the offshore wind industry was provided by Esteban and Leary (2012). Their study indicated that 7% of the global power supply by 2050 might come from offshore wind power, wave power and tidal power (OTEC excluded). Should the future hold anything close to this projection level, the future ocean will see vast numbers of power plants deployed in coastal waters. Since the resource potential for most marine renewables is geographically restricted, particular areas may become vigorously developed long before marine renewables contribute much to the global electricity supply.
Ocean exploitation and environmental degradation
The possible growth of marine renewable energy has raised concerns about its environmental impact. With rapid technology growth any uncertainty may quickly become troublesome and it has been stressed that development should to be accompanied with thorough environmental assessment, integrative policy and technical adaptation (Gill 2005, Inger et al. 2009, Wilhelmsson et al. 2010). These precautions make particular sense when taking a historical perspective. For long time, humans used the ocean for food supply and transport with limited environmental impact. But the footprint of human activity in the ocean intensified a few hundred years ago, starting with the European cod fishery in the western Atlantic in the 17th

3
century (Smith 2000). When steam-powered boats became available in the 19th century, and the combustion engine spread in the early 20th century, access to opportunities in the ocean increased immensely. Technological development flourished and fisheries, food conservation and shipping gained efficiency. From 1930 the whale stocks collapsed and several important fish stocks were overexploited (Smith 2000). In the latter half of the 20th century fisheries became equipped with sonars and satellite navigation. This additionally intensified fisheries and previously inaccessible waters opened up, allowing for exploitation of new fish stocks and deep sea refuges (Roberts 2002). Additionally, offshore extraction of oil and natural gas developed, aquaculture spread, agricultural runoff increased, offshore waste disposal intensified and various forms of marine recreation were initiated (Smith 2000). Now one third of the world’s fish stocks are overexploited or depleted (FAO 2010), about 40% of the ocean is strongly affected by human stressors (Halpern et al. 2008b), 90-99% of large offshore fish has been depleted (Jackson 2008) and 100% of the ocean shows signs of anthropogenic presence (Halpern et al. 2008b). With the predicted effects from climate change, the worse is yet to come (Bijma et al. 2013). It is this reality that has caused some to say we dominate ocean ecosystems (Vitousek et al. 1997) and are rapidly producing a future ocean with little remaining of natural ecosystems (Jackson 2008). Fortunately, society is starting to grasp the magnitude of our human impact and strives towards more sustainable development (MEA 2005). On the increasing use of ocean resources, Crowder and Norse (2008) argued that prevention is a far more robust
management strategy than seeking a cure for a degraded system. This concurs with the precautionary principle that guides environmental legislation in many countries. On the one hand it strongly advocates a restrictive approach to marine renewables as long as uncertainties on environmental effects remain. On the other hand, the same argument can be seen as a promotion of a quick expansion of marine renewables, in order to reduce the dramatic effects expected from fossil fuel driven climate change. Today most countries have ratified environmental legislation (Morgan 2012). While environmental legislation may not always effectively control traditional activities with established lobbies, new activities are more easily regulated, particularly if they are of ‘point source’ character1. For marine renewable energy developers to fulfil their outspoken intention of contributing to a more sustainable global energy supply, they must prove that the technologies carry low ecosystem risk, or adapt the system until it does. Considering the difficulties of changing technology once it is mature (Collingridge 1981), research on ecological risks and their practical solutions is critically important now, when most marine renewables are still in their infancy (Grecian et al. 2010).
Aims of the thesis
In this thesis I have two general ambitions: (1) to contribute to the understanding of potential ecological risks associated with different marine renewables, and (2) to provide applicable assessment methods for the same purpose. Additionally, I intend to provide suggestions on risk reducing technical adaptations. 1 Marine activities implemented as larger projects at specific locations are typically obliged to go through
environmental impact assessment procedures to attain consent. Contrastingly, diffuse new activities are more likely to be regulated in retrospect, once adverse effects have been shown.

4
Definitions and scope limitations
The term marine renewable energy is defined as renewable energy conversion making use of marine resources or marine space (ESF 2010). A commonly used abbreviation is marine
renewables. There are eight main technology categories, each comprising a variety of devices: offshore wind power, wave power, tidal current power, tidal barrage power, ocean current power, ocean thermal energy conversion, marine biomass and osmotic gradient power. The term ocean energy includes the same technologies apart from offshore wind power and marine biomass. The research field is relatively new and different authors tend to use different subgroups and acronyms (for example MRED for Marine Renewable Energy Devices; MREI for Marine Renewable Energy Installations; and ORED for Ocean Renewable Energy Development). In this thesis I address four technology categories2, referred to as: offshore
wind power, wave power, tidal turbines (i.e. tidal current power), and OTEC (i.e. ocean thermal energy conversion). These four technologies are all considered in Paper I, while Paper II regards offshore wind power and tidal turbines are in focus in Papers III-V. Regarding ecological receptors, Paper I concerns effects on marine organisms in general while the subsequent studies all focus on fish. In Paper II the focus on fish (Atlantic cod) was chosen because of case-specific reasons where a cod population had been identified as the most vulnerable ecosystem receptor. In Papers III-V fish are in focus because of feasibility as well as that the effects on fish have often been sparsely considered in previous studies on tidal turbines. All field observations were collected in subtropical waters of western Indian Ocean.
A guide to the technical systems
In this chapter I briefly present the four technology categories addressed in the thesis (Figure 2). Technical principles, size and site requirements are all important for understanding potential ecological risks. Each technology category includes multiple devices with different appearances and applications. This thesis does not attempt to cover them all.
2 The four technology categories considered are all recent and have growth potential in the near future. Ocean
current power devices have many similarities with tidal turbines and effect mechanisms may be similar. Among the other technologies not in focus here, tidal barrage power has been in use for many decades and its environmental impact is well established, resembling effects of conventional hydropower. Osmotic gradient power is in very early development and is rarely considered in the literature. Marine biomass concerns cultivation of algae for biofuel production purpose. These latter three technologies are more land- and estuarine oriented than marine.
5
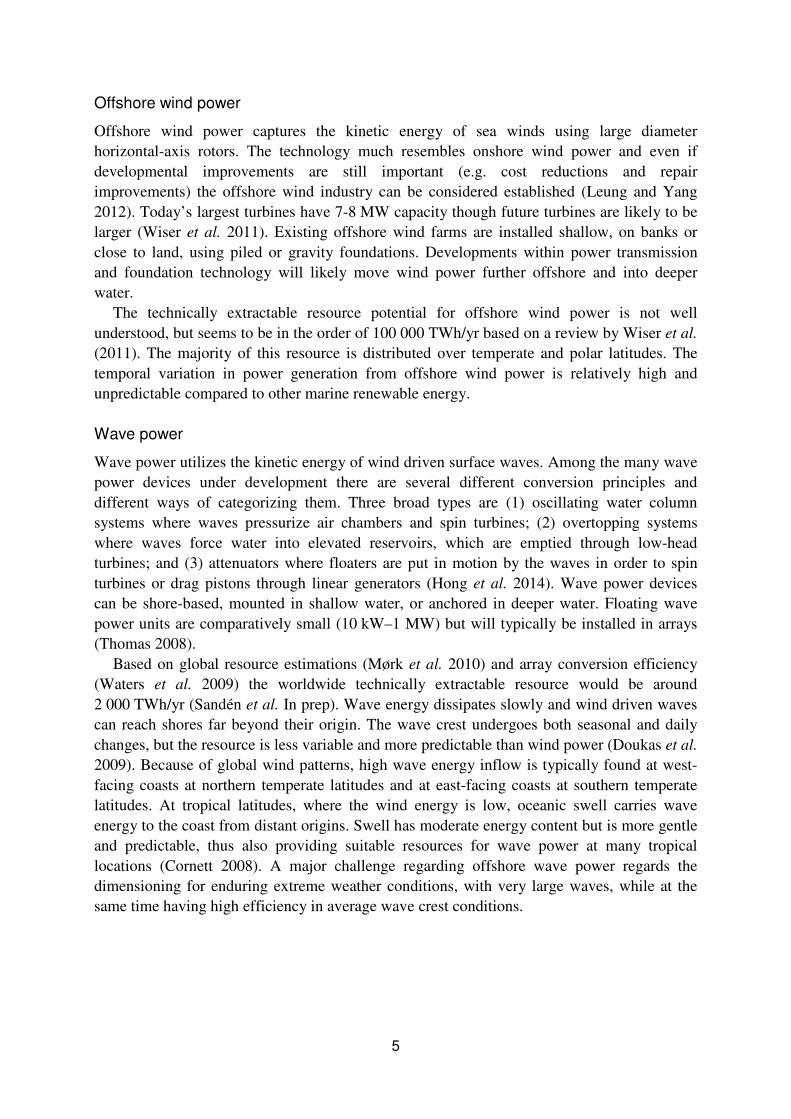
Offshore wind power
Offshore wind power captures the kinetic energy of sea winds using large diameter horizontal-axis rotors. The technology much resembles onshore wind power and even if developmental improvements are still important (e.g. cost reductions and repair improvements) the offshore wind industry can be considered established (Leung and Yang 2012). Today’s largest turbines have 7-8 MW capacity though future turbines are likely to be larger (Wiser et al. 2011). Existing offshore wind farms are installed shallow, on banks or close to land, using piled or gravity foundations. Developments within power transmission and foundation technology will likely move wind power further offshore and into deeper water. The technically extractable resource potential for offshore wind power is not well understood, but seems to be in the order of 100 000 TWh/yr based on a review by Wiser et al. (2011). The majority of this resource is distributed over temperate and polar latitudes. The temporal variation in power generation from offshore wind power is relatively high and unpredictable compared to other marine renewable energy. Wave power
Wave power utilizes the kinetic energy of wind driven surface waves. Among the many wave power devices under development there are several different conversion principles and different ways of categorizing them. Three broad types are (1) oscillating water column systems where waves pressurize air chambers and spin turbines; (2) overtopping systems where waves force water into elevated reservoirs, which are emptied through low-head turbines; and (3) attenuators where floaters are put in motion by the waves in order to spin turbines or drag pistons through linear generators (Hong et al. 2014). Wave power devices can be shore-based, mounted in shallow water, or anchored in deeper water. Floating wave power units are comparatively small (10 kW–1 MW) but will typically be installed in arrays (Thomas 2008). Based on global resource estimations (Mørk et al. 2010) and array conversion efficiency (Waters et al. 2009) the worldwide technically extractable resource would be around 2 000 TWh/yr (Sandén et al. In prep). Wave energy dissipates slowly and wind driven waves can reach shores far beyond their origin. The wave crest undergoes both seasonal and daily changes, but the resource is less variable and more predictable than wind power (Doukas et al. 2009). Because of global wind patterns, high wave energy inflow is typically found at west-facing coasts at northern temperate latitudes and at east-facing coasts at southern temperate latitudes. At tropical latitudes, where the wind energy is low, oceanic swell carries wave energy to the coast from distant origins. Swell has moderate energy content but is more gentle and predictable, thus also providing suitable resources for wave power at many tropical locations (Cornett 2008). A major challenge regarding offshore wave power regards the dimensioning for enduring extreme weather conditions, with very large waves, while at the same time having high efficiency in average wave crest conditions.

6
Figure 2. Principal designs of technologies studied in the
thesis: (a) offshore wind power; (b) wave power
(attenuator design); (c) tidal turbine (large horizontal-axis
design); (d) tidal turbine (kite-mounted design, can also
be used for extracting ocean current energy); (e) OTEC
(onshore and offshore designs). The illustrations are not
to scale.
a
b
c
d
e

7
Tidal current power
Tidal turbines convert the kinetic energy of fast-flowing currents into electricity. Strong tidal currents develop where tidal waves pass through narrow straights or coastal bends (Kowalik 2004). Energy is captured by hydrokinetic turbines driven by horizontal-axis or vertical-axis rotors, or by oscillating hydrofoils (Khan and Bhuyan 2009, Khan et al. 2009). Large tidal turbines typically have horizontal-axis rotors (5–20 m diameter) and are installed on piled or gravity foundations. Such turbines are studied in Papers IV and V. Small horizontal-axis rotors (<5 m diameter) may be shrouded by a duct that enhances water speed. Among small tidal turbines several devices have vertical-axis rotors, like the Gorlov Turbine studied in Paper III. Small tidal turbines can be installed on the bottom, on moored raft-like structures or in serial mounted fence-like structures (Khan et al. 2008). By contrast the Deep Green device is a very different tidal turbine design, where the turbine is mounted on a kite (or wing) that sweeps through the water transverse to the current attached to bottom by a ~100 m long wire. Because the kite moves quickly (~12 m/s) the water speed over the rotor is enhanced and the turbine can operate in comparatively slow currents. All tidal turbine units are small with capacities from a few kilowatts to 2 MW. Therefore, turbines would likely be installed in arrays. The power available from currents is related to the cube of water speed. Therefore, the resource potential for tidal turbines increases dramatically with increased water speed and only locations with very high velocities (2-3 m/s) are suitable for most devices (Fraenkel 2002). An exception is the above mentioned Deep Green device that may be capable of utilizing speeds at or even below 1 m/s (Minesto 2014). As a result of there being very few detailed maps over tidal currents, the global resource potential is unknown. A very rough estimation of the technically extractable tidal energy resource is 1 000 TWh/yr, however this includes both tidal current power and tidal barrages (Sandén et al. In prep). European countries, the UK in particular, have a large share of the global tidal energy resource. Other regions with high potential are found in East Asia, Canada, New Zealand and South America (Lewis et al. 2011). Because of tidal fluctuations electricity production varies over hours and weeks, but in highly predictable cycles. There are no strict differences among hydrokinetic turbines targeting tidal currents, river flows and ocean currents. Here I focus on tidal current power, but effect mechanisms may be partly similar for the other hydrokinetic turbines3 (Paper I). Some potentially important differences when considering ecological risks are that ocean current turbines would typically be larger in size and operate at larger depths (Finkl and Charlier 2009), thus partly affecting a different set of organisms. Riverine turbines, some of which have already been tested, are installed shallower and may have more pronounced barrier effects compared to offshore marine installations.
3 Conventional hydropower is very different to hydrokinetic turbines. Hydrokinetic turbines have open-flow designs
with low rotational speed and low blade solidity (i.e. there is space between rotor blades). In hydropower systems water is entrained and forced through turbines with higher rotational speed and blade solidity. Comparisons regarding environmental effects are therefore difficult to make (Cada et al. 2007).

8
Ocean Thermal Energy Conversion (OTEC)
OTEC technology targets the temperature difference between cold deep sea water and warm surface water in tropical seas. OTEC operates by pumping massive amounts of water through large diameter pipes to the floating or land based OTEC facility where electricity is generated through heat engine principles. Discharge water with altered temperature and possibly changed physiochemical properties is then released back to the ocean. The discharge depth has great importance for environmental effects. OTEC can be based on open-, closed- or hybrid designs. In the open-cycle OTEC warm water is vaporized in low pressure chambers and the steam is used to drive turbines before it is re-condensed by cold water. Closed-cycle OTEC operates by the same principles but uses a recycled working fluid instead of water evaporation in low-pressure chambers. In the hybrid design, warm water is vaporized like in the open-cycle design and is then used to vaporize a working fluid, which in turn drives the turbines. In the open-cycle and hybrid OTEC designs freshwater is produced as a by-product. This adds value to the process where fresh water is scarce4, but also implies increased physiochemical changes to the discharge water. Because of high installation costs and low conversion efficiency it is necessary for OTEC power plants to be large (50-100 MW at commercial scale) with the water intake of a 100 MW commercial scale OTEC plant being about 300 and 400 m3/s from the deep sea and the surface, respectively. The OTEC heat exchange requires that the water temperature difference exceeds 20 °C. This temperature difference is found in tropical waters with cold enough deep sea water (4-6 °C), often available at depths of about 1 000 m (Nihous and Syed 1997). Therefore, land based OTEC is restricted to tropical islands and tropical locations where the continental shelf is very narrow. Offshore OTEC have fewer limitations and mobile ‘browsing’ units have been proposed (here, energy is stored as liquid and shipped to land). The technically extractable resource, limited by the risk of affecting oceanic temperature fields, is estimated to around 30 000 TWh/yr, based on Rajagopalan and Nihous (2013). Ocean heating and circulation are relatively stable processes and variation in OTEC production is thus predictable (Bhuyan 2008).
Environmental effects of marine renewables
Possible environmental impacts of marine renewables were discussed already in the mid-20th century (Charlier and Justus 1993). Today, we still have very little data on environmental effects from most of the modern marine renewables, because there have been few installations and essentially no large-scale operations to learn from. Offshore wind power is the exception. The first environmental study from the first offshore wind power installation was published by Westerberg (1994). This study indicated, vaguely, that the Atlantic cod was negatively affected by the turbine noise. Since then, numerous applied research studies and reports have been published and the results from long term monitoring programs in offshore wind farms have become available. In this chapter I summarize what we hitherto have learned regarding environmental effects of marine renewables and where the most profound uncertainties remain.
4 OTEC technology has the capacity of producing large volumes of desalinated and clean water of deep sea
origin. A commercial scale OTEC plant of 100 MW can produce approximately 400 000 m3 freshwater per day,
potentially to be used for irrigation or supplying a large population with potable water.

9
Disturbances during the installation phase
Most marine renewables are fixed to the bottom by a foundation; others are moored to an anchoring structure. Both foundations and cable connections cause a partial removal of the natural habitat, which can be considered more or less undesirable. Most marine renewables are likely to be installed on sedimentary bottoms (mud, clay and sand). In shallow areas this can imply loss of valuable vegetation such as ecologically important seagrass meadows. Tidal turbines are more likely to be installed on rocky bottoms (Miller et al. 2013). Here reef-forming benthos and macroalgae can have ecological importance. However, habitat losses caused by small units of marine renewables are limited even in large arrays and generally not expected to have ecological significance (Inger et al. 2009). The construction procedures typically involve some dredging, drilling or cable trenching, causing dispersion of fine grained sediment particles (Miller et al. 2013). This disturbance is higher for gravity foundations than for piled foundations (Hammar et al. 2008). If water movements are low and the sediment is of fine grain-size the dissolved matter can reside in the water column for hours to days and adversely affect filtering organisms and fish recruits (Hammar et al. 2009). Toxic and calcareous sediments are particularly damaging for these organisms (Westerberg et al. 1996). In exposed offshore environments water movements quickly dilute elevated particle concentrations and exposure times are shortened. Nevertheless, there may be good reasons for avoiding sediment disturbance during particularly sensitive biological periods. Considerable effects on local fauna can be caused by the installation of piled foundations (monopile- jacket- and tripod foundations). Pile driving produces impulsive sound of very high amplitude (sound pressure levels above 240 dBpeak re 1 µPa at 1 m from the source (Parvin and Nedwell 2006, Hildebrand 2009, Tougaard et al. 2009)). This extreme impulsive sound can cause damage to marine organisms, particularly those with air-filled cavities such as swim bladders and lungs. At close range (<100 m) such a trauma can be lethal or cause physical injury (Popper et al. 2006, Bailey et al. 2010). Avoidance reactions can be expected at a distance of over hundreds or thousands of meters for many fish (Nedwell et al. 2007, Andersson 2011), and over tens of kilometers for marine mammals (Madsen et al. 2006, Tougaard et al. 2009, Bailey et al. 2010). Behavioral responses can occur over more than 50 km from the source area (Andersson 2011). The sensitivity varies among organisms and the sound transmission depends on bathymetry and hydrography (Urick 1983). Furthermore, pile dimension and piling method have strong influence on the sound pressure source level (Hammar et al. 2008). Therefore, the range of exposure and resulting effect of pile driving can be difficult to predetermine despite the fact that the mechanisms of impulsive sound damage are rather well understood. Porpoises have been observed to return to completed installation sites within hours or days (Tielmann et al. 2006, Degraer et al. 2012), indicating that displacements are temporary even for these sensitive animals.

10
Colonization and reef-effect
Once installed foundations, turbines, buoys, and score protections represent new habitats and will immediately be colonized by marine organisms. Extensive studies have been conducted on the colonization of foundations in general (Carr and Hixon 1997, Andersson et al. 2009), wind power foundations (Wilhelmsson and Malm 2008, Andersson and Öhman 2010) and wave power foundations and buoys (Langhamer and Wilhelmsson 2009, Langhamer et al. 2009). Since availability to hard substrates is a limiting factor in marine ecosystems colonization will always occur, but what organisms that will colonize first and dominate in the long term depends on the inclination and material of the structure, depth, location, season and chance (Svane and Petersen 2001, Andersson et al. 2009). Filter feeding animals have shown to proliferate on buoys (Langhamer 2009) and the vertical structures of wind power foundations (Wilhelmsson et al. 2006, Lindeboom et al. 2011, Degraer et al. 2012). Since surface reaching substrates are rare in offshore environments the splash zone that emerges may provide habitat for otherwise uncommon species. Colonization of new species can be problematic since offshore installations may then work as stepping stones for non-indigenous (or invasive) species (Langhamer 2012, Bergström et al. 2014). Colonized foundations of marine renewables can be described as artificial reefs, but different both from natural rocky bottoms and other artificial reefs in that they reach to the surface and are well separated even within arrays (Andersson 2011). The foundations attract mobile animals from the surroundings and where the structural complexity is high a more diverse colonization can be expected. This artificial reef-effect has been shown for many fish and crustaceans at offshore wind farms (Wilhelmsson et al. 2006, Reubens et al. 2010, Leonhard et al. 2011, Lindeboom et al. 2011, Bergström et al. 2013) and at a wave power array (Langhamer and Wilhelmsson 2009, Langhamer et al. 2009). The early indication of negative effects on Atlantic cod mentioned in the introduction to this section (Westerberg 1994) is not supported by later findings, where cod were shown to be attracted to wind power turbines (Reubens et al. 2011, Bergström et al. 2013) and some individuals were even observed residing by turbines for months (Winter et al. 2010). Reef-effects among mobile fauna have also been shown at wave power devices, but to a lesser extent than at wind power foundations (Langhamer and Wilhelmsson 2009, Langhamer et al. 2009). It is hypothesized that, with time, arrays of marine renewables functioning as artificial reefs may increase the production of fish and other organisms, although this has not yet been established (Wilhelmsson 2009, Bergström et al. 2013, Bergström et al. 2014). Such potential population increase is more likely for stationary species and might be enhanced by fishery restrictions within the array. The aggregation of fauna is not beneficial for all; increased numbers of predators means higher predation on other species, at and around the foundations (Wilhelmsson 2009, Bergström et al. 2014). As pointed out by Henkel et al. (2014) arrays of marine renewables may also aggregate apex predators such as sharks and marine mammals. Such predator congregations have been observed regarding porpoises in Danish and Dutch offshore wind farms (Lindeboom et al. 2011). It is further possible, though not established, that installations of some marine renewables (i.e. wave power) will provide suitable habitat for sea birds or sites for migrating birds (Grecian et al. 2010, Langhamer 2012) and that colonization by diving birds would generate an intensified predation on e.g. fish and mussels within the array (Grecian et al. 2010).

11
Hydrodynamic changes
As foundations and score protections occupy part of the water column they interfere with water flux and sediment dynamics (Miller et al. 2013). This can cause local hydrographical changes and alter sediment compositions around individual foundations, as have been shown for offshore wind power (Brabant et al. 2012). Changes to bottom sediment fauna, caused by hydrodynamic changes and the reef-effect combined, have been demonstrated to reach up to 50 m from wind power foundations (Degraer et al. 2012). In the case of tidal turbines, and possibly wave power, large arrays may have more fundamental effects on hydrography and sediment structure surrounding the entire array (Shields et al. 2011, Frid et al. 2012, Neill et
al. 2012). The appearance of such an effect would strongly depend on local conditions, including the type of bottom substrate, and may ultimately cause ecosystem change over a larger area (Miller et al. 2013). Moreover, if currents are altered the transport of biological propagules (e.g. eggs and larvae) may be affected, with implications for marine connectivity (Shields et al. 2011). In regard to offshore wind power another postulated, though not proven, oceanographic effect is that large wind farms may create wakes of low air pressure, in turn causing convection in the upper ocean layers followed by a local upwelling (Broström 2008). Effects of noise emissions
It is known that offshore wind power emits low frequency noise during operation and its possible effects have received attention (Wahlberg and Westerberg 2005, Andersson 2011). The wind power noise originates from mechanical vibrations in the gearbox. The noise transplants through the tower to the foundation and further out to the surrounding water and sediment. Typical source levels are 130-150 dBRMS re 1 µPa at 1 m (60-300 Hz) although there is variation among turbines (Hildebrand 2009, Andersson 2011). The noise transmission depends on environmental conditions such as depth, water properties, temperature, and sediment type (Urick 1983). Theoretically, fish with good hearing can detect this noise over tens of kilometers and avoidance can be expected within a few meters from foundations. For tidal turbines, where turbines are positioned under water, the noise can be expected to be louder than for offshore wind power. Based on few available measurements and recalculations for different tidal turbines noise levels could range from 145 to 175 dBRMS re 1 µPa at 1 m at low frequencies (<1 kHz) (Pine et al. 2012, Copping et al. 2013). This indicates that tidal turbines will be audible (but not harmful) to many marine animals over very long distances, even if the ambient noise levels are higher in turbulent water. Noise emissions from wave power are expected to be lower than for tidal turbines: approximately 140 dBRMS re 1 µPa at 1 m (100-200 Hz) (Pearson et al. 2010, Copping et al. 2013). Noise from OTEC is thought to be slightly lower than this (Rucker and Friedl 1985). It has been argued that elevated ocean noise levels in general may produce chronic stress among marine animals with good hearing, thus emphasizing the cumulative effect of noise from multiple sources (Slabbekoorn et al. 2010). So far, such subtle effects have not been well researched. A recent study, however, showed that gadoid fish present at wind power foundations were not in worse physical condition than fish in control areas (Reubens et al. 2013). It has further been argued that an increasingly noisy environment may affect the communication among animals through partial masking (Wahlberg and Westerberg 2005). Such masking effects have been indicated for fish in freshwater systems. It should be noted

12
here that noise from marine renewables in operation is much lower than noise from commercial ships (~190 dBRMS re 1 µPa at 1 m) (Hildebrand 2009, McKenna et al. 2012). In addition to the above discussed effects of noise as sound pressure waves, underwater noise may also affect marine organisms through particle motion. In contrast to sound pressure, particle motion can also be detected by invertebrates and fish without swim bladders. For offshore wind power the detection range of particle motion has been estimated to be approximately 10 m, with variation among species (Andersson 2011).
Transmission cable effects
Offshore wind power, offshore wave power and tidal turbines all generate electricity that needs to be cabled to shore. Electricity from individual units within an array is collected in one or several offshore transmission stations. Land transmission cables then carry the electricity ashore, using either high voltage direct current (DC) or high voltage alternating current (AC) cables. The electromagnetic fields of these high voltage cables may be detected by specialized marine animals. The electric component of an electromagnetic field is effectively shielded by cable armor and cannot be detected at distance (Gill et al. 2005). However, the magnetic component of the field cannot be shielded. This magnetic field further gives rise to an induced electric field. The magnitudes of the magnetic- and the induced electric fields depend on cable dimensions and phase configuration. The field magnitudes increase with electric current; for a given power the fields are therefore lower in cables with higher voltage (Gill et al. 2005). A twisted three-phase configuration may further decrease the fields. Regarding the induced electric field, bottom sediment type also has great influence on the field magnitude. For most cables however, weak electromagnetic fields remain a few meters above the cable. Magnetosensitive animals use the Earth’s magnetic field for navigation, including species of marine mammals, chelonians, crustaceans, elasmobranchs and some bony fish (Lohmann and Lohmann 1996, Boles and Lohmann 2003, Gill et al. 2005). These animals may be disturbed if entering and detecting an artificial magnetic field caused by a cable (Gill 2005). Effects are likely to be subtle, and more pronounced at DC cables than AC cables since the magnetic field of DC cables is more similar to the Earth field. No effects have been established regarding species compositions around existing cables (Andrulewicz et al. 2003, Hvidt et al. 2004) but a slightly delayed migration (~40 min) was found for European eel crossing 130 kV AC cable (Westerberg and Lagenfelt 2008). Even less is known regarding effects of the electric fields. Some electrosensitive animals might not be able to detect AC cables because the alternation frequencies are high (Gill et al. 2005). Elasmobranchs have extraordinary electrosensitivity due to their Lorenzini ampullae organ (Kalmijn 1982) and for these fish electric fields from unburied AC cables have been reported to trigger foraging behavior (Gill et al. 2005). Furthermore, Boehlert and Gill (2010) mention that cables may also heat up surrounding sediment and water during periods of high production. Such warming has been estimated to a maximum of 0.5 °C at 5 m distance from the cable in still water (Hammar et al. 2006). Based on the literature, it remains possible that transmission cables from marine renewables will have subtle effects on particular species, including disturbed migration (Bergström et al. 2012) and attraction of predators (Henkel et al. 2014). But no changes to the benthic communities around cables have been shown (Lindeboom et al. 2011).

13
Leakage of toxic fluids
Leakage of toxic turbine lubricants have been observed at land based wind power (Arvidsson and Molander 2012). Modern offshore wind power has collector systems to prevent lubricant spills during turbine failure but submerged turbines may be more difficult to encapsulate safely. Turbines contain <500 l of lubricants and leakages would generate localized effects in turbulent waters. However, hinged attenuator wave power devices with hydraulic systems contain larger quantities of transmission fluids. Potential leakages of wave power transmission fluids have also been discussed, although not much in the scientific literature, and some developers state the use of biodegradable fluids as a potential solution.
Collisions
The wing span, or rotor diameter, of offshore wind power typically exceeds 100 m and during normal operation blade-tip speeds measure 60-80 m/s. This causes a risk of collision for flying animals, particularly when visibility is poor (Grecian et al. 2010). It is well known that bats occasionally collide with onshore wind power rotor blades (NWCC 2010). At some onshore wind power locations the loss of migrating bats can be high during unfavorable conditions and there are indicia of offshore wind power posing a similar threat to bats that migrate over sea (Arnett and Baerwald 2013). Offshore wind power also poses both collision risks (e.g. gulls, eagles and gannets) and habitat displacement effects (e.g. divers and scooters) to marine birds (Grecian et al. 2010, Furness et al. 2013). Although collisions with birds occur at low rates an extensive expansion of offshore wind power may cause significant cumulative effects (Busch et al. 2013) if migration routes are not considered during planning. In a similar way, collisions may also occur between marine renewables and marine animals. It has been mentioned that large animals may collide, or be entangled, with wave power devices (Cada et al. 1997, Inger et al. 2009, Grecian et al. 2010), but most concerns regard collisions with tidal turbines. Many of these devices rely on similar rotor principles as wind power, but are much smaller. The rotor diameter of the largest tidal turbine is 20 m and the blade-tip speed of any rotor is restricted to ~12 m/s because higher speeds would cause cavitation. Marine animals move slower than flying birds and bats and underwater visibility is far lower than in air. Whether marine animals such as whales, seals, fish, turtles and diving birds, will collide with turbine devices of different designs remains unknown (Cada et al. 1997, Inger et al. 2009, Boehlert and Gill 2010, Grecian et al. 2010, Frid et al. 2012).

14
Effects of OTEC water redistribution
OTEC plants differ much from other marine renewables. Because the conversion efficiency is low, large quantities of water have to be pumped in and out of the facility. This massive exchange of water between different depths raises several concerns. If the discharge water is released at considerate depth (in the aphotic zone) impacts are likely to be small for single units, but if discharge water reaches the upper layers, as a cause of inadequate design or unforeseen water movements, the altered water properties (temperature, salinity, acidity) and contents of nutrients and possibly heavy metals may have ecosystem level impacts (Pelc and Fujita 2002, Boehlert and Gill 2010). Particularly the possible intrusion of nutrient rich water into coastal ecosystems, such as coral reefs, has been considered worrisome. The possible effect has recently been addressed by modeling works. Considering a 100 MW OTEC plant off Hawaii, with a discharge depth of 70 m, Grandelli et al. (2012) concluded that ecological effects of nutrient displacements would be negligible. In a similar study, Jia et al. (2012) likewise concluded that changes to the surface water would be negligible, but that nutrient levels would double below discharge depth (70 m). It was argued that possible ecological effects further depend on whether the currents at this depth would dilute the nutrient concentration before phytoplankton growth takes place (Jia et al. 2012). The water exchange of OTEC may also mean that marine animals will be entrained through the system and impinged at the intake screens (Pelc and Fujita 2002, Comfort and Vega 2011). At the warm water intake (at about 20 m depth) plankton, including eggs and larvae, are likely to be entrained. Considering that the intake flow is about 400 m3/s losses can be large if the intake is located where abundances are high. The level of impingement depends on screen mesh size and intake water approach speed. With large mouthpiece diameters most fish and larger animals will be able to avoid impingement. At the cold water intake, however, screens cannot be easily maintained and are therefore rarely considered. Here, deep sea organisms of any size may easily be entrained. Samples from an OTEC pilot plant deep water intake have shown entrainment of anglerfish and several other deep sea animals (Comfort and Vega 2011). Without effective deep water intake screens OTEC full scale plants may have unforeseen effects on deep sea fauna. Lastly, it has been argued that if ammonia or other toxic solutions are used as working fluid in OTEC plants, accidental leakages may have local effects (Pelc and Fujita 2002). Cumulative effects
One major uncertainty regarding marine renewables is the quandary of cumulative effects. There is a growing awareness that the combined effect of multiple co-occurring stressors to marine ecosystems might be too important to overlook. The concerns of cumulative effects are profound in the recent literature on marine renewables (Gill 2005, Cada et al. 2007, Boehlert and Gill 2010, Wilhelmsson et al. 2010, Frid et al. 2012, Busch et al. 2013). In this field of research, cumulative effects are often referred to as the cumulative effect of multiple marine renewable energy projects. However, the broader discussion on cumulative effects in marine ecosystems concerns the combined impacts from all co-occurring human activities (Adams 2005, Crain et al. 2008, Ban et al. 2010). The research on how to handle cumulative effects in the marine environment is just emerging. Some approaches have been most concerned with the mapping of co-occurring stressors and their relative importance (Halpern et al. 2008a, Micheli et al. 2013). Other experiment based studies have mounted the enormous

15
task of investigating how different receptors respond to multiple stressors (Crain et al. 2008). Cumulative effect assessments are further complicated by the fact that organisms responding to environmental change also influence each other through food web interactions and connectivity (Adams 2005, Crowder and Norse 2008).
Point of departure and specific research objectives
The above presented summary of environmental effects of marine renewables shows that there are many uncertainties. Nevertheless, general conclusions can be made about the changes that will likely take place with the installation of a wind power farm. Currently there are no signs of long term negative effects beyond local changes to sediment structure and hydrodynamics. It is clear, however, that colonization and the reef-effect will cause relocations and, at some locations, an increased biodiversity though the evidence is limited to temperate waters. Research and monitoring in offshore wind farms have been concerned mostly with measures of abundance, such as colonization, attraction and displacement. Fewer studies have addressed effects on ecosystem functioning, such as production, reproduction, migration and the nursery role of nearshore habitats. Subtle effects from e.g. hydrodynamic change, noise, electromagnetic fields and hard substrate introduction on these ecosystem functions must be better understood to confidently assess ecosystem level risks and benefits of a large expansion of marine renewables. Therefore, targeting the effects on ecosystem functioning is an appropriate next step for research and monitoring regarding offshore wind power. There are only a few quantitative studies from marine renewables other than offshore wind power. As a result of the lack of research, scholars have used experiences from offshore wind power and other human activities as analogies for forecasting the potential effects. For a broad overview of the potential effects of marine renewables such review based extrapolations can be unproblematic. However, for detailed and system specific analyses there is a need for more stringent methods, in order to improve the differentiation between hypothetical and probable effects. For some specific stressors and effects, extrapolations across technologies are not very informative, given that the technologies are so different. Here, the most important issues for research to address are where high uncertainties are combined with potentially high magnitudes of effect. Two such issues are collision risks and deep sea entrainment. Little is known regarding the possibility of collisions between fast-moving turbines and animals (birds, bats, marine mammals, fish and others). If collisions occur at high frequency, or if vulnerable species are affected, the combined losses may be considerable in areas of heavy expansion of offshore wind power, tidal power or ocean current power. Regarding collisions, least is known about subsea collisions. Neither is much known about the potential impacts of deep sea organism entrainment at full scale OTEC plants. By drawing large volumes of water the deep water intake pipes may pose substantial risks to unknown deep sea populations. It is clear that site-specific combined effects of marine renewables and other human activities are difficult to foresee. With the increasing expansion of existing marine activities and the forthcoming exploitation of new resources a holistic approach to risk identification and management is needed.

16
The identified gaps in knowledge were the inspiration for the studies of this thesis. Specifically, I posed the following research objectives:
• Paper I: Identifying potential stressors from ocean energy (and deep sea mining) and relating these to stressors from already existing human activities and the quandaries of managing cumulative effects.
• Paper II: Developing and applying a method for using analogies (information on effects from other activities) to assess risks of offshore wind power on a vulnerable population of cod, including subtle effects on the function of cod spawning.
• Paper III: Quantifying the effects of a small tidal turbine on fish movements, based on field experiments.
• Paper IV: Illustrating the need for field data and improved models regarding collision risks for fish at large tidal turbines.
• Paper V: Developing a more inclusive collision risk model for hydrokinetic turbines, and contributing with model input regarding fish behavior in strong tidal currents.

17
Environmental assessment
frameworks Parts of this thesis are based on assessments while others are suggested as input to future assessments. An assessment is needed where knowledge is too scarce to provide certainty. Therefore, assessments are always associated with uncertainties. The origin and importance of uncertainty are discussed later in this thesis, but it is essential to acknowledge that assessments always maintain a degree of uncertainty. However, proper methodology can increase the level of confidence in any assessment. In practice, the implementation of new technologies with possible effects on environment is regulated through Environmental Impact Assessments (EIA). This EIA approach is nearly universal, including the participation of 191 out of 193 United Nation member countries (Morgan 2012). For marine renewables to be implemented, each project must consequently be evaluated on the basis of the EIA procedure. An EIA is participatory and project-oriented and aims to assess how a specific installation or activity may affect the environment, including impact magnitude (significant or not significant), range, persistence, reversibility and synergistic effects. The practical implementation of such assessments may, however, be less exhaustive (Morgan 2012). Overall, the EIA paradigm has likely greatly influenced many countries, by promoting early consideration of potential negative effects on health and environment, and by supporting careful environmental consideration among regulatory institutions. Nonetheless, the EIA procedure carries some noteworthy shortcomings. The major concerns regard high levels of subjectivity and low levels of assessment transparency, that is, it is rarely made explicit how conclusions have been drawn (Pastakia and Jensen 1998). Another criticism of EIA regards the limitations as a result of the project-oriented focus. In response to this, the Strategic Environmental Assessment (SEA) framework was developed, and has been extensively used in some countries (Morgan 2012). With SEA, impacts of multiple projects within a development plan can be assessed at the regional level. Like EIA, SEA has the purpose of decision guidance. It is generally assumed that cumulative effects are best addressed at regional level, but cumulative effects are not explicit in the SEA procedure. For this reason, Cumulative Effects Assessment (CEA) can be an integral part of SEA (Therivel and Ross 2007). CEA is a project-/plan-oriented framework that has a more receptor-oriented focus than EIA and SEA. The CEA can be described as a procedure for assessing impacts which are individually minor but collectively significant, covering the combined effects of previous, past and future activities on particularly valued receptors (Smit and Spaling 1995, Hegermann et al. 1999). In practice, it has often shown difficult to integrate (combine) the different assessment frameworks due to differences in scope and vague definitions and conceptualizations (Gunn and Noble 2011). Environmental risk assessment provides another discourse of environmental assessment, with deeper association to engineering and toxicology. Environmental risk assessment concerns risks both to human health and the natural environment (Burgman 2005), while the related Ecological Risk Assessment (ERA) framework focuses specifically on risks from human activities to the natural environment (Suter 1993a). The ERA has similarities with CEA, but is even more receptor-oriented. By focusing on a few selected receptors the ERA encourages more detailed analyses of receptor responses than what is typical for EIA and

18
SEA. The receptor orientation also makes regional level ERA (Moraes et al. 2002, Landis and Wiegers 2007, O'Brien and Wepener 2012), particularly apt for addressing cumulative effects. Most importantly, ERA involves a distinct separation between parallel steps of analysis, which increases transparency. The more quantitative and criteria-based approach of an ERA in comparison with an EIA further reduces subjectivity. For these reasons, I have used ERA as the main methodological framework of my work5.
The Ecological Risk Assessment (ERA) framework
ERA is a renowned science-based procedure for informing environmental decision making by estimating the level of risk posed by human activities to ecological receptors (Norton et al. 1992, Barnthouse et al. 2008). In general terms, risk can be defined as the chance, within a time frame, of an adverse event with specific consequences (Burgman 2005). Within ERA, risk assessment can be described as the process of assigning probabilities and magnitudes to adverse effects of human activities to ecological receptors, as defined by Suter (1993a). The potential cause of the adverse effect is described as the stressor. Many ERA applications regard the possible release of toxic chemicals and its effects on organisms in the recipient, where the assessment task involves quantifying the relationship between the initiating event and the effects (Suter 1993a). In the ERA framework by the US Environmental Protection Agency (Figure 3), the analysis phase is divided into exposure assessment and effects assessment, followed by a risk characterization phase. The specific means for completing each phase vary among applications and in some fields of ERA exposure assessment is not equal to assigning probabilities of events but instead an investigation of exposure levels needed to calculate effects (US EPA 1998). Within fisheries, Fletcher et al. (2002) applied a qualitative ERA to estimate the likelihood for each fish species to be affected by different fisheries and the population level consequence of the same fisheries. Likelihood levels and consequence levels where assigned scores and for each species risk levels were calculated as the product of the two. The applied risk levels ranged from negligible (management not needed) to extreme (significant additional management needed) and were used as basis for fish stock management, including the allocation of further assessment efforts (Fletcher 2005). This way of expressing risk as a function of probability (will it happen?) and magnitude of effect (how bad can it be?) is common within ERA. It can be particularly appropriate where predictive assessments are to be used in a broader decision making context involving more than ecological aspects (Suter 1993b). Given the separation between probability (or exposure) and magnitude stringent criteria can be used and declared; assessment uncertainties can be expressed or quantified (Burgman 2005). This transparency is a strong advantage of ERA in comparison with for example EIA. Within ERA, stressors describe any chemical, physical or biological entity that can induce adverse effects on receptors. Receptors, in turn, can be individuals, populations, communities or ecosystems (Norton et al. 1992). Although ERA can be applied on individual receptors it is often more meaningful to assess risks to populations (or higher levels of organization) (Biddinger et al. 2008). Here, effects over spatial and temporal scales are important. For
5 I have applied ‘ERA thinking’ throughout most of the thesis, including language and analytical tools, but only
Paper II is carried out as a full ERA study.

19
instance, effects on receptors in a small part of their range or during a short period of time will typically reduce the magnitude of effect and thus the risk. ERA can be applied for both retrospective and predictive purposes. In the case of ecological risks from marine renewable energy, whereof most technologies do not exist on large scales yet, assessments will naturally be of predictive kind.
Figure 3. The ERA assessment procedure is a sequence comprising the following steps, in order: problem
formulation phase, analysis phase, and risk characterization phase. Typical components of each step are
indicated in brackets. The main flow of the ERA procedure is indicated by the arrow, but the procedure is iterative.
While risk management is not part of the ERA procedure information, such as monitoring results, it should ideally
be fed back in order to update the assessment.
In the early stages of risk assessment the problem formulation phase involves a first identification and description of potential hazards. This early procedure can be described as hazard identification and its function within risk assessment is illustrated in Figure 4. It basically involves compiling a list of hazards (and their specific stressors) associated with the problem under assessment (Burgman 2005). This can be done through activities such as expert brainstorming and literature review. One good example is the screening of impacts to marine ecosystems from human activities in the Northeastern US, arranged and published by the National Oceanic and Atmospheric Administration (NOAA) (Johnson et al. 2008). Here, expert panels were formed at a workshop and given the task of identifying and ranking the importance of regional human activities and their associated stressors to marine organisms. The importance of each stressor was ranked and subsequently described through literature review. The work by Johnson et al. (2008) was used as a foundation for Paper I, which has the function of a hazard identification for marine renewables in this thesis. Among the many other tools within ERA I have used weight-of-evidence analysis to separate between potential and more probable effects of offshore wind power on cod
Risk characterization(risk estimates, uncert-
ainties, conclusions)
Definition of scope(receptors, stressors,
relationships)
Exposure assessment
(assigning probabilities)
Risk management
Effects assessment (assigning effect
magnitudes)
Problem formulation
phase
Analysis phase
Risk characterization
phase

20
(Paper II) and probabilistic risk analysis to model collisions between fish and tidal turbines (Paper V). The methodological contributions attained by modifying or applying these tools will be described after the following presentation of the main results.
Figure 4. Hazard identification in the context of ERA. Diagram with inspiration from the Center for Chemical
Process Safety (2014).
Information
Hazard
identification
ERA
Field experiment
Monitoring
More
detail
More
certainty
More
cost
Less
detail
Less
certainty
Less
cost

21
On receptors, stressors, effects and risk
In ERA and elsewhere it is important to clearly define the receptor under assessment. The organism level can vary, and the population level can often be considered an appropriate balance of meaningfulness and detail (Biddinger et al. 2008). Since all populations/species cannot be considered in a detailed assessment receptors have to be selected. The value of different potential receptors can be decided upon using different criteria, such as societal and biological relevance, definability, measurability, and susceptibility to considered stressors (Suter and Barnthouse 1993).
A stressor is what can induce an unwanted (adverse) effect on a receptor (Norton et al. 1992, Burgman 2005). A human activity, or a marine renewable energy device, is not itself a stressor but can be a stressor source (Burgman 2005). A stressor is consequently the messenger between source and effect (the mechanism can be described as the stressor pathway). Stressors from marine renewables to ecological receptors can be, for instance, a moving rotor blade, noise, nutrients or water temperature change. The introduction of new hard substrates is a more questionable example. For many organisms new substrate does not lead to adverse effects, and in many cases it is quite the opposite. However, being a manmade change to the natural environment some would argue it is, per definition, unwanted and it has been categorized among stressors in Paper I.
An effect is a change to the receptor (Burgman 2005). Although effects can be positive or negative an effect caused by a stressor is generally unwanted. Direct effects from marine renewables can be for example mortality, stress, growth (algae blooms) or displacement. The probability or exposure determines how likely the effect is, or how much of the receptor that will be affected. The magnitude of effect determines how severe the consequences of the effect will be. The combined probability and magnitude can then be used to determine the risk. On the population level, risk can be related to changes in expected population longevity. On ecosystem level, risks can refer to changes in ecosystem functioning.

22
Effects and ecological risks This chapter summarizes the main findings regarding stressors, effects and ecological risks of studied marine renewables.
Will marine renewables introduce new stressors in the
ocean?
The main objective of Paper I was to identify potential stressors from emerging industries that target ocean resources, such as ocean energy, and relate the findings to the current situation of stressors in the marine environment and uncertainties regarding their effects. Anticipated stressors from ocean energy and deep sea mining6 were inventoried based on the scientific literature. These stressors were then compared to already existing stressors from common human activities with more well-known effects on marine ecosystems. Cluster analysis was used as a means of comparison of stressor-composition (i.e. the combination of different stressors associated with each technology or activity). By the simple cluster analysis (joining-tree) the similarities among activities/technologies were indicated through Euclidian distances. The study demonstrated that most of the stressors associated with ocean energy are already common in the ocean. It was also shown that the number of expected stressors from ocean energy technologies were high in comparison to existing human activities with impact on marine ecosystems. This means that if ocean energy expands and becomes common, the different technologies will induce many different stressors to the environment. It does however not reflect the magnitude of effects, since stressor intensities could not be included in the study (as it was not site-specific). Among the ocean energy technologies, and among all considered activities, OTEC were associated with most stressors. In difference to the other technologies, OTEC remained as a particularly diverse stressor source when considering only continuous stressors, related to the operation phase. Based on the cluster analysis, the stressor-compositions of wave power, tidal turbines and ocean current turbines are quite similar. Therefore, the combined effect from technologies within this cluster may have similarities extending beyond effects of single stressors. This cluster was found more related to offshore wind power than to other existing human activities. Since much information is available regarding effects from offshore wind power (Bergström et al. 2014) this technology can be considered particularly apt as an analogy for guiding assessments of the other marine renewables. This regards not only effects and risks but also methods for risk reduction. This analogy-argument is not new to the scientific community, see e.g. Simmonds and Brown (2010), but is worth reiterating when considering how to address the potentially great expansion of marine renewables. The stressor-composition of OTEC was however very different from other technologies and activities. Combined effects from OTEC stressors may therefore be particularly difficult to foresee on the basis of analogies. The fact that OTEC also implies introduction of stressors in previously less affected and less studied deep sea ecosystems gives raise to specific concerns regarding this technology. Particular uncertainties regard effects of water
6 Deep sea mining represents other emerging industries targeting extracting ocean resources. Deep sea mining
industries were analyzed in similar ways as ocean energy in this study.

23
redistribution and entrainment of organisms from the deep sea. Even though entrainment occurs in thermal power plant cooling systems and desalination plants information from these technologies is limited in the amount of guidance it can provide for informing risk assessments concerned with OTEC deep sea entrainment. This is because OTEC deep water intakes have higher flow rates, may not use screens to protect large animals from being entrained and may affect animals barely known to science. Deep sea organisms are thought to be particularly vulnerable due to slow reproduction rates and limited resilience to environmental changes (Glover et al. 2010, Ramirez-Llodra et al. 2011). Fast-moving rotors of large hydrokinetic turbines were also identified as a stressor type where direct analogies cannot be found among existing technologies and activities. Subsea collisions do already occur, as ships and other high-speed vessels are known to collide with, and cause damage to, marine animals (Laist et al. 2001, Speed et al. 2008). However, the movement patterns of fast-moving keels and bows are very different from rotating rotors and, unfortunately, the collision risk mechanisms are not well understood. This was further addressed in Papers III-V. An important, although not knew (Halpern et al. 2008a, Ban et al. 2010, Micheli et al. 2013), message from the stressor inventory in Paper I is that marine organisms are affected by a multitude of concurrent stressors from various human activities. Fish catches, nutrient loading, ship noise, invasive species and fast-moving recreation vessels are just a few examples. In many areas, the installation of marine renewables would not create many additional stressors though they may add to those already existing. The aspect of cumulative effects has not been the focus of this thesis, but the topic is fundamental and will be touched upon in the discussion chapter.
Offshore wind power: can we assess with confidence?
Even though there are many studies on cod abundance in offshore wind power installations (Winter et al. 2010, Reubens et al. 2011, Bergström et al. 2013) there is yet no direct information on how wind power might affect cod reproduction. This has caused a long lasting dispute regarding a specific wind power project that is proposed at the spawning ground of a vulnerable cod population in Kattegat. The Swedish environmental law is based on the precautionary principle, so that the developer has the responsibility to demonstrate that any environmental impact will be tolerable (non-significant). The specific case is of interest since it raises questions about how far one can draw conclusions about risks based on indirect evidence. If trustworthy assessments only can be done on the basis of direct evidence marine renewables will often be prohibited on precautionary reasons, or industry developers will have to conduct extensive experimental research studies for each disputed case. In Paper II this wind power vs. cod case was addressed through a semi-quantitative ecological risk assessment. Using analogies, information with bearing on offshore wind power and effects on cod was analyzed based on weight-of-evidence (WOE) methodology. The risk assessment showed that impulsive sound from pile driving during the wind farm installation is likely to cause severe effects on cod spawning, thereby posing a high risk to the vulnerable population. The effect of impulsive sound on cod recruits was categorized as a moderate risk. For non-spawning cod, the effect of impulsive sound was found to pose a low risk, as was the effect of sediment dispersal on cod recruits. Other stressors, including turbine noise, vessel

24
noise, electromagnetic fields and leakage of toxic lubricants, were found to pose no or insignificant risks (Figure 5). The study indicated that almost all risk was associated with pile driving and that all risk was related to the wind farm construction phase. Similar results have been found elsewhere (Simmonds and Brown 2010) and it can be concluded that other foundation technologies than piled monopiles would imply significant reductions of ecological risks. Additionally, the study also demonstrated how effective risk reduction could be achieved by scheduling piling activities with respect to biologically sensitive periods. If no pile driving takes place when cod are aggregated for spawning or recruits are abundant in the water (typically December-June), then the risk posed by the wind power project to cod is low (Figure 5). The study further indicated that turbine noise emitted during the operation phase may only cause negligible adverse effects, if any. This conclusion is important because the possibility of subtle effects of turbine noise to spawning cod has been debated among Swedish scholars and authorities. Though it was not conclusive whether there is a causal relationship between turbine noise and partial inhibition of spawning, it was shown that the potentially affected proportion of the spawning stock would be negligible and thus the magnitude of the effect insignificant. As mentioned in the introduction a relevant study regarding stress-related effects of noise was recently published (Reubens et al. 2013), indicating that cod occurring by turbine foundations were in a similar condition as cod caught in control areas. With this information, stress-related negative effects to cod in operating wind farms seem unlikely. Overall, Paper II concludes that with ecological risk assessment methodology it is possible to make confident assessments, and thus informed decisions, even where indirect evidence is contradictory.
Figure 5. Risk matrix for the investigated offshore wind power farm and its effects on a vulnerable cod population.
Arrows indicate risk reduction options through scheduling construction events with respect to cod reproduction
periods. For interpretation see Figure 3 and 4 in Paper II.
C.noise–Dev
T.noise–Dev
E.fields–Dev
T.noise–Spa
Tox.lub–Rec
T.noise–Rec
S.partic–Rec
E.noise–Dev
E.noise–Rec
E.noise–Spa
Negligable
(M 0)
Minor
(M 1)
Moderate
(M 2)
Severe
(M 3)
None
(L 0)
Unlikely
(L 1)
Undecided
(L 2)
Likely
(L 3)
Magnitude of effect
Like
lih
oo
do
fe
ffe
ct
3
2
1 32
4 6
6 9
0 000
0
0
0

25
Will tidal turbines kill a lot of fish?
In Paper I the question of whether marine fauna may collide with the fast-moving rotor blades of hydrokinetic turbines was identified as one of the most important uncertainties regarding marine renewables. This issue was specifically addressed in Papers III-V, with focus on tidal turbines and fish. Small tidal turbines
Paper III addressed effects of a small tidal turbine on fish. The study was designed as a field experiment where fish movements around a replica of a small vertical-axis turbine rotor were recorded and compared with control conditions. The results, based on a large number of fish from 37 different taxa, showed that virtually no fish entered the spinning rotor. The exceptions were two cleaner wrasses (Labroides dimidiatus) that entered the rotor while it was rotating slowly. Cleaner wrasses are agile fish used to approaching larger predatory fish (Bshary 2002), which may explain their boldness in comparison to other fish. It was further shown that the number of fish passages between the rotor and the surrounding rock formations was significantly (P <0.001) reduced when the turbine was in place and rotating. This was interpreted as a deterring effect reaching beyond the rotor radius. Although this deterrence was clearly shown for the fish assemblage as a whole, it could not be statistically shown for all taxa. Some taxa appeared to be less affected than others, which may be related to taxa-specific behavioral traits. Two common and less affected fish taxa were stumpnoses (Rhabdosargus spp) and wrasses (Thalassoma spp). The wrasses were mostly comprised of Crescent tail wrasse (T. lunare), a species known to be inquisitive (Kulbicki 1998) (Figure 6). When the rotor was in place there was a negative correlative relationship (R2=0.509 P <0.001) between fish passages and current speed. This effect was not shown for control conditions, which indicates that the deterring effect was enhanced by current speed and that fish are more cautious of the potential rotor hazard when the current is strong. This finding may be related to the fact that the investigated rotor spun faster in strong currents but may also be related to lower fish maneuverability in strong currents and turbulence, making fish keep a larger safety distance from the rotor. The latter hypothesis was supported by the finding that fish-turbine distance was significantly lower for fusiform than for compressiform fish, when the rotor was present. Body shape influences maneuverability in strong currents (Liao 2007) and keel-shaped compressiform fish can be expected to be less maneuverable and more sensitive to currents than fusiform, streamlined, fish. The study also indicated that most benthic (bottom dwelling) reef fish kept a minimum distance of about 0.3 m from the rotor (Figure 7) while trevallies (Caranx sp.), which are large pelagic associated fish, were more careful and never moved closer than 1.7 m from the rotor when currents were strong (Figure 6).

26
Figure 6. Left: small reef fish (Thalassoma lunare) moving past the rotor in counter current direction. Right: shoal
of large fish (Caranx sp.) keeping distance to the rotor.
Figure 7. Stereo-video tracking of random fish specimens (red lines) that move around or below (dotted red line)
the small turbine rotor (Ø=0.7 m, height 1.5 m) investigated in Paper III. In this plot the scenario is represented
from above, with the turbine perimeter indicated (+++).
By this study it could be concluded that fish of the investigated taxa are unlikely to collide with vertical-axis turbines under daylight conditions. As mentioned in the introduction there are only two other reported quantitative field studies on fish movements around tidal turbines. Broadhurst and Barr (2011) investigated a horizontal-axis turbine in temperate waters and did not register any collisions. Conversely, Viehman (2012) showed that temperate pelagic fish often, but not always, managed to avoid entering a rotor similar to the one investigated in Paper III, but located close to the surface. In that study, nighttime conditions were compared to daytime, and it was found that numbers of fish entering the turbine were higher during the night. In conclusion, collisions between fish and small tidal turbines seem rare, at least during daytime conditions. However, even at low collision risk, the deterring effect showed in Paper
III indicates that systems with serially mounted turbines may hinder fish movements and thus migration. Therefore, in habitats important for fish such turbine systems should be designed with openings of several meters free space in order to allow large fish to pass through.
-1000-500
0500
1000-1000
-500
0
500
1000
-3000
-2500
-2000
-1500
-1000
Y (mm)X (mm)
Z (
mm
)

27
Large tidal turbines
The above described findings is limited to small turbines with large turbines posing different threats. Large tidal turbines have diameters up to 20 m and the Deep Green device, with its ~100 m long wire, moves across a very large water volume. Because of turbidity the visibility range is typically low in coastal current influenced environments. When an animal is near enough to visually detect a large turbine the rotor blades may be close and it is not certain that the turbine will be perceived as one object (Figure 8). Moreover, large turbines typically have rotor blades where the blade tips cut through the water at very high velocity (~10-12 m/s), which is beyond swimming speeds of most marine animals (Wilson et al. 2007).
Figure 8. Visual perception of (a) large turbine and (b) small turbine given a limited visibility range. While fish will
see the whole of the small turbine soon after detection, the large turbine will never be fully within the range of
visibility and the rotor blades may be perceived as separate objects.
Given the lack of data, the collision risk at large turbines has previously been assessed through geometric-area based models calculating the probability and consequence of encounters between animals and turbines, without much involving the ability of active avoidance among the animals (Copping et al. 2013). Such a model, adapted from Schweizer et al. (2011), was implemented in Paper IV. Biological variables for three different kinds of fish (sergeant fish, barracuda and bullshark) were assigned as probabilistic distributions and the model output was compared for two different turbine designs: a fast-rotating small turbine with three rotor blades and a slowly rotating large turbine with two blades. The results indicated high collision probabilities for the large fish (barracuda and shark) (Figure 9). For instance, the most common collision probabilities among barracudas of the described population7 were 25% at the large turbine and 99% at the small but fast rotating turbine. It was concluded that animal behavior needs to be incorporated for the model to generate informative results, with previous work on collision risk models having reached the same conclusion (Wilson et al. 2007, Schweizer et al. 2011). Previous approaches to partly involving animal behavior in the models have been to assign arbitrary probabilities for avoidance (Sparling and Lonergan 2013) or swimming depth (Wilson et al. 2007, Schweizer et al. 2011), and to cautiously assume that avoidance does not take place (Verdant Power 2010).
7 The population refers to the probabilistic distributions used in the Monte-Carlo simulations, based on field study
observations.

28
Figure 9. Probability of collision (P) for barracudas entering two different tidal current power turbines at a current
speed of 2.4 m/s. The blue line is a large (Ø=16 m) but slowly rotating (rpm=14) two-bladed turbine (1200 kW
SeaGen S design) whereas the red line is a smaller (Ø=5 m) quickly rotating (rpm=40) three-bladed turbine
(35 kW Verdant KHPS design). The model was applied through a Monte-Carlo simulation with biological variables
(body length, body orientation and swimming speed) assigned as distributions based on field observations. The
Y-axis indicates how P varies within the population described by the probabilistic distributions of biological
variables. Peak values of P can be interpreted as the most common value within the population, or as the most
probable value for a random specimen in the population.
In Paper V, a more inclusive collision risk model was suggested. Based on previous work (Wilson et al. 2007, Pearson et al. 2010, Schweizer et al. 2011), a probabilistic risk model was developed. In this model, each separate event necessary for leading to a fatal collision was made explicit. Biological aspects such as natural movement patterns, avoidance and close range evasive maneuvers were incorporated. The two parts of the model where information was most scarce and behavioral traits believed to be most influential were investigated in more detail. First, quantitative data on natural fish movements in strong currents were collected in the field in order to improve the understanding of how fish utilize areas where tidal turbines may be deployed. Second, two theoretical models were developed, describing the probabilities that fish will be able to actively avoid a detected turbine, based on different behavioral strategies. The field observations, collected in tidal influenced waters in Mozambique, showed weak negative correlative relationships between current speed and fish frequency (the number of fish entering the recorded area per time), both at nearshore (R2 =0.34, P <0.01) and offshore (R2 =0.20, P <0.05) locations. At current speeds above 0.8 m/s the numbers of fish quickly dropped and from 1.1 m/s no fish were observed. This result was based on pelagic associated fish in subtropical waters, but a similar pattern has been reported from temperate waters (Broadhurst and Barr 2011). This negative relationship between fish and current speed indicates that fish abundances can be expected to be low at tidal turbine sites, when the current is strong enough for turbines to operate. The field observations also showed that fish were more likely to swim in the current direction (P <0.01) and to be in the pelagic part of the water column (P <0.01) when current speed increased to 0.7–0.8 m/s. Drawing on these field
0 0.2 0.4 0.6 0.8 10
0.05
0.1
0.15
0.2
0.25
0.3
Probability of collision (P)
Dis
trib
utio
n w
ithin
pop
ula
tio
n
Collision risk for barracuda

29
study results, few fish will come across operating tidal turbines, but if doing so, they will likely approach the turbine with the current and at a similar depth as the rotor. When approaching fish detect a turbine they may attempt to avoid collision by swimming away from the perceived hazard. Although fish will first detect a turbine by hearing the emitted noise (Halvorsen et al. 2011) the sound is not loud enough for avoidance to be expected among other than hearing specialists (Nedwell et al. 2007). For most fish, it is more plausible to assume that avoidance attempts will only be initiated when the rotor comes in view, as has been shown for fish in regard to approaching other objects (Guthrie 1986, Glass and Wardle 1989). Based on observations of fish reactions to small turbines (Viehman 2012; Paper III) and approaching fishing gear (Wardle 1986) two hypothetical avoidance strategies can be described. One strategy suggests that the fish turn around and actively swim against the current. The other strategy suggests that the fish bursts towards the edge of the turbine rotor. The two avoidance strategies were described and implemented as probabilistic models using input variables derived from the literature and from field observations of fish in natural conditions. The modeled avoidance failure rates varied among different fish, environmental conditions and turbines (see Table 2 in Paper V). In general, larger fish (trevallies) had a lower avoidance failure rate than small fish (sergeants) and lowlight conditions strongly increased the failure rates. For the larger fish the strategy of turning around was most effective but for the small fish the strategy of bursting towards the side was more or equally effective. Importantly, the simulations indicated that very few fish will successfully avoid turbines in conditions of strong currents and low visibility; this result is supported by Viehman’s (2012) study on a small turbine observed during night. Once avoidance is no longer possible and fish enter the rotor it is actually larger fish that will have a higher probability of being struck and injured by the impact of the rotor blade (Papers IV and V). Based on available data small fish is very unlikely to be harmed. In conclusion, the study in Paper V indicates that relatively few fish will come across operating tidal turbines and that although fish do exhibit avoidance behavior, fish that do come across operating turbines cannot be assumed to successfully avoid entering the rotor8. At night, avoidance will be difficult even for large fast-moving individuals. Once entering the turbine large specimens are not unlikely to collide (typically >30% for meter-sized fish) while small fish will more likely pass through (Papers IV and V; Copping et al. 2013). Size is a continuous variable; but small fish as referred to here are up to a few decimeters in size. The highest concerns regards meter sized fish (and other animals) with low swimming capacity. Risk and risk reduction
Avoidance rates and collision risks are not sole measures of ecological risk. For meaningful ERAs to be conducted case specific probabilities of turbine mortality should be compared to population sizes and dynamics (Wentsel et al. 2008). For large stable populations even a high rate of individual mortality may pose low risk. For example, Wilson (2007) estimated up to a 2% loss of Atlantic herring for a Scottish tidal power scenario. Even though this involves mortality of millions of fish per year, the risk was considered low for the population. For
8 Given the results, it appears highly likely that turbine designs where components move fast and across large
water volumes, like the kite-mounted Deep Green device, will be even more difficult to avoid than the
horizontal-axis turbines investigated in Paper V.

30
other species and populations even a loss of a few individuals can pose unacceptable risks. A precautionary example regards the risk posed to Harbour seals by a tidal turbine installed in North Ireland. Here, only a loss of 4 specimens per year was considered acceptable (Sparling and Lonergan 2013). Paper V indicated that large and slow swimming/accelerating animals are associated with substantial collision probabilities if they come across large tidal turbines. Some species of whales, sharks and turtles may thus be at particular risk, given that they utilize or pass through areas with strong currents. For instance, basking sharks and whale sharks are two vulnerable species (IUCN 2014) that utilize current-influenced waters for planktivorous foraging. These sharks are large and move slowly. Comparable conclusions have been drawn for marine renewables in general, suggesting that large predatory species may be at higher risk than others (Gill 2005, Henkel et al. 2014). Unfortunately, they may also be of highest importance to protect (Crowder and Norse 2008). Apart from the obvious option of avoiding turbine implementation in risk associated areas, some technical adjustments can be made to potentially reduce the collision risks. One option is to adjust the rotational speed of the rotor (or other moving parts). A lower rotational speed both reduces the probability of collision and the expected level of damage (Papers IV and V). Another option is to increase the detection and reaction distances (Papers III and V). Fish typically have a well-developed ability to distinguish objects by brightness contrast (Douglas and Hawryshyn 1990). Therefore, contrast rich or fluorescent colorations might be effective. The optimal color will vary among locations, depths and species of concern. In general, if a stimulus is to be seen as colored, its spectral reflectance curve must be changing in a part of the spectrum that coincides with the available light. In shallow turbid water red would be more conspicuous whereas in clear water yellow and to lesser extent blue will be more readily visible (Muntz 1990). In deep water white and fluorescent colorations are likely most readily detected. It may even be motivated to test luminous rotors and other fast-moving parts. Other possible ways of increasing detection and reaction distances include acoustic warning systems for marine mammals (Wilson and Carter 2013) and electric deterrence systems for sharks (Smit and Peddemors 2003) though careful consideration is necessary in order to reduce the possibility of creating stressors with higher impact than the actual turbines. To increase the level of deterrence implies that the barrier effect expands, which should be considered regarding turbine spacing in multiple turbine systems, as discussed in Paper III.

31
Methodological contributions Part of the aim of the thesis is to provide methodological contributions that will help to facilitate future risk assessments of marine renewables. Such contributions have been made in Paper II, on weight-of-evidence based ERA, and in Paper V on probabilistic modeling of collision risks. In both cases, the contributions can be regarded as minor adjustments of existing work in order to facilitate more accurate assessments. These adjustments were developed through iterative processes, associated with case studies.
Weight-of-evidence based ERA: applied on offshore
wind power
In Paper II we explore the possibility of combining ERA with weight-of-evidence (WOE) analysis in order to assess risks related to the previously described wind power vs. cod case. WOE is a well-established method used in many fields of research (Weed 2005, Linkov et al. 2009). It seeks to determine whether there is causality between stressors and effects on receptors, in absence of direct evidences. WOE analysis is based on a reliability ranking of different evidences that support causality. Such evidence can be collected from studies indicating effects from analogous stressors to the concerned receptor, as well as studies indicating effects from the concerned stressor to an analogous receptor. In previous applications of WOE in ERAs, the purpose has been to identify the most evident (well supported) causal relationship among several suggested lines of evidence (Menzie et al. 1996, Lowell et al. 2000). In this case, however, there was both supporting evidence (forming arguments pro causality) and contradicting evidence (forming arguments against causality). For Paper II some adjustments to previous WOE methods (Wiedemann et al. 2011) were done. Established criteria (Klimisch et al. 1997, US EPA 1998) were used to assign each evidence (i.e. indicium) a reliability score between 1 and 4, where 1 is a hypothetical claim and 4 is observed from a directly applicable scientific study. Then the relationships between supporting and contradicting evidences were outlined for each investigated stressor and receptor (‘developed cod’, ‘cod spawning’ and ‘cod recruits’). In doing so, evidence maps (Wiedemann et al. 2011) were created. Where the difference between contradicting and supporting evidence was ≥2, the weaker evidence was neutralized (removed). Each remaining argument (combinations of dependent evidence) was given a reliability score equal to the score of its weakest evidence. The reliability of causality was calculated based on the strongest (highest score) arguments, using Eq 1:
��������� = �� �� − �� �� (Eq.1)
where Rcausality is the reliability of the investigated causal relationship, RS MAX is the reliability score of the strongest supporting argument for causality and RC MAX denotes the reliability score of the strongest contradicting argument. Rcausality was then converted into likelihood scores (probability of effect). For Rcausality ≤ -2 the causal relationship between stressor and effect was categorized as Unlikely. The category Likely was assigned for Rcausality ≥3 and Undecided was assigned for Rcausality from -1 to 2.

32
Given the range of reliability scores (1-4) this grading system can be considered rather restrictive, having a high sensitivity to uncertainties. See the evidence map in Figure 10 for an example on the procedure. The likelihood categories were subsequently used to calculate population level risk scores in combination with criteria-based magnitudes of effect. The result gave that 7 out of 10 investigated causal relationships between stressor and effect were categorized as Undecided. Considering the many Undecided causal relationships the WOE based method in this case had limited effect on reducing uncertainties regarding what effects that can occur. But the process implied that the maximum range of effect (including Undecided effects) could be established and hence that the magnitude of effect could be estimated with confidence. Hereby, important and transparent conclusions on ecological risks and risk reduction could be drawn. A major advantage with the WOE based ERA approach is that the transparent structure facilitates for updates so that the risk assessment can be dynamic with little means of adjustments. Once more evidences become available from research and monitoring the evidence maps can be adjusted and likelihood and/or range of effect modified.
Figure 10. WOE map over the causal relationship between wind power turbine noise and spawning-inhibiting
effect on cod. Each “evidence” (A–I) has its reliability score indicated (corner circles). Evidences connected
through straight line (A–C) are dependent and form one argument. Other evidences form independent arguments.
The arrow indicates supporting argument and lightning-symbols indicates contradiction. Broken lines indicate
neutralized evidence. Grey fields show the type of response (BE = behavioral response), spatial range and
duration (CE = continuous) of effect. In this case, the resulting Rcausality was -1 and was converted to the likelihood
category (L2) Undecided. For associated literature references, see Paper II Annex B.
Turbine noise
exceeds back-
ground (A)
1 km / CE
3
Exposure to turbine noise inhibits
cod spawning
2 – 3 = -1
BE / 100 m / CE
The twopopulations
genetically
similar (I)
4
Cod spawn in
noisy
experimental
tanks (E)
1
No correlation
between
spawning and
low noise (G)
2
The two cod
populations
not comparable
(H)
1
Noise mask
communication
among fish (B)
3
L 2
Spawning in
the most noisy
areas in
Öresund (F)
3
Turbine noise
masked by
shipping noise
(D)
3
Masking may
inhibit cod
spawning (C)
2
<100 m / CE

33
Probabilistic risk analysis: applied on tidal turbines
Probabilistic risk analysis (PRA) is typically concerned with determining the statistical probability for an adverse event (effect) to occur in a defined system (Bedford and Cooke 2001). This tool was applied in two steps (Papers IV and V) for estimating collision risks at large hydrokinetic turbines (here discussed in terms of tidal turbines). The fate of three different fish species at two different tidal turbine devices was investigated in Paper IV, using a collision model slightly adapted from Schweizer et al. (2011). To account for parameter uncertainties the model was implemented as a Monte-Carlo simulation with biological data assigned as probabilistic distributions. The model describes the probability of collision (P) for fish entering the turbine and does not account for possible active responses among approaching fish. P is calculated using Eq. 2:
� =�×
�
������� ����
�� �! (Eq.2)
where n is the number of turbine rotor blades, R is the rotational speed (rpm), α is the angle formed by the water flow and the axial direction of the rotor, β is the horizontal angle formed by the fish body and the rotor, L is the fish body length, vw is the speed of water and vf is the swimming speed of fish. One modification to the original model was to incorporate the β angle, assuming that fish do not always swim in a straight line with the current. The other modification was to allow vf to take negative values, thus allowing fish to swim both in countercurrent and along-current direction. These model adjustments were based on field observations of fish movements, using a small sample of video recordings. However, it was later shown (Paper V) that fish rarely swim in countercurrent direction in strong flows. Therefore, to let vf take negative values in Paper IV was inadequate. See Figure 9 for an example of the model results. In order to incorporate behavioral parameters in collision risk modeling a fault tree based model was developed in Paper V. This model can be regarded as a synthesis of existing work covering parameters that have previously been pointed out as potentially important. Fault tree analysis is a deductive model based on Boolean logic where the probability of an undesired top event is calculated based on the probabilities of underpinning basic events (Bedford and Cooke 2001). There are some previous applications of fault tree analysis within ERA, particularly regarding biological pollution (invasive species) (Hayes 1998, Acosta and Forrest 2009), but it had not previously been used for modeling turbine collision risks. There were two reasons for applying the fault tree analysis for this study. First, the fault tree diagram explicitly shows all different relationships among events that are necessary for the top event to occur, thereby increasing model transparency. Second, a fault tree based model can easily be further developed to incorporate higher levels of detail. Based on the previous work on turbine collision risks (Wilson et al. 2007, Pearson et al. 2010, Schweizer et al. 2011) the necessary events for fatal collisions to occur can be summarized as (Figure 11):

34
• The turbine and animal must be in the same place at the same time
• The animal must fail to avoid the turbine
• The animal must fail to pass safely through the turbine rotor
• The animal must suffer severe damage from a potential collision
Figure 11. The suggested fault tree based collision risk model for calculating the probability of turbine mortality
(i.e. turbine interaction causing death to by-passing animals) for a given period of time. Turbine mortality is the top
event; other boxes represent events where probabilities can be calculated from underpinning events (using AND-
or OR-gates) or assigned through case-specific models or estimates. The broken arrow indicates that co-
occurrence can replace array passage if data describing the probability of specimens approaching the rotors are
available from field observations. Lower panel illustrates how different parts of the model relate to different spatial
scales.
AND-gate
OR-gate
Turbine mortality
PTM
Array passage
Pp
Turbine injury
Pi
Turbine entry
Pt
Hazard zone
Pz
Avoidance failure
Pa
Co-occurrence
Po
Hydraulic stress
Ps
Collision
Pc
Blade damage
Pd
Evasion failure
Pe
Blade incident
Pb

35
In more detail, the probability of turbine mortality (PTM) for each specimen of a specified population is here described as the combined probabilities of passing through the turbine array (Pp), entering the hazardous part of the turbine (Pt) and suffering severe injury from the interaction (Pi). For a by-passing specimen to enter the turbine it first has to co-occur (Po) in time and space with the operating turbine (at slack tide rotors are still), to fail undertaking an avoidance action (Pa) and to be unfortunate enough to enter the part of the rotor swept cross-section were rotor blades move fast (Pz). The probability of severe injury, in turn, can be broken down into the probabilities of hydraulic stress (Ps) (e.g. shear and pressure drops) and collision (Pc). The probability of (severe) collision further depend on the probability of the specimen to pass through the turbine at the same time as a rotor blade crosses its path (Pb), the probability of failing close-range evasion (Pe) and the probability of suffering severe damage from the impact (Pd). As illustrated in Figure 11 these events (model components) are all connected through so called AND-gates and OR-gates9. In fault tree analyses, the probabilities of events resulting from AND-gates are calculated as the product of their subordinate events and OR-gates are calculated as the sum of the underpinning probabilities minus their product (the probability of both happening). Therefore, PTM can be calculated as (Eq. 3):
�" = �# × �$ × �� × �% × &�� + �( × �) × �* − �� × �( × �) × �*+ (Eq.3)
Each of these model parameters has its own equation, which should be specified for each studied taxa and turbine design. For instance, Pb is assumed to be applicable for most animals and for horizontal-axis turbines and can be calculated from Eq. 2 above. The two theoretical avoidance models developed in Paper V for calculating (Pa) could not be validated because of absence of field data. It is therefore difficult to tell the scientific value of these contributions until more data are available. Until then, however, they may be used as a basis for continued discussion regarding fish avoidance. The presented collision risk model provides a foundation for calculating turbine mortality for population-representative individuals for a given time interval (or for any rotor-approaching individual, by setting Pp=1 and Po=1). But individual turbine mortality is not sufficient for estimating risks at the population level. PTM should therefore be converted to the number of animal deaths (NTM) per time, and then be related to population dynamics. Temporal variation is important to consider. Tidal current speed and light conditions, which have strong influences on the collision risk, vary over short time periods. The passing of animals through the turbine array may on the other hand vary over seasons. Therefore, the yearly number of mortalities should ideally be constructed from several model runs conducted for different times throughout the day and for different seasons.
9 Fault tree analyses typically involve AND-, OR- and NOT-gates, which are calculated differently.

36
Field study methods: contributions and reflections
Stereo-video analysis
Most of the field sampling for the appended papers (Papers III-V) is based on video observations. Video analysis can be rather time consuming, the spatial range is limited by water visibility and taxonomic identification can be difficult. However, as video observations can provide a level of detail outperforming any other method it has been recommended as particularly suitable for studying behavioral responses of fish in relation to marine renewables (Copping et al. 2013). By using stereo-video systems also quantitative data for a number of variables related to length and speed can be obtained, in addition to occurrence and behavior of fish. Stereo-video analysis is the process of having two spatially separated and fixed cameras simultaneously recording the same object, so that the object can be represented in a 3D coordinate system and spatial distances can be calculated using the same principles as two-eye vision (Harvey et al. 2013). The 3D representation is illustrated by Figure 7. Previous applications of the stereo-video methodology have been used mainly for abundance and length measurements, though never before for estimating speeds of currents and swimming speeds of fish. Neither has, to my knowledge, stereo-video been used for collecting data associated to marine renewables or fish responses to other human interventions. Previous observations of fish movements around tidal turbines have been collected by conventional video (Broadhurst and Barr 2011, EPRI 2011) or hydroacoustic instruments (Verdant Power 2010, Viehman 2012). Hydroacoustics have the strong benefit of being independent of water visibility (turbidity and light conditions) but are less detailed and do not provide differentiation between observed taxa. It is well established that stereo-video analysis generates accurate measurements of lengths and distances (Harvey et al. 2002). By using EventMeasure Software (SeaGIS 2013) each measured object is assigned with time (here with ~0.03 s intervals), 3D coordinate (x, y, z in mm) and error (RMS) measurements listed. This information was used for calculating the speed of drifting debris (used for current speed measurements) and the swimming speed of fish. By taking two successive measurements (separated by ≥0.2 s intervals for drifting debris and ≥1 s intervals for fish) the distance moved over time was obtained. Here, measurements with high error (RMS >20 mm) were excluded. Fish swimming speed was used as direct in situ observations, while current speed measurements were averaged over time, in order to compensate for variations caused by turbulence. This method was validated by a correlative analysis of camera based current speeds and speeds measured by a Doppler current meter (R2=0.93, P <0.05) (Hammar et al. 2012). The applied method thus generates adequate, although not exact, speed estimates. To measure the swimming speed of fish in field conditions can otherwise be difficult and the method can be recommended for estimating fish swimming speeds. From this method it should be noted that having a stable camera board is rather important. Errors quickly amplify if wave and current forces alter the position or direction of the cameras. In Papers III and V the stereo-video function was also used for estimating water visibility. This was done by measuring the length of same-sized objects (typically fish) at the maximum distance of horizontal view. The obtained distance to the measured object was used as a

37
representation of water visibility. For each visibility sample multiple measurements were conducted and the associated images were visually compared, as a means of validation. This method could not be statistically validated because of lack of established reference points. Aspects on the choice of field study location
All field sampled data (Papers III-V) were collected at Inhaca Island in southern Mozambique. The reason for this is that the first part of my PhD studies (not included in this thesis) involved the measurements of tidal currents in East Africa (Hammar 2011). This facilitated field study reconnaissance and it was found that the Estação de Biologia Marítima de Inhaca (EBMI 2014) provided excellent field work infrastructure and accessibility to strong current environments. In addition, the tidal current environments at Inhaca Island harbor very high fish abundances in comparison to alternative locations. A consequence of locating all field sampling at Inhaca Island is that only tropical/subtropical fish fauna could be investigated and findings may thus be biased towards these environmental conditions. However, several tidal power installations are projected at corresponding latitudes (e.g. South Korea, Malaysia, Australia and New Zealand). A negative aspect of video based field studies at Inhaca Island was the relatively low visibility during spring tide, due to fine grain sediment and high turbidity.

38
On the incredible force of water
One reason for the sparse availability of detailed studies on animal movements around tidal turbines, and in strong marine currents in general, is the difficulties of quantitative sampling in turbulent waters (Liao 2007, Shields et al. 2011, Viehman 2012). Since the power density of water has a cubic relationship with current speed the forces increase dramatically when flow increases. Tidal turbines are most profitable in strong flows, cut-in speeds are rarely below 1 m/s and turbines are often optimized for 2-3 m/s. But to safely moor measurement equipment and dive in the same range of current speed is rather difficult. During our field studies in the Mozambican tidal currents we took measurements in current speeds up to 1.5 m/s, still we lost (and sometimes recovered) our equipment several times. Thus, we only covered fish behavior in the lower fraction of the current range of interest, but with established relationships between behavior and current speed more general conclusions could be drawn. Diving was restricted to about 1 m/s and even here we had to hold on to the rocks (Figure 12).
Figure 12. Left panel illustrates the relationship between water speed and power density within the current range
of interest for tidal current power. The red mark indicates the upper limit of current speed covered in the field
studies. Images depict fish (Parupeneus indicus) and a diver more or less smoothly operating in current speeds of
approximately 1 m/s.

39
Discussion and synthesis
Understanding uncertainties
Uncertainty can be described as the lack of sufficient knowledge to precisely describe the existing state or future outcome (Bedford and Cooke 2001). In science, uncertainty is reduced by observation. But where decisions or projections are needed despite the lack of observations we turn to assessments. The act of assessment is, at best, a way of handling uncertainty through scientifically based evaluation procedures. Uncertainty has different sources, where three basic categories are measurement error, natural variation and semantic uncertainty (vagueness of terms and definitions) (Akçakaya et al. 2000, Burgman 2005). Below, these various kinds of uncertainties and some different approaches to handling uncertainties are described and reflected upon, in relation to the papers of the thesis. Without complete access to data there will always be uncertainty caused by measurement error (Akçakaya et al. 2000). Such uncertainty can be reduced by adding more observations and using sampling methods with low bias. The data collection on fish movements and responses to artificial and natural factors in Papers III and V likely involve some measurement errors. For instance, it is possible that some specimens might have been assigned the wrong taxa, or that some speed measurements were erroneous. By repeated measurements this kind of uncertainty will be reduced, given that the method has no bias. Even where many observations are sampled natural variation adds uncertainty because populations vary in space and time in response to changing environmental conditions and demographic processes (Burgman et al. 1993). In order to reduce uncertainty caused by natural variation measurements should be repeated and be conducted with appropriate consideration of spatial and temporal scales. For example, the adequate spatial scale for abundance estimates of different fish varies among taxa due to seascape connectivity, where some taxa operate over larger scales than others (Berkström 2012). In this thesis, Paper III has the limitation that sampling was only carried out during daytime. Hence, conclusions cannot be extrapolated over time, though time-averaged results would have been more informative. In Paper IV the results may be somewhat misleading given that swimming directions were only sampled in conditions of rather low current speed. If higher current speeds would have been covered (as in Paper V) fewer fish would have been found swimming in the countercurrent direction and collision probabilities would have been slightly lower. Uncertainty caused by natural variation may also be reduced by observing a higher taxonomic level than species, as have partly been done in this thesis (Warwick 1993). Where there is functional group coherence within each higher taxon, genus or family level analyses may reduce scale-dependent noise (at the cost of taxonomic resolution). Semantic uncertainty is of particular importance in assessments. If assessment concepts and criteria are not strictly defined, then different assessors are likely to apply the same methods differently and also end-users are likely to interpret the results differently (Akçakaya et al. 2000). To apply strict definitions of concepts and criteria was therefore crucial for Papers II and V.

40
Approaches to uncertainty
The way uncertainties are handled may greatly influence assessment results (IUCN 2012). For instance, given a range of plausible values like a mean with a confidence interval, an assessor can base assessments on the adverse extremes (thus displaying low dispute tolerance), or focus on the more likely values close to the mean (thus displaying high dispute tolerance) (Akçakaya et al. 2000). In this thesis uncertainties are handled differently in the different studies. In the semi-quantitative WOE based risk assessment (Paper II) a low dispute tolerance is consistently applied, using upper confidence limits for risk associated variables and applying precautionary criteria (which resulted in many Uncertain causal relationships). In the probabilistic risk analyses of Papers IV and V the full range of plausible values were used to calculate collision probabilities (by using Monte-Carlo simulations). Thereby, the choice of high or low dispute tolerance is left to the reader. In the hazard identification of Paper I uncertainties are not explicitly handled. However, by comparing expected effects of marine renewables with proven effects of other human activities, a low dispute tolerance has been taken towards marine renewables. The pros and cons of modeling
Some of the findings of this thesis are directly related to models. Inevitably, this implies simplification and uncertainty. For instance, Paper IV and parts of Paper V involve models which are not validated and these results should therefore be carefully interpreted. Monte-Carlo simulation has been used to handle uncertainties in input data (Bedford and Cooke 2001), though this is of no use if models are inaccurate. Other parts of the findings are dependent on more established models, such as transmission loss in underwater sound propagation (Urick 1983) or noise tolerance models (Nedwell et al. 2007), which have been used for estimating the spatial range of effects from noise and impulsive sound. However, extrapolations are crucial and models are a necessary means of analysis for anyone who intends to say anything beyond the state of a specific observation, though interpretations must be cautiously made with an understanding of the inevitable uncertainties within the model.

41
Marine renewables in the Brave New Ocean
This section has the purpose of synthesizing the findings of the thesis in the context of the future ocean10. Although uncertainties still remain, recent contributions have led to a fairly comprehensive understanding of direct effects from offshore wind power to marine organisms (Bergström et
al. 2014). This can be used to inform assessments of risks and benefits of less proven marine renewables, such as wave power and tidal power (Paper I). OTEC differs much from other marine renewables and environmental effects from this technology will be more different. Main effects of offshore wind power, wave power and tidal turbines
Following installation, introduced units and foundations will soon be colonized by marine organisms, seemingly mostly filter feeding animals (Langhamer 2009, Wilhelmsson 2009, Andersson 2011). With time, mobile fauna is likely to be attracted from the surroundings and ecosystem changes will take place in the vicinity of the units (Reubens et al. 2010, Bergström et al. 2013), or possibly within the whole array (Lindeboom et al. 2011). Based on current knowledge, such changes are established phenomena, but the details will differ among devices and locations (Bergström et al. 2014). Considering that habitat loss and fishery pressure can be expected to be high in the future ocean (Kaiser et al. 2000, Munday 2004, Jackson 2008), this so called artificial reef-effect of marine renewables will probably be regarded as favorable in many places. It is not unlikely that large scale installations, due to reef-effect and fisheries prohibition may have positive effects on fish stocks (Wilhelmsson et
al. 2010). As mentioned in the introduction, however, little is known regarding positive or negative effects on ecosystem functioning in relation to marine renewable energy developments. Currently, the most well founded concern regards pile driving since the impulsive sound can have substantial effects on organisms over large distances (Popper and Hastings 2009, Simmonds and Brown 2010). As demonstrated by Paper II, pile driving can pose high risks to vulnerable populations and cumulative effects of multiple pile driving activities may become important risk factors in the future ocean. It was further demonstrated in Paper II that considerate planning, in terms of time-scheduling of risk-related construction events, can be effective means of risks reduction. Other major concerns regard altered hydrodynamics and sediment changes of tidal turbine and wave power arrays (Allan et al. 2008, Shields et al. 2011, Miller et al. 2013), aerial obstruction and collisions at offshore wind farms (NWCC 2010, Furness et al. 2013, Waggitt and Scott 2014) and subsea obstruction and collisions at tidal turbine and wave power arrays. These concerns have theoretical foundations but are associated with high uncertainty. This thesis provides some new information regarding collision related effects of tidal turbines.
10
By the future ocean I refer to a point in time, perhaps 10-30 years from now, when several marine renewables may be technically mature while at the same time the state of the ocean is likely to be further deprived by human impact, as indicated by e.g. Jackson (2008) and Bijma et al. (2013).

42
Tidal turbine collisions
Based on Paper III and a study by Broadhurst and Barr (2011), fish are able to avoid collisions with small turbines during daylight conditions. By the field experiment, a generic deterrent effect caused by the turbine rotor was shown, although many small reef fish still passed close to the rotor (~0.3 m). Large predatory fish always kept a few meters distance to the rotor. This indicates that if multiple turbine systems are constructed so that they may block movement routes for fish, open passages of several meters should be incorporated in the design. In a study by Viehman (2012) it was observed that small pelagic fish occasionally entered a small tidal turbine, and this was more common during nighttime. Experimental studies on survival of small fish forced through small hydrokinetic turbines have shown very high survival rates (98-100%) (Copping et al. 2013). Given this high survival rates for small fish in turbines, the demonstrated avoidance ability (Paper III), and that many fish seemingly avoid strong currents (Paper V), small tidal turbines are unlikely to pose any significant risk to fish. Large tidal turbines may, however, be more difficult to avoid for animals passing through exploited areas, particularly during the night, as indicated by the model work presented in Paper V. Once entering a large turbine small fish are unlikely to come to harm, while large animals suffer high probabilities of collision (Paper IV). Importantly, it has repeatedly been shown that fish tend to avoid areas where current flows are very strong, thus reducing the likelihood of ever coming in contact with the turbines. In Paper V fish changed swimming direction at current speeds of 0.7–0.8 m/s and few fish were present above 1 m/s. In other studies fish have disappeared at around 1.5–2 m/s (Broadhurst and Barr 2011, Viehman 2012). Since large tidal turbines only operate above 1 m/s, and preferably at 2–3 m/s, fish seem generally unlikely to approach tidal turbines. Even fish attracted to turbines have shown to leave the area when currents became strong enough for power generation (Broadhurst and Barr 2011). However, as discussed in Paper V, some large marine animals, including species of turtles, sharks and marine mammals, are known to utilize strong current environments. For these animals, relationships between swimming behavior and current speed are unknown. If large animals come across large tidal turbines and fail to detect and avoid the rotors or other fast-moving parts, the probability of collision will be high (typically above 30%; Paper IV). In such cases even losses of a few individuals may generate high population level risks for some of these species (IUCN 2012). It has been speculated that reef-effect attraction of large predators to arrays of tidal turbines could increase collision related risks.
In conclusion, tidal turbines are unlikely to pose significant risks to fish in general, but it cannot be ruled out that large tidal turbines pose substantial risk to large animals, particularly regarding turbine designs moving quickly and sweeping across large water volumes (e.g. large diameter horizontal-axis turbines or the Deep Green design). Based on the looming outlook presented by Jackson (2008) and the negative trend of fish size illustrated by Pinnegar and Engelhard (2008) large animals can be expected to become increasingly rare and vulnerable in the future ocean, due to pressure from fisheries. It is, therefore, important to avoid additional risk from tidal turbines to these animals, which represent important functional groups. Technical adaptations or regulatory measures may be required.

43
OTEC deep sea entrainment
Effects of OTEC have not been studied in detail within this thesis but in Paper I it was concluded that OTEC is much different in comparison to other marine renewables and human activities in regard to the environmental stressors it will potentially cause. The effects of entrainment of deep sea organisms are particularly uncertain. In OTEC systems massive amounts of cold water are pumped from the deep sea and the industry has not indicated that it plans to use screens over the intake pipes because of the logistical difficulties with rinsing and maintenance of the screens. However, studies show that deep sea organisms have been entrained by OTEC intakes at the pilot scale (Comfort and Vega 2011), which raises concerns regarding full scale plants with very high flows (~300 m3/s). If screens are not used, it appears likely that deep sea organisms including large individuals will be entrained. Effects of deep sea entrainment have never been studied, but since deep sea organisms are thought to be particularly vulnerable (Roberts 2002, Glover et
al. 2010) it can be assumed given the current understanding of the technology that ecological risks will be high. In recent years, deep sea fisheries have increased and populations are increasingly more vulnerable; it can be expected that the pressure on deep sea ecosystems will increase in the future (Ramirez-Llodra et al. 2011). If OTEC plants are implemented on a large scale, without using screens, the cumulative losses of (often slow reproducing) deep sea organisms could be detrimental. More research is necessary, not the least of which should focus on technical solutions for preventing entrainment. Marine renewables in a crowded ocean
With the exception of offshore OTEC, marine renewables are all confined to operate in shallow water, that is, on the continental shelf. Here, other human activities are also most concentrated and increasing (Vitousek et al. 1997), and impacts on marine ecosystems are highest (Halpern et al. 2008b). Wherever installations are made, introduced stressors will co-occur with existing stressors and therefore ecosystems will be affected both by marine renewables and other human activities concurrently. Cumulative effects operate both at the organism level (‘cocktail-effect’) and on population or ecosystem levels and can play out additively, synergistically or antagonistically. Based on the literature inventory by Crain et al. (2008) there are both synergistic relationships (where exposure to one stressor increases the effect of another stressor) and antagonistic relationships (where exposure to one stressor reduces the effect of another stressor) that involve stressors associated with marine renewables. For instance, the effect of increased turbidity can be synergistic in relation to nutrient loading. Effects of sediment dispersal from cable trenching, or effects of OTEC-induced nutrient loading, may thus vary nonlinearly depending on what other human activities are already present in a specific area. As another example, the relationship between fisheries and the artificial reef-effect may be antagonistic (provided that fishing is prohibited on the “reef”). Given that there may be many co-occurring stressors, the complexity of cumulative effects can rapidly increase. The high degree of interconnectedness among ecosystem receptors (Jason 2002) and ecosystems, which occur over large spatial and temporal scales (Foley et al. 2010), adds further complexity to assessments of cumulative effects. Given an expanding human presence in the ocean and intensifying climate change stressors, from which multiple synergistic effects have already been shown (Bijma et al. 2013), cumulative effects will become increasingly important to consider. Hence, the

44
ecosystem effects and potential risks of marine renewables might be most suitably addressed from a holistic regional management perspective.
Technical adaptations and developments for
risk reduction
To mitigate global climate change and its expected consequences is likely the paramount challenge of our time. Technical change might be part of the solution and marine renewable energy may provide some means for more sustainable future energy supplies. This should, however, be accompanied with environmental precaution so as to decrease the likelihood of any further environmental problems being caused from a technology created as a part of the solution. As has been discussed in this thesis, local environmental effects of the different technologies are still associated with uncertainties, some being larger than others. Some recommendations regarding technical adaptations for risk reduction, regulatory policy and management tool development can be drawn from this thesis:
• Warning system development: For marine renewables with fast-moving rotors, wings, wires or mooring lines the risk of collision with large marine animals cannot be ruled out. To increase animals’ ability to detect and avoid these systems at a safe distance may be an effective means of risk reduction. Detection ranges can be increased using either passive or active warning systems, or combinations thereof. For some animals, such as fish, visibility is important and enhancing the contrast against background using bright coloration or luminous systems may be efficacious. For other animals active warning systems, such as acoustic or electromagnetic deterrence may be more successful (see page 30). Effective techniques should be developed and tested.
• Turbine design: Another way of decreasing or eliminating collision risks is to promote devices without components that move fast across large water volumes. Several developing tidal turbines are shifting towards more compact, less hazardous, designs (e.g. screw-like rotors or hydrofoils). Animal migration is another important factor to be considered when designing systems. Where large marine mammals, such as baleen whales, undertake migrations arrays should be designed so that the migration route is not impaired. In most arrays fish movements are unlikely to be affected because of the separation between devices, but in cases where turbines are planned across narrow straits it might be necessary to incorporate open passages of several meters to allow large fish to pass through unhindered (see pages 29-30).
• OTEC screen development: Technical solutions to avoid entrainment at OTEC deep sea water intakes should be developed. Screens for preventing entrainment already exist for shallow water applications and corresponding systems are needed for deep water use (where maintenance is more difficult).
• Planning: Particular locations where installations are found to endanger important ecosystem receptors should be avoided in general, if proper mitigation measures cannot be found. Though disturbance from temporal stressors, such as construction

45
related impulsive sound or sediment dispersal may be effectively avoided by taking biologically sensitive periods such as spawning or migration of vulnerable species into consideration during planning.
• Monitoring: For offshore wind power substantial information has been gathered regarding direct effects on various organisms. Future monitoring efforts should be increasingly directed towards potential effects on ecosystem functioning. For instance, this can again be related to the exploited area’s function as a spawning ground, nursery, or migration route. These aspects have hitherto not been well investigated. Additionally, current monitoring programs have been located in temperate waters and data collection from other regions where renewables will be implemented should be encouraged in order to increase the possibility of generalization.
• Management tool development: In a crowded ocean management needs to consider effects of multiple stressors, interactions among stressor sources (such as space competition and industry synergies) and interactions among ecosystem components (Crowder and Norse 2008). The current trend towards marine spatial planning based on the ecosystem approach is an important step towards understanding these regional level processes and creating a more holistic marine management (Crowder and Norse 2008, Douvere 2008, Ehler and Douvere 2009, Foley et al. 2010). Here, development of analytical tools apt for handling multiple stressors and complex ecosystem interactions within marine spatial planning would be helpful. Among potentially suitable tools, Atlantis (CSIRO) and to some degree Ecospace (Ecopath) have the capacity to cover both multiple stressors and ecosystem interactions through quantitative simulations. At a lower level of detail, but perhaps more user-friendly and adaptable, are semi-quantitative models such as the Cumulative Impact Model developed by Halpern et al. (2008b) and the Relative Risk Model (Landis and Wiegers 2007). With holistic dynamic models as a basis for marine spatial planning, ecological risks from marine renewables and other stressors can be identified early in planning and proactive risk management strategies applied.

46
References 4C Offshore Database. 2014. Global Offshore Wind Farms Database. Available at: http://www.4coffshore.com/
windfarms/default.aspx
Acosta, H. and B. M. Forrest. 2009. The spread of marine non-indigenous species via recreational boating: A conceptual model for risk assessment based on fault tree analysis. Ecological Modelling 220:1586-1598.
Adams, S. M. 2005. Assessing cause and effect of multiple stressors on marine systems. Marine Pollution
Bulletin 51:649-657.
Akçakaya, H. R., S. Ferson, M. A. Burgman, D. A. Keith, G. M. Mace, and C. R. Todd. 2000. Making Consistent IUCN Classifications under Uncertainty. Conservation Biology 14:1001-1013.
Allan, J. C., J. Barth, T. Özkan-Haller, K. Kirkendall, P. D. Komar, C. Peterson, M. Previsic, and M. Stefanovich. 2008. Receptor Breakout Group Report: The Physical Environment. Pages 69-73 in G. W. Boehlert, G. R. McMurray, and C. E. Tortorici, editors. Ecological Effects of Wave Energy Development in the Pacific Northwest. National Oceanic and Atmospheric Administration, Portland, US.
Andersson, M., M. Berggren, D. Wilhelmsson, and M. Öhman. 2009. Epibenthic colonization of concrete and steel pilings in a cold-temperate embayment: a field experiment. Helgoland Marine Research 63:249-260.
Andersson, M. H. 2011. Offshore wind farms - ecological effects of noise and habitat alternation on fish. Doctoral thesis. Stockholm University, Stockholm.
Andersson, M. H. and M. C. Öhman. 2010. Fish and sessile assemblages associated with wind-turbine constructions in the Baltic Sea. Marine and Freshwater Research 61:642-650.
Andrulewicz, E., D. Napierska, and Z. Otremba. 2003. The environmental effects of the installation and functioning of the submarine SwePol Link HVDC transmission line: a case study of the Polish Marine Area of the Baltic Sea. Journal of Sea Research 49:337-345.
Arnett, E. and E. Baerwald. 2013. Impacts of Wind Energy Development on Bats: Implications for Conservation. Pages 435-456 in R. A. Adams and S. C. Pedersen, editors. Bat Evolution, Ecology, and Conservation. Springer New York.
Arvidsson, R. and S. Molander. 2012. Screening Environmental Risk Assessment of Grease and Oil Emissions from Off-Shore Wind Power Plants. Chalmers University of Technology, Göteborg.
Bailey, H., B. Senior, D. Simmons, J. Rusin, G. Picken, and P. M. Thompson. 2010. Assessing underwater noise levels during pile-driving at an offshore windfarm and its potential effects on marine mammals. Marine
Pollution Bulletin 60:888-897.
Ban, N. C., H. M. Alidina, and J. A. Ardron. 2010. Cumulative impact mapping: Advances, relevance and limitations to marine management and conservation, using Canada's Pacific waters as a case study. Marine
Policy 34:876-886.
Barnthouse, L. W., W. R. Munns, and M. T. Sorensen. 2008. Introduction. Pages 1-6 in L. W. Barnthouse, W. R. Munns, and M. T. Sorensen, editors. Population-Level Ecological Risk Assessment. SETAC Press, Pensacola, US.
Bedford, T. and R. Cooke. 2001. Probabilistic Risk Analysis: Foundations and Methods. Cambridge University Press, New York.
Bergström, L., L. Kautsky, T. Malm, H. Ohlsson, M. Wahlberg, R. Rosenberg, and N. Capetillo. 2012. Vindkraftens effekter på marint liv: en syntesrapport.
Bergström, L., L. Kautsky, T. Malm, R. Rosenberg, M. Wahlberg, N. Å. Capetillo, and D. Wilhelmsson. 2014. Effects of offshore wind farms on marine wildlife—a generalized impact assessment. Environmental
Research Letters 9:034012.
Bergström, L., F. Sundqvist, and U. Bergström. 2013. Effects of an offshore wind farm on temporal and spatial patterns in the demersal fish community. Mar Ecol Prog Ser 485:199-210.
Berkström, C. 2012. Ecological connectivity in East African seascapes. Doctoral thesis. Stockholm University, Stockholm.
Bhuyan, G. S. 2008. Harnessing the Power of the Oceans. International Energy Agency OPEN Energy
Technology Bulletin:1-6.

47
Biddinger, G. R., P. Calow, P. Delorme, G. Harris, B. Hope, B.-L. Lin, M. T. Sorensen, and P. van den Brink. 2008. Managing Risk to Ecological Populations. Pages 7-39 in L. W. Barnthouse, W. R. Munns, and M. T. Sorensen, editors. Population-Level Ecological Risk Assessment. SETAC Press, Pensacola, US.
Bijma, J., H.-O. Pörtner, C. Yesson, and A. D. Rogers. 2013. Climate change and the oceans – What does the future hold? Marine Pollution Bulletin 74:495-505.
Boehlert, G. W. and A. B. Gill. 2010. Environmental and ecological effects of ocean renewable energy development: A current synthesis. Oceanography 23:68-81.
Boles, L. C. and K. J. Lohmann. 2003. True navigation and magnetic maps in spiny lobsters. Nature 421:60-63.
BP. 2014. Statistical Review of World Energy 2013. Available at: http://www.bp.com/en/global/ corporate/about-bp/energy-economics/statistical-review-of-world-energy-2013.html
Brabant, R., S. Degraer, and B. Rumes. 2012. Offshore wind energy development in the Belgian part of the North Sea & anticipated impacts: an update. Pages 9-16 in R. Brabant, S. Degraer, and B. Rumes, editors. Offshore wind farms in the Belgian part of the North Sea: Heading for an understanding of environmental impacts.
Broadhurst, M. and S. Barr. 2011. Short Term Temporal Behavioural Responses in Pollack, Pollachius pollachius to Marine Tidal Turbine Devices; a Combined Video and ADCP Doppler Approach. in 9th European Wave and Tidal Energy Conference, Southampton.
Broström, G. 2008. On the influence of large wind farms on the upper ocean circulation. Journal of Marine
Systems 74:585-591.
Bshary, R. 2002. Building up relationships in asymmetric co-operation games between the cleaner wrasse Labroides dimidiatus and client reef fish. Behavioral Ecology and Sociobiology 52:365-371.
Burgman, M. 2005. Risks and Decisions for Conservation and Environmental Management. Cambridge University Press, Cambridge.
Burgman, M. A., S. Ferson, and H. R. Akçakaya. 1993. Risk assessment in conservation biology. Chapman and Hall, London.
Busch, M., A. Kannen, S. Garthe, and M. Jessopp. 2013. Consequences of a cumulative perspective on marine environmental impacts: Offshore wind farming and seabirds at North Sea scale in context of the EU Marine Strategy Framework Directive. Ocean & Coastal Management 71:213-224.
Cada, G. E., J. Ahlgrimm, M. Bahleda, T. Bigford, S. D. Stavrakas, D. Hall, R. Moursund, and M. Sale. 2007. Potential Impacts of Hydrokinetic and Wave Energy Conversion Technologies on Aquatic Environments. Fisheries 32:174-182.
Cada, G. F., C. C. Coutant, R. R. Whitney, and L. Washington. 1997. Development of Biological Criteria for the Design of Advanced Hydropower Turbines. Oak Ridge National Laboratory, Oak Ridge.
Carr, M. H. and M. A. Hixon. 1997. Artificial Reefs: The Importance of Comparisons with Natural Reefs. Fisheries 22:28-33.
Charlier, R. H. 2001. Ocean alternative energy - The view from China - 'small is beautiful'. Renewable &
Sustainable Energy Reviews 5:403-409.
Charlier, R. H. and J. R. Justus. 1993. Ocean Energies - Environmental, Economic and Technological Aspects of Alternative Power Sources. Elsevier.
Charlier, R. H. and L. Menanteau. 1997. The saga of tide mills. Renewable and Sustainable Energy Reviews
1:171-207.
Collingridge, D. 1981. The Social Control of Technology. Open University Press, Milton Keynes.
Comfort, C. and L. A. Vega. 2011. Environmental Assessment for Ocean Thermal Energy Conversion in Hawaii. Pages 1-8 in Oceans 2011, Waikoloa, US.
Copping, A., L. Hanna, J. Whiting, S. Geerlofs, M. Grear, K. Blake, A. Coffey, M. Massaua, J. Brown-Saracino, and H. Battey. 2013. Environmental Effects of Marine Energy Development around the World for the OES Annex IV. Pacific Northwest National Laboratory for the Ocean Energy Systems Initiative. Available at: www.ocean-energy-systems.org
Cornett, A. M. 2008. A Global Wave Energy Resource Assessment. ISOPE-2008-579, Canadian Hydraulic Centre, Ottawa.

48
CPS. 2014. Introduction to Hazard Identification and Risk Analysis. Center for Chemical Process Safety. Available at: http://www.aiche.org/ccps
Crain, C. M., K. Kroeker, and B. S. Halpern. 2008. Interactive and cumulative effects of multiple human stressors in marine systems. Ecology Letters 11:1304-1315.
Crowder, L. and E. Norse. 2008. Essential ecological insights for marine ecosystem-based management and marine spatial planning. Marine Policy 32:772-778.
CSIRO. Management Strategy Evaluation: Atlantis. CSIRO Marine and Atmospheric Research, Available at: http://www.cmar.csiro.au/research/mse/atlantis.htm
Degraer, S., R. Brabant, and B. Rumes, editors. 2012. Offshore wind farms in the Belgian part of the North Sea: Heading for an understanding of environmental impacts. Royal Belgian Institute of Natural Sciences.
Douglas, R. and C. Hawryshyn. 1990. Behavioural studies of fish vision: an analysis of visual capabilities. Pages 373-418 in R. Douglas and M. Djamgoz, editors. The Visual System of Fish. Springer Netherlands.
Doukas, H., C. Karakosta, and J. Psarras. 2009. RES technology transfer within the new climate regime: A "helicopter" view under the CDM. Renewable and Sustainable Energy Reviews 13:1138-1143.
Douvere, F. 2008. The importance of marine spatial planning in advancing ecosystem-based sea use management. Marine Policy 32:762-771.
EBMI. 2014. Estação de Biologia Marítima de Inhaca. Universidade Eduardo Mondlane. Available at: http://www.ebmi.uem.mz/
Ecopath. Ecopath with Ecosim. Ecopath. Available at: http://www.ecopath.org/
Ehler, C. and F. Douvere. 2009. Marine Spatial Planning a step-by-step approach toward ecosystem-based management. Intergovernmental Oceanographic Commission, Paris.
EPRI. 2011. Evaluation of Fish Injury and Mortality Associated with Hydrokinetic Turbines. Electric Power Research Institute, Palo Alto.
ESF. 2010. Marine Renewable Energy Research Challenges and Opportunities for a new Energy Era in Europe. European Science Foundation and Marine Board. Available at: http://www.esf.org/home.html
Esteban, M. and D. Leary. 2012. Current developments and future prospects of offshore wind and ocean energy. Applied Energy 90:128-136.
FAO. 2010. The State of World Fisheries and Aquaculture. Food and Agriculture Organization of the United Nations, Rome.
Finkl, C. W. and R. Charlier. 2009. Electrical power generation from ocean currents in the Straits of Florida: Some environmental considerations. Renewable and Sustainable Energy Reviews 13:2597-2604.
Fletcher, W. J. 2005. The application of qualitative risk assessment methodology to prioritize issues for fisheries management. ICES Journal of Marine Science: Journal du Conseil 62:1576-1587.
Fletcher, W. J., J. Chesson, M. Fisher, K. J. Sainsbury, T. Hundloe, A. D. M. Smith, and B. Whitworth. 2002. National ESD Reporting Framework for Australian Fisheries: The 'How To' Guide for Wild Capture Fisheries. Canberra, Australia.
Foley, M. M., B. S. Halpern, F. Micheli, M. H. Armsby, M. R. Caldwell, C. M. Crain, E. Prahler, N. Rohr, D. Sivas, M. W. Beck, M. H. Carr, L. B. Crowder, J. Emmett Duffy, S. D. Hacker, K. L. McLeod, S. R. Palumbi, C. H. Peterson, H. M. Regan, M. H. Ruckelshaus, P. A. Sandifer, and R. S. Steneck. 2010. Guiding ecological principles for marine spatial planning. Marine Policy 34:955-966.
Fraenkel, P. L. 2002. Power from marine currents. Proceedings of the Institution of Mechanical Engineers, Part
A: Journal of Power and Energy 216:1-14.
Frid, C., E. Andonegi, J. Depestele, A. Judd, D. Rihan, S. I. Rogers, and E. Kenchington. 2012. The environmental interactions of tidal and wave energy generation devices. Environmental Impact Assessment
Review 32:133-139.
Furness, R. W., H. M. Wade, and E. A. Masden. 2013. Assessing vulnerability of marine bird populations to offshore wind farms. Journal of Environmental Management 119:56-66.
Gill, A., I. Gloyne-Phillips, K. J. Neal, and J. A. Kimber. 2005. The Potential Effects of Electromagnetic Fields Generated by Sub-Sea Power Cables Associated with Offshore Wind Farm Developments on Electrically and Magnetically Sensitive Marine Organisms – A Review. COWRIE, Cranfield University, Silsoe, UK.

49
Gill, A. B. 2005. Offshore renewable energy: ecological implications of generating electricity in the coastal zone. Journal of Applied Ecology 42:605-615.
Glass, C. W. and C. S. Wardle. 1989. Comparison of the reactions of fish to a trawl gear, at high and low light intensities. Fisheries Research 7:249-266.
Glover, A. G., A. J. Gooday, D. M. Bailey, D. S. M. Billett, P. Chevaldonne, A. Colaco, J. Copley, D. Cuvelier, D. Desbruyeres, V. Kalogeropoulou , M. Klages, N. Lampadariou, C. Lejeusne, N. Mestre, G. L. J. Paterson, T. Perez, H. Ruhl, J. Sarrazin, T. Soltwedel, E. H. Soto, S. Thatje, A. Tselepides, S. Van Gaever, and A. Vanreusel. 2010. Temporal change in deep-sea benthic ecosystems: a review of the evidence from recent time-series studies. Advances In Marine Biology 58:1-95.
Grandelli, P., G. Rocheleau, J. Hamrick, M. Church, and B. Powell. 2012. Modeling the Physical and Biochemical Influence of Ocean Thermal Energy Conversion Plant. US Department of Energy, Makai, US.
Grecian, W. J., R. Inger, M. J. Attrill, S. Bearhop, B. J. Godley, M. J. Witt, and S. C. Votier. 2010. Potential impacts of wave-powered marine renewable energy installations on marine birds. Ibis 152:683-697.
Gunn, J. and B. F. Noble. 2011. Conceptual and methodological challenges to integrating SEA and cumulative effects assessment. Environmental Impact Assessment Review 31:154-160.
Guthrie, D. 1986. Role of vision in fish behaviour. Pages 75-113 in T. Pitcher, editor. The behaviour of teleost fishes. Croom Helm, London.
Halpern, B. S., K. L. McLeod, A. A. Rosenberg, and L. B. Crowder. 2008a. Managing for cumulative impacts in ecosystem-based management through ocean zoning. Ocean & Coastal Management 51:203-211.
Halpern, B. S., S. Walbridge, K. A. Selkoe, C. V. Kappel, F. Micheli, C. D'Agrosa, J. F. Bruno, K. S. Casey, C. Ebert, H. E. Fox, R. Fujita, D. Heinemann, H. S. Lenihan, E. M. P. Madin, M. T. Perry, E. R. Selig, M. Spaldig, R. Steneck, and R. Watson. 2008b. A Global Map of Human Impact on Marine Ecosystems. Science 319:948-952.
Halvorsen, M., T. Carlson, and A. Copping. 2011. Effects of Tidal Turbine Noise on Fish Hearing and Tissues. Sequim. Available at: http://mhk.pnnl.gov/wiki/index.php/Knowledge_Base
Hammar, L. 2011. Towards Technology Assessment of Ocean Energy in a Developing Country Context. Chalmers University of Technology, Gothenburg.
Hammar, L., S. Andersson, and R. Rosenberg. 2008. Adapting offshore wind power foundations to local environment. Vindval, The Swedish Environmental Protection Agency, Bromma.
Hammar, L., J. Ehnberg, L. Eggertsen, S. Andersson, and S. Molander. 2012. Stereo-Video Methodology for Quantitative Analysis of Fish-Turbine Interactions. Page 8 in 1st Asian Wave and Tidal Conference Series, Jeju Island, Korea.
Hammar, L., M. Magnusson, R. Rosenberg, and Å. Granmo. 2009. Miljöeffekter vid muddring och dumpning - en litteratursammanställning, Rapport 5999. The Swedish Environmental Protection Agency, Bromma.
Hammar, L., A. Wikström, M. Magnusson, and S. Andersson. 2006. Marin miljö vid kabelspåret - underlagsrapport för Hanöbukten Offshore. Marine Monitoring, Fiskebäckskil.
Harvey, E., D. Fletcher, and M. Shortis. 2002. Estimation of reef fish length by divers and by stereo-video: A first comparison of the accuracy and precision in the field on living fish under operational conditions. Fisheries Research 57:255-265.
Harvey, E. S., D. L. McLean, S. Frusher, M. D. D. Haywood, S. J. Newman, and A. Williams. 2013. The use of BRUVs as a tool for assessing marine fisheries and ecosystems: a review of the hurdles and potential. Fisheries Research and Development Corporation and The University of Western Australia.
Hayes, K. R. 1998. Ecological risk assessment for ballast water introductions: A suggested approach. ICES
Journal of Marine Science: Journal du Conseil 55:201-212.
Hegermann, G., C. Cocklin, R. Creasey, S. Dupois, A. Kennedy, L. Kingsley, W. Ross, H. Spaling, and D. Stalker. 1999. Cumulative Effects Assessment Practitioners Guide. AXYS Environmental Consulting Ltd. and the CEA Working Group for the Canadian Environmental Assessment Agency, Hull.
Henkel, S. K., R. M. Suryan, and B. A. Lagerquist. 2014. Marine Renewable Energy and Environmental Interactions: Baseline Assessments of Seabirds, Marine Mammals, Sea Turtles and Benthic Communities on the Oregon Shelf. in M. A. Shields and A. I. L. Payne, editors. Marine Renewable Energy Technology and Environmental Interactions. Springer.

50
Hildebrand, J. A. 2009. Anthropogenic and natural sources of ambient noise in the ocean. Mar Ecol Prog Ser 395:5-20.
Hong, Y., R. Waters, C. Boström, M. Eriksson, J. Engström, and M. Leijon. 2014. Review on electrical control strategies for wave energy converting systems. Renewable and Sustainable Energy Reviews 31:329-342.
Hvidt, C., C. Bech, and M. Klaustrup. 2004. Fish at the cable trace Nysted offshore wind farm at Rødsand. Bio/consult.
Inger, R., M. J. Attrill, S. Bearhop, A. C. Broderick, W. James Grecian, D. J. Hodgson, C. Mills, E. Sheehan, S. C. Votier, M. J. Witt, and B. J. Godley. 2009. Marine renewable energy: potential benefits to biodiversity? An urgent call for research. Journal of Applied Ecology 46:1145-1153.
IUCN. 2012. IUCN Red list categories and criteria Version 3.1. Second edition, Gland, Switzerland.
IUCN. 2014. The IUCN Red List of Threatened Species. International Union for Conservation of Nature and Natural Resources. Available at: http://www.iucnredlist.org/search
Jackson, J. B. C. 2008. Ecological extinction and evolution in the brave new ocean. Proceedings of the National
Academy of Sciences 105:11458-11465.
Jason, L. 2002. Does food web theory work for marine ecosystems? Mar Ecol Prog Ser 230:1-9.
Jia, Y., G. C. Nihous, and K. J. Richards. 2012. Effects of ocean thermal energy conversion systems on near and far field seawater properties—A case study for Hawaii. Journal of Renewable and Sustainable Energy 4.
Johnson, M. R., C. Boelke, L. A. Chiarella, P. D. Colosi, K. Greene, K. Lellis-Dibble, H. Ludermann, M. Ludwig, S. McDermott, J. Ortiz, D. Rusanowsky, M. Scott, and J. Smith. 2008. Impacts to Marine Fisheries Habitat from Nonfishing Activities in the Northeastern United States. National Oceanic and Atmospheric Administration Gloucester.
Kaiser, M. J., K. Ramsay, C. A. Richardson, F. E. Spence, and A. R. Brand. 2000. Chronic fishing disturbance has changed shelf sea benthic community structure. Journal of Animal Ecology 69:494-503.
Kalmijn, A. J. 1982. Electric and magnetic field detection in elasmobranch fishes. Science 218:916-918.
Khan, J. and G. Bhuyan. 2009. Ocean Energy: Global Technology Development Status. International Energy Agency. Available at: www.iea-oceans.org
Khan, M. J., G. Bhuyan, M. T. Iqbal, and J. E. Quaicoe. 2009. Hydrokinetic energy conversion systems and assessment of horizontal and vertical axis turbines for river and tidal applications: A technology status review. Applied Energy 86:1823-1835.
Khan, M. J., M. T. Iqbal, and J. E. Quaicoe. 2008. River current energy conversion systems: Progress, prospects and challenges. Renewable and Sustainable Energy Reviews 12:2177-2193.
Klimisch, H. J., M. Andreae, and U. Tillmann. 1997. A Systematic Approach for Evaluating the Quality of Experimental Toxicological and Ecotoxicological Data. Regulatory Toxicology and Pharmacology 25:1-5.
Kowalik, Z. 2004. Tide distribution and tapping into tidal energy. Oceanologia 46:291-331.
Kulbicki, M. 1998. How the acquired behaviour of commercial reef fishes may influence the results obtained from visual censuses. Journal of Experimental Marine Biology and Ecology 222:11-30.
Laist, D. W., A. R. Knowlton, J. G. Mead, A. S. Collet, and M. Podesta. 2001. Collisions between ships and whales. Marine Mammal Science 17:35-75.
Landis, W. G. and J. K. Wiegers. 2007. Ten Years of the Relative Risk Model and Regional Scale Ecological Risk Assessment. Human and Ecological Risk Assessment: An International Journal 13:25-38.
Langhamer, O. 2009. Wave energy conversion and the marine environment. Doctoral thesis. Uppsala University, Uppsala.
Langhamer, O. 2012. Artificial Reef Effect in relation to Offshore Renewable Energy Conversion: State of the Art. The Scientific World Journal 2012:8.
Langhamer, O. and D. Wilhelmsson. 2009. Colonisation of fish and crabs of wave energy foundations and the effects of manufactured holes – A field experiment. Marine Environmental Research 68:151-157.
Langhamer, O., D. Wilhelmsson, and J. Engström. 2009. Artificial reef effect and fouling impacts on offshore wave power foundations and buoys - a pilot study. Estuarine, Coastal and Shelf Science 82:426-432.

51
Leonhard, S. B., C. Stenberg, and J. Stottrup, editors. 2011. Effect of the Horns Rev 1 Offshore Wind Farm on Fish Communities Follow-up Seven Years after Construction. DTU Aqua Report No 246-2011. Available at: http://www.aqua.dtu.dk/Publikationer/Forskningsrapporter.aspx
Leung, D. Y. C. and Y. Yang. 2012. Wind energy development and its environmental impact: A review. Renewable and Sustainable Energy Reviews 16:1031-1039.
Lewis, A., S. Estefen, J. Huckerby, W. Musial, T. Pontes, and J. Torres-Martinez. 2011. Ocean Energy.in O. Edenhofer, R. Pichs-Madruga, Y. Sokona, K. Seyboth, P. Matschoss, S. Kadner, T. Zwickel, P. Eickemeier, G. Hansen, S. Schlömer, and C. von Stechow, editors. IPCC Special Report on Renewable Energy Sources and Climate change Mitigation. Cambridge University Press, Cambridge, United Kingdom and New York, NY, USA.
Liao, J. C. 2007. A review of fish swimming mechanics and behaviour in altered flows. Philosophical
Transactions of the Royal Society B: Biological Sciences 362:1973-1993.
Lindeboom, H. J., H. J. Kouwenhoven, M. J. N. Bergman, S. Bouma, S. Brasseur, R. Daan, R. C. Fijn, D. d. Haan, S. Dirksen, R. v. Hal, R. H. R. Lambers, R. t. Hofstede, K. L. Krijgsveld, M. Leopold, and M. Scheidat. 2011. Short-term ecological effects of an offshore wind farm in the Dutch coastal zone; a compilation. Environmental Research Letters 6:035101.
Linkov, I., D. Loney, S. Cormier, F. K. Satterstrom, and T. Bridges. 2009. Weight-of-evidence evaluation in environmental assessment: Review of qualitative and quantitative approaches. Science of The Total
Environment 407:5199-5205.
Lohmann, K. and C. Lohmann. 1996. Detection of magnetic field intensity by sea turtles. Nature 380:59-61.
Lowell, R. B., J. M. Culp, and M. G. Dubé. 2000. A weight-of-evidence approach for Northern river risk assessment: Integrating the effects of multiple stressors. Environmental Toxicology and Chemistry 19:1182-1190.
Madsen, P. T., M. Wahlberg, J. Tougaard, K. Lucke, and P. Tyack. 2006. Wind turbine underwater noise and marine mammals: implications of current knowledge and data needs. Marine Ecology Progress Series 309:279-295.
McKenna, M. F., D. Ross, S. M. Wiggins, and J. A. Hildebrand. 2012. Underwater radiated noise from modern commercial ships. The Journal of the Acoustical Society of America 131:92-103.
MEA. 2005. Ecosystems and Human Well-being: Synthesis. Millennium Ecosystem Assessment, Island Press, Washington DC.
Menzie, C., M. H. Henning, J. Cura, K. Finkelstein, J. Gentile, J. Maughan, D. Mitchell, S. Petron, B. Potocki, S. Svirsky, and P. Tyler. 1996. Special report of the Massachusetts weight‐of‐evidence workgroup A weight‐of‐evidence approach for evaluating ecological risks. Human and Ecological Risk Assessment: An International
Journal 2:277-304.
Micheli, F., B. S. Halpern, S. Walbridge, S. Ciriaco, F. Ferretti, S. Fraschetti, R. Lewison, L. Nykjaer, and A. A. Rosenberg. 2013. Cumulative Human Impacts on Mediterranean and Black Sea Marine Ecosystems: Assessing Current Pressures and Opportunities. PLoS ONE 8:e79889.
Miller, R. G., Z. L. Hutchison, A. K. Macleod, M. T. Burrows, E. J. Cook, K. S. Last, and B. Wilson. 2013. Marine renewable energy development: assessing the Benthic Footprint at multiple scales. Frontiers in
Ecology and the Environment 11:433-440.
Minesto. 2014. High Efficiency - Low Impact. Available: http://www.minesto.com/
Moraes, R., W. G. Landis, and S. Molander. 2002. Regional Risk Assessment of a Brazilian Rain Forest Reserve. Human and Ecological Risk Assessment: An International Journal 8:1779-1803.
Morgan, R. K. 2012. Environmental impact assessment: the state of the art. Impact Assessment and Project
Appraisal 30:5-14.
Munday, P. L. 2004. Habitat loss, resource specialization, and extinction on coral reefs. Global Change Biology 10:1642-1647.
Muntz, W. A. 1990. Stimulus, environment and vision in fishes. Pages 491-511 in R. Douglas and M. Djamgoz, editors. The Visual System of Fish. Springer Netherlands.
Mørk, G., S. Barstow, A. Kabuth, and T. M. Pontes. 2010. Assessing the global wave energy potential. in 29th International Conference on Ocean, Offshore Mechanics and Arctic Engineering, Shanghai, China.

52
Nedwell, J., A. Turnpenny, J. Lovell, S. J. Parvin, R. Workman, J. A. L. Spinks, and D. Howell. 2007. A validation of the dBht as a measure of the behavioural and auditory effects of underwater noise. Subacoustech.
Neill, S. P., J. R. Jordan, and S. J. Couch. 2012. Impact of tidal energy converter (TEC) arrays on the dynamics of headland sand banks. Renewable Energy 37:387-397.
Nihous, G. C. and M. A. Syed. 1997. A financing strategy for small OTEC plants. Energy Conversion and
Management 38:201-211.
Norton, S. B., D. J. Rodier, W. H. van der Schalie, W. P. Wood, M. W. Slimak, and J. H. Gentile. 1992. A framework for ecological risk assessment at the EPA. Environmental Toxicology and Chemistry 11:1663-1672.
NWCC. 2010. Wind Turbine Interactions with Birds, Bats, and their Habitats: A Summary of Research Results and Priority Questions. National Wind Coordinating Collaborative. Available at: http://nationalwind.org/research/publications/birds-and-bats-fact-sheet/
O'Brien, G. C. and V. Wepener. 2012. Regional-scale risk assessment methodology using the Relative Risk Model (RRM) for surface freshwater aquatic ecosystems in South Africa. AJOL African Journals
Online:153-166.
Parvin, S. J. and J. R. Nedwell. 2006. Underwater noise survey during impact piling to construct the Burbo Bank Offshore Wind Farm. COWRIE.
Pastakia, C. M. R. and A. Jensen. 1998. The rapid impact assessment matrix (Riam) For eia. Environmental
Impact Assessment Review 18:461-482.
Pearson, J., C. Roberts, C. Scott, and S. Hull. 2010. Collision Risk of Fish with Wave and Tidal Devices. ABP Marine Environmental Research Ltd, Southampton.
Pelc, R. and R. M. Fujita. 2002. Renewable energy from the ocean. Marine Policy 26:471-479.
Pine, M. K., A. G. Jeffs, and C. A. Radford. 2012. Turbine Sound May Influence the Metamorphosis Behaviour of Estuarine Crab Megalopae. PLoS ONE 7:e51790.
Pinnegar, J. and G. Engelhard. 2008. The ‘shifting baseline’ phenomenon: a global perspective. Reviews in Fish
Biology and Fisheries 18:1-16.
Popper, A. N., T. J. Carlson, A. D. Hawkins, B. L. Southall, and R. L. Gentry. 2006. Interim Criteria for Injury of Fish Exposed to Pile Driving Operations: A White Paper. University of Maryland, Washington. Available at: http://www.wsdot.wa.gov/NR/rdonlyres/84A6313A-9297-42C9-BFA6-750A691E1DB3/0/BA_Pile DrivingInterimCriteria.pdf
Popper, A. N. and M. C. Hastings. 2009. The effects of anthropogenic sources of sound on fishes. Journal of
Fish Biology 75:455-489.
Rajagopalan, K. and G. C. Nihous. 2013. Estimates of global Ocean Thermal Energy Conversion (OTEC) resources using an ocean general circulation model. Renewable Energy 50:532-540.
Ramirez-Llodra, E., P. A. Tyler, M. C. Baker, O. A. Bergstad, M. R. Clark, E. Escobar, L. A. Levin, L. Menot, A. A. Rowden, C. R. Smith, and C. L. Van Dover. 2011. Man and the Last Great Wilderness: Human Impact on the Deep Sea. PLoS ONE 6:e22588.
Reubens, J., S. Degraer, and M. Vincx. 2010. Chapter 6. The importance of marine wind farms, as artificial hard substrata, for the ecology of the ichthyofauna. Pages 69-82 in S. Degraer, R. Brabant, and B. Runes, editors. Offshore wind farms in the Belgian part of the North Sea: early environmental impact assessment and spatio-temporal variability. Royal Belgian Institute of Natural Sciences, Brussels.
Reubens, J., S. Degraer, and M. Vincx. 2011. Chapter 5. Spatial and temporal movements of cod (Gadus
morhua) in a wind farm in the Belgian part of the North Sea using acoustic telemetry, a VPS study. Pages 39-46 in S. Degraer, R. Brabant, and B. Runes, editors. Offshore wind farms in the Belgian part of the North Sea: Selected findings from the baseline and targeted monitoring. Royal Belgian Institute of Natural Sciences, Brussels.
Reubens, J. T., S. Vandendriessche, A. N. Zenner, S. Degraer, and M. Vincx. 2013. Offshore wind farms as productive sites or ecological traps for gadoid fishes? – Impact on growth, condition index and diet composition. Marine Environmental Research 90:66-74.
Roberts, C. M. 2002. Deep impact: the rising toll of fishing in the deep sea. Trends in Ecology & Evolution
17:242-245.

53
Rucker, J. and W. Friedl. 1985. Potential impacts from OTEC-generated underwater sounds. Pages 1279-1283 in OCEANS '85 - Ocean Engineering and the Environment.
Sandén, B., L. Hammar, and F. Hedenus. In prep. Are renewable energy resources large enough to replace non-renewable energy? in B. Sandén, editor. Systems perspectives on Renewable Power. Chalmers University of Technology, E-book.
Schweizer, P. E., G. F. Cada, and M. S. Bevelhimer. 2011. Estimation of the Risks of Collision or Strike to Freshwater Aquatic Organisms Resulting from Operation of Instream Hydrokinetic Turbines. Oak Ridge Laboratory, Oak Ridge.
SeaGIS. 2013. EventMeasure User guide v 3.50. SeaGIS Pty Ltd. Available at: http://www.seagis.com.au/
Shields, M. A., D. K. Woolf, E. P. M. Grist, S. A. Kerr, A. C. Jackson, R. E. Harris, M. C. Bell, R. Beharie, A. Want, E. Osalusi, S. W. Gibb, and J. Side. 2011. Marine renewable energy: The ecological implications of altering the hydrodynamics of the marine environment. Ocean & Coastal Management 54:2-9.
Simmonds, M. P. and V. C. Brown. 2010. Is there a conflict between cetacean conservation and marine renewable-energy developments? Wildlife Research 37:688-694.
Slabbekoorn, H., N. Bouton, I. van Opzeeland, A. Coers, C. ten Cate, and A. N. Popper. 2010. A noisy spring: the impact of globally rising underwater sound levels on fish. Trends in Ecology and Evolution 25:419-427.
Smit, B. and H. Spaling. 1995. Methods for cumulative effects assessment. Environmental Impact Assessment
Review 15:81-106.
Smit, C. F. and V. Peddemors. 2003. Estimating the probability of a shark attack when using an electric repellent. South African Statist. J. 37:59-78.
Smith, H. D. 2000. The industrialisation of the world ocean. Ocean & Coastal Management 43:11-28.
Sparling, C. and M. Lonergan. 2013. Collision risk modelling: Harbour seals and SeaGen at Strangford Lough. SMRU Ltd, SMRU Ltd.
Speed, C. W., M. G. Meekan, D. Rowat, S. J. Pierce, A. D. Marshall, and C. J. A. Bradshaw. 2008. Scarring patterns and relative mortality rates of Indian Ocean whale sharks. Journal of Fish Biology 72:1488-1503.
Suter, G. 1993a. Defining the Field. in G. Suter, editor. Ecological Risk Assessment. Lewis Publishers, Michigan.
Suter, G. 1993b. Predictive Risk Assessment of Chemicals.in G. Suter, editor. Ecological Risk Assessment. Lewis Publishers, Michigan.
Suter, G. and L. Barnthouse. 1993. Assessment Concepts. in G. Suter, editor. Ecological Risk Assessment. Lewis Publishers, Michigan.
Svane, I. and Jens K. Petersen. 2001. On the Problems of Epibioses, Fouling and Artificial Reefs, a Review. Marine Ecology 22:169-188.
Tethys. 2014. Tethys knowledge base. US Department of Energy. Available at: http://mhk.pnl.gov/wiki/index.php/Tethys_Home
Therivel, R. and B. Ross. 2007. Cumulative effects assessment: Does scale matter? Environmental Impact
Assessment Review 27:365-385.
Thomas, G. 2008. The Theory Behind the Conversion of Ocean Wave Energy: a Review. Pages 41-91 in J. Cruz, editor. Ocean Wave Energy - Current Status and Future Perspectives. Springer, Heidelberg.
Tielmann, J., J. Tougaard, J. Carstensen, R. Dietz, and S. Tougaard. 2006. Marine mammals - Seals and porpoises react differently. Pages 80-94 in D. Energy, editor. Danish Offshore Wind - Key Environmental Issues. Available at: http://188.64.159.37/graphics/Publikationer/Havvindmoeller /danish_offshore_wind.pdf
Tougaard, J., J. Carstensen, J. Teilmann, H. Skov, and P. Rasmussen. 2009. Pile driving zone of responsiveness extends beyond 20 km for harbor porpoises (Phocoena phocoena (L.)). The Journal of the Acoustical Society
of America 126:11-14.
Urick, R. J. 1983. Propagation of sound in the sea: Transmission loss, I. Pages 99-146 Principles of Underwater Sound. McGraw-Hill, New York.
US EPA. 1998. Guidelines for Ecological Risk Assessment. U.S. Environmental Protection Agency, Washington, DC. EPA/630/R-95/002F.

54
Waggitt, J. J. and B. E. Scott. 2014. Using a spatial overlap approach to estimate the risk of collisions between deep diving seabirds and tidal stream turbines: A review of potential methods and approaches. Marine Policy 44:90-97.
Wahlberg, M. and H. Westerberg. 2005. Hearing in fish and their reactions to sounds from offshore wind farms. Marine Ecology Progress Series 288:295-309.
Wardle, C. S. 1986. Fish behaviour and fishing gear. Pages 469-495 in T. Pitcher, editor. The behaviour of teleost fishes. Croom Helm, London.
Warwick, R. M. 1993. Environmental impact studies on marine communities: Pragmatical considerations. Australian Journal of Ecology 18:63-80.
Waters, R., J. Engström, J. Isberg, and M. Leijon. 2009. Wave climate off the Swedish west coast. Renewable
Energy 34:1600-1606.
Weed, D. L. 2005. Weight of Evidence: A Review of Concept and Methods. Risk Analysis 25:1545-1557.
Wentsel, R., N. Beyer, V. Forbes, S. Maund, and R. Pastorok. 2008. A Framework for Population-Level Ecological Risk Assessment. Pages 211-238 in L. W. Barnthouse, W. R. Munns, and M. T. Sorensen, editors. Population-Level Ecological Risk Assessment. SETAC Press, Pensacola, US.
Verdant Power. 2010. Final Kinetic Hydropower Pilot License Application. Available at: http://www.theriteproject.com/Documents.html
Westerberg, H. 1994. Fiskeriundersökningar vid havsbaserat vindkraftverk 1990-1993. Fiskeriverket, Utredningskontoret, Jönköping.
Westerberg, H. and I. Lagenfelt. 2008. Sub-sea power cables and the migration behaviour of the European eel. Fisheries Management and Ecology 15:369-375.
Westerberg, H., P. Roennbaeck, and H. Frimansson. 1996. Effects on suspended sediments on cod egg and larvae and on the behaviour of adult herring and cod. ICES, Copenhagen (Denmark).
Wiedemann, P., H. Schütz, A. Spangenberg, and H. F. Krug. 2011. Evidence Maps: Communicating Risk Assessments in Societal Controversies: The Case of Engineered Nanoparticles. Risk Analysis 31:1770-1783.
Viehman, H. A. 2012. Fish in tidally dynamic region in Maine: Hydroacoustic assessments in relation to tidal power development. MSc thesis. The University of Maine, Orono.
Wilhelmsson, D. 2009. Aspects of offshore renewable energy and the alternations of marine habitats. Doctoral thesis. Stockholm University, Stockholm.
Wilhelmsson, D. and T. Malm. 2008. Fouling assemblages on offshore wind power plants and adjacent substrata. Estuarine, Coastal and Shelf Science 79:459-466.
Wilhelmsson, D., T. Malm, R. Thompson, J. Tchou, G. Sarantakos, N. McCormick, S. Luitjens, M. Gullström, J. K. Patterson Edwards, O. Amir, and A. Dubi, editors. 2010. Greening Blue Energy: Identifying and managing the biodiversity risks and opportunities of offshore renewable energy. IUCN, Gland.
Wilhelmsson, D., T. Malm, and M. C. Öhman. 2006. The influence of offshore windpower on demersal fish. ICES Journal of Marine Science: Journal du Conseil 63:775-784.
Wilson, B., R. S. Batty, F. Daunt, and C. Carter. 2007. Collision risks between marine renewable energy devices and mammals, fish and diving birds - Report to the Scottish Executive. Scottish Association for Marine Science, Oban.
Wilson, B. and C. Carter. 2013. The use of acoustic devices to warn marine mammals of tidal-stream energy devices. Scottish Association for Marine Science. Available at: http://www.scotland.gov.uk/Resource/0043/00436112.pdf
Winter, H. V., G. Aarts, and O. A. Van Keeken. 2010. Residence time and behaviour of sole and cod in the Offshore Wind farm Egmond aan Zee (OWEZ). IMARES, Wageningen.
Wiser, R., Z. Yang, M. Hand, O. Hohmeyer, D. Infield, P. H. Jensen, V. Nikolaev, M. O'Malley, G. Sinden, and A. Zervos. 2011. Wind Energy.in O. Edenhofer, R. Pichs-Madruga, Y. Sokona, K. Seyboth, P. Matschoss, S. Kadner, T. Zwickel, P. Eickemeier, G. Hansen, S. Schlömer, and C. von Stechow, editors. IPCC Special Report on Renewable Energy Sources and Climate Change Mitigation. Cambridge University Press, Cambridge, United Kingdom and New York, NY, USA.
Vitousek, P. M., H. A. Mooney, J. Lubchenco, and J. M. Melillo. 1997. Human Domination of Earth's Ecosystems. Science 277:494-499.

55
Acknowledgements This work was made possible by the kind support from the Futura foundation, the
Adlerbertska research foundation and Chalmersska.
A lot of people attack the sea, I make love to it a pioneer once said. The same dear Jacques
Cousteau, also left another note: when you enter the ocean, you enter the food chain, and not
necessarily at the top. I can’t help but having those words ringing in my ears for every jump
in the sea. Actually, more than anything I’m just grateful to be alive. Perhaps that is to make
love to the sea?
Sandra, Linda and Johan, thank you for joining; and for not successfully feeding me to that
top of the food chain. And Mito, thank you for provoking that turbine-eating hippopotamus in
the slight other direction. Helene, what would have been if I didn’t have you to dance me
through Africa? And Jimmy, what would have been if I didn’t have you to dance me through
all those digital numbers? I truly have appreciated your engagement and support. Martin, what
would have been if you were not always that solid rock; or if you never held that inspiring
lecture long long ago? Would I even know the color of seagrass? You have given me so
much. Mr Slang, what would have been if you didn’t shoulder me through it all? Or if
Kristina actually killed Mr Haste?
Little brothers, what would have been if you didn’t have a phone; and those four smiley little
faces to share? Lisa and Isa, what would have been, if you didn’t have me? Pappa, how much
would my nose not bleed if I didn’t have you polishing my turbine? Or if you told me that
secret about currents in Öresund? And mamma, what would have been if you didn’t always
pave my way?
Inês, what would have been without your support throughout the years? And Kenyon, my
scientific tutor, who would have peeled the bum of my shrimps without you? Francisco
Francisco, what would have been if you didn’t accompany me through all those tidal waves,
sharks and filthy savannas?
Mathias, what would have been if you gave me a lesson in LaTour instead of all the juicy
beverages? And Rickard, what would ever have been, if we didn’t kill all those 100000000
dolphins? Sara, thanks for not having your defense on my day. Or wait... Mia, Björn-Danijel
and Francesca, what would have been if you didn’t so kindly ease my head? Robin and Fidde,
what would have been if you kept fishing with me, instead of goofing around those small
insignificant invertebrates?
Umeå, thanks for providing me the foundation, and the Stings for keeping up the
maintenance. Rutger, thank you for introducing me to science. Systems ecology, thank you
for providing the precious borderlands of cocktails and saving-the-world. Environmental
Systems Analysis, thank you for showing me how there actually is no system boundary
between green and gray.
Diana, what would have been if you didn’t come to pigghaj me, and so beautifully shine on
my path? Sverker, what would have been if you would never had picked up that phone call?
Thanks man.