planning & scheduling - training
TRANSCRIPT

Mohammed Abdul Moiz FerozeB.E, PMP, CCP
Consultant Planning- Depots & StationsHyderabad Metro Rail Project

Advantages of Planning:.
1) A thorough plan contains multiple solutions
2) Maintaining an ongoing "to-do" list for your business
3) Each item you complete represents a success for you and your business
4) Use the information to make a more realistic estimate for that type of project in the future.
5) All members have the same guideline to follow when working so they are all on the same page
6) Better utilization of Resources
Influencing the future by making decisions based on missions, needs and objectives - Planning

Advantages of Scheduling:
1)Level of Information
2) Delay Analysis
3) Earned Value Analysis
4) SPI
5) CPI
6) BAC & ETC
Establish Start and finish dates – Activity, Phase, and Project- Scheduling


Monitor & Control
Project Phases:
1) Initiation2) Planning3) Execution4) Monitor & Control5) Closeout
Initiation Planning Execution Closeout
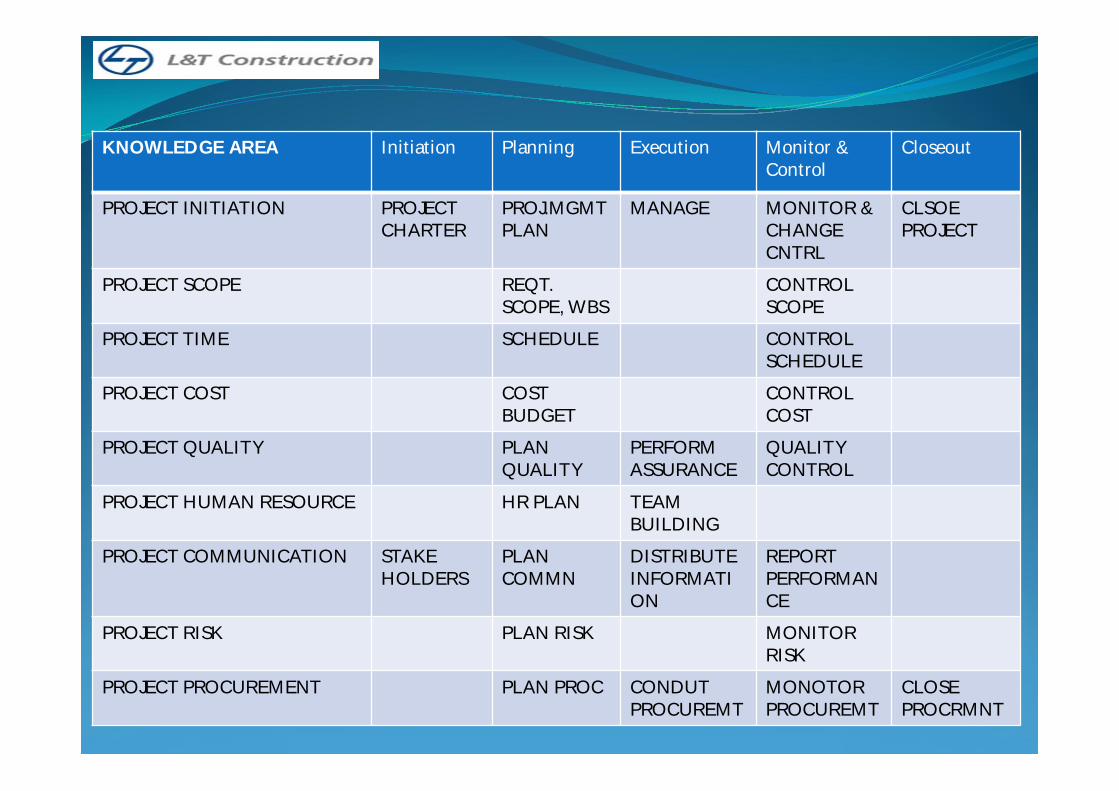
KNOWLEDGE AREA Initiation Planning Execution Monitor & Control
Closeout
PROJECT INITIATION PROJECT CHARTER
PROJ.MGMT PLAN
MANAGE MONITOR & CHANGE CNTRL
CLSOEPROJECT
PROJECT SCOPE REQT.SCOPE, WBS
CONTROL SCOPE
PROJECT TIME SCHEDULE CONTROL SCHEDULE
PROJECT COST COST BUDGET
CONTROL COST
PROJECT QUALITY PLAN QUALITY
PERFORM ASSURANCE
QUALITY CONTROL
PROJECT HUMAN RESOURCE HR PLAN TEAM BUILDING
PROJECT COMMUNICATION STAKE HOLDERS
PLAN COMMN
DISTRIBUTE INFORMATION
REPORT PERFORMANCE
PROJECT RISK PLAN RISK MONITOR RISK
PROJECT PROCUREMENT PLAN PROC CONDUT PROCUREMT
MONOTOR PROCUREMT
CLOSEPROCRMNT

ENTERPRISE / ORGANIZATION
PORTFOLIO 1 PORTFOLIO 2
PROGRAM 1 PROGRAM 2 PROGRAM 1 PROGRAM 2
PROJECT 1
PROJECT 2
PROJECT 3
PROJECT 4
Typical Enterprise Breakdown Structure

A . M . NAIK
SNS
M. V SATISH
CSL
Organization Breakdown Structure

CSL
V. MOORTHY RBK
HSPS SHUKLA CS CS Anand
JASONA.
KHAN SANJEEV PRABHAKAR
Resource Breakdown Structure
NAVYATA RAJA

Work Breakdown Structure: Decomposition of work into more manageable parts.
Triple Constraints:
1) Scope
1) Time
2) Cost
Scope Time Cost∞ ∞
Scope is the process of developing a detailed description of the project and product. (Two Methods of Decomposition).
We Cannot deliver our project, if we do not know what is to be delivered (Scope), by what time and what cost.

MIYAPUR DEPOT
BUILDINGS EXTERNAL WORKS
GUARD HOUSE ANNEX EARTH
WORKS SUB-SRFACE
ENGG PROC. CONS T&C
Work Breakdown Structure (WBS)
GFC DWG-10
GFC DWG-MEP- 5
GFC DWG ARCH - 5
CIVIL 5000
MEP 5000
BMS 1
CHILLER 4
PUMPS 5
EXCV 2000FOUND 40
COLUMN 40SLAB 1500
BLOCK 1600PLSTR 3200PAINT 3200DOORS 20
WINDOW 12LIGHT 60
CHILLER 4PUMPS 5
BMS 1
PUMPS 5
CHILLER 4
BMS 1
Work package

Method of Planning:
Software's : Primavera, MSP, TILOS, EXCEL, Power Point Presentation
Tools:Earned value Management, Forecasting, To-completeperformance index (TCPI), Performance reviews, Reserve analysis
Skills: Business Acumen, Communication, Leadership, Problem Solving

Scope Planning:
Inputs Required:
Work StatementContractProject CharterStake Holder Requirements
Output Developed:
WBSWork PackageActivities Schedule, Cost, Quality, HR, Communicate, Risk,
Procure, Sub-Contract, Rolling Wave Planning,

Engineering: Basic 3 types of engineering1) Pure Research Engineering
2) Applied Research Engineering
3) Copyright EngineeringMaterial: Basic 4 types of Material:1)Raw Material: Minimum amount of Processing required before use
2) Bulk Material: Also called Shelf material – ready to use
3) Fabricated Material: Bulk materials modified as per requirement
4) Engineered material: Designed material with substantial amount of engineering required.

LABOR (MEN & MACHINES)
DIRECT INDIRECT
FIXED VARIABLE(80%) FIXED VARIABLE
PRIMAVERA: LABOUR, NON-LABOUR, MATERIAL
MSP: WORK, MATERIAL, COST
OTHERS: SKILLED, SEMI SKILLED, UN-SKILLED

Construction Work Flow: Activity Based CostingDivision 01 — General RequirementsDivision 02 — Site ConstructionDivision 03 — ConcreteDivision 04 — MasonryDivision 05 — MetalsDivision 06 — Wood and PlasticsDivision 07 — Thermal and Moisture ProtectionDivision 08 — Doors and WindowsDivision 09 — FinishesDivision 10 — SpecialtiesDivision 11 — EquipmentDivision 12 — FurnishingsDivision 13 — Special ConstructionDivision 14 — Conveying SystemsDivision 15 — MechanicalDivision 16 — Electrical
These are used for BOQ preparation & Accounting People:

Sno. Description Unit Qty cost Amount
HM-DP-01-01-00 General Requirements Lot 1 6,30,000 6,30,000.00
HM-DP-01-02-00 Site Construction Lot 1 5,70,000 5,70,000.00
HM-DP-01-03-00 Concrete Lot 1 3,50,00,000 3,50,00,000.00
HM-DP-01-04-00 Masonry Lot 1 2,30,000 2,30,000.00
HM-DP-01-08-00 Doors and Windows Lot 1 2,80,000 2,80,000.00
HM-DP-01-09-00 Finishes Lot 1 33,00,000 33,00,000.00
HM-DP-01-15-00 Mechanical Lot 1 26,00,000 26,00,000.00
HM-DP-01-16-00 Electrical Lot 1 33,00,000 33,00,000.00
TOTAL 4,59,10,000.00
Typical BOQ Preparation:
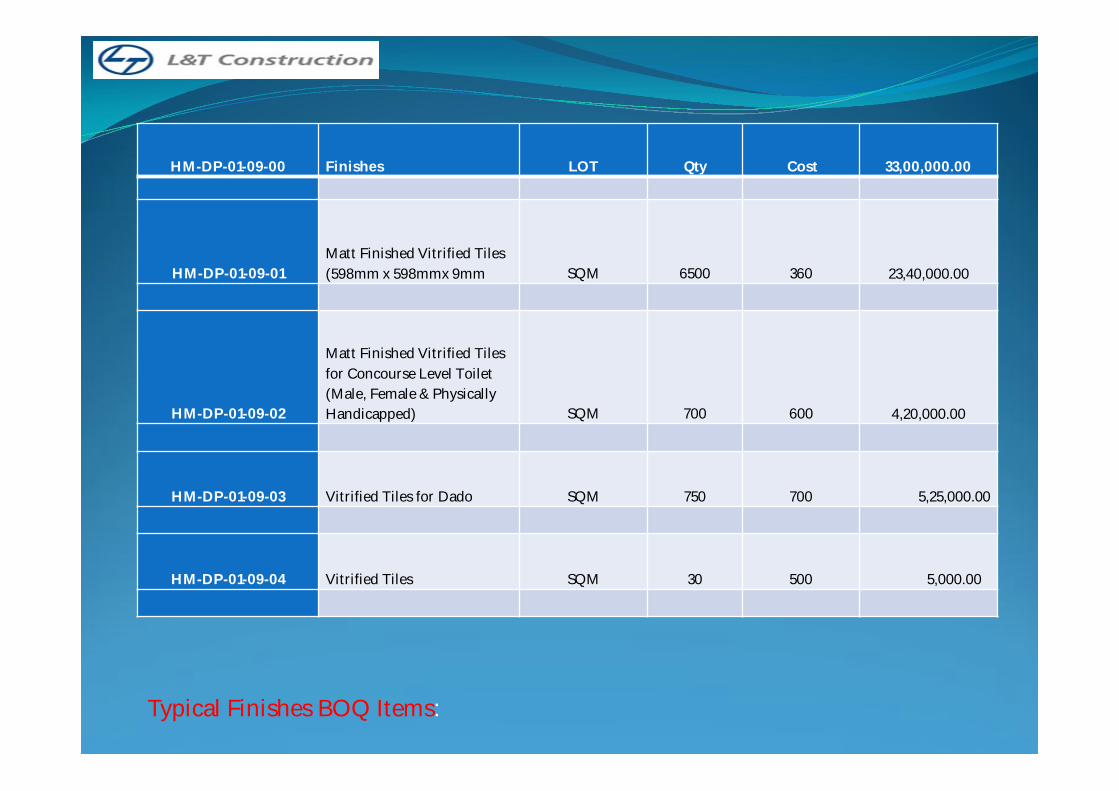
HM-DP-01-09-00 Finishes LOT Qty Cost 33,00,000.00
HM-DP-01-09-01Matt Finished Vitrified Tiles (598mm x 598mmx 9mm SQM 6500 360 23,40,000.00
HM-DP-01-09-02
Matt Finished Vitrified Tiles for Concourse Level Toilet (Male, Female & Physically Handicapped) SQM 700 600 4,20,000.00
HM-DP-01-09-03 Vitrified Tiles for Dado SQM 750 700 5,25,000.00
HM-DP-01-09-04 Vitrified Tiles SQM 30 500 5,000.00
Typical Finishes BOQ Items:

Estimation: Prediction made before start of any activity or Project.Forecast: Prediction made after the start of any activity or Project.
Estimating Techniques 6 Types:
Expert Judgment: Expert judgment, guided by historical information, provides valuable insight about the environment and information from prior similar projects.
Analogous Estimating: Analogous cost estimating uses the values such as scope, cost, budget, and duration or measures of scale such as size, weight, and complexity from a previous, similar project as the basis for estimating the same parameter or measurement for a current project. When estimating costs, this technique relies on the actual cost of previous, similar projects as the basis for estimating the cost of the current project.
Parametric Estimating: Parametric estimating uses a statistical relationship between relevant historical data and other variables (e.g., square footage in construction) to calculate a cost estimate for project work. This technique can produce higher levels of accuracy depending upon the sophistication and underlying data built into the model.
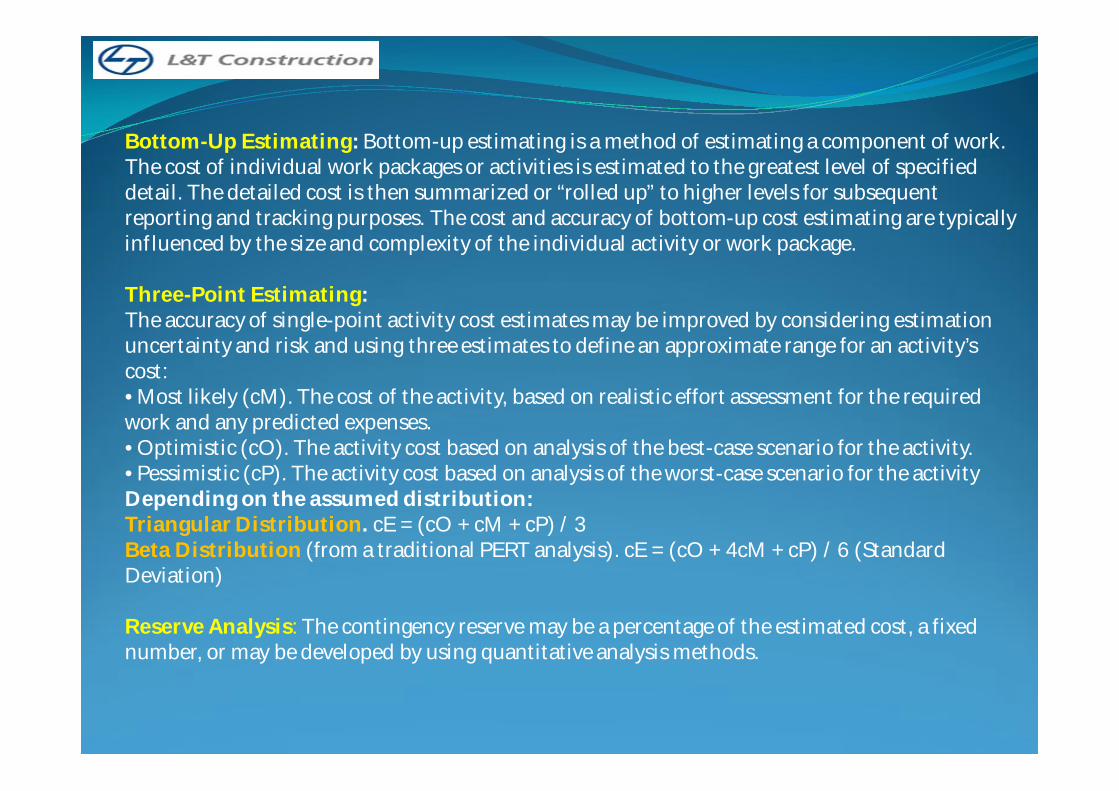
Bottom-Up Estimating: Bottom-up estimating is a method of estimating a component of work. The cost of individual work packages or activities is estimated to the greatest level of specified detail. The detailed cost is then summarized or “rolled up” to higher levels for subsequent reporting and tracking purposes. The cost and accuracy of bottom-up cost estimating are typically influenced by the size and complexity of the individual activity or work package.
Three-Point Estimating:The accuracy of single-point activity cost estimates may be improved by considering estimation uncertainty and risk and using three estimates to define an approximate range for an activity’s cost:• Most likely (cM). The cost of the activity, based on realistic effort assessment for the required work and any predicted expenses.• Optimistic (cO). The activity cost based on analysis of the best-case scenario for the activity.• Pessimistic (cP). The activity cost based on analysis of the worst-case scenario for the activityDepending on the assumed distribution:Triangular Distribution. cE = (cO + cM + cP) / 3Beta Distribution (from a traditional PERT analysis). cE = (cO + 4cM + cP) / 6 (Standard Deviation)
Reserve Analysis: The contingency reserve may be a percentage of the estimated cost, a fixed number, or may be developed by using quantitative analysis methods.

PLANNING FOR SUCCESS IS NO SMALL ENDEAVOR. WHEN DONE WELL, HOWEVER, IT WILL REAP MANY LARGE REWARDS.
End of Planning


Part II - Scheduling
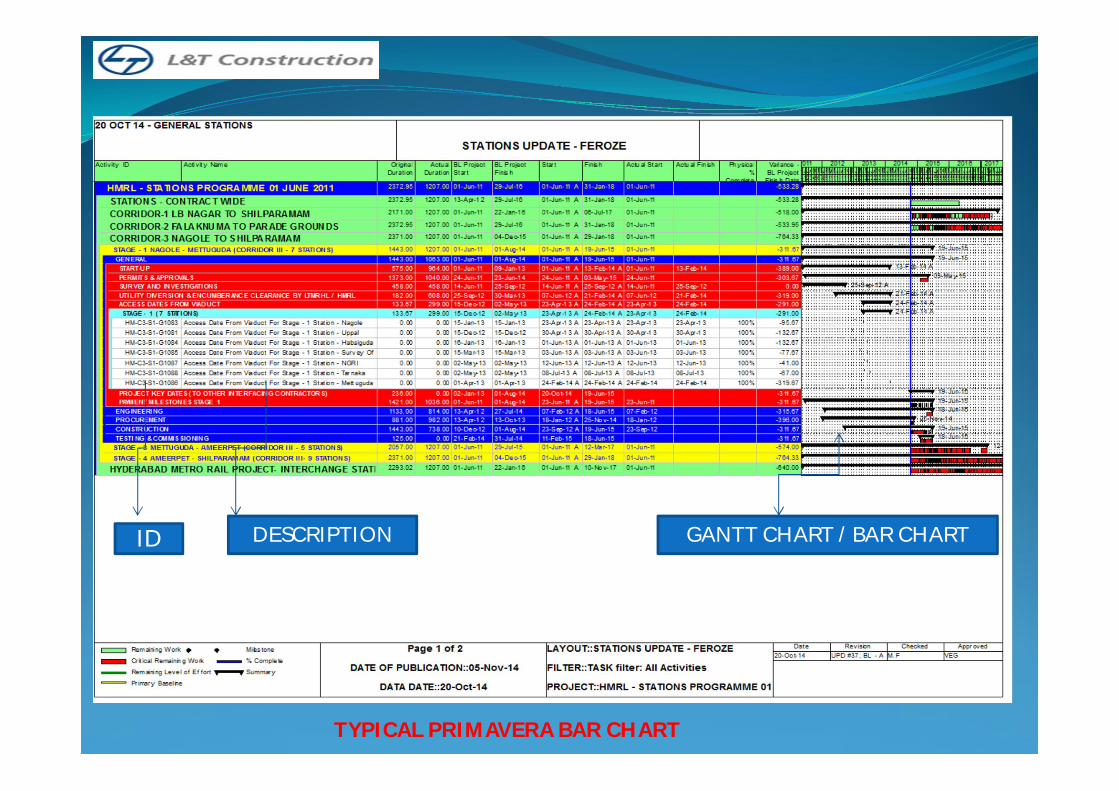
ID DESCRIPTION GANTT CHART / BAR CHART
TYPICAL PRIMAVERA BAR CHART

Item 01-Jan-1408-Jan-14 15-Jan-14 22-Jan-14 29-Jan-14 05-Feb-14 12-Feb-14 19-Feb-14 26-Feb-1405-Mar-14 12-Mar-14 19-Mar-1426-Mar-1402-Apr-1409-Apr-14
Excavation
PCC
Form Work
Rebar
Concrete
Dismantle FM
Wall Planning by Henry Gantt:

Flow of Work: Water Fall Method
The waterfall model is a sequential process, in which progress is seen as flowing steadily downwards (like a waterfall) through the phases of Conception, Initiation, Analysis, Design, Construction, Testing, Production/Implementation and Maintenance.

Network Diagram: Activity on Node and Activity on Arrow:

CPM, PERT & CCM:
CPM: The Shortest Duration to complete a project in a Networking Path. The critical path is the path where the float is zero. Developed by Dupont and Remington Rand in the 1950’s to manage plant maintenance projects
PERT: Progress Evaluation Review Technique: 3 Point Analysis Estimation (Triangular Distribution). Developed by Frederick Taylor and Henry Ford in the 1950’s to manage Polaris Submarine System.
CCM: Critical Chain Method proposed by Eliyahu Goldratt in his book Goal.


Precedence Diagramming Method (PDM): With advancement of PERT & CPM the network logic diagramming was developed.
a 10
ES EF
LS LF
b 22
ES EF
LS LF
c 6
ES EF
LS LF
e 25ES EF
LS LF
d 8
ES EF
LS LF
f 25ES EF
LS LF
g 12ES EF
LS LF
h 14ES EF
LS LF
i 16ES EF
LS LF
j 6ES EF
LS LF
k 7ES EF
LS LF
L 10ES EF
LS LF
m 5ES EF
LS LF

a 10
1 10
LS LF
b 22
11 32
LS LF
c 6
33 38
LS LF
e 2511 35
LS LF
d 8
39 46
LS LF
f 2536 60
LS LF
g 1261 72
LS LF
h 1473 86
LS LF
i 1611 27
LS LF
j 628 33
LS LF
k 734 40
LS LF
L 1041 50
LS LF
m 5
475186
525591
LS LFForward Pass
A+b+c+d+m a+e+f+g+h+m a+i+j+k+l+m
a 10
1 10
1 10
b 22
11 32
51 72
c 6
33 38
73 78
e 2511 35
11 35
d 8
39 46
79 86
f 2536 60
36 60
g 1261 72
61 72
h 1473 86
73 86
i 1611 27
47 63
j 628 33
64 69
k 734 40
70 76
L 1041 50
77 86
m 5
87 91
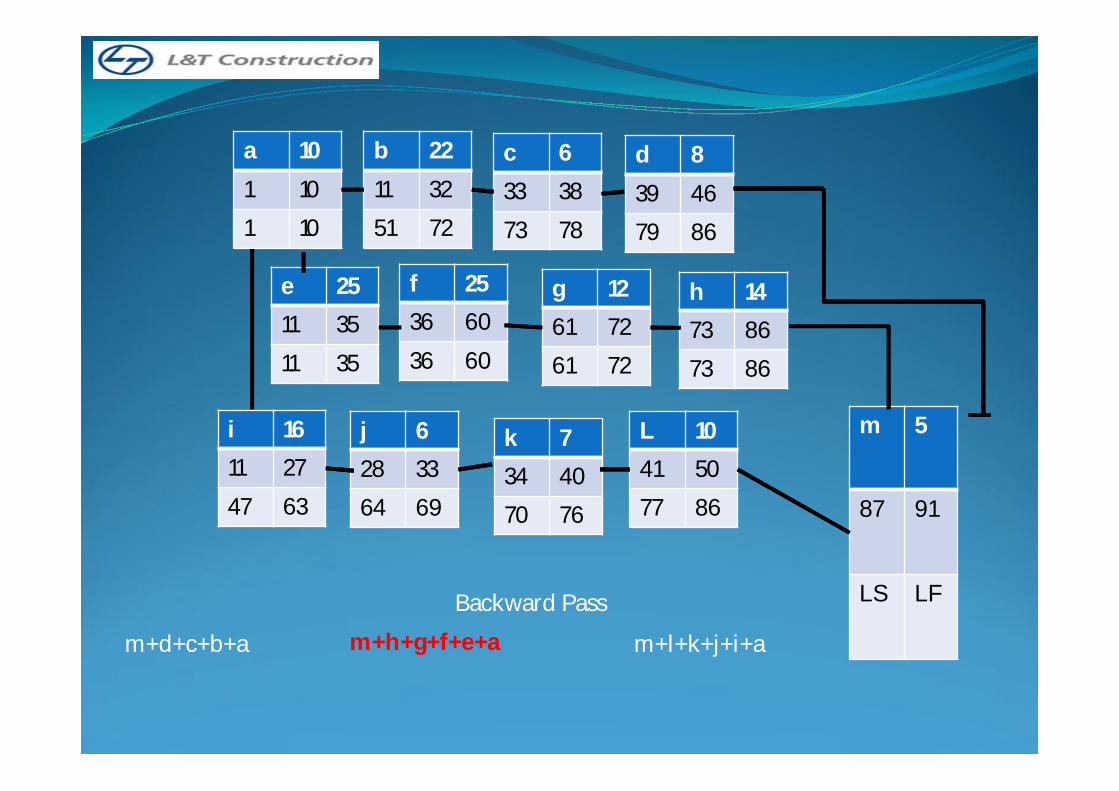
LS LFBackward Pass
m+d+c+b+a m+h+g+f+e+a m+l+k+j+i+a
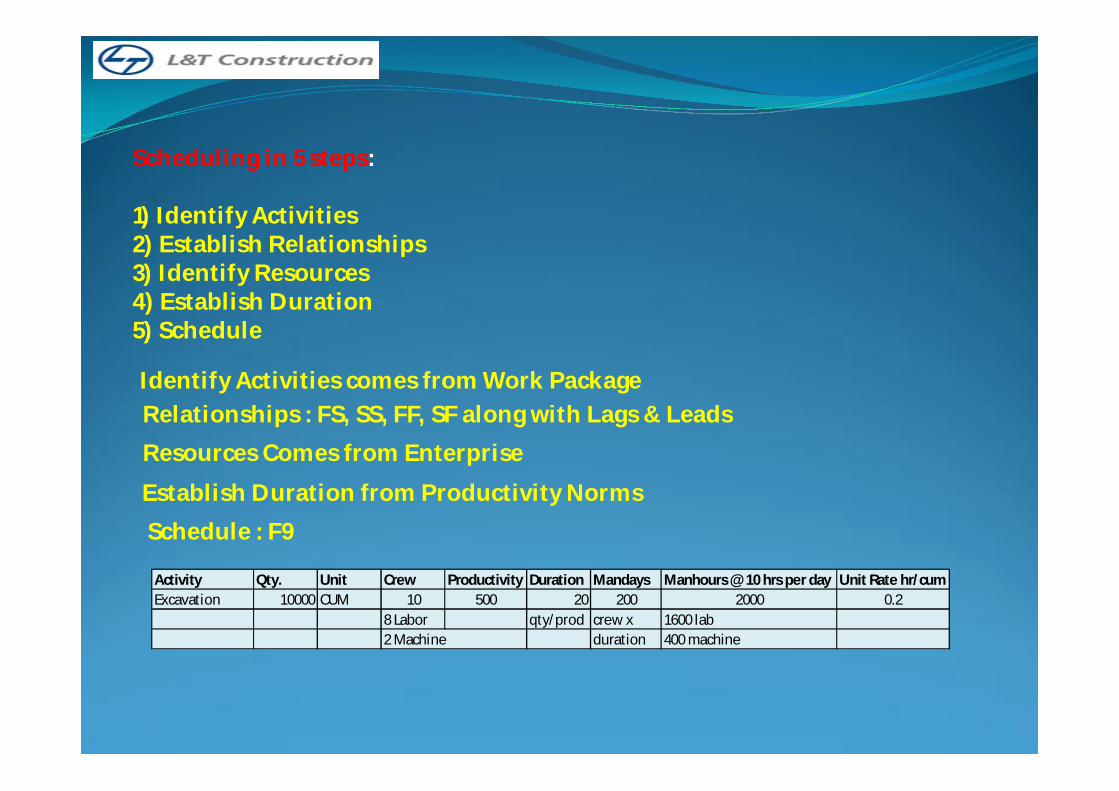
Scheduling in 5 steps:
1) Identify Activities2) Establish Relationships3) Identify Resources4) Establish Duration5) Schedule
Identify Activities comes from Work PackageRelationships : FS, SS, FF, SF along with Lags & Leads
Resources Comes from Enterprise
Establish Duration from Productivity Norms
Schedule : F9
Activity Qty. Unit Crew Productivity Duration Mandays Manhours @ 10 hrs per day Unit Rate hr/cumExcavation 10000 CUM 10 500 20 200 2000 0.2
8 Labor qty/prod crew x 1600 lab2 Machine duration 400 machine

Level 1 Schedule Executive Summary, also called a Project Master Schedule (PMS).Level 2 Schedule Management Summary, also called a Summary Master Schedule (SMS).Level 3 Schedule Project Coordination Schedule (PCS) also called a Publication Schedule.Level 4 Schedule Execution Schedule, also called a Project Working Level Schedule.Level 5 Schedule Detail Schedule. The further breakdown of the activities of a Level 4 Schedule.
Level of Schedule:

Delay Analysis:
There are five type of delay Analysis:

Earned Value Analysis: Budgeted Cost Work Performed by total Work
Once we have made our progress assessment, Earn value analysis tool will automatically calculate our Earned Value (% complete x Budget for each activity). Various KPI’s (Key Performance Index) can be calculated such as:
Cost Variance (CV) – The numerical difference between the earned value (BCWP) and the actual cost (ACWP). CV = BCWP – ACWP.
Schedule Variance (SV) - An indicator of how much a program is ahead of or behind schedule. SV = BCWP – BCWS. (Earned value – planned budget, or the difference between the value of work accomplished for a given period and the value of the work planned). Schedule variance is presented well in chart format.
Cost Performance Index (CPI) – The cost efficiency factor representing the relationship between the actual cost expended and the earned value. CPI = BCWP/ACWP. A CPI ≥ 1 suggests a relatively efficient cost factor, while a CPI <1 may be cause for concern.
Schedule Performance Index (SPI) – The planned schedule efficiency factor representing the relationship between the earned value and the initial planned schedule. SPI = BCWP/BCWS. A SPI ≥ 1 is good. SPI < 1 suggests actual work is falling behind the planned schedule.

Budget at Completion (BAC) – Original completion budget for project
Estimate to complete (ETC) – A calculated value, in dollars or hours that represents the cost of work required to complete remaining project tasks. ETC = BAC – BCWP.
Estimate at Complete (EAC) – A calculated value, in dollars or hours, that represents the projected total final costs of work when completed. EAC = ACWP + ETC.
It is usual to review the progress report at a monthly meeting to decide where action needs to be taken. EVA will tell you where you have a problem, and what you need to do to finish the job on time, providing all stakeholders with a visibility of progress vs plan.

Progress Measurement: There are 6 Types of Progress measurement:
Units Method
Supervisory Method
Start – Finish Method
Cost Factor Method
Incremental Method
Weight Factor Method

Establishing Weights:Contribution Factor Method
Description of Sub-System Cost in Crs
Duration - Total No of Weeks
Level of Effort (Scale of 5)
Criticality (Scale of 5)
Risk factor (Scale of 5) Percentage Round Figure
ENGINEERING 12.00 30.00 3.00 3.00 5.00 9.16% 9.00%PROCUREMENT 60.00 40.00 5.00 5.00 5.00 25.10% 25.00%CONSTRUCTION 159.00 80.00 5.00 5.00 5.00 55.74% 56.00%TESTING & COMM. 15.00 12.00 5.00 5.00 3.00 10.01% 10.00%Total 246.00 162.00 18.00 18.00 18.00Weitage Factor 70% 10% 5% 10% 5% 100.00% 100.00%
Cost 70%
Duration 10%
Manhours (LOE) 5%
Criticality 10%
Risk Factor 5%
LEVEL 1


-
2,000
4,000
6,000
8,000
10,000
12,000
14,000
-
100
200
300
400
500
600
700
800
900
Apr
-12
Jun-
12
Aug
-12
Oct
-12
Dec
-12
Feb-
13
Apr
-13
Jun-
13
Aug
-13
Oct
-13
Dec
-13
Feb-
14
Apr
-14
Jun-
14
Aug
-14
Oct
-14
Dec
-14
Feb-
15
Apr
-15
Jun-
15
Aug
-15
Oct
-15
Dec
-15
Feb-
16
Apr
-16
Jun-
16
CASTING Vs ERECTION - PLAN Vs ACTUAL- Month WisePlan Progress(Casting)Actual Progress(Casting)Casting Progress(Cum)Casting Actual(Cum)Erection Progress(Cum)
GENERAL, -2.48%
ENGINEERING, -0.95%
PROCUREMENT, -13.17%
CONSTRUCTION, -19.23%
T&C, -1.47%
Overall Variance Analysis

END OF SCHEDULING
S-CurveHistogramsResourceDash BoardKPI