photocontrollable fluorogenic probes for visualising near
TRANSCRIPT

RSC Advances
PAPER
Ope
n A
cces
s A
rtic
le. P
ublis
hed
on 1
5 Ju
ne 2
017.
Dow
nloa
ded
on 2
/6/2
022
6:07
:46
PM.
Thi
s ar
ticle
is li
cens
ed u
nder
a C
reat
ive
Com
mon
s A
ttrib
utio
n-N
onC
omm
erci
al 3
.0 U
npor
ted
Lic
ence
.
View Article OnlineView Journal | View Issue
Photocontrollab
aKey Laboratory of Flexible Electronics (KLOF
Jiangsu National Synergetic Innovation C
Nanjing Tech University (Nanjing Tech), 30
R. China. E-mail: [email protected]; iambKey Laboratory of Bioorganic Synthesis of Z
and Bioengineering, Zhejiang University of TcKey Laboratory for Organic Electronics
Advanced Materials (IAM), Nanjing Unive
Wenyuan Road, Nanjing 210023, P. R. Chin
† Electronic supplementary informatiocharacterisation, photophysical spectraDOI: 10.1039/c7ra03559d
Cite this: RSC Adv., 2017, 7, 31093
Received 27th March 2017Accepted 31st May 2017
DOI: 10.1039/c7ra03559d
rsc.li/rsc-advances
This journal is © The Royal Society of C
le fluorogenic probes forvisualising near-membrane copper(II) in live cells†
Buxiang Chen,a Liulin Wang,a Yanfei Zhao,a Yun Ni,a Chenqi Xin,a Chengwu Zhang,a
Jinhua Liu,a Jingyan Ge,b Lin Li *a and Wei Huang*ac
In this work, we have described the design, synthesis, and characterisation of photocontrollable fluorogenic
probe, Mem-5, which is equipped with a photolabile group (nitrobenzyl group), high brightness reporter
(fluorescein), and membrane-anchoring unit (cholesterol or long aliphatic chain). This probe shows an
intense fluorescence enhancement in response to copper(II) without interference from 45 other analytes,
including metal cations, amino acids, and anions, under biological conditions (pH 6–9). The hydrolysis
reaction is second-order, with k ¼ 9.01 � 10�5 M�1 s�1. The detection limit is 3.3 � 10�7 M in HEPES
buffer (25 mM). The confocal fluorescence imaging results demonstrated that Mem-5 can visualise near-
membrane copper(II) in live mammalian cells. The clear advantage of our photocontrollable method is
that it successfully avoids the influence of chemical species outside cells during near-membrane specific
detection.
Introduction
Cell plasma membranes are regarded as asymmetric due totheir inner and outer leaets having different compositions,based on the classic Singer–Nicolson model.1 This preventsforeign substances from entering the cell barrier freely,ensuring a relatively stable environment within the cell,2 butabsorbs and digests material inside and outside by endocytosis,phagocytosis, or exocytosis.3,4 Therefore, this lipid bilayer withembedded protein membranes is important for cell recogni-tion, signal transduction, cellulose synthesis, microbrilassembly, and other mechanisms,5 and can regulate cell lifeactivities as turntables for crucial processes in neurobiology,muscle contraction, and cell signalling.6,7 Given the pivotal roleof cell plasma membranes, the development of membrane-specic uorogenic probes to detect near-membrane elementshas attracted increasing attention.8–15
Copper(II) content in the human body is the second mostcommon trace element, and plays an essential role in humanmetabolism.16 Copper(II) overload has been shown to cause
E), Institute of Advanced Materials (IAM),
enter for Advanced Materials (SICAM),
South Puzhu Road, Nanjing, 211816, P.
hejiang Province, College of Biotechnology
echnology, Hangzhou 310014, P. R. China
and Information Displays, Institute of
rsity of Posts & Telecommunications, 9
a
n (ESI) available: Synthesis andand background control images. See
hemistry 2017
a range of neurological diseases, such as Wilson's and Alz-heimer's diseases.17,18 High-affinity copper transporter 1 (Ctr1)drives the entry of copper(II) into cells,19 while cells must ejectexcess copper(II) through the plasma membrane to maintaina low concentration of cytosolic free copper(II).20 Effectivemethods for evaluating free copper(II) near or across the plasmamembrane will aid understanding of the copper(II)transportation-related biological functions of cells. Regrettably,tools to precisely detect near-membrane copper(II) in live cellswithout interference by external copper(II) have still not beendeveloped.
With this in mind, herein, we have successfully developedtwo new photocontrollable uorogenic probes (Fig. 1) withdifferent membrane anchors to image near-membrane cop-per(II) in live mammalian cells with good spatial andtemporal controls using efficiently photolysis by ultraviolet(UV) light irradiation. Mem-1/2 (structures shown in Fig. 2),which contain a cholesterol or 12-carbon aliphatic chain,served as membrane tracers, and their membrane stainingability was compared using this “piggyback” strategy.21–23 Asshown in Fig. 1, uorescein hydrazide hydrolysed by cop-per(II) would normally be blocked due to the existence ofa caged unit aer membrane staining,24 facilitating thecomplete accumulation of Mem-5/6 with no uorescence.25
Subsequent UV irradiation will force removal of the cagedgroup, releasing uncaged Mem-3/4 (structures shown inFig. 2),26,27 which would then be hydrolysed by copper(II) togenerate a specic localised and strong uorescent signal.28
Notably, the modularity of our probe design should enablethis strategy to be readily applicable to the detection of othertargets near the membrane.
RSC Adv., 2017, 7, 31093–31099 | 31093

Fig. 1 Overall strategy of our photocontrollable fluorogenic probes,Mem-5 and Mem-6 (structures shown in box), for imaging membranecopper(II) in live cells.
Fig. 2 Structures of membrane tracers, Mem-1 and Mem-2, withdifferent anchors, and unphotocontrollable fluorogenic probes,Mem-3 and Mem-4, for imaging membrane copper(II) in live cells.
RSC Advances Paper
Ope
n A
cces
s A
rtic
le. P
ublis
hed
on 1
5 Ju
ne 2
017.
Dow
nloa
ded
on 2
/6/2
022
6:07
:46
PM.
Thi
s ar
ticle
is li
cens
ed u
nder
a C
reat
ive
Com
mon
s A
ttrib
utio
n-N
onC
omm
erci
al 3
.0 U
npor
ted
Lic
ence
.View Article Online
ExperimentalMaterials and instruments
All reagents and solvents were purchased from commercialsuppliers and used without further purication, unless other-wise noted. N,N-Dimethylformamide (DMF) was distilled overCaH2. Petroleum ether (PE, 60–90 �C), DCM, and ethyl acetate(EA) were used as eluents for ash column chromatographywith Merck silica gel (0.040–0.063). 1-(1-Bromoethyl)-2-nitrobenzene was synthesised according to a literature proce-dure, while uorescein and hydrazine hydrate were purchasedfrom Adamas.25 Cholesterol chloride and bromododecane werepurchased from Tokyo Chemical Industry. Nuclear (Hoechst33 342) and membrane (CM orange) trackers were purchasedfrom Invitrogen. Human hepatocellular carcinoma (HepG2)cells and fetal bovine serum (FBS) were purchased from ATCC(HB-8065™) and Biological Industries (BI, 04-001-01ACS),respectively. Other reagents used in the experiments werepurchased from Sigma-Aldrich and used without further puri-cation unless otherwise noted. Distilled water was used
31094 | RSC Adv., 2017, 7, 31093–31099
throughout the experiments. Absorption spectra were recordedusing SynergyHTX microplate reader or a Shimadzu UV-3600UV-Vis-NIR spectrophotometer. Photoluminescence spectrawere recorded using a HITACHI F4600 uorescence spectro-photometer with excitation slit widths of 5 nm and emission slitwidths of 10 nm. 1H and 13C NMR spectra were collected inCDCl3 or DMSO-d6 at 25 �C using an Avance AV-300 spectrom-eter. All photochemical reactions were conducted in an ultra-violet analyser ZF-20D. Ultrapure water was used to prepare allaqueous solutions. Fluorescein in 0.1 M NaOH (F ¼ 0.85) wasused as the standard for quantum yield measurements. Allspectroscopic measurements were performed in 25 mM HEPESbuffer (pH 7.4) at 37 �C. All images were acquired in the sameway at 20 �C on Zeiss LSM880 NLO (2 + 1 with BIG) confocalmicroscope system equipped with an objective LD C-Apochromat 63�/1.15 W Corr M27, 405 nm diode laser, argonion laser (458, 488, and 514 nm), HeNe laser (543 and 594 nm),and 633 nm laser, with 8 AOTF channels for simultaneouscontrol of 8 laser lines. A PMT detector ranging from 420 nm to700 nm was used for steady-state uorescence. Internal photo-multiplier tubes were used to collect the signals in 8 bitunsigned 1024 � 1024 pixels at a scan speed of 200 Hz. Imageswere processed with Zeiss User PC Advanced for LSM system(BLUE).
Synthetic procedures
All reactions were carried out under a dry nitrogen atmosphere.Reaction progress was monitored by TLC on pre-coated silicaplates (thickness, 250 mm) and spots were visualised using cericammonium molybdate, basic KMnO4, UV light, or iodine.
Synthesis of Mem-5. In a 50 mL round bottom ask, trie-thylamine (0.014 mL) was added to a solution of nitrobenzyl-protected uorescein hydrazide (50 mg, 0.10 mmol) in DMF (2mL). The mixture was stirred for 5 min under a dry nitrogenatmosphere. Cholesteryl chloroformate (45.34 mg, 0.10 mmol)in chloroform (0.8 mL) was added dropwise to the solution. Thereaction was stirred in an ice bath for another 8 h, followed bythe addition of saturated ammonium chloride aqueous solution(10 mL) and extraction with ethyl acetate (3 � 30 mL). Theorganic layer was washed three times with brine, dried overanhydrous Na2SO4, and ltered. Aer removing solvent underreduced pressure, the residue was puried by ash columnchromatography (silica gel, PE/EA ¼ 1 : 1) affording the productas a pink solid (yield 60%). 1H NMR (300 MHz, CDCl3): d (ppm)8.03 (d, J ¼ 4.5 Hz, 1H), 7.93 (t, J¼ 4.5 Hz, 1H), 7.75 (d, J ¼ 3 Hz,1H), 7.59 (t, J¼ 7.5 Hz, 1H), 7.45 (m, 3H), 7.09 (s, 1H) 7.02 (d, J¼3 Hz, 1H), 6.52 (m, 4H), 6.82 (dd, J1 ¼ 4.5 Hz, J2 ¼ 1.5, 1H), 6.65(d, J¼ 4.5 Hz, 2H), 6.52 (d, J¼ 3 Hz, 2H), 6.05 (dd, J1¼ 3 Hz, J2¼1.5 Hz, 1H), 5.42 (s, 1H), 4.60 (dd, J1 ¼ 6 Hz, J2 ¼ 3 Hz, 1H) 3.52(bs, NH2), 2.48 (s, 2H), 2.00 (m, 5H), 1.56 (m, 10H), 1.33 (m, 4H),0.91 (m, 22H), 0.68 (s, 3H). 13C NMR (75 MHz, CDCl3): d (ppm)166.41, 158.49, 152.49, 151.77, 150.66, 150.55, 139.16, 138.63,134.26, 134.21, 133.05, 128.61, 128.43, 128.37, 128.30, 128.20,127.50, 124.91, 123.94, 123.42, 123.37, 116.94, 116.51, 112.90,112.66, 110.04, 103.36, 103.21, 79.31, 71.86, 56.80, 56.27, 50.11,42.43, 39.83, 39.62, 37.98, 36.92, 36.65, 36.30, 35.87, 32.01,
This journal is © The Royal Society of Chemistry 2017

Fig. 3 Absorption spectra of (a) Mem-1/3/5 and (b) Mem-2/4/6, andfluorescence emission spectra of (c)Mem-1/3/5 and (d)Mem-2/4/6 inHEPES buffer (probe concentration, 5.0 mM). Abs¼ absorbance, RFU¼relative fluorescence units.
Paper RSC Advances
Ope
n A
cces
s A
rtic
le. P
ublis
hed
on 1
5 Ju
ne 2
017.
Dow
nloa
ded
on 2
/6/2
022
6:07
:46
PM.
Thi
s ar
ticle
is li
cens
ed u
nder
a C
reat
ive
Com
mon
s A
ttrib
utio
n-N
onC
omm
erci
al 3
.0 U
npor
ted
Lic
ence
.View Article Online
31.96, 28.31, 28.09, 27.69, 24.38, 23.93, 23.67, 23.62, 22.90,22.66, 21.16, 19.36, 18.83, 11.97.
Synthesis of Mem-6. To a stirred solution of nitrobenzyl-protected uorescein hydrazide (50 mg, 0.10 mmol) in dryDMF (2 mL) was added Cs2CO3 (114.04 mg, 0.35 mmol) andbromododecane (25.16 mg, 0.10 mmol) under a dry nitrogenatmosphere. Aer being stirred for 8 h at 60 �C, the reaction wasstopped with the addition of saturated aqueous ammoniumchloride (10 mL). The mixture was extracted and isolated asdescribed above in the procedure forMem-5, to affordMem-6 asa pink solid (yield 62%). 1H NMR (300 MHz, CDCl3): d (ppm)8.04 (d, J ¼ 4.5 Hz, 1H), 7.92 (t, J ¼ 4.5 Hz, 1H), 7.74 (d, J ¼4.5 Hz, 1H), 7.60 (t, J ¼ 7.5 Hz, 1H), 7.46 (m, 3H), 7.01 (dd, J1 ¼3 Hz, J2 ¼ 1.5 Hz, 1H), 6.70 (d, J¼ 4.5 Hz, 1H), 6.52 (m, 4H), 6.04(dd, J1 ¼ 3 Hz, J2 ¼ 1.5 Hz, 1H), 3.94 (t, J ¼ 7.5 Hz, 2H), 3.63 (bs,NH2), 1.70 (m, 4H), 1.42 (s, 1H), 1.26 (s, 19H), 0.87 (d, J¼ 7.5 Hz,3H). 13C NMR (75 MHz, CDCl3): d (ppm) 166.43, 160.40, 158.41,153.23, 151.01, 138.79, 134.33, 134.27, 132.94, 129.83, 128.75,128.60, 128.54, 128.11, 127.57, 124.94, 123.87, 135.35, 112.73,112.47, 112.31, 110.20, 103.18, 103.00, 101.65, 71.85, 68.45,63.17, 32.95, 32.02, 29.76, 29.73, 29.70, 29.67, 29.45, 29.22,26.11, 23.68, 22.79, 14.21.
Photouncaging reactions
For in vitro analysis, different concentrations (2.0 mM forselectivity/kinetic experiments and 10.0 mM for pH titrationexperiments) of Mem-5 were placed in quartz glassware andsubmitted to UV irradiation (500 mJ cm�2 at 400 nm) for 5 min atroom temperature to generate uncagedMem-5 in HEPES buffer.In live cell imaging, cells were incubated with Mem-5 (2.0 mM)for 20 min at 37 �C, followed by further UV irradiation (500 mJcm�2, 5 min) at room temperature in cover-free dishes togenerate uncaged Mem-5.
Cell culture and cytotoxicity activity assay
HepG2 cells were cultured in Dulbecco's Modied Eagle'sMedium (DMEM), containing 10% FBS, 100.0 mg L�1 strep-tomycin, and 100 IU mL�1 penicillin. HepG2 cells were seededin glass-bottom dishes (Mattek) and grown to 70–80% con-uency. The cytotoxicity activities of the probes were deter-mined using an XTT colorimetric cell proliferation kit (Roche),following the manufacturer guidelines. Briey, different cellswere grown to 20–30% conuency (they would reach 80–90%conuency within 48–72 h in the absence of compounds) in 96-well plates under the conditions described above. The mediumwas aspirated, washed with PBS, and then treated, in dupli-cate, with 0.1 mL of the medium containing differentconcentrations of Mem-1/2/3/4/5/6 (1–50 mM). Probes wereapplied from DMSO stocks, whereby DMSO never exceeded 1%in the nal solution. The same volume of DMSO was used asa negative control, while the same volume of staurosporine(STS, 200 nM) was used as a positive control. Aer a totaltreatment time of 24 h, proliferation was assayed using theXTT colorimetric cell proliferation kit (Roche), followingmanufacturer guidelines (Fig. 4a).
This journal is © The Royal Society of Chemistry 2017
Live cells uorescence imaging
For organelle-specic imaging experiments, the cells wereincubated with Mem-1 and Mem-2 (1 mM prepared in freshmedium) for 20 min at 37 �C, followed by washing three timeswith PBS. To accurately visualise membrane copper, the cellswere incubated withMem-3 andMem-5 (5 mMprepared in freshmedium) for 20 min at 37 �C. Aer washing three times withPBS, the selected cells were irradiated for 2 min with UV lightthrough an ultraviolet analyser. The cells were then incubatedwith copper(II) (10 equiv.) for a further 60 min at 37 �C. Next, thecells were washed three times with PBS, then imaged with theZeiss LSM880 NLO (2 + 1 with BIG) confocal microscope system(Fig. 2 and 3). Hoechst 33 342 (250 nM, Ex ¼ 405 nm, PMT range¼ 420–460 nm) and CM orange (100 nM, Ex ¼ 543 nm, PMTrange ¼ 550–650 nm) were used as nuclear and membranetrackers, respectively. Meanwhile, another identical set ofsamples was treated as described above, but without UV irra-diation, as the negative control. Background signals of allimages were veried to be nearly zero by imaging the same cellstreated with a negative control.
Results and discussionSynthesis and characterisation
To validate our design, two photocontrollable uorogenicprobes (Mem-5/6) and four additional control probes (Mem-1/2/3/4) were synthesised following modied literaturemethods,29–31 as summarised in Scheme S1.† Two membranetracers (Mem-1/2) with different membrane anchors were ob-tained from the condensation of uorescein/uorescein esters(reporter, a dye with high brightness) and cholesterylchloroformate/bromododecane in �50% yield. Fluoresceinhydrazide, a copper(II)-responsive unit, was synthesised in onestep with an overall yield of 92% from commercially availablehydrazine hydrate and uorescein, followed by coupling withmembrane-targeting moieties to generate Mem-3/4, both in50% yield. Nitrobenzyl-protected uorescein hydrazide was
RSC Adv., 2017, 7, 31093–31099 | 31095

RSC Advances Paper
Ope
n A
cces
s A
rtic
le. P
ublis
hed
on 1
5 Ju
ne 2
017.
Dow
nloa
ded
on 2
/6/2
022
6:07
:46
PM.
Thi
s ar
ticle
is li
cens
ed u
nder
a C
reat
ive
Com
mon
s A
ttrib
utio
n-N
onC
omm
erci
al 3
.0 U
npor
ted
Lic
ence
.View Article Online
prepared by the condensation of uorescein hydrazide and 1-(1-bromoethyl)-2-nitrobenzene in 54% yield in the presence ofCs2CO3. Mem-5/6 (�60% yields) were prepared using a proce-dure similar to that described above for Mem-3/4. Thecompound structures were fully characterised by 1H and 13CNMR, with detailed synthetic procedures and original spectradescribed in the experimental section and ESI.†
To systemically demonstrate the potential utility of our newlydeveloped probes as good uorogenic systems for live cellimaging, we rst evaluated their chemical, photophysical, andbiological properties. As shown in Fig. 3a and b, under physi-ological conditions (HEPES buffer, pH 7.4), Mem-1/2, themembrane tracer references of Mem-5/6, had maximumabsorptions at 460 nm, with two shoulder peaks at 440 and460 nm, and an emission at 550 nm (Fig. 3c and d, F ¼ �0.15with uorescein in 0.1 M NaOH as the reference). Mem-1/2/3/4showed nearly no absorption or emission (F ¼ 0.001–0.0015) ataround the same wavelength, based on the closed-loop struc-ture. A similar outcome was observed in organic solvent(ethanol, Fig. S1–S4†). Furthermore, two different membraneanchors had no effect on the photophysical properties of theprobes, and the caged probes had very low uorescence back-grounds or high S/N ratios for live cell imaging.
Subsequently, the cytotoxicity assays showed no obvious celltoxicity at concentrations up to 50 mM forMem-1/3/5 and 20 mMfor Mem-2/4/6, in human hepatocellular carcinoma (HepG2)cells (Fig. 4a). The results showed that Mem-1/3/5 witha cholesterol unit were more suitable for the living cell assay
Fig. 4 (a) XTT assay profiles of Mem-1/2/3/4/5/6, error barsrepresent s.e.m. (n ¼ 3). (b) One-photon fluorescence microscopyimaging of live HepG2 cells by control probes Mem-1 and Mem-2 (1mM). Live cells were incubated with the probes for 20 min at 37 �C,followed by addition of a commercially available nuclear stain (NU, 250nM) and membrane tracker (Mem-tracker, 100 nM), and then furtherincubation for 10 min before imaging. The excitation wavelength was457 nm, while the PMT range was 500–550 nm for probes. Inset in (1)is the differential interference contrast image (DIC). (3) and (8) aremerged images of (2) and (7) with related DIC, respectively; while (5)and (10) are merged images of (2)/(4) with the colocalisation analysis (R¼ 0.80) and (7)/(9) (R¼ 0.04), respectively. All images were acquired inthe same way. Scale bar ¼ 15 mm.
31096 | RSC Adv., 2017, 7, 31093–31099
than the group a long aliphatic chain at high concentrations.Theoretically, a probe/plasma membrane lipid ratio must belower than 1/100 for there to be no signicant perturbation ofthe biomembrane properties in cell membrane staining.32
Therefore, both Mem-1/3/5 and Mem-2/4/6 were suitable forliving cell imaging at low working concentrations, because weincorporated a high brightness reporter in the probe design.Therefore, to establish that Mem-1/2 was indeed a goodmembrane tracer for live cell imaging unequivocally, HepG2cells were treated with Mem-1/2, followed by one-photon uo-rescence imaging (background control shown in Fig. S5†). Weobserved uorescent staining exclusively within the plasmamembrane of the cells for Mem-1 (Fig. 4b(2/3), 1 mM treatmentfor 20 min). Otherwise, Mem-2, the probe with a 12-carbonaliphatic chain, stained whole cells without specic localisationon the plasma membrane (Fig. 4b(7/8)). As shown in Fig. 4b(5),the green uorescence signal ofMem-1 overlapped well with thered uorescence signal of the commercially availablemembrane tracker (CM-orange) with a high contrast ratio.Prolonged incubation of the cells with Mem-1 did not lead to
Fig. 5 (a) Effect of the 45 analytes (10 eq.) on uncagedMem-5 (2.0 mM,5 min UV-illumination) in HEPES buffer. (b) Photo of fluorescence withthe effect of analytes (10 eq.) on uncaged Mem-5 (2.0 mM) in HEPESbuffer after 60 min of incubation at 37 �C. (c) Effect of the analytes (50eq.) on uncaged (5 min of UV radiation)Mem-5 (2.0 mM) with Cu2+ (10eq.) in HEPES buffer. Red bars represent the fluorescence intensity at37 �C. Error bars represent s.e.m. (n ¼ 3).
This journal is © The Royal Society of Chemistry 2017
Paper RSC Advances
Ope
n A
cces
s A
rtic
le. P
ublis
hed
on 1
5 Ju
ne 2
017.
Dow
nloa
ded
on 2
/6/2
022
6:07
:46
PM.
Thi
s ar
ticle
is li
cens
ed u
nder
a C
reat
ive
Com
mon
s A
ttrib
utio
n-N
onC
omm
erci
al 3
.0 U
npor
ted
Lic
ence
.View Article Online
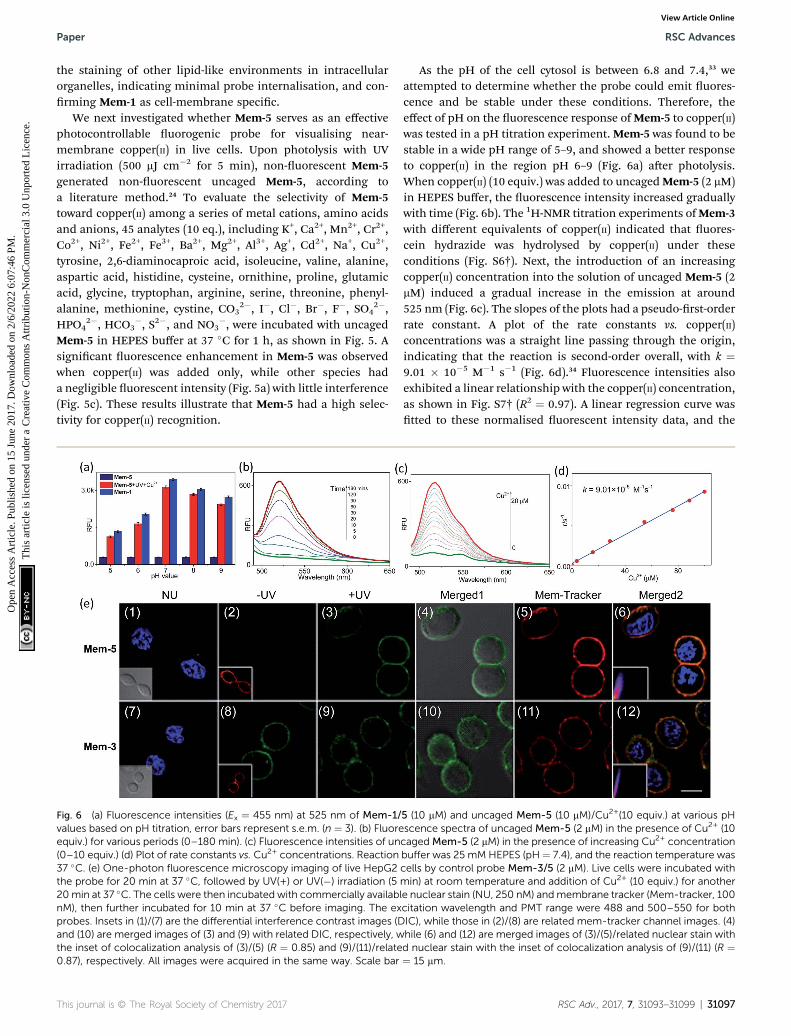
the staining of other lipid-like environments in intracellularorganelles, indicating minimal probe internalisation, and con-rming Mem-1 as cell-membrane specic.
We next investigated whether Mem-5 serves as an effectivephotocontrollable uorogenic probe for visualising near-membrane copper(II) in live cells. Upon photolysis with UVirradiation (500 mJ cm�2 for 5 min), non-uorescent Mem-5generated non-uorescent uncaged Mem-5, according toa literature method.24 To evaluate the selectivity of Mem-5toward copper(II) among a series of metal cations, amino acidsand anions, 45 analytes (10 eq.), including K+, Ca2+, Mn2+, Cr2+,Co2+, Ni2+, Fe2+, Fe3+, Ba2+, Mg2+, Al3+, Ag+, Cd2+, Na+, Cu2+,tyrosine, 2,6-diaminocaproic acid, isoleucine, valine, alanine,aspartic acid, histidine, cysteine, ornithine, proline, glutamicacid, glycine, tryptophan, arginine, serine, threonine, phenyl-alanine, methionine, cystine, CO3
2�, I�, Cl�, Br�, F�, SO42�,
HPO42�, HCO3
�, S2�, and NO3�, were incubated with uncaged
Mem-5 in HEPES buffer at 37 �C for 1 h, as shown in Fig. 5. Asignicant uorescence enhancement in Mem-5 was observedwhen copper(II) was added only, while other species hada negligible uorescent intensity (Fig. 5a) with little interference(Fig. 5c). These results illustrate that Mem-5 had a high selec-tivity for copper(II) recognition.
Fig. 6 (a) Fluorescence intensities (Ex ¼ 455 nm) at 525 nm of Mem-1/values based on pH titration, error bars represent s.e.m. (n ¼ 3). (b) Fluoreequiv.) for various periods (0–180 min). (c) Fluorescence intensities of un(0–10 equiv.) (d) Plot of rate constants vs. Cu2+ concentrations. Reaction37 �C. (e) One-photon fluorescence microscopy imaging of live HepG2the probe for 20 min at 37 �C, followed by UV(+) or UV(�) irradiation (520min at 37 �C. The cells were then incubated with commercially availabnM), then further incubated for 10 min at 37 �C before imaging. The exprobes. Insets in (1)/(7) are the differential interference contrast images (Dand (10) are merged images of (3) and (9) with related DIC, respectively, wthe inset of colocalization analysis of (3)/(5) (R ¼ 0.85) and (9)/(11)/relate0.87), respectively. All images were acquired in the same way. Scale bar
This journal is © The Royal Society of Chemistry 2017
As the pH of the cell cytosol is between 6.8 and 7.4,33 weattempted to determine whether the probe could emit uores-cence and be stable under these conditions. Therefore, theeffect of pH on the uorescence response ofMem-5 to copper(II)was tested in a pH titration experiment.Mem-5 was found to bestable in a wide pH range of 5–9, and showed a better responseto copper(II) in the region pH 6–9 (Fig. 6a) aer photolysis.When copper(II) (10 equiv.) was added to uncagedMem-5 (2 mM)in HEPES buffer, the uorescence intensity increased graduallywith time (Fig. 6b). The 1H-NMR titration experiments ofMem-3with different equivalents of copper(II) indicated that uores-cein hydrazide was hydrolysed by copper(II) under theseconditions (Fig. S6†). Next, the introduction of an increasingcopper(II) concentration into the solution of uncaged Mem-5 (2mM) induced a gradual increase in the emission at around525 nm (Fig. 6c). The slopes of the plots had a pseudo-rst-orderrate constant. A plot of the rate constants vs. copper(II)concentrations was a straight line passing through the origin,indicating that the reaction is second-order overall, with k ¼9.01 � 10�5 M�1 s�1 (Fig. 6d).34 Fluorescence intensities alsoexhibited a linear relationship with the copper(II) concentration,as shown in Fig. S7† (R2 ¼ 0.97). A linear regression curve wastted to these normalised uorescent intensity data, and the
5 (10 mM) and uncaged Mem-5 (10 mM)/Cu2+(10 equiv.) at various pHscence spectra of uncaged Mem-5 (2 mM) in the presence of Cu2+ (10cagedMem-5 (2 mM) in the presence of increasing Cu2+ concentrationbuffer was 25 mMHEPES (pH¼ 7.4), and the reaction temperature wascells by control probe Mem-3/5 (2 mM). Live cells were incubated withmin) at room temperature and addition of Cu2+ (10 equiv.) for anotherle nuclear stain (NU, 250 nM) andmembrane tracker (Mem-tracker, 100citation wavelength and PMT range were 488 and 500–550 for bothIC), while those in (2)/(8) are related mem-tracker channel images. (4)hile (6) and (12) are merged images of (3)/(5)/related nuclear stain withd nuclear stain with the inset of colocalization analysis of (9)/(11) (R ¼¼ 15 mm.
RSC Adv., 2017, 7, 31093–31099 | 31097

RSC Advances Paper
Ope
n A
cces
s A
rtic
le. P
ublis
hed
on 1
5 Ju
ne 2
017.
Dow
nloa
ded
on 2
/6/2
022
6:07
:46
PM.
Thi
s ar
ticle
is li
cens
ed u
nder
a C
reat
ive
Com
mon
s A
ttrib
utio
n-N
onC
omm
erci
al 3
.0 U
npor
ted
Lic
ence
.View Article Online
point at which the regression line crossed the axis was consid-ered the detection limit (3.3 � 10�7 M).
Finally, encouraged by these results, we determined whetherMem-5 worked as a specic probe for imaging near-membranecopper(II). As shown in Fig. 6e, HepG2 cells were incubated withMem-3/5 in the presence of copper(II). Cells treated withMem-5without UV irradiation showed no uorescence, indicatingtemporal control of the “caging” strategy (Fig. 6e(2)). However,signicant uorescent enhancement ofMem-3-treated cells wasobserved using the same procedure (Fig. 6e(8)). Upon UV irra-diation, a gradual increase in green uorescence was observedboth in Mem-5 (Fig. 6e(3)) and Mem-3-treated cells (Fig. 6e(9)).The same cells were simultaneously treated with commerciallyavailable Mem-tracker to independently verify the localisationresults. Both Mem-5 and Mem-3-treated cells showed similarmembrane-specic images by comparing the colocalisationanalysis in Fig. 6e(6) and (12), indicating the strategy wasamenable to the original design principle. Therefore, our pho-tocontrollable method was successfully used to qualitativelydetect near-membrane copper(II).
Conclusions
In this work, we have described the designed photocontrollableuorogenic probe, Mem-5, which can visualise near-membranecopper(II) via uorescence imaging, and is equipped witha photolabile group, high brightness reporter, and membrane-anchoring unit (cholesterol or long aliphatic chain). Thisprobe shows an intense uorescence enhancement in responseto copper(II) without interference from 45 other analytes,including metal cations, amino acids and anions, under bio-logical conditions. Live-cell imaging results indicate that theprobe can detect near-membrane copper(II) aer membraneanchoring using a photo-labile spatial and temporal controlreleasing method. The probe could be very useful for moni-toring the homeostasis of near-membrane copper(II). A clearadvantage of our photocontrollable method is that it success-fully avoids the inuence of chemical species outside cellsduring near-membrane specic detection. An important unre-solved issue from this study is the lack of sensitivity forrecording copper(II) across the membrane.
Acknowledgements
This work was nancially supported by the National NaturalScience Foundation of China (81672508, 61505076), NaturalScience Foundation of Jiangsu Province (BK20140951), NaturalScience Foundation of Zhejiang Province (LQ16B020003), andKey University Science Research Project of Jiangsu Province(Grant 16KJA180004).
Notes and references
1 S. J. Singer and G. I. Nicolson, Science, 1972, 175, 720–731.2 H. Lodish, A. Berk, S. L. Zipursky, P. Matsudaira,D. Baltimore and J. Darnell, Molecular Cell Biology,Scientic American Books, New York, 4th edn, 2004.
31098 | RSC Adv., 2017, 7, 31093–31099
3 L. Wu, E. Hamid, W. Shin and H. Chiang, Annu. Rev. Physiol.,2014, 76, 301–331.
4 G. Meer, D. R. Voelker and G. W. Feigenson, Nat. Rev. Mol.Cell Biol., 2008, 9, 112–124.
5 Z. Darwich, A. S. Klymchenko, D. Dujardin and Y. Mely, RSCAdv., 2014, 4, 8481–8488.
6 D. Lingwood and K. Simons, Science, 2010, 327, 46–50.7 E. Sezgin, I. Levental, S. Mayor and C. Eggeling,Nat. Rev. Mol.Cell Biol., 2017, 18, 361–374.
8 J. L. Pincus, C. Y. Jin, W. J. Huang, H. K. Jacobs,A. S. Gopalan, Y. J. Song, J. A. Shelnutta and D. Y. Sasaki, J.Mater. Chem., 2005, 15, 2938–2945.
9 L. Li, X. Q. Shen, Q.-H. Xu and S. Q. Yao, Angew. Chem., Int.Ed., 2013, 52, 424–428.
10 Y. Xia and L. Peng, Chem. Rev., 2013, 113, 7880–7929.11 Z. Liu, T. P. Yang, X. Li, T. Peng, H. C. Hang and X. D. Li,
Angew. Chem., Int. Ed., 2015, 54, 1149–1152.12 T. Peng and H. C. Hang, J. Am. Chem. Soc., 2015, 137, 556–
559.13 M. D. Molin, Q. Verolet, A. Colom, R. Letrun, E. Derivery,
M. Gonzalez-Gaitan, E. Vauthey, A. Roux, N. Sakai andS. Matile, J. Am. Chem. Soc., 2015, 137, 568–571.
14 I. A. Karpenko, M. Collot, L. Richert, C. Valencia, P. Villa,Y. Mely, M. Hibert, D. Bonnet and A. S. Klymchenko, J. Am.Chem. Soc., 2015, 137, 405–412.
15 R. J. Radford, W. Chyan and S. J. Lippard, Chem. Sci., 2013, 4,3080–3084.
16 D. Strausak, J. F. B. Mercer, H. H. Dieter, W. Stremmel andG. Multhaup, Brain Res. Bull., 2001, 55, 175–185.
17 A. Robert, Y. Liu, M. Nguyen and B. Meunier, Acc. Chem. Res.,2015, 48, 1332–1339.
18 O. Bandmann, K. H. Weiss and S. G. Kaler, Lancet Neurol.,2015, 14, 103–113.
19 B. E. Kim, T. Nevitt and D. J. Thiele, Nat. Chem. Biol., 2008, 4,176–185.
20 B. J. McCranor, H. Szmacinski, H. H. Zeng, A. K. Stoddard,T. Hurst, C. A. Fierke, J. R. Lakowicz and R. B. Thompson,Metallomics, 2014, 6, 1034–1042.
21 M. R. Krause and S. L. Regen, Acc. Chem. Res., 2014, 47, 3512–3521.
22 E. Ikonen, Nat. Rev. Mol. Cell Biol., 2008, 9, 125–138.23 C. S. Lim, M. Y. Kang, J. H. Han, I. A. Danish and B. R. Cho,
Chem.–Asian J., 2011, 6, 2028–2033.24 L. Li, J. Y. Ge, H. Wu, Q.-H. Xu and S. Q. Yao, J. Am. Chem.
Soc., 2012, 134, 12153–12160.25 L. Yuan, W. Y. Lin, Z. M. Cao, L. L. Long and J. Z. Song,
Chem.–Eur. J., 2011, 17, 689–696.26 Y. R. Zhao, Q. Zheng, K. Dakin, K. Xu, M. L. Martinez and
W. H. Li, J. Am. Chem. Soc., 2004, 126, 4653–4663.27 I. Aparici-Espert, M. C. Cuquerella, C. Paris, V. Lhiaubet-
Vallet and M. A. Miranda, Chem. Commun., 2016, 52,14215–14218.
28 C. Wu, Q. N. Bian, B.-G. Zhang, X. Cai, S.-D. Zhang, H. Zheng,S.-Y. Yang and Y.-B. Jiang, Org. Lett., 2012, 14, 4198–4201.
29 V. Dujols, F. Ford and A. W. Czarnik, J. Am. Chem. Soc., 1997,119, 7386–7387.
This journal is © The Royal Society of Chemistry 2017

Paper RSC Advances
Ope
n A
cces
s A
rtic
le. P
ublis
hed
on 1
5 Ju
ne 2
017.
Dow
nloa
ded
on 2
/6/2
022
6:07
:46
PM.
Thi
s ar
ticle
is li
cens
ed u
nder
a C
reat
ive
Com
mon
s A
ttrib
utio
n-N
onC
omm
erci
al 3
.0 U
npor
ted
Lic
ence
.View Article Online
30 R. L. Zhang, J. Zhao, G. M. Han, Z. J. Liu, C. Liu, C. Zhang,B. H. Liu, C. L. Jiang, R. Y. Liu, T. T. Zhao, M. Y. Han andZ. P. Zhang, J. Am. Chem. Soc., 2016, 138, 3769–3778.
31 J. F. Hulvat, M. Sofos, K. Tajima and S. I. Stupp, J. Am. Chem.Soc., 2005, 127, 366–372.
32 M. Collot, R. Kreder, A. L. Tatarets, L. D. Patsenker, Y. Melyaand A. S. Klymchenko, Chem. Commun., 2015, 51, 17136–17139.
This journal is © The Royal Society of Chemistry 2017
33 J. Llopis, J. Michael McCaffery, A. Miyawaki, M. G. Farquharand R. Y. Tsien, Proc. Natl. Acad. Sci. U. S. A., 1998, 95, 6803–6808.
34 J. H. Lee, C. S. Lim, Y. S. Tian, J. H. Han and B. R. Cho, J. Am.Chem. Soc., 2010, 132, 1216–1217.
RSC Adv., 2017, 7, 31093–31099 | 31099