photocatalytic treatment of an actual confectionery
TRANSCRIPT

catalysts
Article
Photocatalytic Treatment of An Actual ConfectioneryWastewater Using Ag/TiO2/Fe2O3: Optimization ofPhotocatalytic Reactions Using SurfaceResponse Methodology
Yi Ping Lin and Mehrab Mehrvar *
Department of Chemical Engineering, Ryerson University, 350 Victoria Street, Toronto, ON M5B 2K3, Canada;[email protected]* Correspondence: [email protected]; Tel.: +1-(416)-979-5000 (ext. 6555); Fax: +1-(416)-979-5083
Received: 15 August 2018; Accepted: 17 September 2018; Published: 21 September 2018�����������������
Abstract: Titanium dioxide (TiO2) photocatalysis is one of the most commonly studied advancedoxidation processes (AOPs) for the mineralization of deleterious and recalcitrant compounds presentin wastewater as it is stable, inexpensive, and effective. Out of all, doping with metal and non-metals,and the heterojunction with another semiconductor were proven to be efficient methods in enhancingthe degradation of organic pollutants under ultraviolet (UV) and visible light. However, complexdegradation processes in the treatment of an actual wastewater are difficult to model and optimize.In the present study, the application of a modified photocatalyst, Ag/TiO2/Fe2O3, for the degradationof an actual confectionery wastewater was investigated. Factorial studies and statistical design ofexperiments using the Box-Behnken method along with response surface methodology (RSM) wereemployed to identify the individual and cross-factor effects of independent parameters, includinglight wavelength (nm), photocatalyst concentration (g/L), initial pH, and initial total organic carbon(TOC) concentration (g/L). The maximum TOC removal at optimum conditions of light wavelength(254 nm), pH (4.68), photocatalyst dosage (480 mg/L), and initial TOC concentration (11,126.5 mg/L)was determined through the numerical optimization method (9.78%) and validated with experimentaldata (9.42%). Finally, the first-order rate constant with respect to TOC was found to be 0.0005 min−1
with a residual value of 0.998.
Keywords: advanced oxidation process (AOP); confectionery wastewater; response surfacemethodology; photocatalysis; modified TiO2
1. Introduction
Confectionery wastewater effluents contain high amounts of sugar (sucrose), sugar alcohol,artificial sweeteners (aspartame, acesulfame, and sucralose), food additives, colorants (TiO2), naturalflavors, and artificial flavors that account for their high strength in chemical oxygen demand (COD)and biological oxygen demand (BOD) [1,2]. These organic compounds can cause sudden shocks andrapid dissolved oxygen depletion in the biological treatment systems when discharged to surroundingmunicipal wastewater treatment facilities, further causing deviation in characteristics of treatedeffluents [1–3]. Among all, artificial sweeteners, such as aspartame, acesulfame, and sucralose,are extremely stable throughout the conventional wastewater treatment processes; however, toxicitywill increase after photodegradation [4–6]. As the inadequately treated wastewater containingdeleterious substances is being discharged to large water bodies, they will continue to persist withhalf-lives up to several years [6,7].
Catalysts 2018, 8, 409; doi:10.3390/catal8100409 www.mdpi.com/journal/catalysts

Catalysts 2018, 8, 409 2 of 17
Advanced oxidation processes (AOPs) are promising and environmentally friendly wastewatertreatment technologies capable of mineralizing deleterious substances in wastewater systems [4,8–10].Among all, photocatalysis, especially with titanium dioxide (TiO2), is commonly studied owingto its high chemical stability, promising efficiency, low cost, and non-toxicity [10–12]. The studyconducted by Sang et al. showed promising efficiency of TiO2 in degrading the artificial sweetenersfound in confectionery wastewater and in mineralizing the intermediate products generated during thedegradation process [4]. Photomineralization is a process in which the photogenerated hydroxyl radicalparticipates in the redox reactions with the organic materials in aqueous solutions which produceintermediate products (aldehydes and carboxylic acids) and, finally, achieve complete oxidation ofcarbon atoms [1,4,9,10,13]. However, the application of TiO2 is limited by the ultraviolet (UV) activationand the fast recombination rate of the generated electron-hole pairs [10,12,14]. Hence, modificationsof TiO2 photocatalysts through metal doping, non-metal doping, and its combination with anothersemiconductor photocatalyst are common methods to extend the absorption wavelength of TiO2
towards visible light spectrum, to restrict the recombination of electron-hole pairs, and to increase thespecific surface area of the photocatalyst [9–17].
Metal doping of TiO2 can be accomplished through interstitial doping and substitutional doping.Interstitial doping involves metal dopants located on the surface of TiO2, and substitutional dopinginvolves the substitution of Ti4+ atoms by metal dopants [9,18,19]. Metal doping also introducesa mid-gap energy level in the band gap of TiO2 [20,21]. Out of all metal dopants, noble metalshave higher resistance to corrosion, making them ideal to be used in water treatment processes.Metal dopants include Au, Ag, Co, Fe, Ni, Pt, and Zn [9,10]. Non-metal doping is establishedthrough similar theories, except that in substitutional doping O2− atoms are substituted by anon-metal dopant, and non-metal doping of TiO2 also has a promising effect in expanding thephotocatalytic activity to the visible light region of the spectrum [10,22]. Common non-metal dopantsinclude B, C, F, I, N, and S [13]. These metal and non-metal dopants are effective in introducinga mid-gap energy state in the TiO2 energy levels and enhance the specific surface area of thephotocatalyst [13,23]. Moreover, combining two semiconductor photocatalysts, such as Zn/TiO2,CdS/TiO2/Pt, TiO2/Y-zeolite, Ag2O/TiO2, Ag-Bi2MoO4, zeolite/WO3-Pt, and CdS-SnO2, has alsobeen studied to enhance the photoactivity of photocatalysts [24,25]. Each modification method has itsown strengths and shortcomings. Other physical parameters, such as specific surface area, crystallinephase, crystalline size, and pore distribution, that can be modified through these modification methodsare crucial in improving the photocatalytic activity of a photocatalyst [10,13,17,26]. Among all,metal-doped and semi-conductor-combined photocatalyst, Ag/TiO2/Fe2O3, presents an excellentimprovement in the photoactivity under ultraviolet type-A (UV-A) in the treatment of textile dyes [26].In the present study, a TiO2 photocatalyst was synthesized, combined with another semiconductor(Fe2O3), and finally doped with a noble metal (Ag) using the UV-assisted thermal method establishedby Nasirian [26].
The optimization of the degradation of organic pollutants in an actual confectionery wastewaterwas performed using single-variable studies [4,27–31]. However, it is difficult to predict the optimumreaction conditions from previous results owing to the possible interactions between differentindependent variables involved in the photocatalytic reactions [10,17,22,30]. Statistical programscome in handy to help establish a design of experiment (DOE) using response surface methodology(RSM) to develop a mathematical function relating the response with various predictors, and to obtainoptimum conditions that maximizes the desired results under high desirability [8,32]. Furthermore,the central composited design (CCD) and Box-Behnken design (BBD) are both effective RSM designsto generate a second-order response surface model in the optimization of the photocatalytic treatmentprocess [8,10,17,22,32]. The BBD is preferred when parameters are limited to three levels [8,10,22].
In this study, the as-synthesized modified photocatalyst, Ag/TiO2/Fe2O3, was employed to treatan actual confectionery wastewater (CWW), and the photomineralization process was optimized bynumerical and graphical optimization methods of Box-Behnken Design (BBD) with response surface

Catalysts 2018, 8, 409 3 of 17
methodology (RSM). The final optimized conditions were validated through an extra experimentaltrial, and the first-order rate constant of the photomineralization process based on TOC removal wasdetermined under these optimum operating conditions.
2. Results and Discussion
2.1. Preliminary Studies
Figure 1 shows the photocatalytic mineralization efficiencies of bare and modified TiO2
photocatalysts including anatase TiO2, rutile TiO2, P25 TiO2, as-synthesized TiO2, Ag/TiO2,TiO2/Fe2O3, and Ag/TiO2/Fe2O3 after 3 h of visible light illumination. Results indicate animprovement on the photocatalytic activity under visible light and specific surface area of modifiedTiO2 after metal doping and combining with another semiconductor (Ag/TiO2/Fe2O3), where thelargest specific surface area presented highest photocatalytic activity under visible light illuminationas compared to that of the visible-light-inactive commercial TiO2 in treating an actual confectionerywastewater. A similar trend in the photocatalytic efficiencies was also observed in the previous workperformed by Nasirian [26], where the same photocatalyst was found to be the most efficient in treatingsynthetic textile wastewater under UV-A.
Catalysts 2018, 8, x FOR PEER REVIEW 3 of 17
trial, and the first-order rate constant of the photomineralization process based on TOC removal was determined under these optimum operating conditions.
2. Results and Discussion
2.1. Preliminary Studies
Figure 1 shows the photocatalytic mineralization efficiencies of bare and modified TiO2 photocatalysts including anatase TiO2, rutile TiO2, P25 TiO2, as-synthesized TiO2, Ag/TiO2, TiO2/Fe2O3, and Ag/TiO2/Fe2O3 after 3 h of visible light illumination. Results indicate an improvement on the photocatalytic activity under visible light and specific surface area of modified TiO2 after metal doping and combining with another semiconductor (Ag/TiO2/Fe2O3), where the largest specific surface area presented highest photocatalytic activity under visible light illumination as compared to that of the visible-light-inactive commercial TiO2 in treating an actual confectionery wastewater. A similar trend in the photocatalytic efficiencies was also observed in the previous work performed by Nasirian [26], where the same photocatalyst was found to be the most efficient in treating synthetic textile wastewater under UV-A.
Figure 1. Photocatalytic efficiencies for the mineralization of an actual confectionery wastewater and specific surface area of bare and modified TiO2 under visible light (photocatalyst dosage = 500 mg/L, [TOC0] = 18,700 mg/L, lamp power = 45 W).
2.2. Photocatalyst Characterization
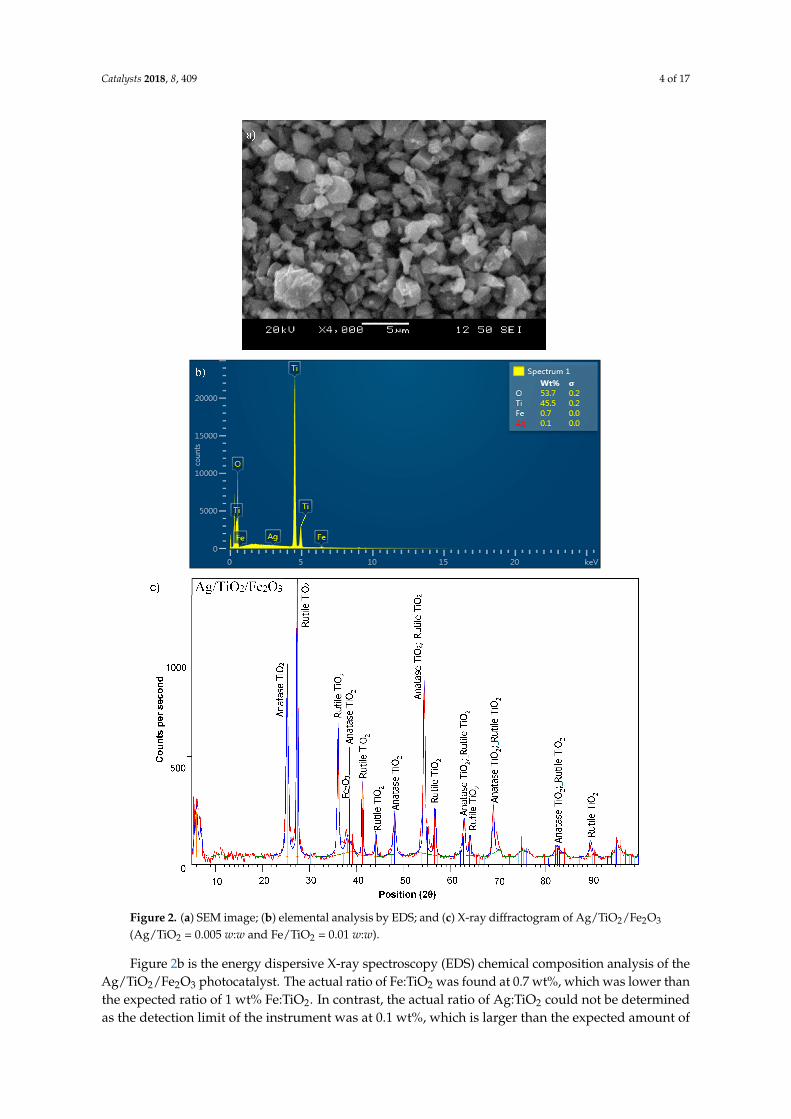
Figure 2a is the scanning electron microscopy (SEM) image of Ag/TiO2/Fe2O3 (0.5 wt% Ag/TiO2
and 1.0 wt% Fe/TiO2) showing heterogeneous shaped particles with variable particle sizes with the range of 0.5–5 µm. The microparticles were irregular in shape and randomly organized with rough morphology. Rough particle morphology has been reported to contribute to the enhancement of the adsorption of target pollutants onto the photocatalyst surface during photocatalytic process of aqueous organic degradation [19,33].
0
20
40
60
80
100
120
140
160
180
200
0.00
5.00
10.00
15.00
20.00
25.00
Anatase P25 0.01 TiO₂/Fe₂O₃ Ag/TiO₂/Fe₂O₃
(0.5% Ag, 1% Fe)
Spe
cifi
c su
rfac
e ar
ea (
m²/
g)
TO
C r
emov
al (
%)
Specific surface area (m²/g)TOC removal (%)
Figure 1. Photocatalytic efficiencies for the mineralization of an actual confectionery wastewater andspecific surface area of bare and modified TiO2 under visible light (photocatalyst dosage = 500 mg/L,[TOC0] = 18,700 mg/L, lamp power = 45 W).
2.2. Photocatalyst Characterization
Figure 2a is the scanning electron microscopy (SEM) image of Ag/TiO2/Fe2O3 (0.5 wt% Ag/TiO2
and 1.0 wt% Fe/TiO2) showing heterogeneous shaped particles with variable particle sizes with therange of 0.5–5 µm. The microparticles were irregular in shape and randomly organized with roughmorphology. Rough particle morphology has been reported to contribute to the enhancement of theadsorption of target pollutants onto the photocatalyst surface during photocatalytic process of aqueousorganic degradation [19,33].
Catalysts 2018, 8, 409 4 of 17Catalysts 2018, 8, x FOR PEER REVIEW 4 of 17
Figure 2. (a) SEM image; (b) elemental analysis by EDS; and (c) X-ray diffractogram of Ag/TiO2/Fe2O3 (Ag/TiO2 = 0.005 w:w and Fe/TiO2 = 0.01 w:w).
Figure 2. (a) SEM image; (b) elemental analysis by EDS; and (c) X-ray diffractogram of Ag/TiO2/Fe2O3
(Ag/TiO2 = 0.005 w:w and Fe/TiO2 = 0.01 w:w).
Figure 2b is the energy dispersive X-ray spectroscopy (EDS) chemical composition analysis of theAg/TiO2/Fe2O3 photocatalyst. The actual ratio of Fe:TiO2 was found at 0.7 wt%, which was lower thanthe expected ratio of 1 wt% Fe:TiO2. In contrast, the actual ratio of Ag:TiO2 could not be determinedas the detection limit of the instrument was at 0.1 wt%, which is larger than the expected amount of
Catalysts 2018, 8, 409 5 of 17
0.5 wt% Ag/TiO2. Figure 2c illustrates the X-ray diffractogram of the Ag/TiO2/Fe2O3 (0.005 Ag:TiO2
w:w and 0.01 Fe:TiO2 w:w); the crystalline phases were confirmed with the standard diffractograms inthe Joint Committee on Powder Diffraction Standards (JCPDS-21-1272) databank. Primary anataseand rutile TiO2 phases were observed with 2θ peaks at 25.3◦ and 27.4◦, respectively. In contrast tothe work performed by Nasirian [26] where only anatase phase was observed in Ag/TiO2/Fe2O3,rutile phase was also observed in all prepared TiO2 after calcination at 300 ◦C. Other peaks of anataseTiO2 were located at 38.2◦, 48.0◦, and 54.3◦. Other peaks of rutile TiO2 were located at 36.0◦, 41.2◦,44.1◦, and 56.6◦. The generation of rutile phase under transition temperature was caused by the hightitanium precursor concentration positively affecting the rutile content [33,34]. Moreover, a small2θ peak representing Fe2O3 at 39.28◦ indicated a low concentration of Fe2O3 phase presented in theAg/TiO2/Fe2O3 photocatalyst.
The specific surface area of the conventional TiO2, as-prepared TiO2, TiO2/Fe2O3, Ag/TiO2, andAg/TiO2/Fe2O3 is illustrated in Figure 1 with the greatest being 178.48 m2/g for Ag/TiO2/Fe2O3
and lowest being 2.32 m2/g for rutile TiO2. Specific surface area of other photocatalyst were 42.27m2/g for anatase TiO2, 39.80 m2/g for P25 TiO2, 28.36 m2/g for as-prepared TiO2, 98.69 m2/g forTiO2/Fe2O3, and 63.20 m2/g for Ag/TiO2. The incorporation of Fe2O3 into TiO2 crystalline structureforms TiO2-Fe2O3 heterojunction, increasing the specific surface area of the photocatalyst. Moreover,the surface doping of Ag onto TiO2 modified the surface structure of the photocatalyst, decreasingthe anatase grain size and increasing the specific surface area of the photocatalyst at relatively lowconcentrations of Ag/TiO2 [35]. However, excess silver would cover up the surface of the photocatalystleading to the reduction in the concentration of photogenerated charge carrier and hinder the contactbetween TiO2 and organic pollutants [9,26,35]. As photocatalytic reactions take place on the surfaceof the photocatalyst, the photocatalysts tend to have higher activity when higher specific surfacearea presents owing to the higher number of active sites available for reactions. At the same time,visible light activity is limited in the bare TiO2, while the modification of TiO2 with a metal anda semi-conductor element greatly increases its activity in the visible region along with its specificsurface area.
2.3. Effects of Individual Factors
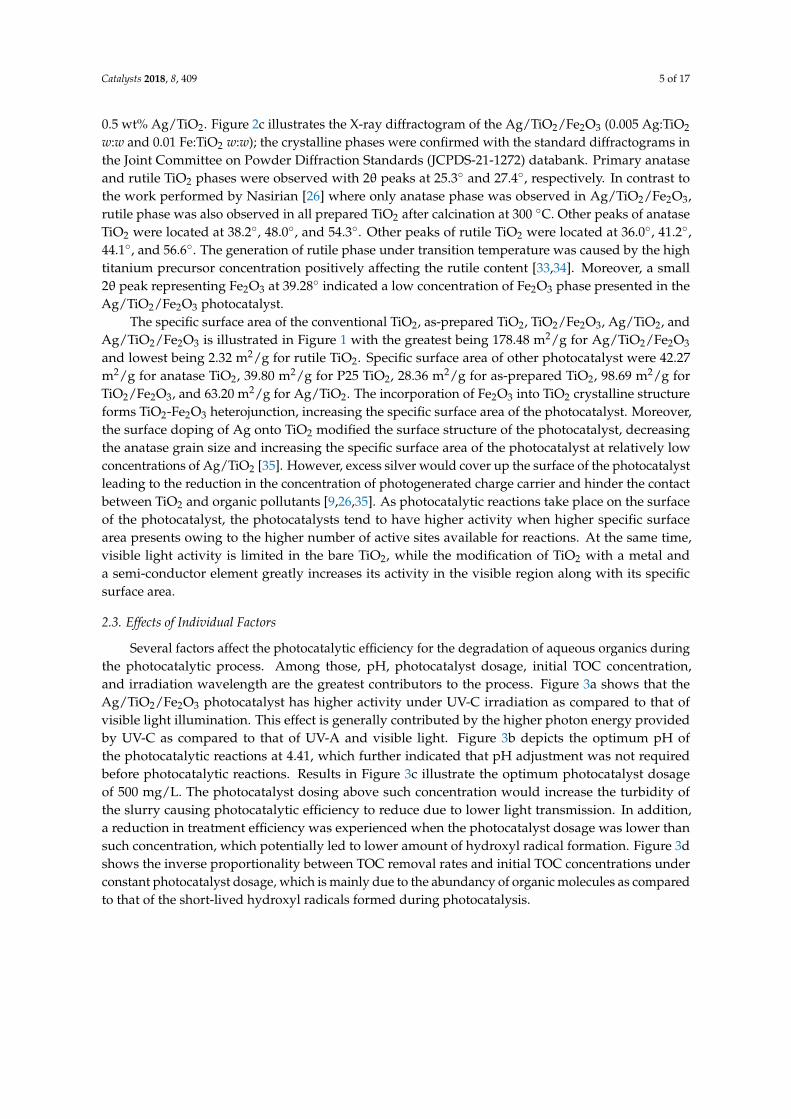
Several factors affect the photocatalytic efficiency for the degradation of aqueous organics duringthe photocatalytic process. Among those, pH, photocatalyst dosage, initial TOC concentration,and irradiation wavelength are the greatest contributors to the process. Figure 3a shows that theAg/TiO2/Fe2O3 photocatalyst has higher activity under UV-C irradiation as compared to that ofvisible light illumination. This effect is generally contributed by the higher photon energy providedby UV-C as compared to that of UV-A and visible light. Figure 3b depicts the optimum pH ofthe photocatalytic reactions at 4.41, which further indicated that pH adjustment was not requiredbefore photocatalytic reactions. Results in Figure 3c illustrate the optimum photocatalyst dosageof 500 mg/L. The photocatalyst dosing above such concentration would increase the turbidity ofthe slurry causing photocatalytic efficiency to reduce due to lower light transmission. In addition,a reduction in treatment efficiency was experienced when the photocatalyst dosage was lower thansuch concentration, which potentially led to lower amount of hydroxyl radical formation. Figure 3dshows the inverse proportionality between TOC removal rates and initial TOC concentrations underconstant photocatalyst dosage, which is mainly due to the abundancy of organic molecules as comparedto that of the short-lived hydroxyl radicals formed during photocatalysis.
Catalysts 2018, 8, 409 6 of 17Catalysts 2018, 8, x FOR PEER REVIEW 6 of 17
Figure 3. (a) Effect of light wavelength on photocatalytic treatment of CWW ([Ag/TiO2/Fe2O3] = 500 mg/L, pH = 4.85 (no adjustment), [TOC0] = 10,031 mg/L); (b) effect of pH on photocatalytic treatment of CWW (light wavelength = 476 nm, [TOC0] = 6900 mg/L, [Ag/TiO2/Fe2O3] = 500 mg/L); (c) effect of photocatalyst dosage on photocatalytic treatment of CWW (light wavelength = 476 nm, pH = 4.41, [TOC0] = 6116.7 mg/L); and (d) effect of initial TOC concentration on photocatalytic treatment of CWW ([Ag/TiO2/Fe2O3] = 500 mg/L, pH = 4.85, light wavelength = 476 nm).
2.4. Statistical Analysis
Table 1 demonstrates the four-factor BBD with experimental and predicted TOC removal results designed by the developed quadratic statistical model. The levels of each factor were determined from factorial study. As the TOC concentrations of actual wastewater differed from day to day basis, one sample of actual wastewater was utilized in all experiments in the statistical design of the experiment. Hence, the developed quadratic model of the photocatalytic degradation process of the actual confectionery wastewater in terms of coded factors is governed by:
0
2
4
6
8
10
12
254 (UV-C) 365 (UV-A) 476 (VIS)
TO
C R
emov
al (
%)
Light Wavelength (nm)
a)
0
2
4
6
8
10
12
14
3 4.41 5 7
TO
C R
emov
al (
%)
pH
b)
0
2
4
6
8
10
12
14
250.00 500.00 750.00 1000.00
TO
C R
emov
al (
%)
Photocatalyst Dosage (mg/L)
c)
0
2
4
6
8
10
12
14
16718 8359 4180
TO
C R
emov
al (
%)
Initial TOC concentration (mg/L)
d)
Figure 3. (a) Effect of light wavelength on photocatalytic treatment of CWW ([Ag/TiO2/Fe2O3] = 500 mg/L,pH = 4.85 (no adjustment), [TOC0] = 10,031 mg/L); (b) effect of pH on photocatalytic treatment ofCWW (light wavelength = 476 nm, [TOC0] = 6900 mg/L, [Ag/TiO2/Fe2O3] = 500 mg/L); (c) effectof photocatalyst dosage on photocatalytic treatment of CWW (light wavelength = 476 nm, pH = 4.41,[TOC0] = 6116.7 mg/L); and (d) effect of initial TOC concentration on photocatalytic treatment of CWW([Ag/TiO2/Fe2O3] = 500 mg/L, pH = 4.85, light wavelength = 476 nm).
2.4. Statistical Analysis
Table 1 demonstrates the four-factor BBD with experimental and predicted TOC removal resultsdesigned by the developed quadratic statistical model. The levels of each factor were determinedfrom factorial study. As the TOC concentrations of actual wastewater differed from day to daybasis, one sample of actual wastewater was utilized in all experiments in the statistical design of the

Catalysts 2018, 8, 409 7 of 17
experiment. Hence, the developed quadratic model of the photocatalytic degradation process of theactual confectionery wastewater in terms of coded factors is governed by:
Y = 8.26− 0.99X1 + 1.06X2 − 0.72X3 − 0.82X4 − 2.63X1X2 + 1.12X1X3 + 1.7X1X4−0.39X2X3 − 0.56X2X4 − 0.34X3X4 − 0.068X2
1 − 3.30X22 − 3.60X2
3 − 2.18X24
(1)
In this model, negative coefficients corresponded to unfavorable effects on the TOC removal forX1, X3, X4, X1X2, X2X3, X2X4, X3X4, X1
2, X22, X3
2, and X42; whilst positive coefficients corresponded
to favorable effects on the TOC removal for X2, X1X3, and X1X4. Parameters with coefficients closeto zero indicated a lower effect on the TOC removal than that of larger coefficients under the samemagnitude of change in that certain factor. Thus, X1
2, X2X3, and X3X4 did not significantly affect theTOC removal when these factors were changed accordingly.
Table 1. Four-factor BBD for RSM with observed and predicted TOC removal.
RunFactor 1 (X1) Factor 2 (X2) Factor 3 (X3) Factor 4 (X4) Response (Y) = TOC
Removal (%)
Light Wavelength (nm) pH Photocatalyst Dosage (mg/L) TOC0 (mg/L) Observed Predicted
1 254 3 500 10,031 2.19 2.22 476 3 500 10,031 5.23 5.473 254 5 500 10,031 9.69 9.564 476 5 500 10,031 2.23 2.335 365 4 250 3344 3.37 3.696 365 4 750 3344 3.13 2.927 365 4 250 16,718 2.41 2.738 365 4 750 16,718 0.83 0.619 254 4 500 3344 9.63 9.5310 476 4 500 3344 4.24 4.1411 254 4 500 16,718 4.37 4.4912 476 4 500 16,718 5.78 5.9113 365 3 250 10,031 0.98 0.6414 365 5 250 10,031 3.28 3.5315 365 3 750 10,031 0.19 -0.0316 365 5 750 10,031 0.94 1.317 254 4 250 10,031 7.59 7.4318 476 4 250 10,031 3.6 3.2119 254 4 750 10,031 3.48 3.7420 476 4 750 10,031 3.97 421 365 3 500 3344 1.71 1.9822 365 5 500 3344 5.39 5.2123 365 3 500 16,718 1.42 1.4724 365 5 500 16,718 2.86 2.4625 365 4 500 10,031 8.75 8.2626 365 4 500 10,031 7.92 8.2627 365 4 500 10,031 7.87 8.2628 365 4 500 10,031 8.18 8.2629 365 4 500 10,031 8.58 8.26
The statistical significance of the developed model and predictors was evaluated using the analysisof variance (ANOVA) with 95% confidence interval (CI) of the TOC removal, as shown in Table 2.The significance of each factor coefficient was determined using probability values (p-values) fromFisher’s (F) exact test, where p < 0.05 indicated a significant model or predictor while p > 0.05 indicatednon-significance. In this study, the predictor terms X2X3, X3X4, and X1
2 were not significant in theresponse, which indicated that changes in these variables would not significantly affect the overallTOC removal based on this model. The determination coefficient (R2) of 0.9918 and the adjusted R2 of0.9837 ensured a high significance of the developed model, as R2 and adjusted R2 close to 1.0 weredesired [8,10,17]. The insignificant lack of fit (p > 0.05), suggested that the developed statistical modelfitted well with the observed data [8,10,17].

Catalysts 2018, 8, 409 8 of 17
Table 2. ANOVA of TOC removal modeled by quadratic modeling in the optimization of photocatalyticactivity of Ag/TiO2/Fe2O3 for the treatment of CWW.
Source Sum ofSquares df a Mean
Square F Value b p-Value c Remark
Model 233.91 14 16.71 121.44 <0.0001 SignificantX1 = Light wavelength 11.8 1 11.8 85.77 <0.0001 Significant
X2 = pH 13.38 1 13.38 97.23 <0.0001 SignificantX3 = Photocatalyst dosage 6.29 1 6.29 45.74 <0.0001 Significant
X4 = TOC0 8 1 8 58.17 <0.0001 SignificantX1X2 27.56 1 27.56 200.34 <0.0001 SignificantX1X3 5.02 1 5.02 36.47 <0.0001 SignificantX1X4 11.56 1 11.56 84.02 <0.0001 SignificantX2X3 0.6 1 0.6 4.37 0.0554 Not significantX2X4 1.25 1 1.25 9.12 0.0092 SignificantX3X4 0.45 1 0.45 3.26 0.0924 Not significantX1
2 0.03 1 0.03 0.22 0.6481 Not significantX2
2 70.82 1 70.82 514.73 <0.0001 SignificantX3
2 83.91 1 83.91 609.89 <0.0001 SignificantX4
2 30.7 1 30.7 223.12 <0.0001 SignificantResidual 1.93 14 0.14
Lack of Fit 1.31 10 0.13 0.85 0.6222 Not significantPure Error 0.62 4 0.15
Corrected total SS d 235.84 28R2 0.9918
Adjusted R2 0.9837Adequate Precision 35.964
a Degrees of freedom (df ). b Fisher’s (F) exact test value. c A probability (p) value < 0.05 is considered as significantand >0.05 is considered as not significant. d Total sum of squares corrected for the mean.
The continuous variance assumption was confirmed graphically using Figure 4a, the plotof predicted response versus the internally studentized residuals, where internally studentizedresidual values were attained by dividing the residual values by respective standard deviation [8,10].The sample points in Figure 4a were randomly scattered within outlier detection limits from −3 to+3. Moreover, the observed and predicted response in Figure 4b indicated minor discrepancies and areasonable agreement between predicted model and observed values. Therefore, the prediction modelexpressed in Equation (1) is deemed satisfactory.
Catalysts 2018, 8, x FOR PEER REVIEW 8 of 17
Table 2. ANOVA of TOC removal modeled by quadratic modeling in the optimization of photocatalytic activity of Ag/TiO2/Fe2O3 for the treatment of CWW.
Source Sum of Squares df a Mean Square F Value b p-Value c Remark Model 233.91 14 16.71 121.44 <0.0001 Significant
X1 = Light wavelength 11.8 1 11.8 85.77 <0.0001 Significant X2 = pH 13.38 1 13.38 97.23 <0.0001 Significant
X3 = Photocatalyst dosage 6.29 1 6.29 45.74 <0.0001 Significant X4 = TOC0 8 1 8 58.17 <0.0001 Significant
X1X2 27.56 1 27.56 200.34 <0.0001 Significant X1X3 5.02 1 5.02 36.47 <0.0001 Significant X1X4 11.56 1 11.56 84.02 <0.0001 Significant X2X3 0.6 1 0.6 4.37 0.0554 Not significant X2X4 1.25 1 1.25 9.12 0.0092 Significant X3X4 0.45 1 0.45 3.26 0.0924 Not significant X12 0.03 1 0.03 0.22 0.6481 Not significant X22 70.82 1 70.82 514.73 <0.0001 Significant X32 83.91 1 83.91 609.89 <0.0001 Significant X42 30.7 1 30.7 223.12 <0.0001 Significant
Residual 1.93 14 0.14 Lack of Fit 1.31 10 0.13 0.85 0.6222 Not significant Pure Error 0.62 4 0.15
Corrected total SS d 235.84 28 R2 0.9918
Adjusted R2 0.9837 Adequate Precision 35.964
a Degrees of freedom (df). b Fisher’s (F) exact test value. c A probability (p) value < 0.05 is considered as significant and >0.05 is considered as not significant. d Total sum of squares corrected for the mean.
The continuous variance assumption was confirmed graphically using Figure 4a, the plot of predicted response versus the internally studentized residuals, where internally studentized residual values were attained by dividing the residual values by respective standard deviation [8,10]. The sample points in Figure 4a were randomly scattered within outlier detection limits from −3 to +3. Moreover, the observed and predicted response in Figure 4b indicated minor discrepancies and a reasonable agreement between predicted model and observed values. Therefore, the prediction model expressed in Equation (1) is deemed satisfactory.
Figure 4. Validation of the TOC removal model using (a) internally studentized residuals versus predicted values and (b) observed experimental data versus predicted values.
TOC Removal
(%)
9.69
0.19
Inte
rnal
ly S
tude
ntiz
ed R
esid
uals
-3.00
-2.00
-1.00
0.00
1.00
2.00
3.00
-2 0 2 4 6 8 10
3
-3
0
Predicted TOC removal (%)
Pre
dict
ed T
OC
rem
oval
(%
)
-2
0
2
4
6
8
10
-2 0 2 4 6 8 10
Observed TOC removal (%)
(b) (a)
Figure 4. Validation of the TOC removal model using (a) internally studentized residuals versuspredicted values and (b) observed experimental data versus predicted values.
2.5. Interaction between Model Parameters, 2D Contour Plots, and 3D Response Surface
As shown in Table 2, among all model parameters, the interaction between the pH and thephotocatalyst dosage (X2X3), the photocatalyst dosage, and the initial TOC concentration (X3X4) didnot have significant effects on the TOC removal. In contrast, the interaction between light wavelengthand all other three parameters (X1X2, X1X3, and X1X4) and the interaction between the pH and theinitial TOC concentration (X2X4) presented significant effects. Thus, the choice of the light wavelength,

Catalysts 2018, 8, 409 9 of 17
the pH, and the initial TOC concentration could be optimized to minimize any treatment-related costs,especially for UV-C photoreaction while maintaining high treatment efficiency.
The three-dimensional (3D) surfaces and two-dimensional (2D) contour plots in Figure 5 showedthe cross-factor interaction effects between independent predictors for the removal of TOC inphotocatalytic treatment of CWW. The response functions of the variation and interaction between twopredictor parameters were presented while keeping other parameters fixed at center levels [8,10,17].Figure 5a–c shows the inverse relationship between the TOC removal and the light wavelength.The interaction between light wavelength and other factors were shown to intensify when the lightwavelength was minimized, recommending for the application of UV-C photocatalytic treatment.However, other cross-factor interactions showed convex surfaces representing intensification aroundcenter-level of photocatalyst dosage, pH around 4.5, and lowest initial TOC concentration. Resultsconfirm that there is no need for any pH adjustment.
Catalysts 2018, 8, x FOR PEER REVIEW 11 of 19
(a) (b)
(c) (d)
(e) (f)
Figure 5. Interaction effects between different parameters on TOC removal analyzed by 3D response
surface and 2D contours of: (a) light wavelength and pH (X1X2); (b) light wavelength and
photocatalyst dosage (X1X3); (c) light wavelength and TOC0 (X1X4); (d) pH and photocatalyst dosage
(X2X3); (e) pH and TOC0 (X2X3); and (f) photocatalyst dosage and TOC0 (X3X4).
2.6. Optimization of Process Parameters
The RSM was used to maximize the TOC removal (Y) under optimized experimental conditions
of the four predictor parameters, including the light wavelength (X1), the pH (X2), the photocatalyst
3
3.5
4
4.5
5254
365
476
0
2
4
6
8
10
12
TO
C r
emov
al (
%)
X1: Light wavelength X2: pH
250
375
500
625
750
254
365
476
0
2
4
6
8
10
12
TO
C r
emov
al (
%)
X1: Light wavelengthX3: Photocatalyst dosage
3344
6687.5
10031
13374.5
16718
254
365
476
0
2
4
6
8
10
12
TO
C r
emov
al (
%)
X1: Light wavelengthX4: TOCo
250
375
500
625
750
3
3.5
4
4.5
5
-2
0
2
4
6
8
10
12
TO
C r
emov
al (
%)
X2: pHX3: Photocatalyst dosage
3344
6687.5
10031
13374.5
16718
3
3.5
4
4.5
5
0
2
4
6
8
10
12
TO
C r
emov
al (
%)
X2: pHX4: TOCo
3344
6687.5
10031
13374.5
16718250
375
500
625
750
-2 0 2 4
6 8
10
12
TO
C r
emov
al (
%)
X3: Photocatalyst dosage X4: TOCo
Figure 5. Interaction effects between different parameters on TOC removal analyzed by 3D responsesurface and 2D contours of: (a) light wavelength and pH (X1X2); (b) light wavelength and photocatalystdosage (X1X3); (c) light wavelength and TOC0 (X1X4); (d) pH and photocatalyst dosage (X2X3); (e) pHand TOC0 (X2X3); and (f) photocatalyst dosage and TOC0 (X3X4).
Catalysts 2018, 8, 409 10 of 17
2.6. Optimization of Process Parameters
The RSM was used to maximize the TOC removal (Y) under optimized experimental conditionsof the four predictor parameters, including the light wavelength (X1), the pH (X2), the photocatalystdosage (X3), and the initial TOC concentration (X4). The optimization of these parameters wasaccomplished using numerical optimization method of BBD built into the statistical software, DesignExpert 10.0.3.1, using Equation (1) as the objective function for TOC removal while independentvariables were used as constraints in the defined critical ranges. The multiple-response functionshown in Equation (1) was used to obtain the interaction plots in Figure 6 while maximizing theTOC removal (Y) and desirability value (D). The desirability value was determined by the statisticalsoftware based on Equation (6). Hence, the desirability value of 1.00 was achieved while acquiring aTOC removal of 9.78% under optimum conditions of the light wavelength (254 nm; UV-C), the pH(4.68), the photocatalyst dosage (480 mg/L), and the initial TOC concentration (11,126.5 mg/L) for thephotocatalytic treatment of CWW using Ag/TiO2/Fe2O3. Finally, the obtained optimum experimentalconditions were validated by an extra experiment, which presented 9.42% TOC removal. The observed,experimental TOC removal under optimum conditions was within 95% CI and 5% relative standarddeviation (RSD) of the predicted value, confirming the accuracy and reliability of the developed model.
The first-order rate constant of the photocatalytic treatment based on the TOC for the CWWunder optimum conditions of the light wavelength of 254 nm, the pH of 4.68, the photocatalyst dosageof 480.0 mg/L, and the initial TOC concentration of 11,126.5 mg/L was determined from Figure 7.The relationship between natural-log of the ratio between TOC concentrations and the time of thephotocatalytic treatment process was modeled by a linear function based on Equation (4). As listed inTable 3, the first-order rate constant and the coefficient of determination (R2) (0.0005 min−1 and 0.998for Ag/TiO2/Fe2O3; and 0.0004 min−1 and 0.995 for commercial P25 TiO2 photocatalyst, respectively)presented an improvement in photocatalytic efficiency in the modified photocatalyst as compared tothat of commercial photocatalyst under optimized experimental conditions. In addition, an excellentlinearity of photocatalytic treatment process representing high fitness of the rate model was obtained.

Catalysts 2018, 8, 409 11 of 17Catalysts 2018, 8, x FOR PEER REVIEW 11 of 17
Figure 6. Desirability 2D plots maximizing TOC removal at optimum levels of studied parameters at light wavelength of 254 nm, pH of 4.68, photocatalyst dosage of 480.0 mg/L, and initial TOC concentration of 11,126.5 mg/L.
Figure 6. Desirability 2D plots maximizing TOC removal at optimum levels of studied parametersat light wavelength of 254 nm, pH of 4.68, photocatalyst dosage of 480.0 mg/L, and initial TOCconcentration of 11,126.5 mg/L.

Catalysts 2018, 8, 409 12 of 17Catalysts 2018, 8, x FOR PEER REVIEW 12 of 17
Figure 7. Photocatalytic treatment of CWW at optimum conditions using Ag/TiO2/Fe2O3 (Ag/TiO2 = 0.005 w:w and Fe/TiO2 = 0.01 w:w) and commercial P25 TiO2 photocatalysts.
Table 3. Rate constant determined from first-order reaction of photocatalytic treatment of CWW using Ag/TiO2/Fe2O3 (Ag/TiO2 = 0.005 w:w and Fe/TiO2 = 0.01 w:w) and P25 TiO2.
Photocatalyst First-Order Rate Constant (k’) (min−1) R2 Ag/TiO₂/Fe₂O₃ 0.0005 0.998
P25 TiO₂ 0.0004 0.995
3. Materials and Methods
3.1. Materials
Analytical grade chemical materials, including anatase TiO2, ethylene glycol (C2H6O2), iron (III) nitrate nonahydrate (Fe(NO3)3·9H2O), P25 TiO2, rutile TiO2, silver nitrate (AgNO3), and titanium butoxide (Ti(OBu)4), were purchased from Sigma-Aldrich (Oakville, ON, Canada) and Van Waters and Nat Rogers (VWR) Canada (Mississauga, ON, Canada).
3.2. Photocatalyst Preparation
The synthesis of Ag/TiO2/Fe2O3 was accomplished through a series of synthesis processes based on the study conducted previously [26,36]. First, the sol-gel synthesis of TiO2 from 30 mL of titanium butoxide and 30 mL of ethylene glycol was carried out at the temperature of 180 °C under constant mixing at 400 rpm, provided by a magnetic stirrer-heater for 2 h [24,26]. Then, the combination of Fe2O3 and TiO2 with 1 wt% Fe:TiO2 was accomplished through UV-assisted thermal synthesis using 1 mL of 0.3 M Fe(NO3)3·9H2O in ethanol, 9 mL of H2O, and 1.5 g of as-synthesized TiO2 reacting under UV-C radiation of 18 W at 95 °C under constant mixing of 400 rpm for 6 h. Finally, silver (Ag) was incorporated onto TiO2/Fe2O3 through UV-assisted thermal synthesis using 0.0157 g of AgNO3 with 10 mL of H2O and 2 g of as-synthesized TiO2/Fe2O3 for 8 h to achieve the mass ratio of 0.5 wt% Ag:TiO2. All prepared photocatalysts were centrifuged; washed with ethanol and water; dried at 105 °C for 4 h; and finally calcined at 300 °C for 6 h.
3.3. Photocatalyst Characterization
The crystalline structure and conversion phase of the photocatalysts were determined by X-ray diffraction (XRD) (PANalytical X’pert PRO, St. Laurent, QC, Canada). The specific areas were measured using N2 adsorption-desorption isotherms at 77 K (Quantachrome Nova e1200, Boynton Beach, FL, USA) incorporating the Brunauer-Emmet and Teller (BET) method. Topography and
0
0.02
0.04
0.06
0.08
0.1
0.12
0 30 60 90 120 150 180
ln(T
OC
o/T
OC
)
Time (min)
Ag/TiO₂/Fe₂O₃P25 TiO₂Linear (Ag/TiO₂/Fe₂O₃)Linear (P25 TiO₂)
Figure 7. Photocatalytic treatment of CWW at optimum conditions using Ag/TiO2/Fe2O3 (Ag/TiO2 =0.005 w:w and Fe/TiO2 = 0.01 w:w) and commercial P25 TiO2 photocatalysts.
Table 3. Rate constant determined from first-order reaction of photocatalytic treatment of CWW usingAg/TiO2/Fe2O3 (Ag/TiO2 = 0.005 w:w and Fe/TiO2 = 0.01 w:w) and P25 TiO2.
Photocatalyst First-Order Rate Constant (k’) (min−1) R2
Ag/TiO2/Fe2O3 0.0005 0.998P25 TiO2 0.0004 0.995
3. Materials and Methods
3.1. Materials
Analytical grade chemical materials, including anatase TiO2, ethylene glycol (C2H6O2), iron (III)nitrate nonahydrate (Fe(NO3)3·9H2O), P25 TiO2, rutile TiO2, silver nitrate (AgNO3), and titaniumbutoxide (Ti(OBu)4), were purchased from Sigma-Aldrich (Oakville, ON, Canada) and Van Waters andNat Rogers (VWR) Canada (Mississauga, ON, Canada).
3.2. Photocatalyst Preparation
The synthesis of Ag/TiO2/Fe2O3 was accomplished through a series of synthesis processes basedon the study conducted previously [26,36]. First, the sol-gel synthesis of TiO2 from 30 mL of titaniumbutoxide and 30 mL of ethylene glycol was carried out at the temperature of 180 ◦C under constantmixing at 400 rpm, provided by a magnetic stirrer-heater for 2 h [24,26]. Then, the combination ofFe2O3 and TiO2 with 1 wt% Fe:TiO2 was accomplished through UV-assisted thermal synthesis using1 mL of 0.3 M Fe(NO3)3·9H2O in ethanol, 9 mL of H2O, and 1.5 g of as-synthesized TiO2 reactingunder UV-C radiation of 18 W at 95 ◦C under constant mixing of 400 rpm for 6 h. Finally, silver (Ag)was incorporated onto TiO2/Fe2O3 through UV-assisted thermal synthesis using 0.0157 g of AgNO3
with 10 mL of H2O and 2 g of as-synthesized TiO2/Fe2O3 for 8 h to achieve the mass ratio of 0.5 wt%Ag:TiO2. All prepared photocatalysts were centrifuged; washed with ethanol and water; dried at105 ◦C for 4 h; and finally calcined at 300 ◦C for 6 h.
3.3. Photocatalyst Characterization
The crystalline structure and conversion phase of the photocatalysts were determined by X-raydiffraction (XRD) (PANalytical X’pert PRO, St. Laurent, QC, Canada). The specific areas were measuredusing N2 adsorption-desorption isotherms at 77 K (Quantachrome Nova e1200, Boynton Beach, FL,

Catalysts 2018, 8, 409 13 of 17
USA) incorporating the Brunauer-Emmet and Teller (BET) method. Topography and crystal structureswere determined using SEM (JEOL JSM-6370 LV, Calgary, AB, Canada,). Elemental analysis wasperformed using EDS (Oxford Instrument X-Max-N-80, Concord, MA, USA). All instruments werecalibrated accordingly prior to their usage.
3.4. Photocatalytic Activity Measurement
The photocatalytic reactions were carried out in a batch photoreactor under constant mixing.As shown in Figure 8, the experimental setup consisted of a 3.5 L cylindrical glass container, five UVlamps or five visible light lamps, and a circulating water bath (NESLAB Instruments Inc. RTE-211,Newington, NH, USA). The source of irradiation was varied according to experimental conditionsand included lamps with center peak wavelengths at 254 nm for UV-C (PL-S 9W/TUV-UV Germicide,110–120 V), 365 nm for UV-A (Philips BL PL-S 9 W 110–120 V, 2P Actinic, Markham, ON, Canada),and 476 nm for visible (PL-2PIN 9 W 110–120 V) lamps, respectively. All lamps were placed verticallyon the top of the reactor. The water bath was used to maintain the reactor at 25 ◦C throughout theentire experiment. The exterior of the cooling water tank was covered with aluminum foil to reflectUV radiation and to prevent exposure of UV radiation to the laboratory environment.
Catalysts 2018, 8, x FOR PEER REVIEW 13 of 17
crystal structures were determined using SEM (JEOL JSM-6370 LV, Calgary, AB, Canada,). Elemental analysis was performed using EDS (Oxford Instrument X-Max-N-80, Concord, MA, USA). All instruments were calibrated accordingly prior to their usage.
3.4. Photocatalytic Activity Measurement
The photocatalytic reactions were carried out in a batch photoreactor under constant mixing. As shown in Figure 8, the experimental setup consisted of a 3.5 L cylindrical glass container, five UV lamps or five visible light lamps, and a circulating water bath (NESLAB Instruments Inc. RTE-211, Newington, NH, USA). The source of irradiation was varied according to experimental conditions and included lamps with center peak wavelengths at 254 nm for UV-C (PL-S 9W/TUV-UV Germicide, 110–120 V), 365 nm for UV-A (Philips BL PL-S 9 W 110–120 V, 2P Actinic, Markham, ON, Canada), and 476 nm for visible (PL-2PIN 9 W 110–120 V) lamps, respectively. All lamps were placed vertically on the top of the reactor. The water bath was used to maintain the reactor at 25 °C throughout the entire experiment. The exterior of the cooling water tank was covered with aluminum foil to reflect UV radiation and to prevent exposure of UV radiation to the laboratory environment.
Figure 8. Experimental set-up of the photocatalysis reaction.
A slurry containing the actual confectionery wastewater, picked up from a confectionery manufacturer in Greater Toronto Area, Ontario, Canada, and photocatalyst was stirred in dark condition for 30 min to reach equilibrium prior to photocatalytic reactions. The samples were centrifuged at 5000 rpm for 20 min (Thermo Scientific Heraeus Multifuge X1, Mississauga, ON, Canada) to remove the photocatalyst particles prior to TOC measurements. The concentrations of organic materials were measured using a total organic carbon (TOC) analyzer (Teledyne Tekmar model Apollo 9000, Mason, OH, USA). Percent TOC removal was determined by: % = − × 100 (2)
where TOC0 is the initial TOC concentration (mg/L) and TOC is the final TOC concentration after 3 h of the photocatalytic reaction (mg/L). During each batch process, the reaction rate-limited condition was controlled under sufficient mixing of the slurry to improve the mass transfer rate of organic constituents to the surface of the photocatalyst. The photocatalytic reaction was modeled by a first-order reaction-rate based on TOC as follows [37]: = (3)
where RTOC is the first order rate of TOC removal. The rate of TOC reduction in a batch system can be expressed by the first-order model as follows: ln = − (4)
Figure 8. Experimental set-up of the photocatalysis reaction.
A slurry containing the actual confectionery wastewater, picked up from a confectionerymanufacturer in Greater Toronto Area, Ontario, Canada, and photocatalyst was stirred in darkcondition for 30 min to reach equilibrium prior to photocatalytic reactions. The samples werecentrifuged at 5000 rpm for 20 min (Thermo Scientific Heraeus Multifuge X1, Mississauga, ON,Canada) to remove the photocatalyst particles prior to TOC measurements. The concentrations oforganic materials were measured using a total organic carbon (TOC) analyzer (Teledyne Tekmar modelApollo 9000, Mason, OH, USA). Percent TOC removal was determined by:
TOCremoval(%) =TOC0 − TOC
TOC0× 100 (2)
where TOC0 is the initial TOC concentration (mg/L) and TOC is the final TOC concentration after 3 hof the photocatalytic reaction (mg/L). During each batch process, the reaction rate-limited conditionwas controlled under sufficient mixing of the slurry to improve the mass transfer rate of organicconstituents to the surface of the photocatalyst. The photocatalytic reaction was modeled by afirst-order reaction-rate based on TOC as follows [37]:
dTOCdt
= RTOC (3)

Catalysts 2018, 8, 409 14 of 17
where RTOC is the first order rate of TOC removal. The rate of TOC reduction in a batch system can beexpressed by the first-order model as follows:
ln(
TOCTOC0
)= −k′t (4)
where TOC is the TOC concentration of samples taken at different reaction time (mg/L), TOC0 is theinitial TOC concentration (mg/L), k’ is the first-order kinetic rate constant (min−1), and t is the reactiontime (min).
3.5. Statistical Model
A four-factor BBD with RSM was used to maximize the TOC removal in photocatalyticmineralization of organic compounds in an actual confectionery wastewater. Light wavelength(X1), pH (X2), photocatalyst dosage (X3), and initial TOC concentration (TOC0) (X4) were considered asindependent predictor parameters while the TOC removal (Y) was considered as the process responsein the Design of Experiment (DOE). Design Expert 10.0.3.1 statistical software (Stat-Ease, Minneapolis,MN, USA) was utilized to optimize the reaction conditions through numerical and graphical methods.The quadratic model (Equation (5)) estimated the parametric coefficients of the statistical model bycorrelating both predictor parameters and responses using the least-squares regression [8,10,17]:
Yi = βo +k
∑i=1
βiXi +k
∑i=1
βiiX2i +
k
∑i=1
k
∑i=1
βijXiXj + c (5)
In this equation, βo, βi, βii, and βij are the constant, linear, quadratic, and cross-factor interactioncoefficients, respectively; Xi and Xj are the coded predictor parameters listed in Table 4; Yi is theresponse under evaluation; k is the number of predictors of the model; and c is the residual error [8,10].The significance of the model equation, individual parameters, and the interactions between factorswere evaluated through ANOVA with the CI of 95% (α = 0.05). The p-value larger than 0.05 wasconsidered insignificant, whilst the p-value smaller than 0.05 was considered significant. From theexperimental data along with the quadratic models, 2D contour plots and 3D surface responseswere constructed. Optimized operating conditions along of the quadratic model with its response atmaximum TOC removal was developed through numerical and graphical optimization methods andthey were validated with additional experimental runs.
Table 4. Coded parameters in statistical quadratic model.
Predictors VariablesCoded Levels
−1 0 1
Light wavelength (nm) X1 254 365 476pH X2 3 4 5
Photocatalyst dosage(mg/L) X3 250 500 750
TOC0 (mg/L) X4 3344 10,031 16,718
Note: The maximum initial TOC concentration was obtained from the collected raw wastewater samples. Otherinitial TOC concentrations were prepared via dilution of wastewater sample with distilled water. The three levels oflight wavelength (X1) refer to different types of light sources with similar photometric intensities that were utilizedin this experimental design.
The desirability multiple-response approach was utilized to obtain a concurrent objectivefunction in Equation (5) through a combination of desired ranges for each response as shown inEquation (6) [8,10]:
D = (Y1 ×Y2 × . . .× dn)1/n =
(n
∏i=1
Yi
)1/n
(6)

Catalysts 2018, 8, 409 15 of 17
In this equation, D, Y, and n are the desirability term, response (percent TOC removal),and the total number of process responses, respectively. During simultaneous optimization of thephotocatalytic reactions, the response function is required to stay within the desired range; otherwise,the desirability becomes zero.
4. Conclusions
In general, the statistical model developed through RSM combined with a four-factor BBDwas found to be reliable for modeling the photocatalytic treatment of CWW using Ag/TiO2/Fe2O3.The accuracy of the developed statistical model was evaluated using ANOVA, demonstrating that thelight wavelength, the pH, the photocatalyst dosage, and the initial TOC concentration were significant,independent predictors of the TOC removal. The cross-factor effects between these parameters werealso evaluated. The numerical optimization achieved a maximum TOC removal of 9.78% at thelight wavelength of 254 nm, the pH of 4.68, the photocatalyst dosage of 480 mg/L, and the initialTOC concentration of 11,126.5 mg/L; while the desirability was maintained at 1.0 within the 95%CI. The experimental validation of numerically optimized condition presented 9.42% TOC removalwithin 5% relative standard deviation of the predicted value. The optimized condition indicated thatno adjustment of pH for the treatment of the actual CWW was required. Therefore, the proposedstatistical model successfully described the photo-mineralization of complex pollutant matrix presentin the actual CWW under UV-C, and the first-order rate constant could be utilized as a future referenceon photoreactor design, process optimization, and scale-up studies. Meanwhile, there is a need indesigning a continuous model and simulation of the model along with statistical modeling. However,slurry photocatalysis in a continuous form is difficult to apply at the industrial scale, so there is aneed to investigate the immobilization of the modified photocatalyst with reusability studies. Finally,the effect of photocatalytic treatment on improving the biodegradability of an actual CWW could befurther studied to help in the design of a photocatalytic treatment system for the pre-treatment ofCWW prior to biological treatment.
Author Contributions: Y.P.L. designed and conducted the experiments under supervision of M.M. Both authorsmade substantial contributions to this manuscript.
Acknowledgments: The financial support of the Natural Sciences and Engineering Research Council of Canada(NSERC) and Ryerson University Faculty of Engineering and Architectural Science Dean’s Research Fund isgreatly appreciated.
Conflicts of Interest: The authors declare no conflict of interest. The founding sponsors had no role in the designof the study; in the collection, analyses, or interpretation of data; in the writing of the manuscript, and in thedecision to publish the results.
References
1. Diwani, G.E.; Abd, H.E.; Hawash, S.; Ibiari, N.E.; Rafei, S.E. Treatment of Confectionery and Gum FactoryWastewater Effluent. Adsorpt. Sci. Technol. 2000, 18, 813–821. [CrossRef]
2. Ozgun, H.; Karagul, N.; Dereli, R.K.; Ersahin, M.E.; Coskuner, T.; Ciftci, D.I.; Ozturk, I.; Altinbas, M.Confectionery industry: A case study on treatability-based effluent characterization and treatment system.Water Sci. Technol. 2012, 66, 15–20. [CrossRef] [PubMed]
3. Beal, L.J.; Raman, D.R. Sequential Two-stage Anaerobic Treatment of Confectionery Wastewater. J. Agric.Eng. Res. 2000, 76, 211–217. [CrossRef]
4. Sang, Z.; Jiang, Y.; Tsoi, Y.K.; Leung, K.S. Evaluating the environmental impact of artificial sweeteners:A study of their distributions, photodegradation and toxicities. Water Res. 2014, 52, 260–274. [CrossRef][PubMed]
5. Scheurer, M.; Schmutz, B.; Happel, O.; Brauch, H.; Wulser, R.; Storck, F.R. Transformation of the artificialsweetener acesulfame by UV light. Sci. Total Environ. 2014, 481, 425–432. [CrossRef] [PubMed]
6. Lubick, N. Artificial sweetener persists in the environment. Environ. Sci. Technol. 2008, 42, 3125. [CrossRef][PubMed]
Catalysts 2018, 8, 409 16 of 17
7. Mead, R.N.; Morgan, J.B.; Brooks Avery, G.; Kieber, R.J.; Kirk, A.M.; Skrabal, S.A.; Willey, J.D. Occurrenceof the artificial sweetener sucralose in coastal and marine waters of the United States. Mar. Chem. 2009,116, 13–17. [CrossRef]
8. Bustillo-Lecompte, C.F.; Mehrvar, M. Treatment of an actual slaughterhouse wastewater by integrationof biological and advanced oxidation processes: Modeling, optimization, and cost-effectiveness analysis.J. Environ. Manag. 2016, 182, 651–666. [CrossRef] [PubMed]
9. Nasirian, M.; Bustillo-Lecompte, C.F.; Mehrvar, M. Photocatalytic efficiency of Fe2O3/TiO2 for thedegradation of typical dyes in textile industries: Effect of calcination temperature and UV-assisted thermalsynthesis. J. Environ. Manag. 2017, 196, 487–498. [CrossRef] [PubMed]
10. Nasirian, M.; Bustillo-Lecompte, C.F.; Lin, Y.P.; Mehrvar, M. Optimization of the Photocatalytic Activity ofN-Doped TiO2 for the Photocatalytic Degradation of Methyl Orange. Desalin. Water Treat. 2018, 110, 193–208.[CrossRef]
11. Shi, W.; Yang, W.; Li, Q.; Gao, S.; Shang, P.; Shang, J.K. The synthesis of nitrogen/sulfur co-doped TiO2
nanocrystals with a high specific surface area and a high percentage of 001 facets and their enhancedvisible-light photocatalytic performance. Nanoscale Res. Lett. 2012, 7, 1–9. [CrossRef] [PubMed]
12. Huang, L.; Fu, W.; Zong, B.; Liu, H.; Bala, H.; Wang, X.; Sun, G.; Cao, J.; Zhang, Z. Facile and large-scalepreparation of N-doped TiO2 photocatalyst with high visible light photocatalytic activity. Mater. Lett. 2017,209, 585–588. [CrossRef]
13. Nasirian, M.; Lin, Y.P.; Bustillo-Lecompte, C.F.; Mehrvar, M. Enhancement of photocatalytic activity oftitanium dioxide using non-metal doping methods under visible light: A review. Int. J. Environ. Sci. Technol.2018, 15, 2009–2032. [CrossRef]
14. Wang, S.Q.; Lin, W.B.; Fu, P.; Cheng, W.L. Enhanced photoactivity of N-doped TiO2 for Cr(VI) removal:Influencing factors and mechanism. Korean J. Chem. Eng. 2017, 34, 1584–1590. [CrossRef]
15. Alsharaeh, E.H.; Bora, T.; Soliman, A.; Ahmed, F.; Bharath, G.; Ghoniem, M.G.; Abu-Salah, K.M.; Dutta, J.Sol-Gel-Assisted Microwave-Derived Synthesis of Anatase Ag/TiO2/GO hybrids toward Efficient VisibleLight Phenol Degradation. Catalysts 2017, 7, 133. [CrossRef]
16. Ali, I.; Kim, J. Continuous-Flow Photocatalytic Degradation of Organics Using Modified TiO2
Nanocomposites. Catalysts 2018, 8, 43. [CrossRef]17. Li, L.; Ma, Q.; Wang, S.; Song, S.; Li, B.; Guo, R.; Cheng, X.; Cheng, Q. Photocatalytic Performance and
Degradation Mechanism of Aspirin by TiO2 through Response Surface Methodology. Catalysts 2018, 8, 118.[CrossRef]
18. Devadi, M.A.H.; Krishna, M.; Narisimha Murthy, H.N.; Sathyanarayana, B.S. Statistical Optimizationfor Photocatalytic Degradation of Methylene Blue by Ag-TiO2 Nanoparticles. Procedia Mater. Sci. 2014,5, 612–621. [CrossRef]
19. Subramonian, W.; Wu, T.Y.; Chai, S.P. Photocatalytic degradation of industrial pulp and paper mill effluentusing synthesized magnetic Fe2O3-TiO2: Treatment efficiency and characterization of reused photocatalyst.J. Environ. Manag. 2017, 187, 298–310. [CrossRef] [PubMed]
20. Zaleska, A. Doped-TiO2: A Review. Recent Pat. Eng. 2008, 2, 157–164. [CrossRef]21. Umebayashi, T.; Yamaki, T.; Itoh, H.; Asai, K. Analysis of electronic structures of 3d transition metal-doped
TiO2 based on band calculations. J. Phys. Chem. Solids 2002, 63, 1909–1920. [CrossRef]22. Kassahun, S.K.; Kiflie, Z.; Shin, D.W.; Park, S.S.; Jung, W.Y.; Chung, Y.R. Optimization of sol-gel synthesis
parameters in the preparation of N-doped TiO2 using surface response methodology. J. Solgel Sci. Technol.2017, 82, 322–334. [CrossRef]
23. Valentin, C.D.; Pacchioni, G. Trends in non-metal doping of anatase TiO2: B, C, N, and F. Catal. Today 2013,206, 12–18. [CrossRef]
24. Nasirian, M.; Mehrvar, M. Modification of TiO2 to enhance photocatalytic degradation of organics in aqueoussolutions. J. Environ. Chem. Eng. 2016, 4, 4072–4082. [CrossRef]
25. Fiorenza, R.; Bellardita, M.; Scirè, S.; Palmisano, L. Effect of the addition of different doping agents on visiblelight activity of porous TiO2 photocatalysts. Mol. Catal. 2018, 455, 108–120. [CrossRef]
26. Nasirian, M. Development of a Novel Photocatalyst for the Photocatalytic Treatment of Industrial Wastewater.Ph.D. Thesis, Ryerson University, Toronto, ON, Canada, 2017.

Catalysts 2018, 8, 409 17 of 17
27. Bellardita, M.; El Nazer, H.A.; Loddo, V.; Parrino, F.; Venezia, A.M.; Palmisano, L. Photoactivity under visiblelight of metal loaded TiO2 catalysts prepared by low frequency ultrasound treatment. Catal. Today 2017,284, 92–99. [CrossRef]
28. Colmenares, J.C.; Magdziarz, A.; Chemyayeva, O.; Lisovytskiy, D.; Kurzydłowski, K.; Grzonka, J.Sonication-Assisted Low-Temperature Routes for the Synthesis of Supported Fe-TiO2 Econanomaterials:Partial Photooxidation of Glucose and Phenol Aqueous Degradation. ChemCatChem 2013, 5, 2270–2277.[CrossRef]
29. Da Vià, L.; Recchi, C.; Davies, T.E.; Greeves, N.; Lopez-Sanchez, J.A. Visible-Light-Controlled Oxidationof Glucose using Titania-Supported Silver Photocatalysts. ChemCatChem 2016, 8, 3275–3283. [CrossRef][PubMed]
30. Hinkova, A.; Henke, S.; Bubník, Z.; Pour, V.; Salova, A.; Sluková, M.; Šárka, E. Degradation of Food industrialpollutants by photocatalysis with immobilised titanium dioxide. Innov. Food Sci. Emerg. Technol. 2015,27, 129–135. [CrossRef]
31. Iervolino, G.; Vaiano, V.; Murcia, J.J.; Rizzo, L.; Ventre, G.; Pepe, G.; Campiglia, P.; Hidalgo, M.C.; Navio, J.A.;Sannino, D. Photocatalytic hydrogen production from degradation of glucose over fluorinated and platinizedTiO2 catalysts. J. Catal. 2016, 339, 47–56. [CrossRef]
32. Salarian, A.A.; Hami, Z.; Mirzaei, N.; Mohseni, S.M.; Asadi, A.; Bahrami, M.; Vosoughi, M.; Alinejad, A.;Zare, M. N-doped TiO2 nanosheets for photocatalytic degradation and mineralization of diazinon undersimulated solar irradiation: Optimization and modeling using a response surface methodology. J. Mol. Liq.2016, 220, 183–191. [CrossRef]
33. Carneiro, J.O.; Azevedo, S.; Fernandes, F.; Freitas, E.; Pereira, M.; Tavares, C.J.; Lanceros-Méndez, S.;Teixeira, V. Synthesis of iron-doped TiO2 nanoparticles by ball-milling process: The influence of processparameters on the structural, optical, magnetic, and photocatalytic properties. J. Mater. Sci. 2014,49, 7476–7488. [CrossRef]
34. Wang, W.K.; Chen, J.J.; Zhang, X.; Huang, Y.X.; Li, W.W.; Yu, H.Q. Self-induced synthesis of phase-junctionTiO2 with a tailored rutile to anatase ratio below phase transition temperature. Nature 2016, 6, 20491.[CrossRef] [PubMed]
35. Cao, Y.; Tan, H.; Shi, T.; Tang, T.; Li, J. Preparation of Ag-doped TiO2 nanoparticles for photocatalyticdegradation of acetamiprid in water. J. Chem. Technol. Biotechnol. 2008, 83, 546–552. [CrossRef]
36. Nasirian, M.; Mehrvar, M. Photocatalytic degradation of aqueous Methyl Orange using nitrogen doped TiO2
photocatalyst prepared by novel method of UV assisted thermal synthesis. J. Environ. Sci. 2018, 66, 81–93.[CrossRef] [PubMed]
37. Chong, M.N.; Jin, B.; Chow, C.W.; Saint, C. Recent developments in photocatalytic water treatmenttechnology: A review. Water Res. 2010, 44, 2997–3027. [CrossRef] [PubMed]
© 2018 by the authors. Licensee MDPI, Basel, Switzerland. This article is an open accessarticle distributed under the terms and conditions of the Creative Commons Attribution(CC BY) license (http://creativecommons.org/licenses/by/4.0/).