overcoming squeezing in the yacambú-quibor tunnel, venezuela · overcoming squeezing in the...
TRANSCRIPT
Hoek, E and Guevara, R. 2009. Overcoming squeezing in the Yacambú-Quibor
tunnel, Venezuela. Rock Mechanics and Rock Engineering, Vol. 42, No. 2, 389 - 418.
COPYRIGHT NOTICE
The following document is subject to copyright agreements
The attached copy is provided for your personal use on the understanding that you will not distribute it
and that you will not include it in other published documents.

Overcoming squeezing in the Yacambú-Quibor tunnel in Venezuela 2
Overcoming squeezing in the Yacambú-Quibor tunnel, Venezuela
by
Evert Hoek
Consulting Engineer, Vancouver, Canada
Corresponding Author: [email protected]
Rafael Guevara Briceño
Consulting Engineer, Caracas, Venezuela
Abstract
The 5 m diameter 23.3 km long Yacambú-Quibor tunnel is designed to carry water through the Andes
from the Yacambú dam in the wet tropical Orinoco basin to the semi-arid but fertile Quibor basin in
western Venezuela. The tunnel is excavated in silicified and graphitic phyllites at depths of up to 1270 m
below surface and extreme squeezing problems have been encountered. Construction involved 8 contracts
extending over 32 years with breakthrough being achieved in July 2008. Several excavation methods and
various lining designs were used over the years until the adoption of yielding support permitted the
Owner and the Contractor to agree that only a circular section would be used and emphasis was placed on
developing a routine construction procedure, irrespective of the rock conditions encountered at the face.
This paper describes some of the rock engineering issues that were faced during the construction of this
tunnel.
Keywords
Tunnel lining, squeezing, yielding support, support capacity calculation, graphitic phyllite, steel sets,
sliding joints, shotcrete lining

Overcoming squeezing in the Yacambú-Quibor tunnel in Venezuela 3
Overcoming squeezing in the Yacambú-Quibor tunnel, Venezuela
Evert Hoek and Rafael Guevara
Introduction
The Yacambú-Quibor tunnel in the State of Lara in Venezuela finally broke through on 27 July 2008 after
32 years of technical, financial, contractual and political problems. The 4.0 m average internal diameter
23.3 kilometre long tunnel will transfer 347 million cubic metres water per year from the wet tropical
Orinoco basin, on the eastern flank of the Andes, to semi arid Quibor valley on the western flank of the
Andes. The agricultural and urban requirements of this semi-arid agricultural area, near the city of
Barquisimeto, exceed currently available fresh water supplies and have resulted in a significant depletion
of aquifers in the Quibor region.
The principal technical issues that had to be overcome were the severe squeezing problems in very weak
graphitic phyllites at depths of up to 1270 m below surface. Initial attempts to use an open-face TBM in
1976 failed as did attempts to use heavy support to resist squeezing. It was only after the introduction of
yielding support in about 1991 that reasonable progress was made. Difficulties continued with floor heave
in sections of the tunnel in which horseshoe profiles were used, even after the introduction of yielding
support. Finally, in 2004, slow but steady progress was achieved after the Owner and the Contractor
agreed that only a circular section would be used and emphasis was placed on developing a routine
construction procedure, irrespective of the rock conditions encountered at the face.
Project background
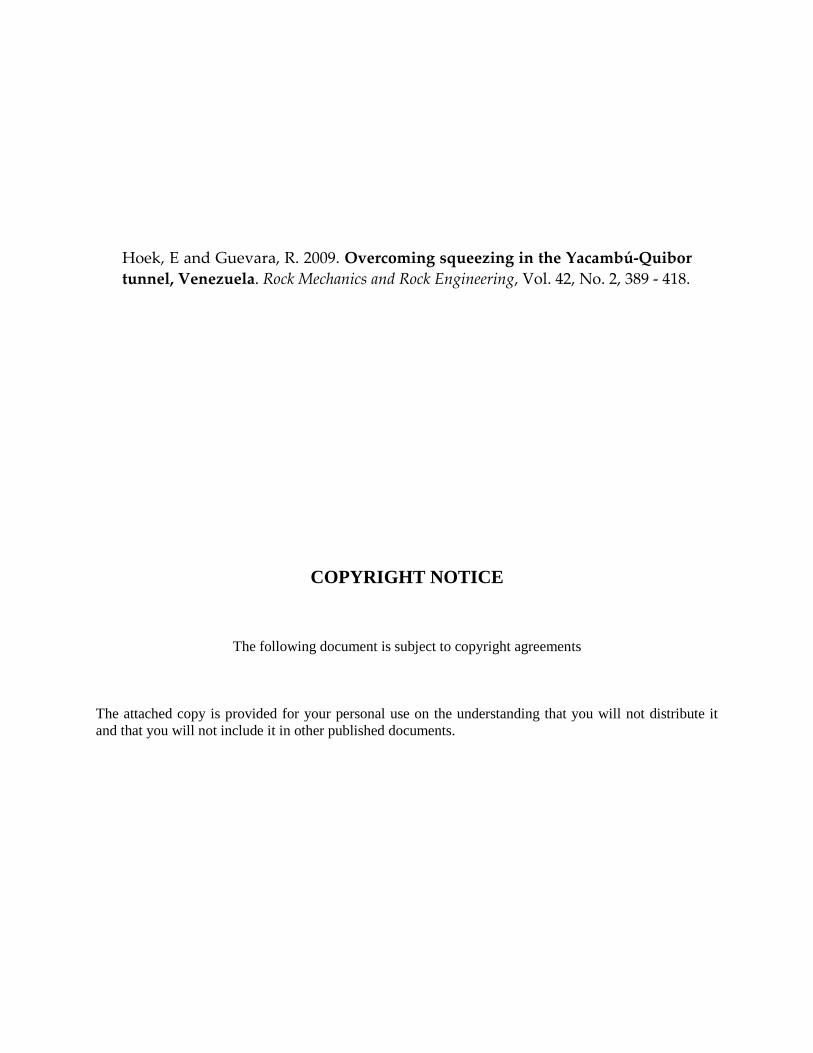
The location of the project, near the city of Barquisimeto, is shown in Figure 1. A plan of the tunnel
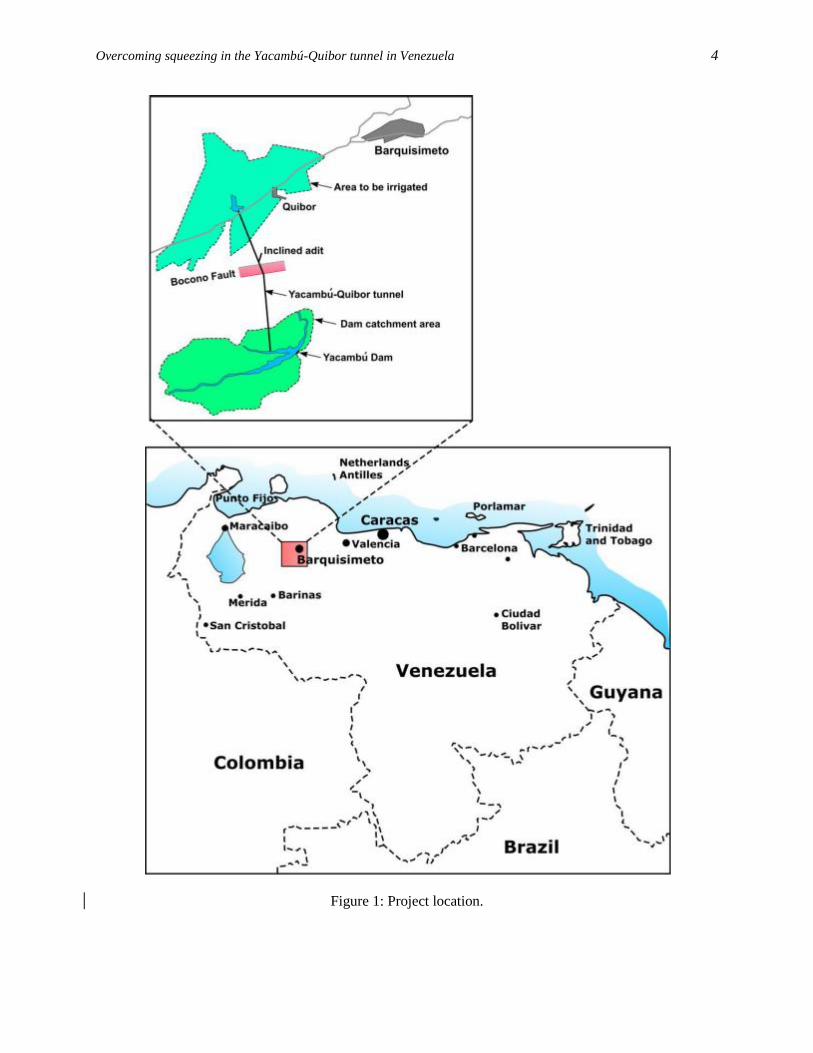
alignment is shown in the inset figure. A vertical cross-section along the tunnel alignment is given in
Figure 2. The location of the Bocono Fault, which is 750 m wide at tunnel elevation, is shown in this
figure.
The north-western region of South America and Panama is one of the most tectonically complex land
regions on earth as illustrated in Figure 3. Four major plates interact in the region. The Andes follow the
north-south Nazca/South American plate boundary to the south but curve eastward in the north and they
are influenced by this complex tectonic junction. In particular, in the region of Yacambú-Quibor project
(circle in the upper right of the figure) a triangle of strike-slip and transpressional faults (including the
Bocono) react to accommodate the mismatch in movement of the surrounding plates. The phyllitic rock
mass which dominates the mountain range in the Yacambú-Quibor area ranges from strong and
reasonably massive silicified phyllites in the dam area to severely tectonically deformed graphitic phyllite
along most of the tunnel alignment.
The original site investigations, dating back to the 1970s, involved walk-over surveys, core drilling and
the construction of several exploration adits. Most of the drilling and the adits were concentrated in the
silicified phyllite in the area of the Yacambú dam site where some of the exploration tunnels have stood,
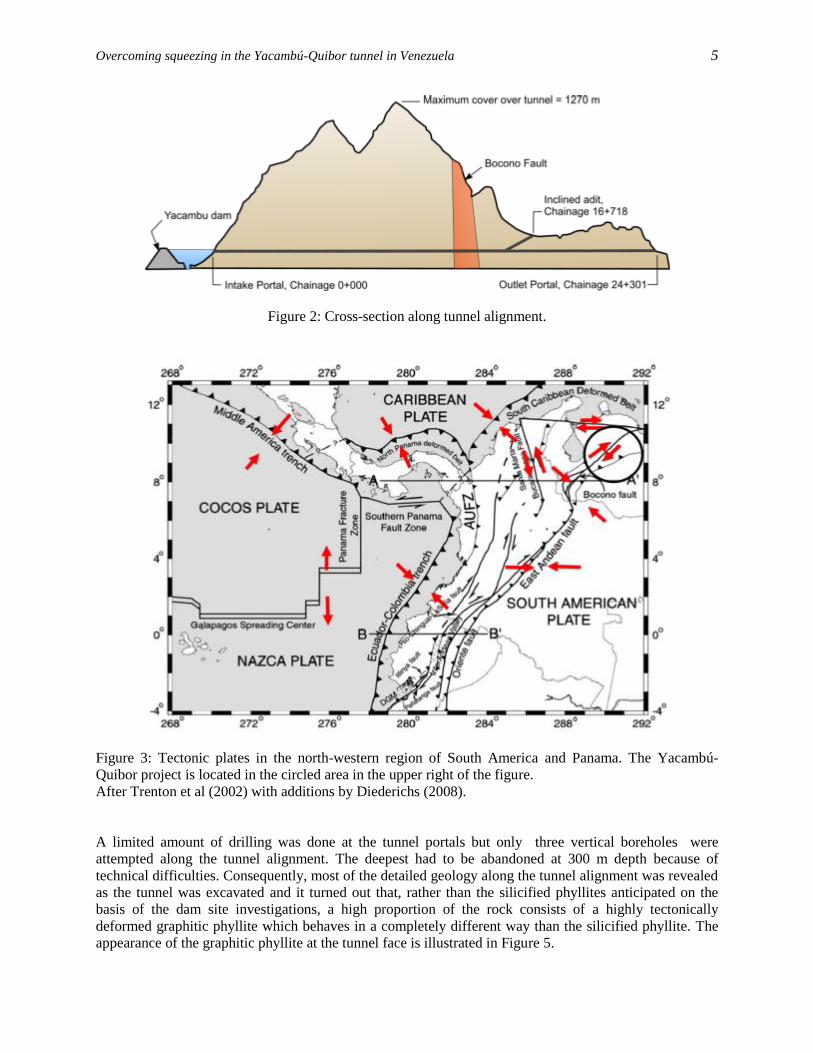
without any support, for more than 40 years. The strength of the silicified phyllite is exemplified in the
steep sided canyon in which the 160 m high concrete faced rockfill dam is located and by the steep
downstream face of this ridge, shown in Figure 4.
Overcoming squeezing in the Yacambú-Quibor tunnel in Venezuela 4
Figure 1: Project location.
Overcoming squeezing in the Yacambú-Quibor tunnel in Venezuela 5
Figure 2: Cross-section along tunnel alignment.
Figure 3: Tectonic plates in the north-western region of South America and Panama. The Yacambú-
Quibor project is located in the circled area in the upper right of the figure.
After Trenton et al (2002) with additions by Diederichs (2008).
A limited amount of drilling was done at the tunnel portals but only three vertical boreholes were
attempted along the tunnel alignment. The deepest had to be abandoned at 300 m depth because of
technical difficulties. Consequently, most of the detailed geology along the tunnel alignment was revealed
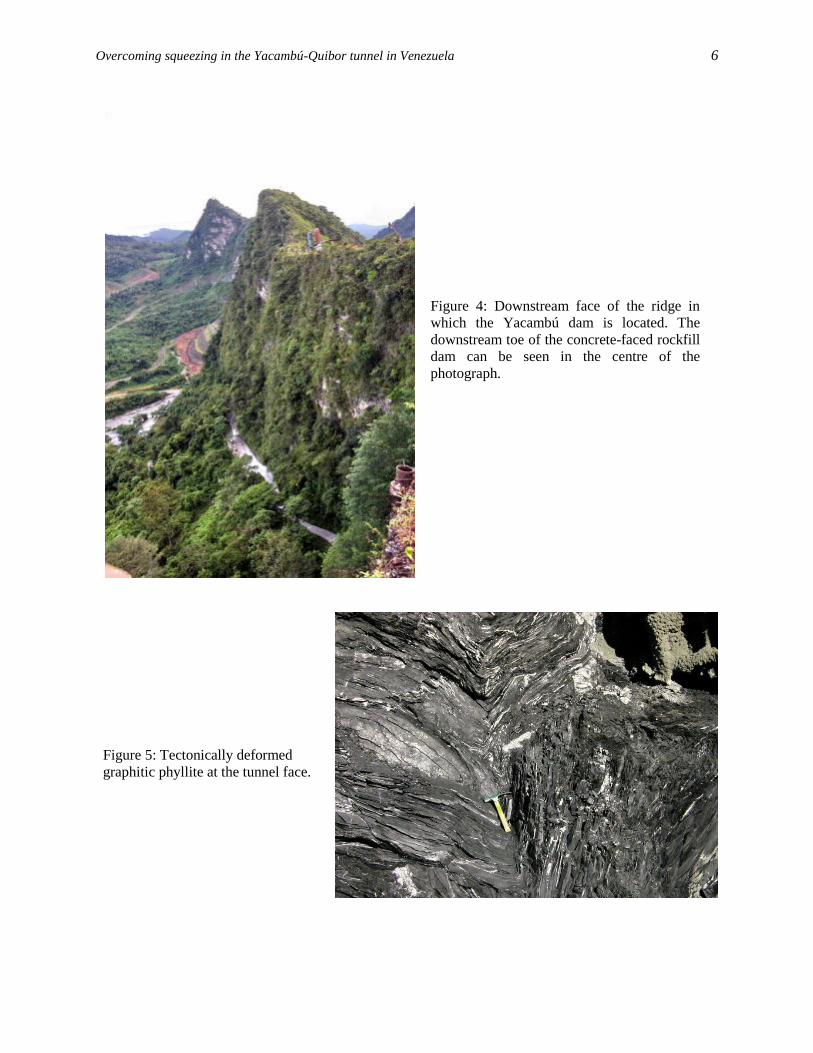
as the tunnel was excavated and it turned out that, rather than the silicified phyllites anticipated on the
basis of the dam site investigations, a high proportion of the rock consists of a highly tectonically
deformed graphitic phyllite which behaves in a completely different way than the silicified phyllite. The
appearance of the graphitic phyllite at the tunnel face is illustrated in Figure 5.
Overcoming squeezing in the Yacambú-Quibor tunnel in Venezuela 6
Figure 4: Downstream face of the ridge in
which the Yacambú dam is located. The
downstream toe of the concrete-faced rockfill
dam can be seen in the centre of the
photograph.
Figure 5: Tectonically deformed
graphitic phyllite at the tunnel face.
Overcoming squeezing in the Yacambú-Quibor tunnel in Venezuela 7
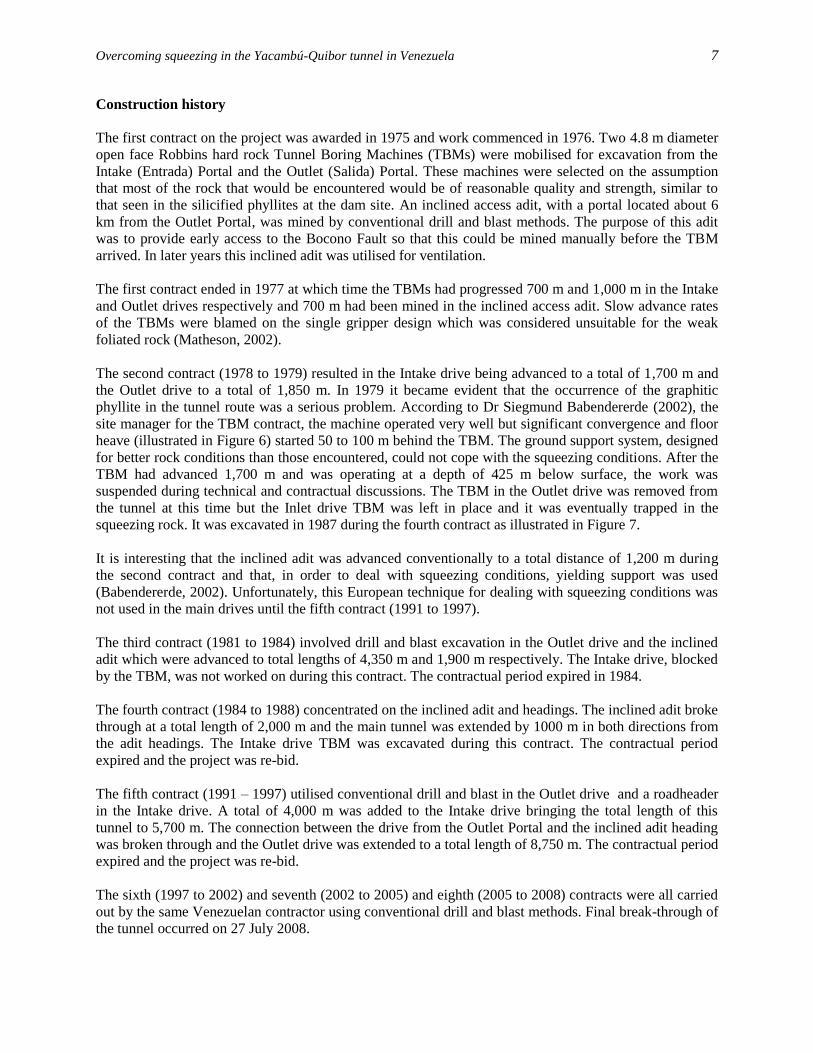
Construction history
The first contract on the project was awarded in 1975 and work commenced in 1976. Two 4.8 m diameter
open face Robbins hard rock Tunnel Boring Machines (TBMs) were mobilised for excavation from the
Intake (Entrada) Portal and the Outlet (Salida) Portal. These machines were selected on the assumption
that most of the rock that would be encountered would be of reasonable quality and strength, similar to
that seen in the silicified phyllites at the dam site. An inclined access adit, with a portal located about 6
km from the Outlet Portal, was mined by conventional drill and blast methods. The purpose of this adit
was to provide early access to the Bocono Fault so that this could be mined manually before the TBM
arrived. In later years this inclined adit was utilised for ventilation.
The first contract ended in 1977 at which time the TBMs had progressed 700 m and 1,000 m in the Intake
and Outlet drives respectively and 700 m had been mined in the inclined access adit. Slow advance rates
of the TBMs were blamed on the single gripper design which was considered unsuitable for the weak
foliated rock (Matheson, 2002).
The second contract (1978 to 1979) resulted in the Intake drive being advanced to a total of 1,700 m and
the Outlet drive to a total of 1,850 m. In 1979 it became evident that the occurrence of the graphitic
phyllite in the tunnel route was a serious problem. According to Dr Siegmund Babendererde (2002), the
site manager for the TBM contract, the machine operated very well but significant convergence and floor
heave (illustrated in Figure 6) started 50 to 100 m behind the TBM. The ground support system, designed
for better rock conditions than those encountered, could not cope with the squeezing conditions. After the
TBM had advanced 1,700 m and was operating at a depth of 425 m below surface, the work was
suspended during technical and contractual discussions. The TBM in the Outlet drive was removed from
the tunnel at this time but the Inlet drive TBM was left in place and it was eventually trapped in the
squeezing rock. It was excavated in 1987 during the fourth contract as illustrated in Figure 7.
It is interesting that the inclined adit was advanced conventionally to a total distance of 1,200 m during
the second contract and that, in order to deal with squeezing conditions, yielding support was used
(Babendererde, 2002). Unfortunately, this European technique for dealing with squeezing conditions was
not used in the main drives until the fifth contract (1991 to 1997).
The third contract (1981 to 1984) involved drill and blast excavation in the Outlet drive and the inclined
adit which were advanced to total lengths of 4,350 m and 1,900 m respectively. The Intake drive, blocked
by the TBM, was not worked on during this contract. The contractual period expired in 1984.
The fourth contract (1984 to 1988) concentrated on the inclined adit and headings. The inclined adit broke
through at a total length of 2,000 m and the main tunnel was extended by 1000 m in both directions from
the adit headings. The Intake drive TBM was excavated during this contract. The contractual period
expired and the project was re-bid.
The fifth contract (1991 – 1997) utilised conventional drill and blast in the Outlet drive and a roadheader
in the Intake drive. A total of 4,000 m was added to the Intake drive bringing the total length of this
tunnel to 5,700 m. The connection between the drive from the Outlet Portal and the inclined adit heading
was broken through and the Outlet drive was extended to a total length of 8,750 m. The contractual period
expired and the project was re-bid.
The sixth (1997 to 2002) and seventh (2002 to 2005) and eighth (2005 to 2008) contracts were all carried
out by the same Venezuelan contractor using conventional drill and blast methods. Final break-through of
the tunnel occurred on 27 July 2008.

Overcoming squeezing in the Yacambú-Quibor tunnel in Venezuela 8
Figure 6: Floor heave about 100 m behind
the Intake drive TBM in 1979 at a depth of
400 to 425 m below surface.
Figure 7: Excavation of the remains of the TBM in
1987 during the fourth contract.
Geological mapping during construction
During many of the contracts described above, excellent as-built drawings, with longitudinal cross-
sections of the geological conditions encountered in the tunnels, were prepared by Sistema
HidraulicoYacambú Quibor (SHYQ) geologists. Examples of some of the information contained in these
drawings are given in Figures 8 and 9.
At the time of writing (2009) this information is being used to evaluate the adequacy of the as-built tunnel
for long term operation as a water transmission tunnel. The rock mass characteristics, the depth below
surface, the tunnel profile, the sequence of construction and the installed support are all evaluated to
determine whether long term problems can be anticipated and, if so, what remedial actions are required.
Figure 8: Geological cross-section, rock mass classification and installed support between Chainages
14+300 and 14+700. Information extracted from SHYQ drawings.
Overcoming squeezing in the Yacambú-Quibor tunnel in Venezuela 9
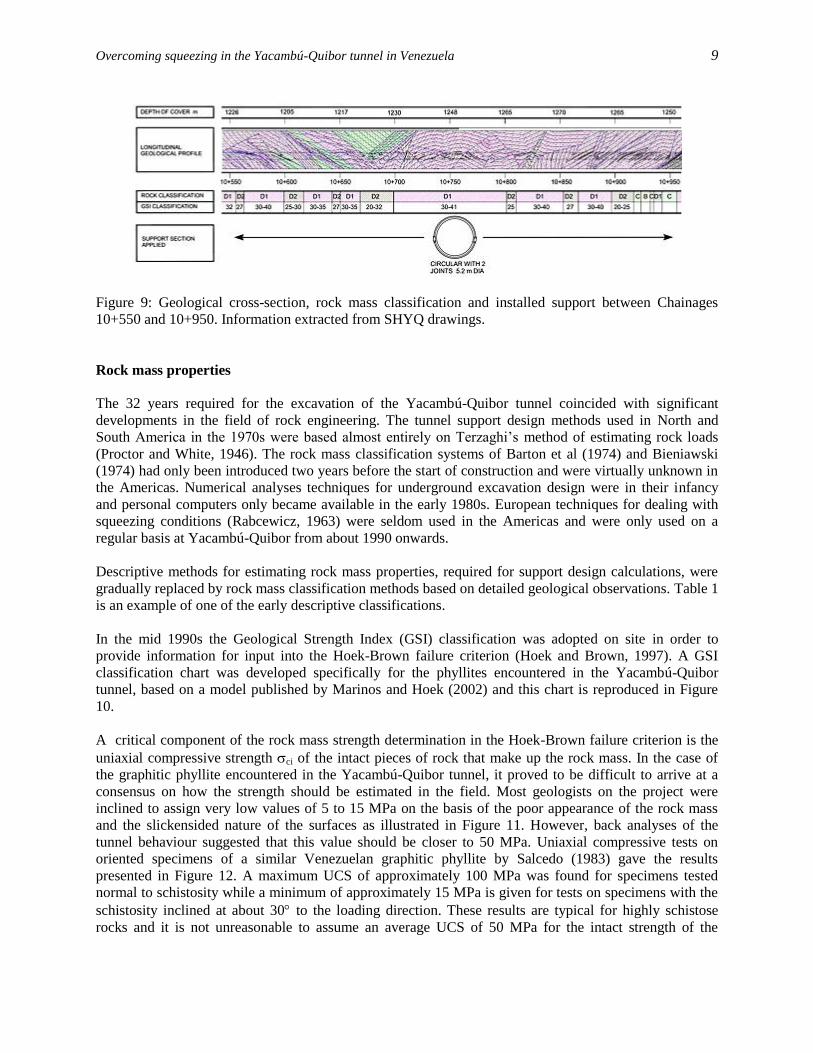
Figure 9: Geological cross-section, rock mass classification and installed support between Chainages
10+550 and 10+950. Information extracted from SHYQ drawings.
Rock mass properties
The 32 years required for the excavation of the Yacambú-Quibor tunnel coincided with significant
developments in the field of rock engineering. The tunnel support design methods used in North and
South America in the 1970s were based almost entirely on Terzaghi’s method of estimating rock loads
(Proctor and White, 1946). The rock mass classification systems of Barton et al (1974) and Bieniawski
(1974) had only been introduced two years before the start of construction and were virtually unknown in
the Americas. Numerical analyses techniques for underground excavation design were in their infancy
and personal computers only became available in the early 1980s. European techniques for dealing with
squeezing conditions (Rabcewicz, 1963) were seldom used in the Americas and were only used on a
regular basis at Yacambú-Quibor from about 1990 onwards.
Descriptive methods for estimating rock mass properties, required for support design calculations, were
gradually replaced by rock mass classification methods based on detailed geological observations. Table 1
is an example of one of the early descriptive classifications.
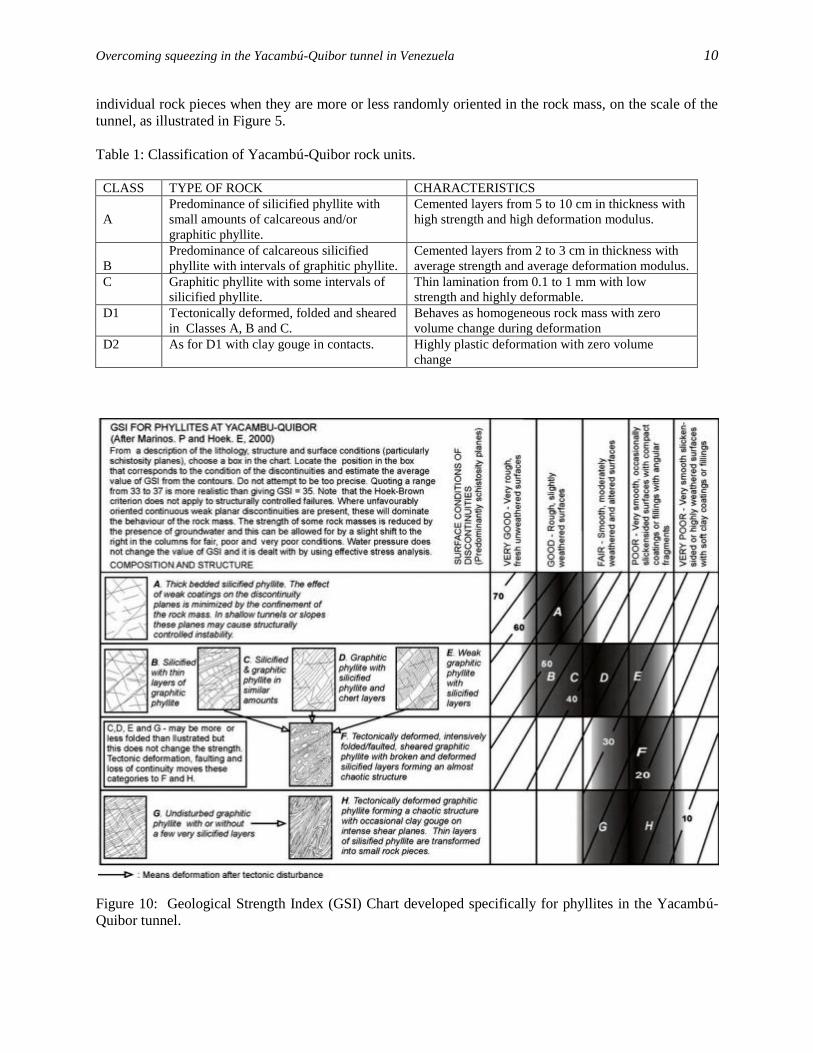
In the mid 1990s the Geological Strength Index (GSI) classification was adopted on site in order to
provide information for input into the Hoek-Brown failure criterion (Hoek and Brown, 1997). A GSI
classification chart was developed specifically for the phyllites encountered in the Yacambú-Quibor
tunnel, based on a model published by Marinos and Hoek (2002) and this chart is reproduced in Figure
10.
A critical component of the rock mass strength determination in the Hoek-Brown failure criterion is the
uniaxial compressive strength ci of the intact pieces of rock that make up the rock mass. In the case of
the graphitic phyllite encountered in the Yacambú-Quibor tunnel, it proved to be difficult to arrive at a
consensus on how the strength should be estimated in the field. Most geologists on the project were
inclined to assign very low values of 5 to 15 MPa on the basis of the poor appearance of the rock mass
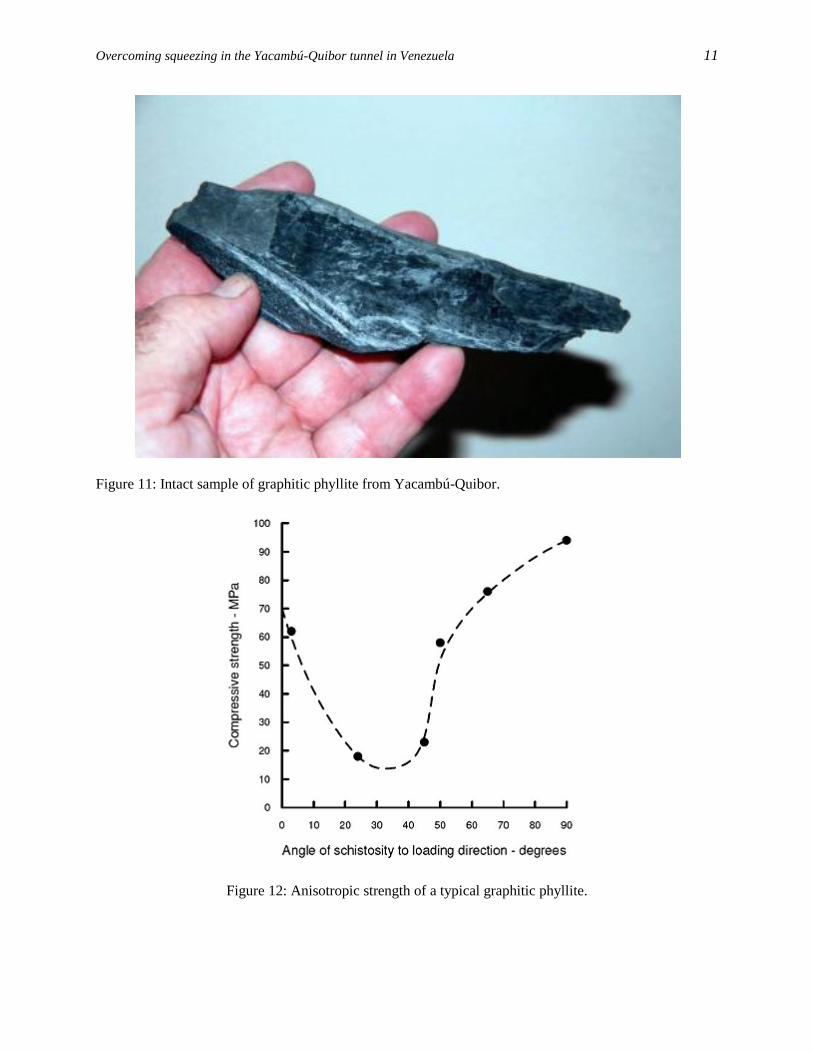
and the slickensided nature of the surfaces as illustrated in Figure 11. However, back analyses of the
tunnel behaviour suggested that this value should be closer to 50 MPa. Uniaxial compressive tests on
oriented specimens of a similar Venezuelan graphitic phyllite by Salcedo (1983) gave the results
presented in Figure 12. A maximum UCS of approximately 100 MPa was found for specimens tested
normal to schistosity while a minimum of approximately 15 MPa is given for tests on specimens with the
schistosity inclined at about 30 to the loading direction. These results are typical for highly schistose
rocks and it is not unreasonable to assume an average UCS of 50 MPa for the intact strength of the
Overcoming squeezing in the Yacambú-Quibor tunnel in Venezuela 10
individual rock pieces when they are more or less randomly oriented in the rock mass, on the scale of the
tunnel, as illustrated in Figure 5.
Table 1: Classification of Yacambú-Quibor rock units.
CLASS TYPE OF ROCK CHARACTERISTICS
A
Predominance of silicified phyllite with
small amounts of calcareous and/or
graphitic phyllite.
Cemented layers from 5 to 10 cm in thickness with
high strength and high deformation modulus.
B
Predominance of calcareous silicified
phyllite with intervals of graphitic phyllite.
Cemented layers from 2 to 3 cm in thickness with
average strength and average deformation modulus.
C Graphitic phyllite with some intervals of
silicified phyllite.
Thin lamination from 0.1 to 1 mm with low
strength and highly deformable.
D1 Tectonically deformed, folded and sheared
in Classes A, B and C.
Behaves as homogeneous rock mass with zero
volume change during deformation
D2 As for D1 with clay gouge in contacts. Highly plastic deformation with zero volume
change
Figure 10: Geological Strength Index (GSI) Chart developed specifically for phyllites in the Yacambú-
Quibor tunnel.
Overcoming squeezing in the Yacambú-Quibor tunnel in Venezuela 11
Figure 11: Intact sample of graphitic phyllite from Yacambú-Quibor.
Figure 12: Anisotropic strength of a typical graphitic phyllite.
Overcoming squeezing in the Yacambú-Quibor tunnel in Venezuela 12
A third parameter required for the Hoek-Brown criterion is a material constant mi that is related to the
frictional characteristics of the rock material. This constant can be determined by laboratory triaxial tests
but, since these tests are seldom carried out for tunnelling projects, the value is typically estimated from a
table of typical values (Hoek et al, 2002).
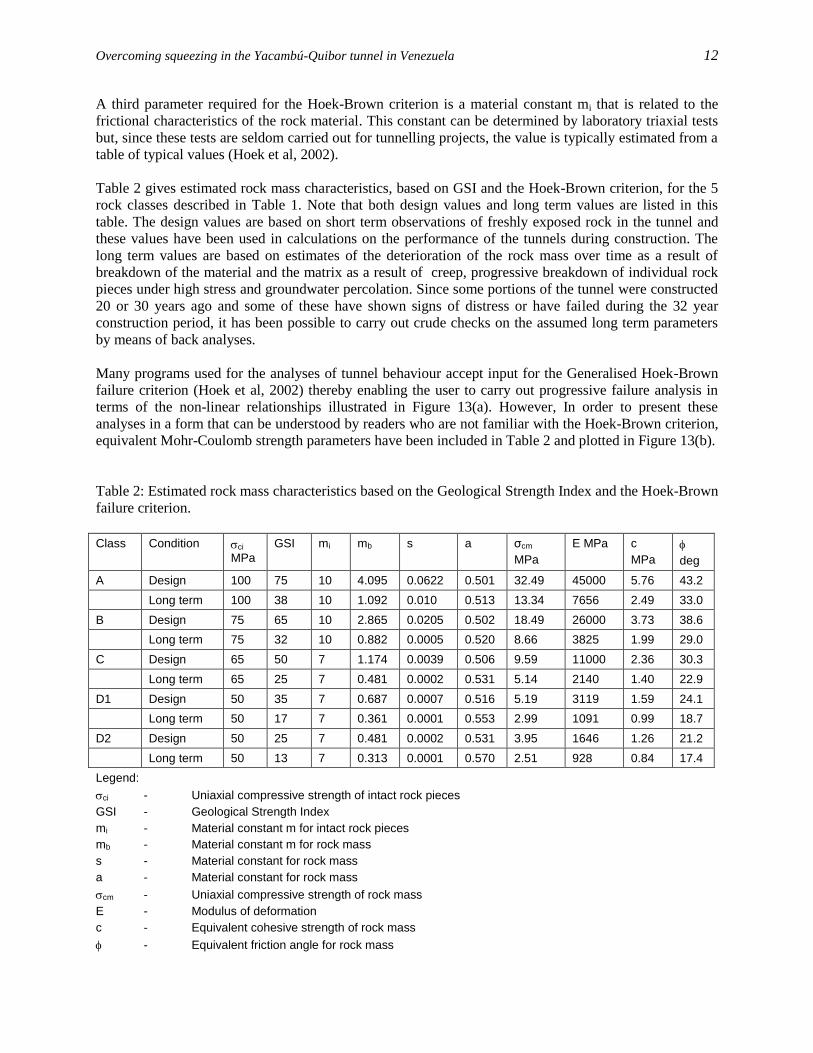
Table 2 gives estimated rock mass characteristics, based on GSI and the Hoek-Brown criterion, for the 5
rock classes described in Table 1. Note that both design values and long term values are listed in this
table. The design values are based on short term observations of freshly exposed rock in the tunnel and
these values have been used in calculations on the performance of the tunnels during construction. The
long term values are based on estimates of the deterioration of the rock mass over time as a result of
breakdown of the material and the matrix as a result of creep, progressive breakdown of individual rock
pieces under high stress and groundwater percolation. Since some portions of the tunnel were constructed
20 or 30 years ago and some of these have shown signs of distress or have failed during the 32 year
construction period, it has been possible to carry out crude checks on the assumed long term parameters
by means of back analyses.
Many programs used for the analyses of tunnel behaviour accept input for the Generalised Hoek-Brown
failure criterion (Hoek et al, 2002) thereby enabling the user to carry out progressive failure analysis in
terms of the non-linear relationships illustrated in Figure 13(a). However, In order to present these
analyses in a form that can be understood by readers who are not familiar with the Hoek-Brown criterion,
equivalent Mohr-Coulomb strength parameters have been included in Table 2 and plotted in Figure 13(b).
Table 2: Estimated rock mass characteristics based on the Geological Strength Index and the Hoek-Brown
failure criterion.
Class Condition ci MPa
GSI mi mb s a σcm
MPa
E MPa c
MPa
deg
A Design 100 75 10 4.095 0.0622 0.501 32.49 45000 5.76 43.2
Long term 100 38 10 1.092 0.010 0.513 13.34 7656 2.49 33.0
B Design 75 65 10 2.865 0.0205 0.502 18.49 26000 3.73 38.6
Long term 75 32 10 0.882 0.0005 0.520 8.66 3825 1.99 29.0
C Design 65 50 7 1.174 0.0039 0.506 9.59 11000 2.36 30.3
Long term 65 25 7 0.481 0.0002 0.531 5.14 2140 1.40 22.9
D1 Design 50 35 7 0.687 0.0007 0.516 5.19 3119 1.59 24.1
Long term 50 17 7 0.361 0.0001 0.553 2.99 1091 0.99 18.7
D2 Design 50 25 7 0.481 0.0002 0.531 3.95 1646 1.26 21.2
Long term 50 13 7 0.313 0.0001 0.570 2.51 928 0.84 17.4
Legend:
ci - Uniaxial compressive strength of intact rock pieces
GSI - Geological Strength Index
mi - Material constant m for intact rock pieces
mb - Material constant m for rock mass
s - Material constant for rock mass
a - Material constant for rock mass
cm - Uniaxial compressive strength of rock mass
E - Modulus of deformation
c - Equivalent cohesive strength of rock mass
- Equivalent friction angle for rock mass

Overcoming squeezing in the Yacambú-Quibor tunnel in Venezuela 13
Figure 13: (a) Plot of major versus minor principal stresses for design and long term strength of the 5 rock
classes listed in Table 2.
Overcoming squeezing in the Yacambú-Quibor tunnel in Venezuela 14
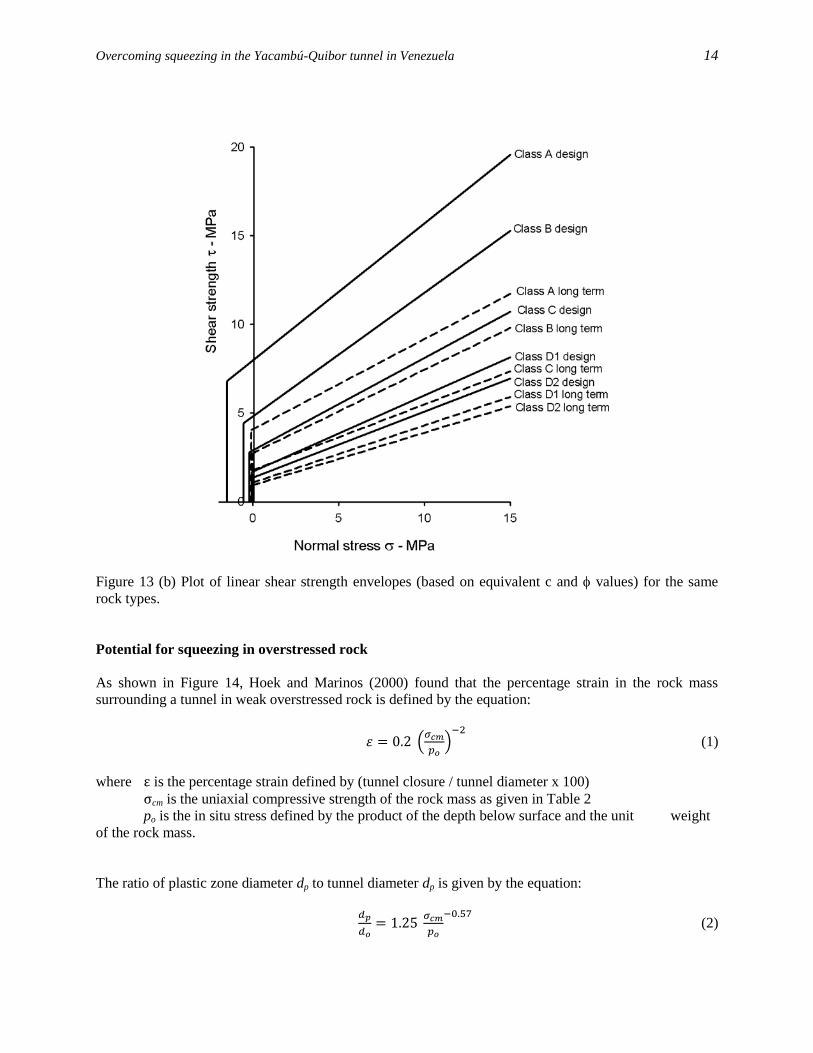
Figure 13 (b) Plot of linear shear strength envelopes (based on equivalent c and values) for the same
rock types.
Potential for squeezing in overstressed rock
As shown in Figure 14, Hoek and Marinos (2000) found that the percentage strain in the rock mass
surrounding a tunnel in weak overstressed rock is defined by the equation:
(1)
where ε is the percentage strain defined by (tunnel closure / tunnel diameter x 100)
σcm is the uniaxial compressive strength of the rock mass as given in Table 2
po is the in situ stress defined by the product of the depth below surface and the unit weight
of the rock mass.
The ratio of plastic zone diameter dp to tunnel diameter dp is given by the equation:
(2)
Overcoming squeezing in the Yacambú-Quibor tunnel in Venezuela 15
Note that this analysis is based on the assumption that the horizontal and vertical in situ stresses are equal.
This assumption is reasonable for very weak rock which cannot sustain high shear stresses such that, over
geological time, anisotropic in situ stresses will tend to equalise. This assumption has been confirmed by
observations and back analysis of the behaviour of tunnels in highly stressed weak rock masses, including
the Yacambú-Quibor tunnel.
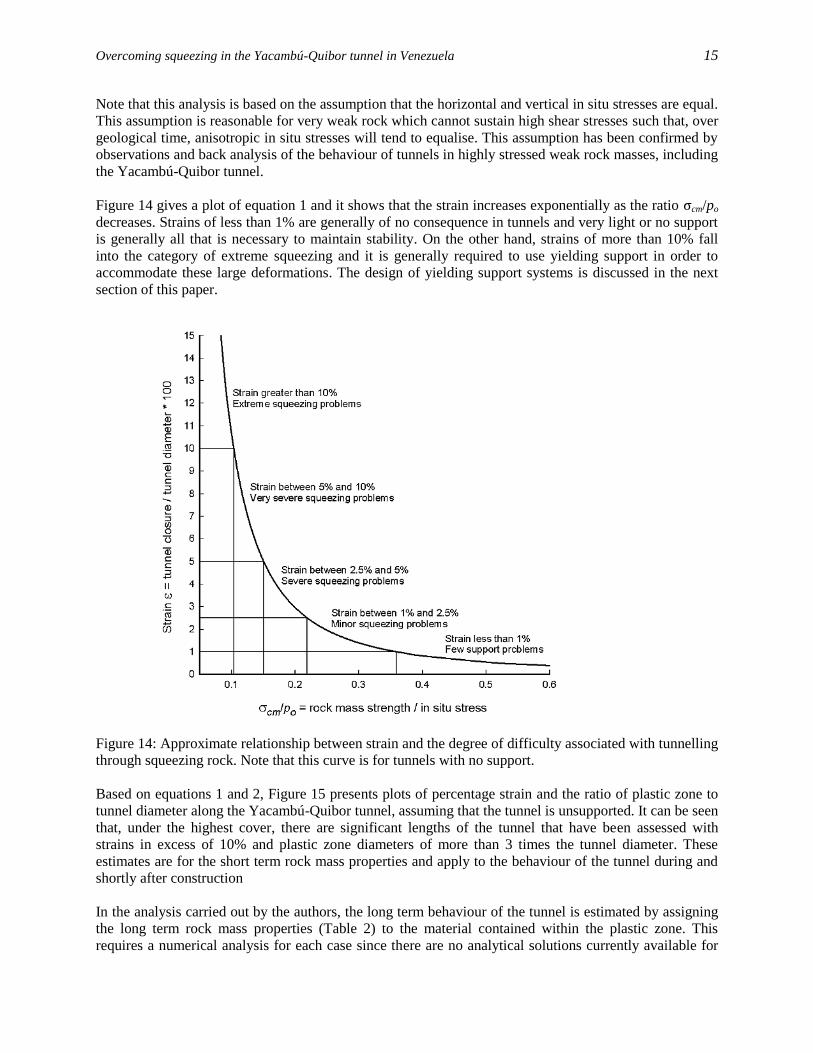
Figure 14 gives a plot of equation 1 and it shows that the strain increases exponentially as the ratio σcm/po
decreases. Strains of less than 1% are generally of no consequence in tunnels and very light or no support
is generally all that is necessary to maintain stability. On the other hand, strains of more than 10% fall
into the category of extreme squeezing and it is generally required to use yielding support in order to
accommodate these large deformations. The design of yielding support systems is discussed in the next
section of this paper.
Figure 14: Approximate relationship between strain and the degree of difficulty associated with tunnelling
through squeezing rock. Note that this curve is for tunnels with no support.
Based on equations 1 and 2, Figure 15 presents plots of percentage strain and the ratio of plastic zone to
tunnel diameter along the Yacambú-Quibor tunnel, assuming that the tunnel is unsupported. It can be seen
that, under the highest cover, there are significant lengths of the tunnel that have been assessed with
strains in excess of 10% and plastic zone diameters of more than 3 times the tunnel diameter. These
estimates are for the short term rock mass properties and apply to the behaviour of the tunnel during and
shortly after construction
In the analysis carried out by the authors, the long term behaviour of the tunnel is estimated by assigning
the long term rock mass properties (Table 2) to the material contained within the plastic zone. This
requires a numerical analysis for each case since there are no analytical solutions currently available for
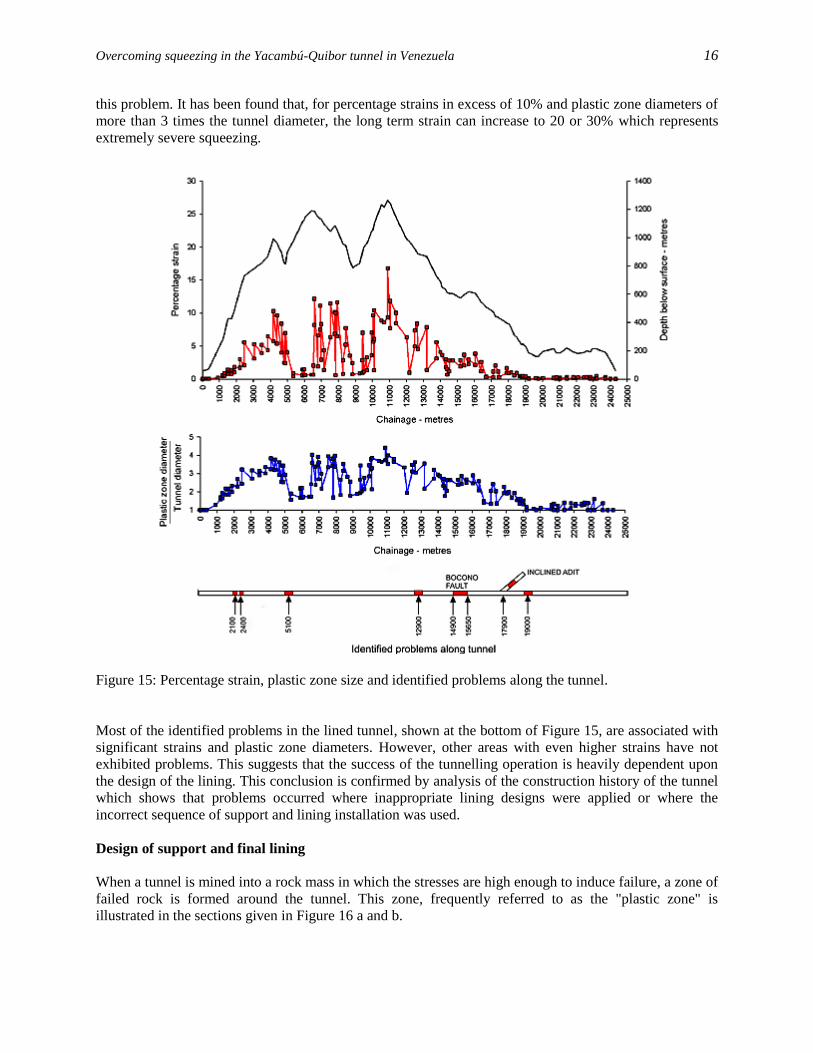
Overcoming squeezing in the Yacambú-Quibor tunnel in Venezuela 16
this problem. It has been found that, for percentage strains in excess of 10% and plastic zone diameters of
more than 3 times the tunnel diameter, the long term strain can increase to 20 or 30% which represents
extremely severe squeezing.
Figure 15: Percentage strain, plastic zone size and identified problems along the tunnel.
Most of the identified problems in the lined tunnel, shown at the bottom of Figure 15, are associated with
significant strains and plastic zone diameters. However, other areas with even higher strains have not
exhibited problems. This suggests that the success of the tunnelling operation is heavily dependent upon
the design of the lining. This conclusion is confirmed by analysis of the construction history of the tunnel
which shows that problems occurred where inappropriate lining designs were applied or where the
incorrect sequence of support and lining installation was used.
Design of support and final lining
When a tunnel is mined into a rock mass in which the stresses are high enough to induce failure, a zone of
failed rock is formed around the tunnel. This zone, frequently referred to as the "plastic zone" is
illustrated in the sections given in Figure 16 a and b.
Overcoming squeezing in the Yacambú-Quibor tunnel in Venezuela 17
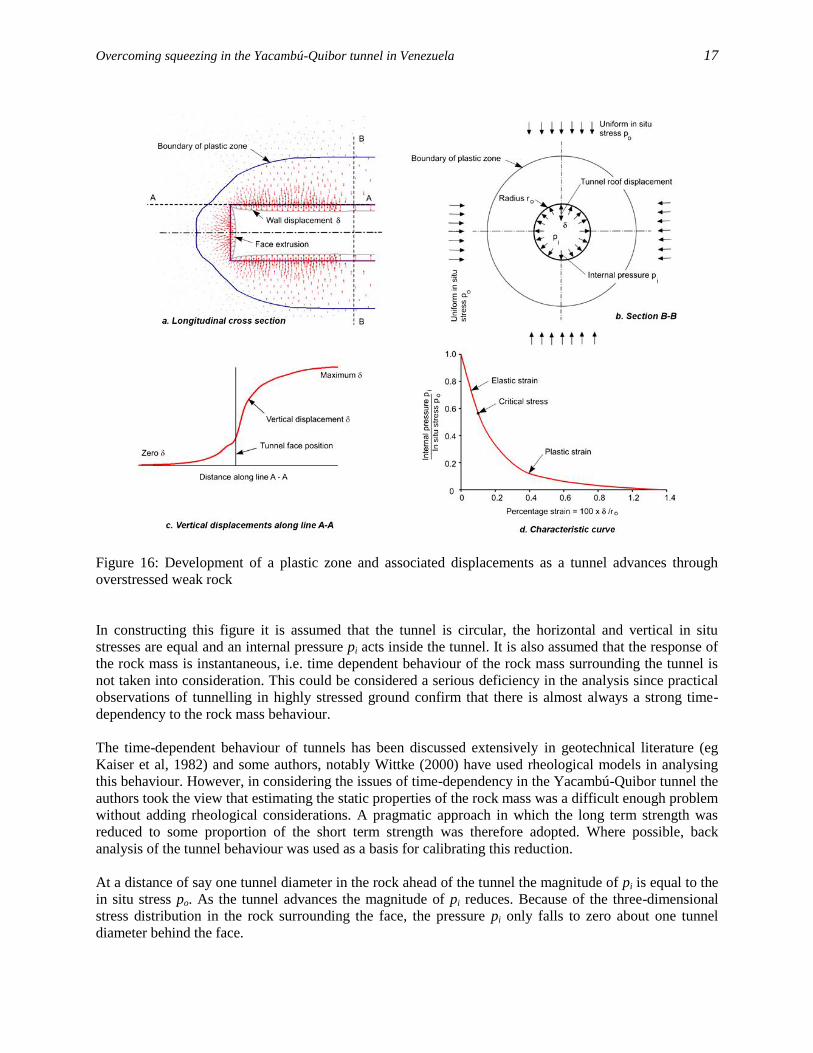
Figure 16: Development of a plastic zone and associated displacements as a tunnel advances through
overstressed weak rock
In constructing this figure it is assumed that the tunnel is circular, the horizontal and vertical in situ
stresses are equal and an internal pressure pi acts inside the tunnel. It is also assumed that the response of
the rock mass is instantaneous, i.e. time dependent behaviour of the rock mass surrounding the tunnel is
not taken into consideration. This could be considered a serious deficiency in the analysis since practical
observations of tunnelling in highly stressed ground confirm that there is almost always a strong time-
dependency to the rock mass behaviour.
The time-dependent behaviour of tunnels has been discussed extensively in geotechnical literature (eg
Kaiser et al, 1982) and some authors, notably Wittke (2000) have used rheological models in analysing
this behaviour. However, in considering the issues of time-dependency in the Yacambú-Quibor tunnel the
authors took the view that estimating the static properties of the rock mass was a difficult enough problem
without adding rheological considerations. A pragmatic approach in which the long term strength was
reduced to some proportion of the short term strength was therefore adopted. Where possible, back
analysis of the tunnel behaviour was used as a basis for calibrating this reduction.
At a distance of say one tunnel diameter in the rock ahead of the tunnel the magnitude of pi is equal to the
in situ stress po. As the tunnel advances the magnitude of pi reduces. Because of the three-dimensional
stress distribution in the rock surrounding the face, the pressure pi only falls to zero about one tunnel
diameter behind the face.
Overcoming squeezing in the Yacambú-Quibor tunnel in Venezuela 18
The size of the plastic zone and the magnitude of the displacements in the rock mass surrounding the
tunnel increase as the internal support pressure pi decreases. Figure 16c shows the vertical displacements
measured along the line A - A in the roof of the tunnel and this plot is generally known as the
Longitudinal Displacement Profile. Figure 16d shows the convergence of the tunnel, expressed as a
percentage strain, against the ratio pi/po and this curve is generally known as the Characteristic Curve for
the tunnel.
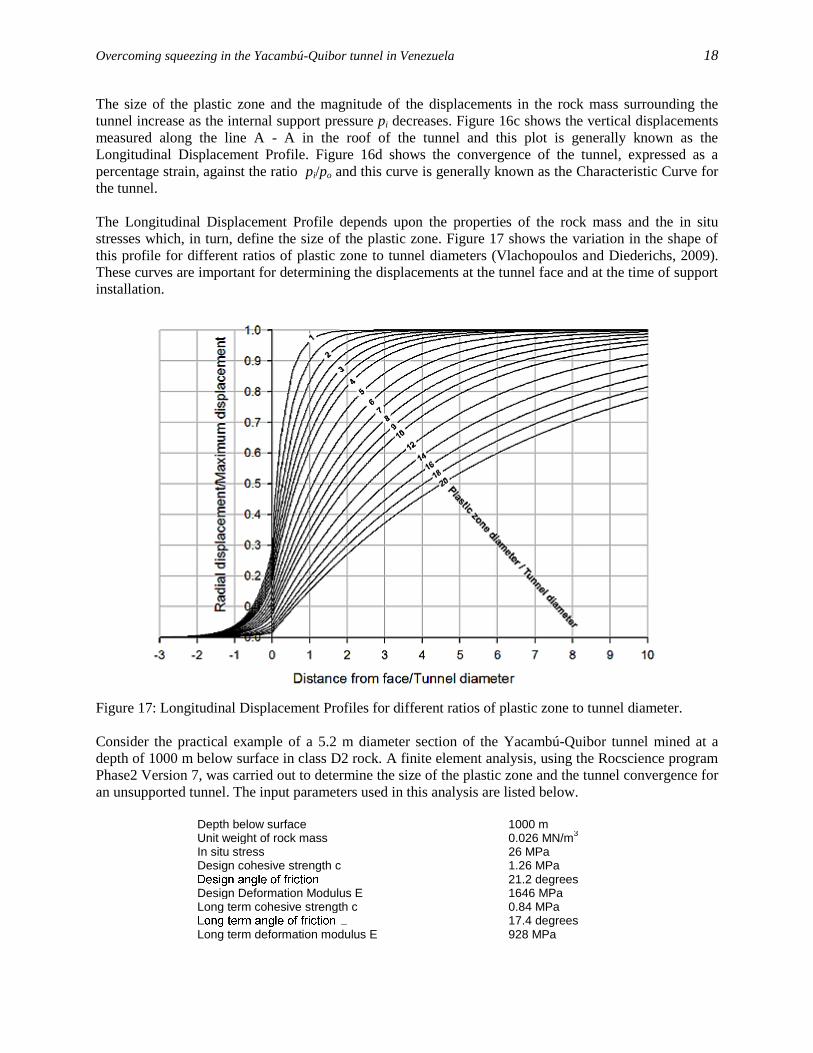
The Longitudinal Displacement Profile depends upon the properties of the rock mass and the in situ
stresses which, in turn, define the size of the plastic zone. Figure 17 shows the variation in the shape of
this profile for different ratios of plastic zone to tunnel diameters (Vlachopoulos and Diederichs, 2009).
These curves are important for determining the displacements at the tunnel face and at the time of support
installation.
Figure 17: Longitudinal Displacement Profiles for different ratios of plastic zone to tunnel diameter.
Consider the practical example of a 5.2 m diameter section of the Yacambú-Quibor tunnel mined at a
depth of 1000 m below surface in class D2 rock. A finite element analysis, using the Rocscience program
Phase2 Version 7, was carried out to determine the size of the plastic zone and the tunnel convergence for
an unsupported tunnel. The input parameters used in this analysis are listed below.
Depth below surface 1000 m Unit weight of rock mass 0.026 MN/m
3
In situ stress 26 MPa Design cohesive strength c 1.26 MPa
21.2 degrees Design Deformation Modulus E 1646 MPa Long term cohesive strength c 0.84 MPa
17.4 degrees Long term deformation modulus E 928 MPa

Overcoming squeezing in the Yacambú-Quibor tunnel in Venezuela 19
Characteristic curves for both design and long term conditions are plotted in Figure 18. Note that, in
calculating the characteristic curve for the long term condition, the long term rock mass properties have
been applied to the plastic zone only since it is assumed that long term changes due to displacement
induced damage, air and water circulation and the like will be restricted to this zone.
Figure 18: Characteristic curves for an unsupported tunnel in D2 rock mass at 1000 m depth.
The radius of the plastic zone for the fully excavated unsupported tunnel for the D2 design strength
conditions was found to be approximately 10.4 m. Figure 19 gives a plot of the Longitudinal
Displacement Profile for this set of conditions, for a ratio of plastic zone to tunnel radius of 10.4/2.6 = 4.
This curve was calculated from the data used in constructing Figure 17, tabulated in Appendix 1.
Figure 19: Longitudinal displacement plot for the design conditions in D2 rock.
Overcoming squeezing in the Yacambú-Quibor tunnel in Venezuela 20
Based on many years of experience in constructing the Yacambú-Quibor tunnel it was determined that,
for the deepest sections of the tunnel in poor quality rock, the tunnel would be circular in shape and that it
would be lined with a high quality shotcrete lining. This shotcrete was mixed at surface batching plants
adjacent to the portals and transported by rail to the faces where it was applied as a wet mix. Tests on
cores taken in situ confirmed that a consistent uniaxial compressive strength of 30 MPa could be relied
on for this shotcrete. Since the lining is subjected to predominantly compressive loading, no fibre was
added to the lining mix although both steel and polypropylene fibres were used for other special
applications.
It was not practical to install and anchor rock bolts in these very weak rock masses and, hence, the only
support design decisions were the thickness of the shotcrete lining and the method and timing of
installation.
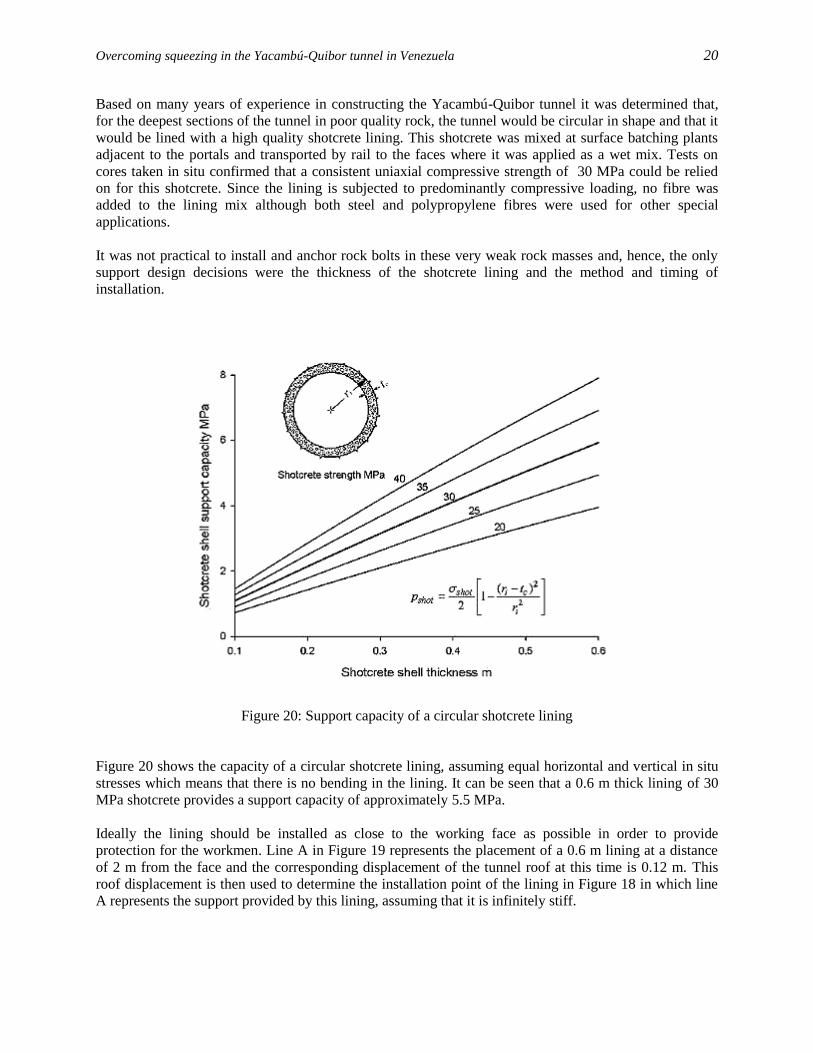
Figure 20: Support capacity of a circular shotcrete lining
Figure 20 shows the capacity of a circular shotcrete lining, assuming equal horizontal and vertical in situ
stresses which means that there is no bending in the lining. It can be seen that a 0.6 m thick lining of 30
MPa shotcrete provides a support capacity of approximately 5.5 MPa.
Ideally the lining should be installed as close to the working face as possible in order to provide
protection for the workmen. Line A in Figure 19 represents the placement of a 0.6 m lining at a distance
of 2 m from the face and the corresponding displacement of the tunnel roof at this time is 0.12 m. This
roof displacement is then used to determine the installation point of the lining in Figure 18 in which line
A represents the support provided by this lining, assuming that it is infinitely stiff.
Overcoming squeezing in the Yacambú-Quibor tunnel in Venezuela 21
Line A in Figure 18 intersects the characteristic line for the design strength at approximately 4 MPa and
this represents the support capacity mobilised at the time of installation. Since the capacity of the lining is
5.5 MPa (ignoring the reduced strength of uncured shotcrete for the moment), the factor of safety is given
by the ratio of available capacity to mobilised capacity and this is 1.5. However, the available capacity is
lower than that required for long term conditions (dashed characteristic curve in Figure 18) and the lining
will be overstressed.
An obvious solution to this problem is to delay the installation of the lining and, following the same
procedure as used above, lines B in Figures 19 and 18 show the installation of the lining at a distance of
15 m behind the face. In this case the short term (design) factor of safety is approximately 5 while, for the
long term conditions, the available lining capacity is approximately twice the required capacity.
Unfortunately it is not practical to install the lining at 15 m behind the face as suggested above since this
would result in an unacceptable level of risk to those working in the tunnel. Consequently, if the benefits
of delayed lining installation are to be realised, it is necessary to provide some form of safety cage to
protect the workers until the shotcrete lining can be fully mobilised. This introduces the concept of
yielding support that has been used by miners for many years and, as mentioned earlier, had been
employed during the second contract in mining the inclined adit.
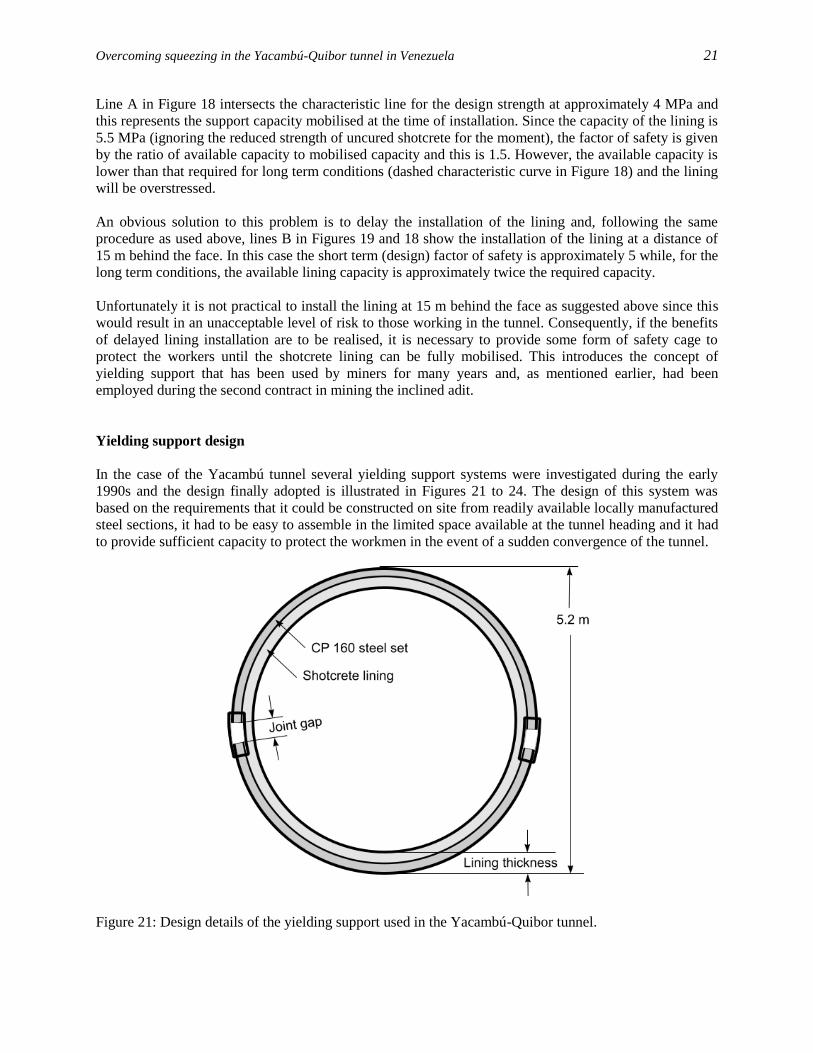
Yielding support design
In the case of the Yacambú tunnel several yielding support systems were investigated during the early
1990s and the design finally adopted is illustrated in Figures 21 to 24. The design of this system was
based on the requirements that it could be constructed on site from readily available locally manufactured
steel sections, it had to be easy to assemble in the limited space available at the tunnel heading and it had
to provide sufficient capacity to protect the workmen in the event of a sudden convergence of the tunnel.
Figure 21: Design details of the yielding support used in the Yacambú-Quibor tunnel.
Overcoming squeezing in the Yacambú-Quibor tunnel in Venezuela 22
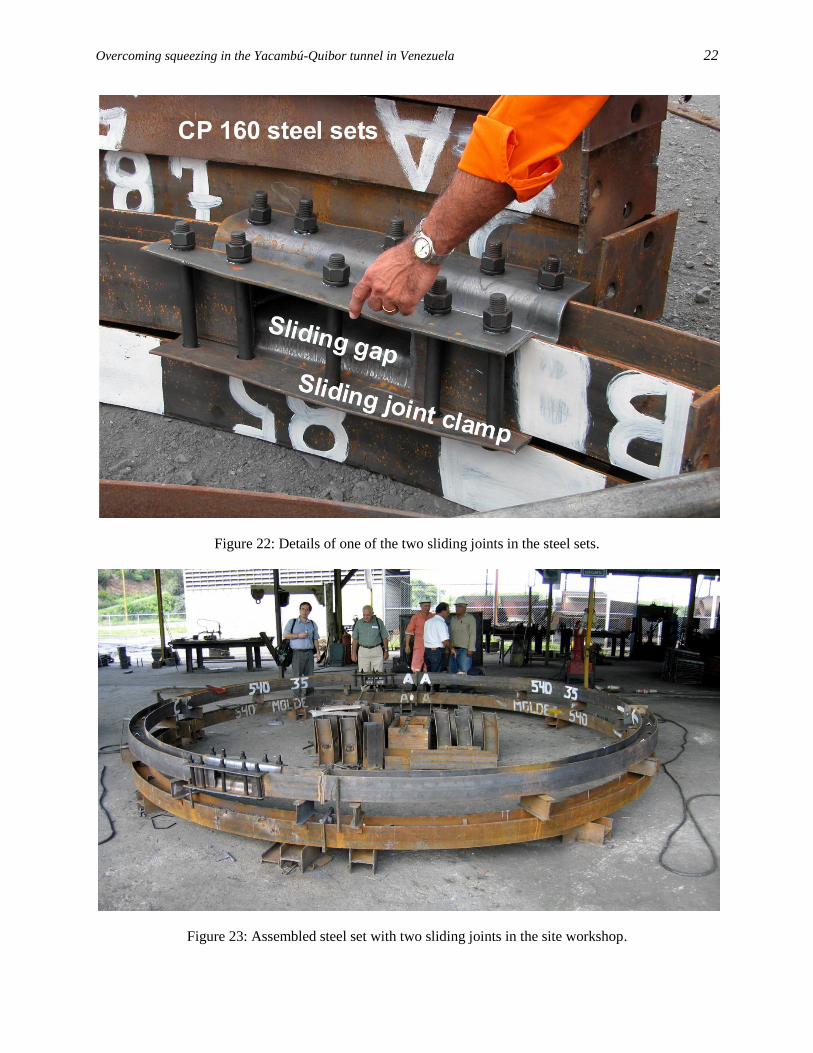
Figure 22: Details of one of the two sliding joints in the steel sets.
Figure 23: Assembled steel set with two sliding joints in the site workshop.
Overcoming squeezing in the Yacambú-Quibor tunnel in Venezuela 23
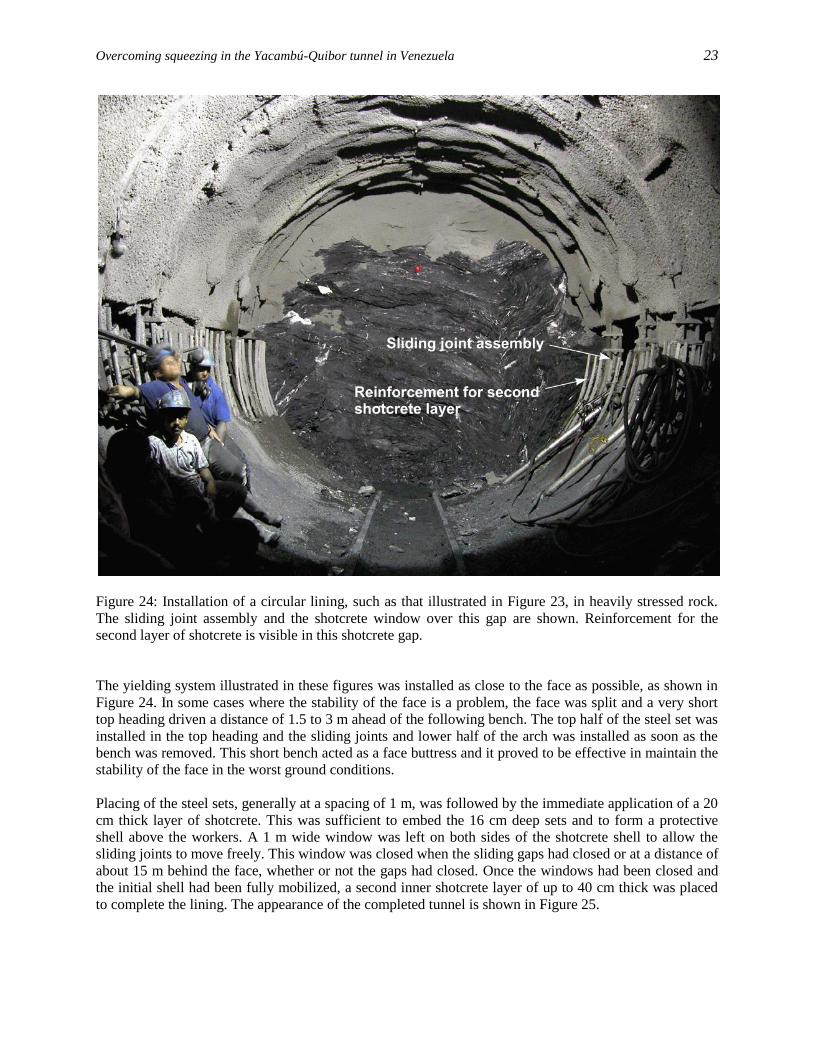
Figure 24: Installation of a circular lining, such as that illustrated in Figure 23, in heavily stressed rock.
The sliding joint assembly and the shotcrete window over this gap are shown. Reinforcement for the
second layer of shotcrete is visible in this shotcrete gap.
The yielding system illustrated in these figures was installed as close to the face as possible, as shown in
Figure 24. In some cases where the stability of the face is a problem, the face was split and a very short
top heading driven a distance of 1.5 to 3 m ahead of the following bench. The top half of the steel set was
installed in the top heading and the sliding joints and lower half of the arch was installed as soon as the
bench was removed. This short bench acted as a face buttress and it proved to be effective in maintain the
stability of the face in the worst ground conditions.
Placing of the steel sets, generally at a spacing of 1 m, was followed by the immediate application of a 20
cm thick layer of shotcrete. This was sufficient to embed the 16 cm deep sets and to form a protective
shell above the workers. A 1 m wide window was left on both sides of the shotcrete shell to allow the
sliding joints to move freely. This window was closed when the sliding gaps had closed or at a distance of
about 15 m behind the face, whether or not the gaps had closed. Once the windows had been closed and
the initial shell had been fully mobilized, a second inner shotcrete layer of up to 40 cm thick was placed
to complete the lining. The appearance of the completed tunnel is shown in Figure 25.
Overcoming squeezing in the Yacambú-Quibor tunnel in Venezuela 24
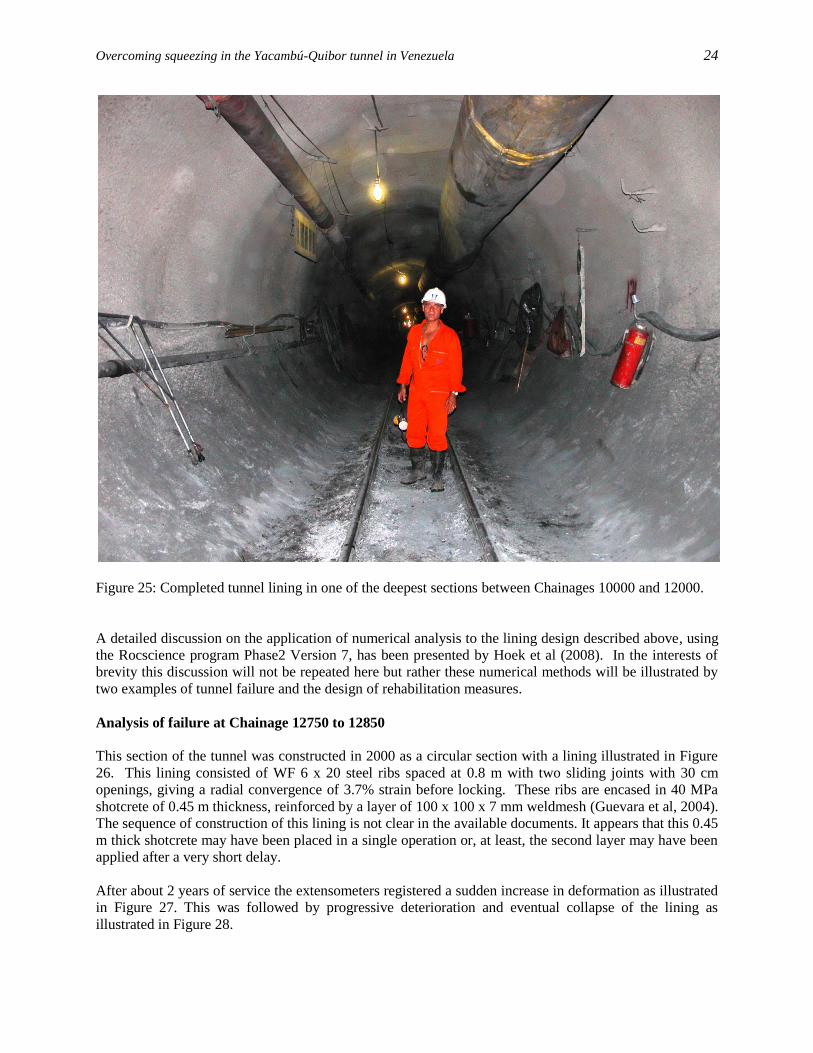
Figure 25: Completed tunnel lining in one of the deepest sections between Chainages 10000 and 12000.
A detailed discussion on the application of numerical analysis to the lining design described above, using
the Rocscience program Phase2 Version 7, has been presented by Hoek et al (2008). In the interests of
brevity this discussion will not be repeated here but rather these numerical methods will be illustrated by
two examples of tunnel failure and the design of rehabilitation measures.
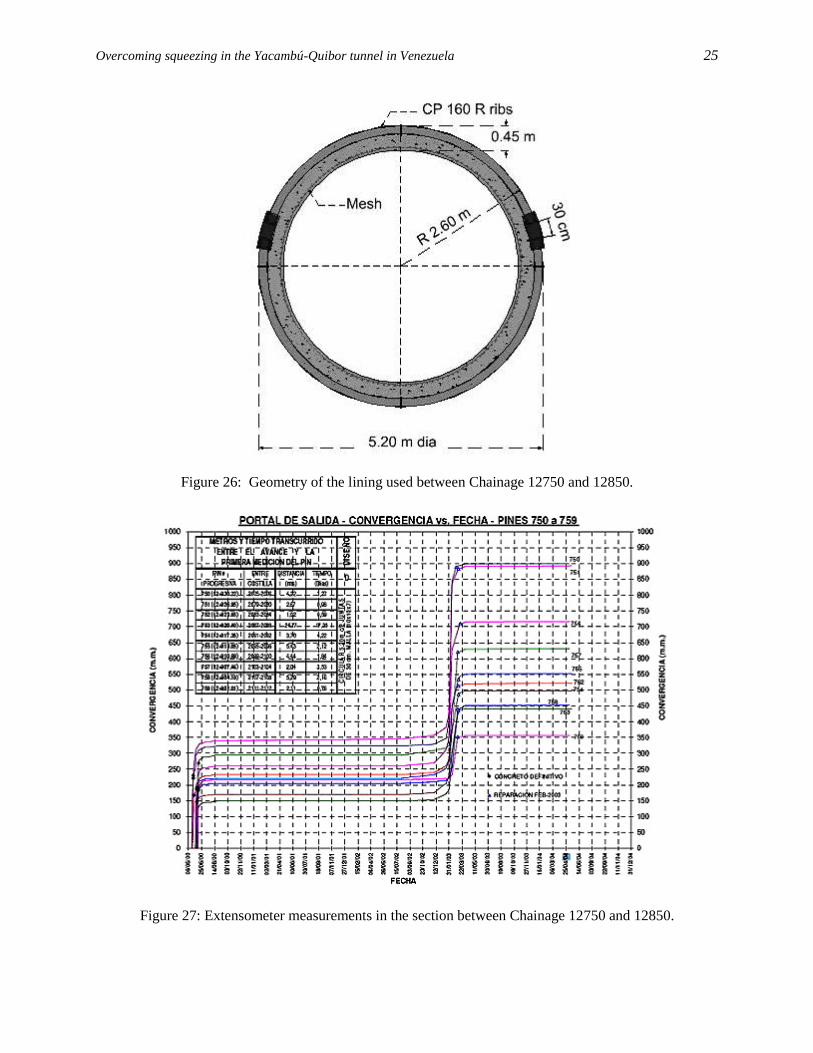
Analysis of failure at Chainage 12750 to 12850
This section of the tunnel was constructed in 2000 as a circular section with a lining illustrated in Figure
26. This lining consisted of WF 6 x 20 steel ribs spaced at 0.8 m with two sliding joints with 30 cm
openings, giving a radial convergence of 3.7% strain before locking. These ribs are encased in 40 MPa
shotcrete of 0.45 m thickness, reinforced by a layer of 100 x 100 x 7 mm weldmesh (Guevara et al, 2004).
The sequence of construction of this lining is not clear in the available documents. It appears that this 0.45
m thick shotcrete may have been placed in a single operation or, at least, the second layer may have been
applied after a very short delay.
After about 2 years of service the extensometers registered a sudden increase in deformation as illustrated
in Figure 27. This was followed by progressive deterioration and eventual collapse of the lining as
illustrated in Figure 28.
Overcoming squeezing in the Yacambú-Quibor tunnel in Venezuela 25
Figure 26: Geometry of the lining used between Chainage 12750 and 12850.
Figure 27: Extensometer measurements in the section between Chainage 12750 and 12850.
Overcoming squeezing in the Yacambú-Quibor tunnel in Venezuela 26
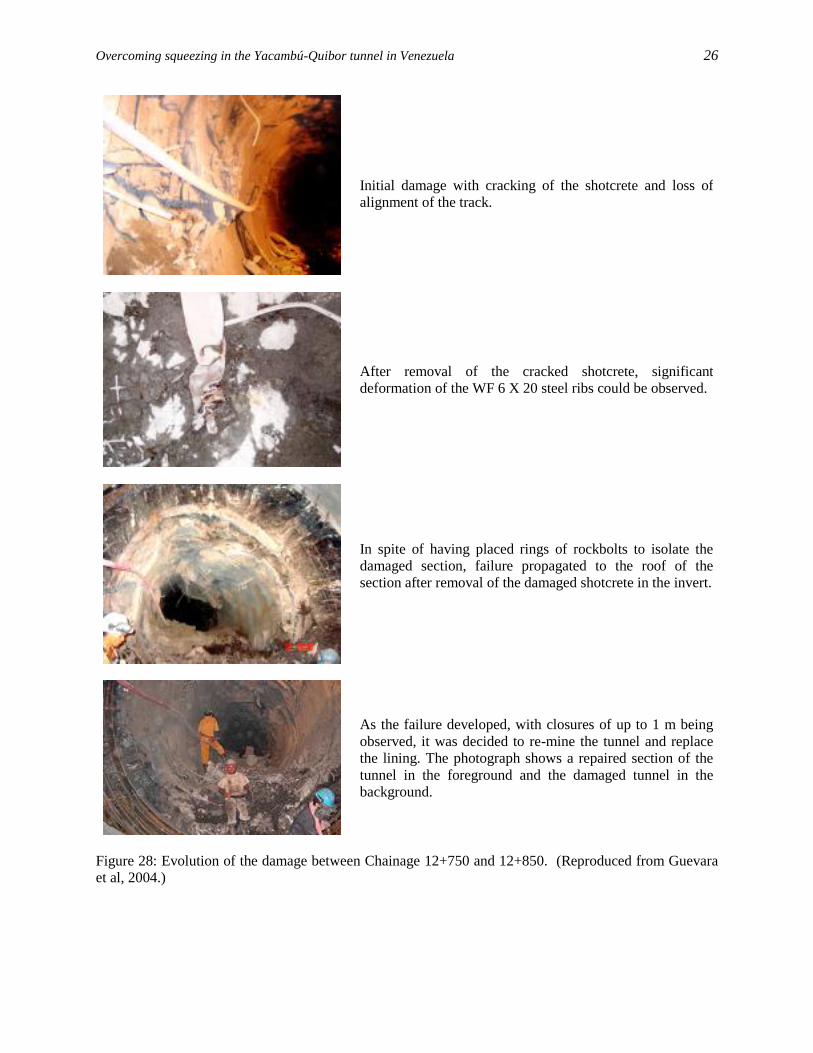
Initial damage with cracking of the shotcrete and loss of
alignment of the track.
After removal of the cracked shotcrete, significant
deformation of the WF 6 X 20 steel ribs could be observed.
In spite of having placed rings of rockbolts to isolate the
damaged section, failure propagated to the roof of the
section after removal of the damaged shotcrete in the invert.
As the failure developed, with closures of up to 1 m being
observed, it was decided to re-mine the tunnel and replace
the lining. The photograph shows a repaired section of the
tunnel in the foreground and the damaged tunnel in the
background.
Figure 28: Evolution of the damage between Chainage 12+750 and 12+850. (Reproduced from Guevara
et al, 2004.)
Overcoming squeezing in the Yacambú-Quibor tunnel in Venezuela 27
The analysis of this section was based on the following rock mass properties, determined from the
information in SHYQ drawing OT-2008-RE-13 and from the paper by Guevara et al (2004).
Parameter Short term loading Long term loading
Depth m 855 855
ci MPa 50 50
GSI 20 10
mi 7 7
E MPa 1255 839
c MPa 0.99 0.66
degrees 20.6 17.0
Since the sequence of lining construction was not known, it was decided to investigate an extreme case in
which the steel sets with sliding joints are installed first and then the complete shotcrete lining as a second
stage. While this sequence may not represent the actual construction method used, it does simulate a
construction “mistake” which can have serious consequences.
The Phase2 model was constructed with a composite lining with the first lining consisting of WF 6x20
ribs, spaced at 0.8 m centers, with 2 sliding joints as illustrated in Figure 26. A yield strength of 350 MPa
was assumed for the steel ribs. The second lining consisted of a 0.45 m thick 40 MPa shotcrete shell with
100 x100 x7 mm weldmesh reinforcing. Following the same procedure illustrated in Figures 18 and 19 of
the previous section, the first lining was installed at a model stage corresponding to 50% of the maximum
convergence of an unsupported tunnel. The second lining was installed after the sliding joints were almost
fully closed.
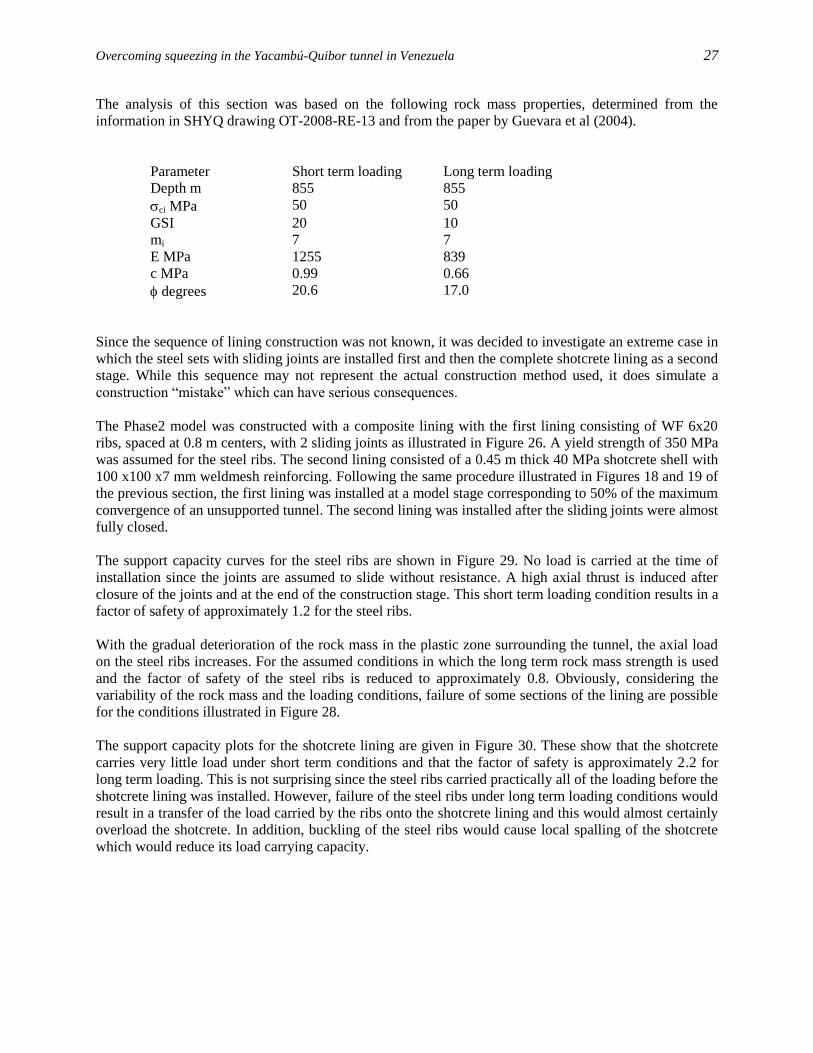
The support capacity curves for the steel ribs are shown in Figure 29. No load is carried at the time of
installation since the joints are assumed to slide without resistance. A high axial thrust is induced after
closure of the joints and at the end of the construction stage. This short term loading condition results in a
factor of safety of approximately 1.2 for the steel ribs.
With the gradual deterioration of the rock mass in the plastic zone surrounding the tunnel, the axial load
on the steel ribs increases. For the assumed conditions in which the long term rock mass strength is used
and the factor of safety of the steel ribs is reduced to approximately 0.8. Obviously, considering the
variability of the rock mass and the loading conditions, failure of some sections of the lining are possible
for the conditions illustrated in Figure 28.
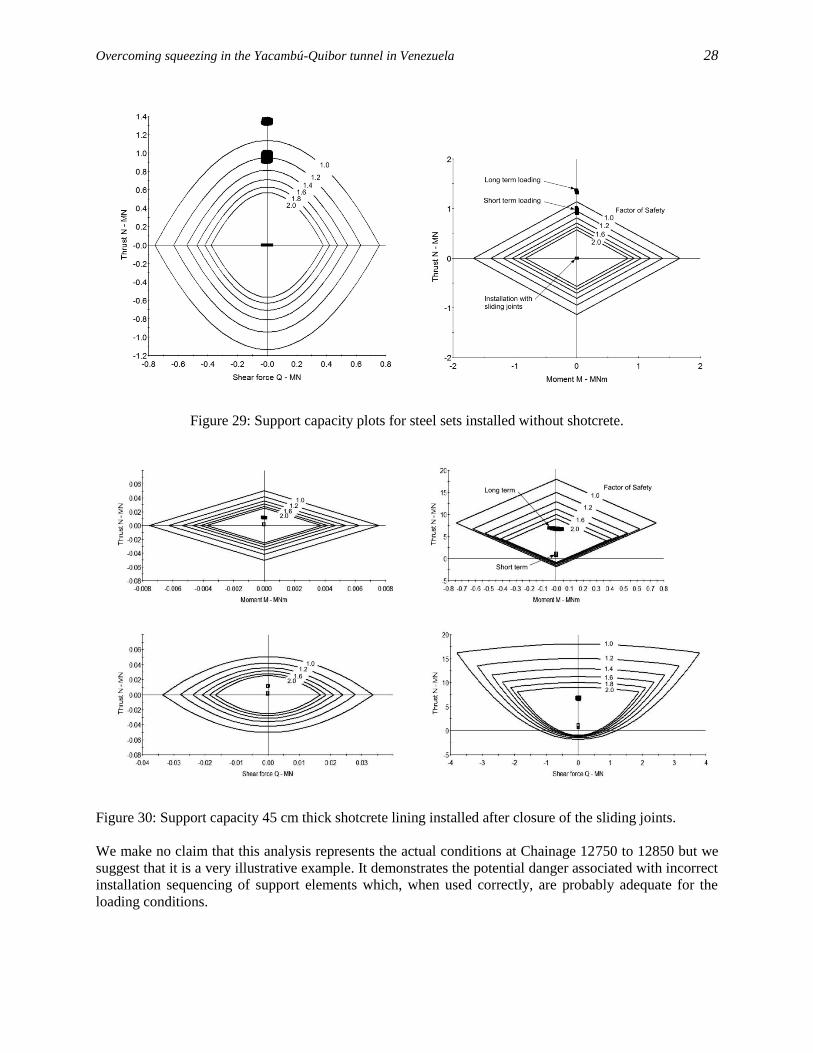
The support capacity plots for the shotcrete lining are given in Figure 30. These show that the shotcrete
carries very little load under short term conditions and that the factor of safety is approximately 2.2 for
long term loading. This is not surprising since the steel ribs carried practically all of the loading before the
shotcrete lining was installed. However, failure of the steel ribs under long term loading conditions would
result in a transfer of the load carried by the ribs onto the shotcrete lining and this would almost certainly
overload the shotcrete. In addition, buckling of the steel ribs would cause local spalling of the shotcrete
which would reduce its load carrying capacity.
Overcoming squeezing in the Yacambú-Quibor tunnel in Venezuela 28
Figure 29: Support capacity plots for steel sets installed without shotcrete.
Figure 30: Support capacity 45 cm thick shotcrete lining installed after closure of the sliding joints.
We make no claim that this analysis represents the actual conditions at Chainage 12750 to 12850 but we
suggest that it is a very illustrative example. It demonstrates the potential danger associated with incorrect
installation sequencing of support elements which, when used correctly, are probably adequate for the
loading conditions.
Overcoming squeezing in the Yacambú-Quibor tunnel in Venezuela 29
Rehabilitation at Chainage 2100
This section of the tunnel was constructed during fifth contract period (1991 to 1999) with excavation by
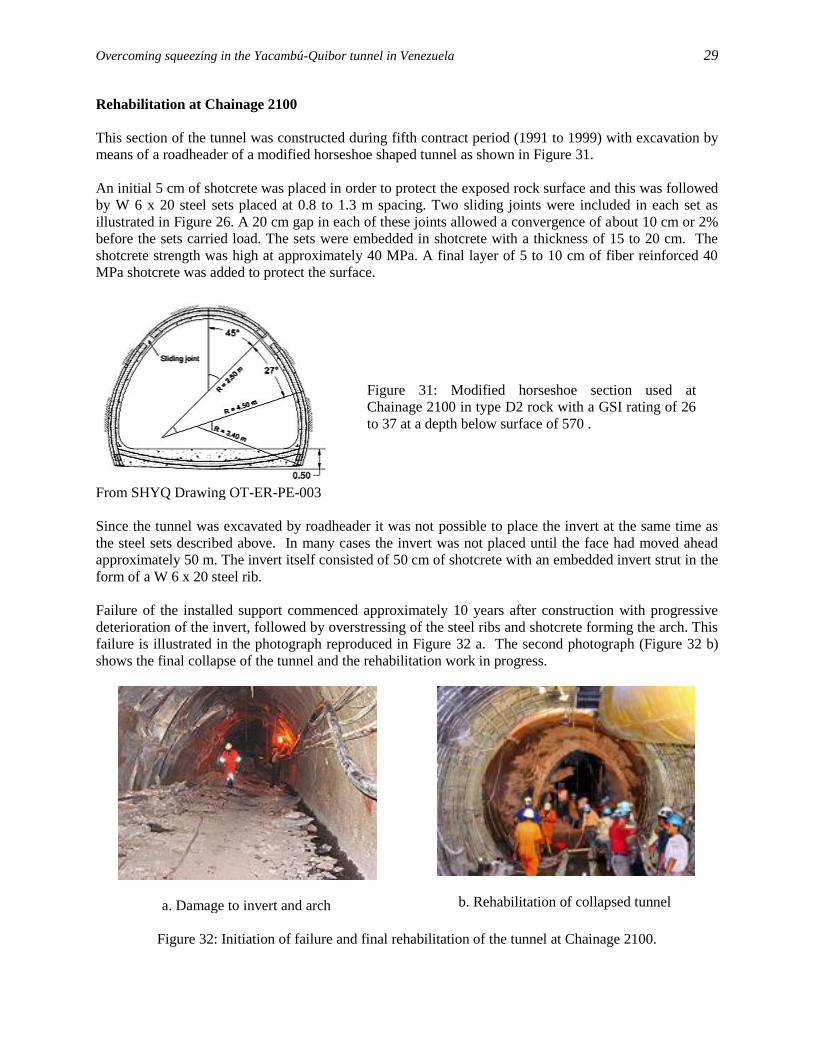
means of a roadheader of a modified horseshoe shaped tunnel as shown in Figure 31.
An initial 5 cm of shotcrete was placed in order to protect the exposed rock surface and this was followed
by W 6 x 20 steel sets placed at 0.8 to 1.3 m spacing. Two sliding joints were included in each set as
illustrated in Figure 26. A 20 cm gap in each of these joints allowed a convergence of about 10 cm or 2%
before the sets carried load. The sets were embedded in shotcrete with a thickness of 15 to 20 cm. The
shotcrete strength was high at approximately 40 MPa. A final layer of 5 to 10 cm of fiber reinforced 40
MPa shotcrete was added to protect the surface.
From SHYQ Drawing OT-ER-PE-003
Figure 31: Modified horseshoe section used at
Chainage 2100 in type D2 rock with a GSI rating of 26
to 37 at a depth below surface of 570 .
Since the tunnel was excavated by roadheader it was not possible to place the invert at the same time as
the steel sets described above. In many cases the invert was not placed until the face had moved ahead
approximately 50 m. The invert itself consisted of 50 cm of shotcrete with an embedded invert strut in the
form of a W 6 x 20 steel rib.
Failure of the installed support commenced approximately 10 years after construction with progressive
deterioration of the invert, followed by overstressing of the steel ribs and shotcrete forming the arch. This
failure is illustrated in the photograph reproduced in Figure 32 a. The second photograph (Figure 32 b)
shows the final collapse of the tunnel and the rehabilitation work in progress.
a. Damage to invert and arch
b. Rehabilitation of collapsed tunnel
Figure 32: Initiation of failure and final rehabilitation of the tunnel at Chainage 2100.
Overcoming squeezing in the Yacambú-Quibor tunnel in Venezuela 30
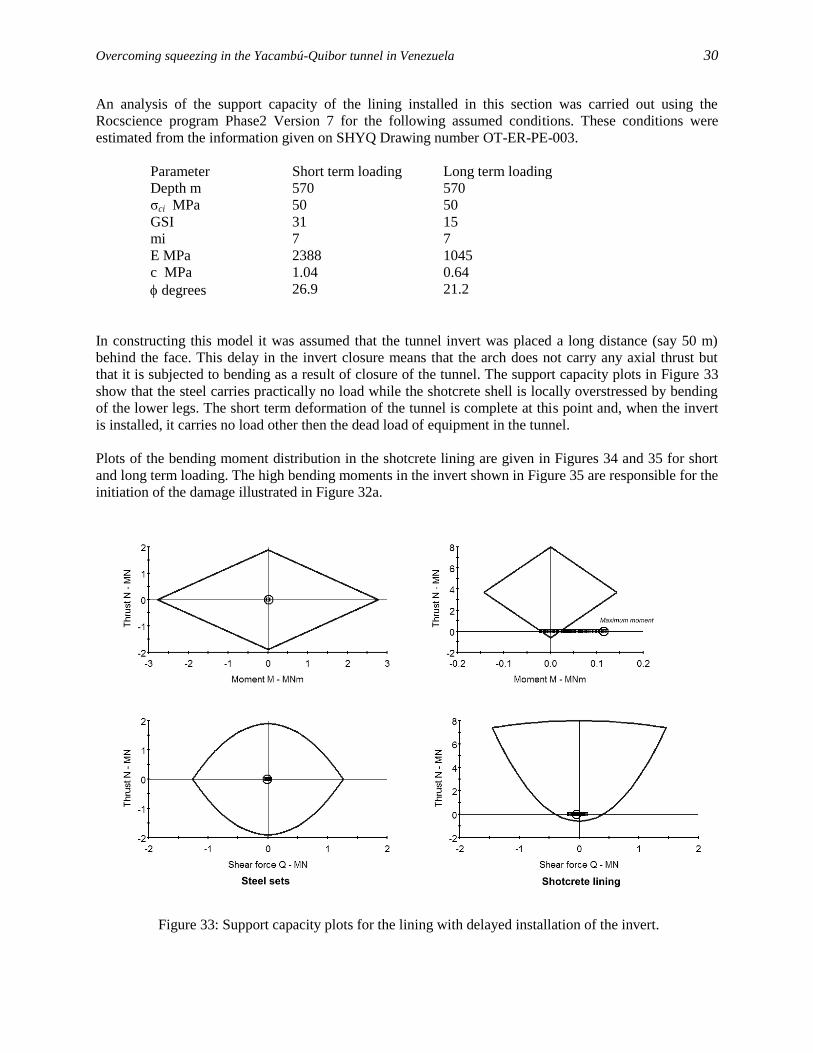
An analysis of the support capacity of the lining installed in this section was carried out using the
Rocscience program Phase2 Version 7 for the following assumed conditions. These conditions were
estimated from the information given on SHYQ Drawing number OT-ER-PE-003.
Parameter Short term loading Long term loading
Depth m 570 570
σci MPa 50 50
GSI 31 15
mi 7 7
E MPa 2388 1045
c MPa 1.04 0.64
degrees 26.9 21.2
In constructing this model it was assumed that the tunnel invert was placed a long distance (say 50 m)
behind the face. This delay in the invert closure means that the arch does not carry any axial thrust but
that it is subjected to bending as a result of closure of the tunnel. The support capacity plots in Figure 33
show that the steel carries practically no load while the shotcrete shell is locally overstressed by bending
of the lower legs. The short term deformation of the tunnel is complete at this point and, when the invert
is installed, it carries no load other then the dead load of equipment in the tunnel.
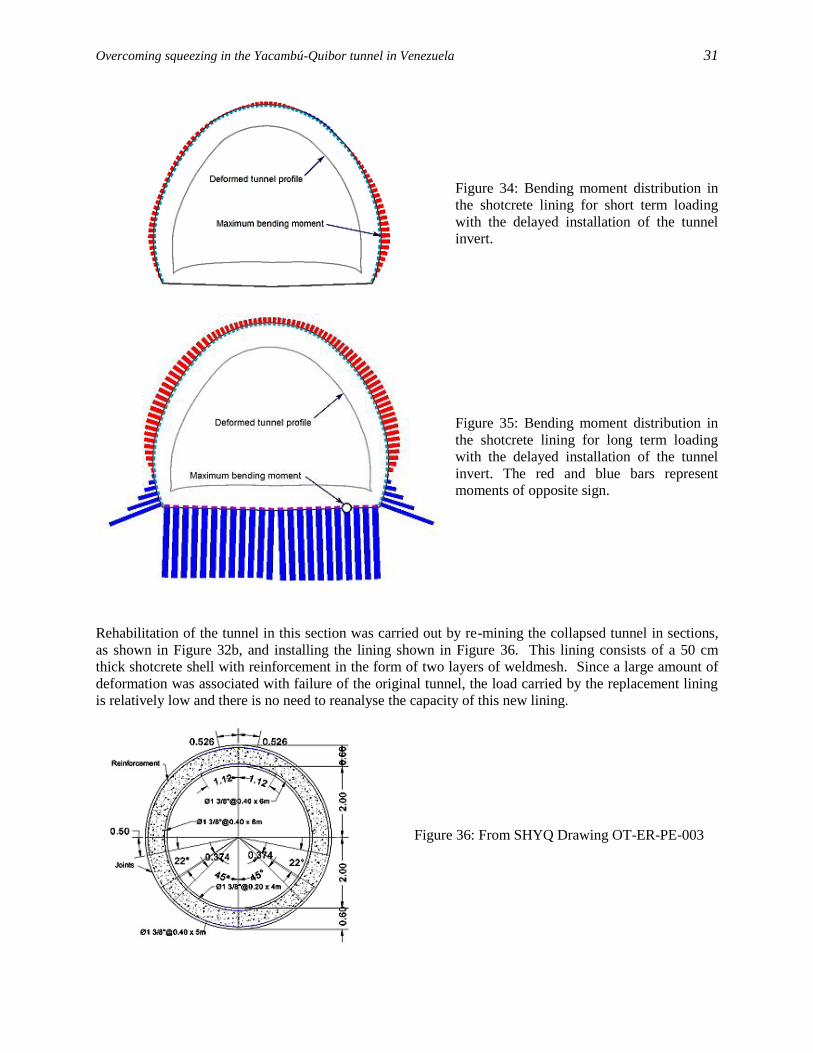
Plots of the bending moment distribution in the shotcrete lining are given in Figures 34 and 35 for short
and long term loading. The high bending moments in the invert shown in Figure 35 are responsible for the
initiation of the damage illustrated in Figure 32a.
Figure 33: Support capacity plots for the lining with delayed installation of the invert.
Overcoming squeezing in the Yacambú-Quibor tunnel in Venezuela 31
Figure 34: Bending moment distribution in
the shotcrete lining for short term loading
with the delayed installation of the tunnel
invert.
Figure 35: Bending moment distribution in
the shotcrete lining for long term loading
with the delayed installation of the tunnel
invert. The red and blue bars represent
moments of opposite sign.
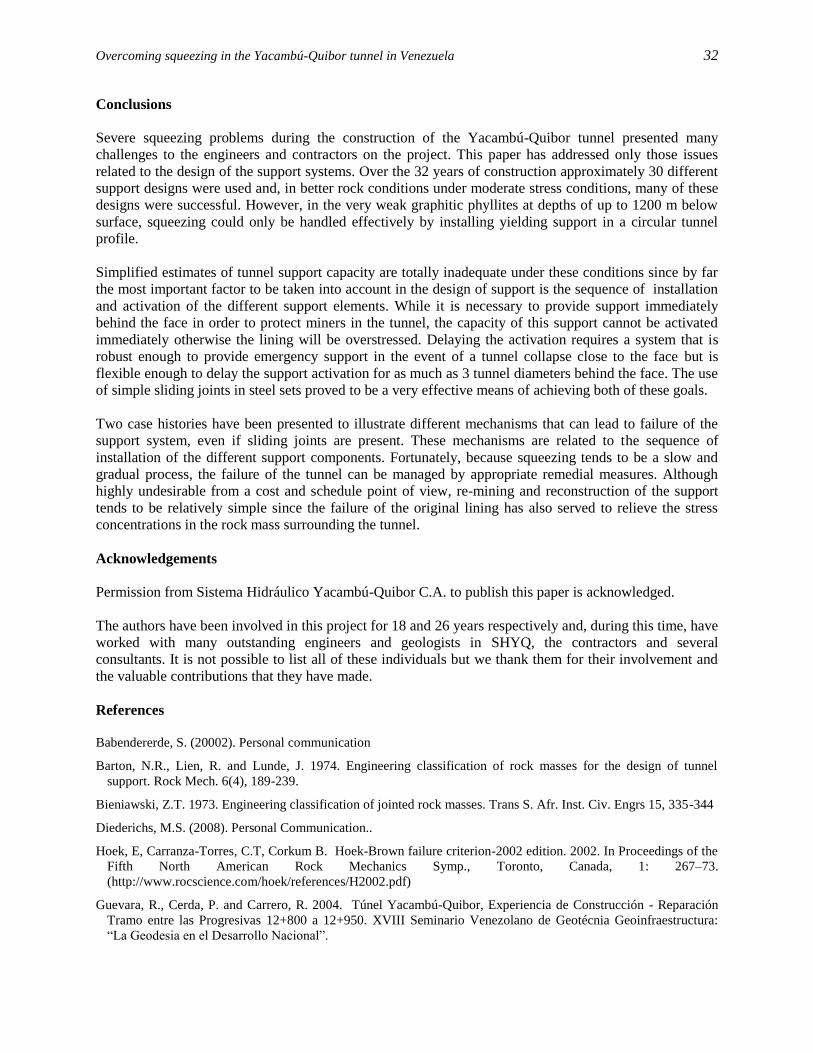
Rehabilitation of the tunnel in this section was carried out by re-mining the collapsed tunnel in sections,
as shown in Figure 32b, and installing the lining shown in Figure 36. This lining consists of a 50 cm
thick shotcrete shell with reinforcement in the form of two layers of weldmesh. Since a large amount of
deformation was associated with failure of the original tunnel, the load carried by the replacement lining
is relatively low and there is no need to reanalyse the capacity of this new lining.
Figure 36: From SHYQ Drawing OT-ER-PE-003
Overcoming squeezing in the Yacambú-Quibor tunnel in Venezuela 32
Conclusions
Severe squeezing problems during the construction of the Yacambú-Quibor tunnel presented many
challenges to the engineers and contractors on the project. This paper has addressed only those issues
related to the design of the support systems. Over the 32 years of construction approximately 30 different
support designs were used and, in better rock conditions under moderate stress conditions, many of these
designs were successful. However, in the very weak graphitic phyllites at depths of up to 1200 m below
surface, squeezing could only be handled effectively by installing yielding support in a circular tunnel
profile.
Simplified estimates of tunnel support capacity are totally inadequate under these conditions since by far
the most important factor to be taken into account in the design of support is the sequence of installation
and activation of the different support elements. While it is necessary to provide support immediately
behind the face in order to protect miners in the tunnel, the capacity of this support cannot be activated
immediately otherwise the lining will be overstressed. Delaying the activation requires a system that is
robust enough to provide emergency support in the event of a tunnel collapse close to the face but is
flexible enough to delay the support activation for as much as 3 tunnel diameters behind the face. The use
of simple sliding joints in steel sets proved to be a very effective means of achieving both of these goals.
Two case histories have been presented to illustrate different mechanisms that can lead to failure of the
support system, even if sliding joints are present. These mechanisms are related to the sequence of
installation of the different support components. Fortunately, because squeezing tends to be a slow and
gradual process, the failure of the tunnel can be managed by appropriate remedial measures. Although
highly undesirable from a cost and schedule point of view, re-mining and reconstruction of the support
tends to be relatively simple since the failure of the original lining has also served to relieve the stress
concentrations in the rock mass surrounding the tunnel.
Acknowledgements
Permission from Sistema Hidráulico Yacambú-Quibor C.A. to publish this paper is acknowledged.
The authors have been involved in this project for 18 and 26 years respectively and, during this time, have
worked with many outstanding engineers and geologists in SHYQ, the contractors and several
consultants. It is not possible to list all of these individuals but we thank them for their involvement and
the valuable contributions that they have made.
References
Babendererde, S. (20002). Personal communication
Barton, N.R., Lien, R. and Lunde, J. 1974. Engineering classification of rock masses for the design of tunnel
support. Rock Mech. 6(4), 189-239.
Bieniawski, Z.T. 1973. Engineering classification of jointed rock masses. Trans S. Afr. Inst. Civ. Engrs 15, 335-344
Diederichs, M.S. (2008). Personal Communication..
Hoek, E, Carranza-Torres, C.T, Corkum B. Hoek-Brown failure criterion-2002 edition. 2002. In Proceedings of the
Fifth North American Rock Mechanics Symp., Toronto, Canada, 1: 267–73.
(http://www.rocscience.com/hoek/references/H2002.pdf)
Guevara, R., Cerda, P. and Carrero, R. 2004. Túnel Yacambú-Quibor, Experiencia de Construcción - Reparación
Tramo entre las Progresivas 12+800 a 12+950. XVIII Seminario Venezolano de Geotécnia Geoinfraestructura:
“La Geodesia en el Desarrollo Nacional”.

Overcoming squeezing in the Yacambú-Quibor tunnel in Venezuela 33
Hoek, E. and Brown, E.T. 1997. Practical estimates or rock mass strength. Intnl. J. Rock Mech. & Mining Sci. &
Geomechanics Abstracts. 34 (8), 1165-1186. (http://www.rocscience.com/hoek/references/H1997.pdf)
Hoek, E, Marinos, P and Benissi, M. 1998. Applicability of the Geological Strength Index (GSI) classification for
very weak and sheared rock masses. The case of the Athens Schist Formation. Bull. Engg. Geol. Env. 57(2), 151-
160.
Hoek, E. and Marinos, P. 2000. Predicting Tunnel Squeezing. Tunnels and Tunnelling International. Part 1 –
November 2000, Part 2 – December, 2000. (http://www.rocscience.com/hoek/references/H1998d.pdf
Hoek, E, Carranza-Torres, C.T, Diederichs, M.S. and Corkum, B. 2008. Integration of geotechnical and structural
design in tunnelling. Proceedings University of Minnesota 56th Annual Geotechnical Engineering Conference1.
Minneapolis, 29 February 2008, 1-53. (http://www.rocscience.com/hoek/references/H2008.pdf)
Kaiser, P.K., Maloney, S. and Morgenstern, N.R. 1982. Time-dependent behaviour of tunnels in highly stressed
rock. Proc. 5th ISRM Congress of Rock Mechanics. Australia. D329-336.
Marinos, P and Hoek, E. 2000 GSI – A geologically friendly tool for rock mass strength estimation. Proc.
GeoEng2000 Conference, Melbourne. 1422-1442. (http://www.rocscience.com/hoek/references/H2000a.pdf)
Matheson, B (2002). Concrete know-how in Venezuela. Tunnels and Tunnelling International, July 2002.
Proctor, R.V. and White, T.L. (1946). Rock tunnelling with steel supports. Youngston, Ohio: Commercial Shearing
and Stamping Co.
Rabcewicz, L.V. (1964) The New Austrian Tunneling Method, Water Power, Part I, November 1964; Part II,
December 1964, 511-515; Part III, January 1965, 19-24.
Sánchez Fernándes, J.L., and Terán Benítez, C.E. (1994). “Túnel de Trasvase Yacambú-Quibor. Avance actual de
los trabajos de excavación mediante la utilización de soportes flexibles aplicados a rocas con grandes
deformaciones”. Integral approach to applied rock mechanics, M. van Sint Jan, ed. Editec, Santiago, 1, 489-497.
Salcedo D.A. Macizos Rocosos: Caracterización, Resistencia al Corte y Mecanismos de Rotura. Proc. 25
Aniversario Conferencia Soc. Venezolana de Mecánica del Suelo e Ingeniería de Fundaciones, Caracas. 143-172
(1983).
Trenkamp, R., Kellogg, J.N., Freymueller, J.T., Mora, H.P. (2002). Wide plate margin deformation, Southern
Central America and northwestern South America, CASA GPS observations. J. South Am. Earth Sci. 15, 157–
171.
Vlachopoulos, N. and Diederichs, M.S. 2009. Improved linear tunnel displacement profiles for convergence
confinement analysis. Submitted to Rock Mechanics and Rock Engineering.
Wittke, W. 2000 Stability analysis for tunnels. Verlag Glückauf GmbH: Essen