non-parametric deprojection of nika sz observations ...orca.cf.ac.uk/104413/1/aa29405-16.pdf ·...
TRANSCRIPT

A&A 597, A110 (2017)DOI: 10.1051/0004-6361/201629405c© ESO 2017
Astronomy&Astrophysics
Non-parametric deprojection of NIKA SZ observations: Pressuredistribution in the Planck -discovered cluster PSZ1 G045.85+57.71
F. Ruppin1, R. Adam1, 2, B. Comis1, P. Ade3, P. André4, M. Arnaud4, A. Beelen5, A. Benoît6, A. Bideaud6, N. Billot7,O. Bourrion1, M. Calvo6, A. Catalano1, G. Coiffard8, A. D’Addabbo6, 9, M. De Petris9, F.-X. Désert10, S. Doyle3,J. Goupy6, C. Kramer7, S. Leclercq8, J. F. Macías-Pérez1, P. Mauskopf3, 11, F. Mayet1, A. Monfardini6, F. Pajot5,E. Pascale3, L. Perotto1, G. Pisano3, E. Pointecouteau12, 13, N. Ponthieu10, G. W. Pratt4, V. Revéret4, A. Ritacco1,
L. Rodriguez4, C. Romero8, K. Schuster8, A. Sievers7, S. Triqueneaux6, C. Tucker3, and R. Zylka8
1 Laboratoire de Physique Subatomique et de Cosmologie, Université Grenoble Alpes, CNRS/IN2P3, 53 avenue des Martyrs,Grenoble, Francee-mail: [email protected]
2 Laboratoire Lagrange, Université Côte d’Azur, Observatoire de la Côte d’Azur, CNRS, Bd de l’Observatoire, CS 34229,06304 Nice Cedex 4, France
3 Astronomy Instrumentation Group, University of Cardiff, UK4 Laboratoire AIM, CEA/IRFU, CNRS/INSU, Université Paris Diderot, CEA-Saclay, 91191 Gif-Sur-Yvette, France5 Institut d’Astrophysique Spatiale (IAS), CNRS and Université Paris Sud, Orsay, France6 Institut Néel, CNRS and Université Grenoble Alpes, France7 Institut de RadioAstronomie Millimétrique (IRAM), Granada, Spain8 Institut de RadioAstronomie Millimétrique (IRAM), Grenoble, France9 Dipartimento di Fisica, Sapienza Università di Roma, Piazzale Aldo Moro 5, 00185 Roma, Italy
10 Institut de Planétologie et d’Astrophysique de Grenoble (IPAG), CNRS and Université Grenoble Alpes, France11 School of Earth and Space Exploration and Department of Physics, Arizona State University, Tempe, AZ 85287, USA12 Université de Toulouse, UPS-OMP, Institut de Recherche en Astrophysique et Planétologie (IRAP), 31028 Toulouse, France13 CNRS, IRAP, 9 avenue Colonel Roche, BP 44346, 31028 Toulouse Cedex 4, France
Received 26 July 2016 / Accepted 10 September 2016
ABSTRACT
The determination of the thermodynamic properties of clusters of galaxies at intermediate and high redshift can bring new insightsinto the formation of large-scale structures. It is essential for a robust calibration of the mass-observable scaling relations and theirscatter, which are key ingredients for precise cosmology using cluster statistics. Here we illustrate an application of high resolution(<20 arcsec) thermal Sunyaev-Zel’dovich (tSZ) observations by probing the intracluster medium (ICM) of the Planck-discoveredgalaxy cluster PSZ1 G045.85+57.71 at redshift z = 0.61, using tSZ data obtained with the NIKA camera, which is a dual-band(150 and 260 GHz) instrument operated at the IRAM 30-m telescope. We deproject jointly NIKA and Planck data to extract theelectronic pressure distribution from the cluster core (R ∼ 0.02 R500) to its outskirts (R ∼ 3 R500) non-parametrically for the first timeat intermediate redshift. The constraints on the resulting pressure profile allow us to reduce the relative uncertainty on the integratedCompton parameter by a factor of two compared to the Planck value. Combining the tSZ data and the deprojected electronic densityprofile from XMM-Newton allows us to undertake a hydrostatic mass analysis, for which we study the impact of a spherical modelassumption on the total mass estimate. We also investigate the radial temperature and entropy distributions. These data indicate thatPSZ1 G045.85+57.71 is a massive (M500 ∼ 5.5 × 10¹⁴ M) cool-core cluster. This work is part of a pilot study aiming at optimizingthe treatment of the NIKA2 tSZ large program dedicated to the follow-up of SZ-discovered clusters at intermediate and high redshifts.This study illustrates the potential of NIKA2 to put constraints on the thermodynamic properties and tSZ-scaling relations of theseclusters, and demonstrates the excellent synergy between tSZ and X-ray observations of similar angular resolution.
Key words. galaxies: clusters: intracluster medium – instrumentation: high angular resolution – cosmology: observations
1. Introduction
Galaxy clusters are the ultimate manifestation of the hierar-chical structure formation process in the standard cosmolog-ical model, and as such, they are sensitive to both the mat-ter content and expansion history of the Universe in whichthey form. Clusters are thus potentially powerful tools to in-fer cosmological parameters. In particular, counting clusters asa function of their mass and redshift (e.g., Sehgal et al. 2011;Planck Collaboration XXIV 2016; de Haan et al. 2016) brings
constraints on the cosmological parameters that are complemen-tary to those derived with other probes such as type Ia super-novae (e.g., Riess et al. 2007), the CMB temperature and polar-ization angular power spectra (e.g., Planck Collaboration XIII2016), or baryonic acoustic oscillations (e.g., Anderson et al.2014).
About 85% of the total mass in galaxy clusters is from darkmatter. The principal baryonic component is found in the hot,ionized, X-ray emitting gas of the intracluster medium (ICM),containing about 12% of the total mass. The remaining baryonic
Article published by EDP Sciences A110, page 1 of 16
A&A 597, A110 (2017)
mass is found in the stellar population. Cluster masses can beinferred from several independent observables. The velocity dis-persion of the galaxies (e.g., Biviano et al. 2006; Sifón et al.2016), various X-ray properties such as temperature or lumi-nosity (e.g., Vikhlinin et al. 2006; Pratt et al. 2009), or the lens-ing distortions of background galaxies (e.g., Applegate et al.2014; Umetsu et al. 2014; Hoekstra et al. 2015) can be re-lated to the underlying total mass. Another observational probeof interest is the thermal Sunyaev-Zel’dovich effect (tSZ;Sunyaev & Zeldovich 1972), which is due to the inverse Comp-ton scattering of cosmic microwave background (CMB) photonswith high-energy electrons of the ICM. As this effect is directlyproportional to the thermal energy contained in the ICM, it isexpected to provide a low scatter mass proxy for galaxy clus-ters (e.g., da Silva et al. 2004; Nagai et al. 2007a). Furthermore,as the tSZ effect is a CMB spectral distortion, it does not suf-fer from cosmological dimming. This observable is therefore apowerful probe to estimate both galaxy cluster total mass andbaryonic content distribution up to high redshift.
The Planck satellite, the South Pole Telescope (SPT), and theAtacama Cosmology Telescope (ACT) surveys have used tSZobservations to discover and characterize large galaxy clustersamples (e.g., Planck Collaboration XXVII 2016; Bleem et al.2015; Hasselfield et al. 2013). In addition, individual observa-tions of known clusters have been obtained with a numberof instruments, such as APEX-SZ, CARMA, SZA, BOLO-CAM, and AMIs (e.g., Schwan et al. 2011; Plagge et al. 2013;Muchovej et al. 2007; Sayers et al. 2012; Perrott et al. 2015).However, their relatively low angular resolution (>1 arcmin)restricts the tSZ characterization of the ICM to low red-shift (Plagge et al. 2010; Basu et al. 2010; Bonamente et al.2012; Planck Collaboration Int. V 2013; Sayers et al. 2013), asa combination with higher resolution X-ray observations isneeded to map clusters at both large and small scales (e.g.,Planck Collaboration Int. V 2013; Eckert et al. 2013).
In combination with local data, high angular resolutiontSZ observations at intermediate to high-redshift (z > 0.5) havea number of different applications. They can be used to study theevolution of structural properties such as cluster pressure pro-files and their scatter. Furthermore, they provide new insightsand constraints on scaling properties such as the relation be-tween the integrated Compton parameter and the cluster totalmass and its scatter. High angular resolution tSZ observationscan also be used to characterize the two-dimensional (2D) pres-sure distribution within the ICM. This information is essentialfor understanding cluster formation physics and performing pre-cise cosmological analysis with the cluster population.
Cluster growth and evolution is characterized by complexastrophysical phenomena, including deviation from equilibriumand generation of turbulence due to merging events and feed-back from active galactic nuclei. While stochastic, the frequencyof these events evolves with time and increases at high red-shift. They are the prime cause of scatter and deviations fromself-similarity in the scaling relations that are used to link ob-servables to mass in cosmological analyses (e.g., Yu et al. 2015;Sembolini et al. 2014). Of particular importance is the clarifica-tion of the physical origin of this normalization and scatter in thescaling relations, rendering the use of galaxy clusters for cosmo-logical application more robust.
The New IRAM KIDs Array (NIKA; Monfardini et al. 2011;Bourrion et al. 2012; Calvo et al. 2013) was a dual-band contin-uum camera operated at the Institut de Radio Astronomie Mil-limetrique (IRAM) 30 m telescope between 2010 and 2015. Itwas one of the very few tSZ instruments with sub-arcminute
resolution. Other examples include the Goddard-IRAM Super-conducting 2-mm Observer (GISMO; Staguhn et al. 2008) andthe Multiplexed SQUID TES array at Ninety Gigahertz (MUS-TANG; Korngut et al. 2011). NIKA was the only dual-band sub-arcminute instrument (Catalano et al. 2014) that observed thetSZ effect simultaneously at 150 and 260 GHz with an angularresolution of 18.2 and 12.0 arcsec, respectively. Furthering thecharacterization of galaxy cluster pressure profiles that has beeninitiated by arcminute resolution instruments at low redshift,NIKA has now mapped the pressure distribution in a number ofgalaxy clusters at intermediate and high redshift (see Adam et al.2014, 2015, 2016, 2017).
In this paper we detail the NIKA observations of the Planck-discovered cluster PSZ1 G045.85+57.71 at z = 0.61. A key re-sult is the first non-parametric measurement with high statisticalprecision of the pressure profile of a distant cluster at an an-gular resolution ∼20 arcsec, extending to much higher redshiftpioneering non-parametric pressure profile measurements at lowresolution (Basu et al. 2010). Basu et al. 2010 have applied thedeprojection method presented in Nord et al. 2009 to the APEX-SZ data (Halverson et al. 2009) of the nearby cluster Abell 2204(z = 0.15). They have shown that a non-parametric modeling ofthe gas pressure profile can be obtained. Previous works haveshown that deprojection methods can be used to probe the ICMof clusters from simulations (Puchwein et al. 2008; Lee & Suto2004; Ameglio et al. 2007).
The work presented in this paper is a pilot study for the forth-coming SZ observations (see Comis et al. 2016) with NIKA2(see Catalano et al. 2016). The combination with Planck data al-lows the determination of the non-parametric pressure profile outto scales of ∼>3 Mpc, substantially improving the constraints onthe spherically integrated Compton parameter. Using the depro-jected gas density profile from XMM-Newton, we reconstruct thethermodynamic properties of the ICM without making use ofX-ray spectroscopic information. This result illustrates the ex-cellent synergy between tSZ and X-ray observations of similarangular resolution, and serves as a pilot study for combining tSZdata to measure the gas pressure with short X-ray observationsto measure the gas density.
This paper is organized as follows. The NIKA observa-tions of PSZ1 G045.85+57.71 at the IRAM 30-m telescope andthe raw data processing are explained in Sect. 2. Ancillarydata, previous tSZ observations, point source contamination, andXMM-Newton data reduction, are described in Sect. 3. The mod-elization of the ICM and the method to estimate the cluster totalmass are presented in Sect. 4. We also discuss the characteri-zation of the cluster ellipticity and its impact on the mass esti-mation. In Sect. 5 a non-parametric multiprobe analysis is per-formed to extract the radial pressure profile and obtain the ICMthermodynamic properties. The conclusions and NIKA2 per-spectives are discussed in Sect. 6. Throughout this study we as-sume a flat ΛCDM cosmology following the latest Planck results(Planck Collaboration XIII 2016): H0 = 67.8 km s−1 Mpc−1,Ωm = 0.308, and ΩΛ = 0.692. Within this framework, at thecluster redshift, one arcsec corresponds to 6.93 kpc.
2. Observation at the IRAM 30-m telescopewith NIKA
We present in this section the NIKA observations of thePSZ1 G045.85+57.71 cluster, performed in October 2014,which have been used to produce the tSZ surface brightnessmaps at 150 GHz and 260 GHz. To begin with, we describe thekey elements of the thermal SZ effect.
A110, page 2 of 16
F. Ruppin et al.: Non parametric deprojection of NIKA SZ observations
2.1. The thermal Sunyaev-Zel’dovich effect
The thermal Sunyaev-Zel’dovich effect corresponds to theCompton scattering of CMB photons on high-energy ICM elec-trons. The scattering equation describing this interaction wasderived by Kompaneets (1956) in the case where the radiationtemperature is negligible compared to the plasma temperature.Using this equation, Sunyaev & Zeldovich (1972, 1980) com-puted the induced variation of the spectral radiance compared tothe CMB variation as follows:
∆ItSZ
I0= y f (ν,Te), (1)
where y is the Compton parameter that describes the amplitudeof the spectral distortion, f (ν,Te) gives the frequency depen-dence of the tSZ spectrum, and Te is the ICM electronic tem-perature. The Compton parameter is related to the line-of-sightintegral of the electronic pressure Pe,
y =σT
mec2
∫Pe dl, (2)
where me is the electron mass, c the speed of light, and σT theThomson scattering cross section. The integrated Compton pa-rameter Ytot is then computed via the aperture photometry per-formed on the Compton parameter map1.
The frequency dependence of the tSZ spectrum is given bythe expression (Birkinshaw 1999; Carlstrom et al. 2002)
f (x,Te) =x4ex
(ex − 1)2
(x coth
( x2
)− 4
)(1 + δtSZ(x,Te)), (3)
with x =hν
kBTCMB,
where h and kB are the Planck and Boltzmann constants, re-spectively, and δtSZ(x,Te) corresponds to the relativistic correc-tion, which is non-negligible for plasma temperatures larger than10 keV (Itoh et al. 1998). We thus notice that the spectral defor-mation induced by the tSZ effect is completely characterized bythe f function and does not depend on the plasma temperatureif relativistic corrections are negligible. In this case, f is posi-tive (negative) for frequencies higher (lower) than 217 GHz. Wetherefore expect a negative signal on the 150 GHz NIKA mapand a positive signal at 260 GHz.
2.2. Observing conditions, scanning strategy, calibration,and data reduction
PSZ1 G045.85+57.71 was observed by the NIKA camera simul-taneously at 150 GHz and 260 GHz during the second NIKAopen pool in November 2014. In this section we present theobservation conditions, scanning strategy, calibration procedure,and data reduction method.
The pointing center was chosen to be at (RA, Dec2000) = (15:18:20.8, +29:27:36.75) following the Planck andXMM-Newton observations. All the coordinates in this paper aregiven in the equinox 2000 system. The mean zenith opacitieswere measured to be 0.21 and 0.27 at 150 and 260 GHz, respec-tively, and the atmosphere was particularly unstable because ofthe presence of wind, which induces an increased residual noiseon the final map (see Catalano et al. 2014, for details on the
1 This definition gives the cylindrical Compton parameter of the clusterup to 5 R500.
Table 1. Instrumental characteristics of NIKA at the IRAM 30-m tele-scope in November 2014.
Observing band 150 GHz 260 GHzGaussian beam model FWHM (arcsec) 18.2 12.0
Field of view (arcmin) 1.9 1.8Effective number of detectors 113 156Sensitivity (mJy/beam s1/2) 12 61
Conversion factor y-Jy/beam −11.1 ± 1.0 3.4 ± 0.4Pointing errors (arcsec) <3 <3Calibration uncertainties 9% 11%
opacity measurement procedure with NIKA). The mean eleva-tion of the source was 49 degrees. The effective number of validdetectors was 113 at 150 GHz and 156 at 260 GHz for a field ofview of 1.9 and 1.8 arcmin, respectively.
The cluster was mapped using on-the-fly raster scans madeby a succession of 19 subscans of 6 arcmin length at constantazimuth or elevation with 10 arcsec steps between subscans. Af-ter discarding data affected by high atmospheric instabilities, theoverall effective observing time on the cluster is 4.35 h.
We used Uranus as a primary calibrator and the Morenomodel (Moreno 2010) to estimate its brightness temperaturefrequency dependence (see Adam et al. 2014; Adam 2015; andCatalano et al. 2014, for details on the calibration procedure).The primary beam was modeled by a Gaussian function witha full width at half maximum (FWHM) that has been mea-sured to be 18.2 and 12.0 arcsec at 150 and 260 GHz, re-spectively. Using the dispersion of the measured Uranus fluxesand the uncertainty on the Moreno model (accurate to 5%; seePlanck Collaboration VIII 2014), the overall calibration uncer-tainty is estimated to be 9 and 11% at 150 and 260 GHz, re-spectively. We estimated the conversion factors from the mea-sured surface brightness to the Compton parameter taking theNIKA bandpass measurements into account. We found the com-puted values to be −11.1 ± 1.0 and 3.4 ± 0.4 Jy/beam per unitof Compton parameter accounting for calibration uncertaintiesat 150 and 260 GHz, respectively. The main instrumental char-acteristics of the NIKA camera during the second open pool aresummarized in Table 1.
We follow the raw data reduction method detailed in(Adam et al. 2015). The main steps of the procedure are brieflysummarized here. The selection of valid detectors is basedon their noise properties and optical responses. We removedglitches in the timelines due to impacts of cosmic rays prior tothe analysis. We suppressed fluctuations associated with cryo-genic vibrations in the Fourier domain. We removed the at-mospheric and electronic correlated noise by subtracting thecommon-mode templates estimated by averaging the timelinesfor each array. We flagged the cluster using the signal-to-noiseratio (S/N) map estimation in an iterative way to avoid ring-ing and reduce the signal filtering. We estimated the resultingtransfer function of the data processing using simulations andthis function is fairly constant with a filtering of ∼5% at scalessmaller than the NIKA field of view but larger than the beamsize. The filtering increases rapidly for larger scales (see Fig. 3in Adam et al. 2015, as a typical example of the transfer func-tion for this analysis). For each scan, the processed time orderinformation is projected on a pixelized grid for the two NIKAfrequencies. The computed scans are eventually coadded using
A110, page 3 of 16
A&A 597, A110 (2017)
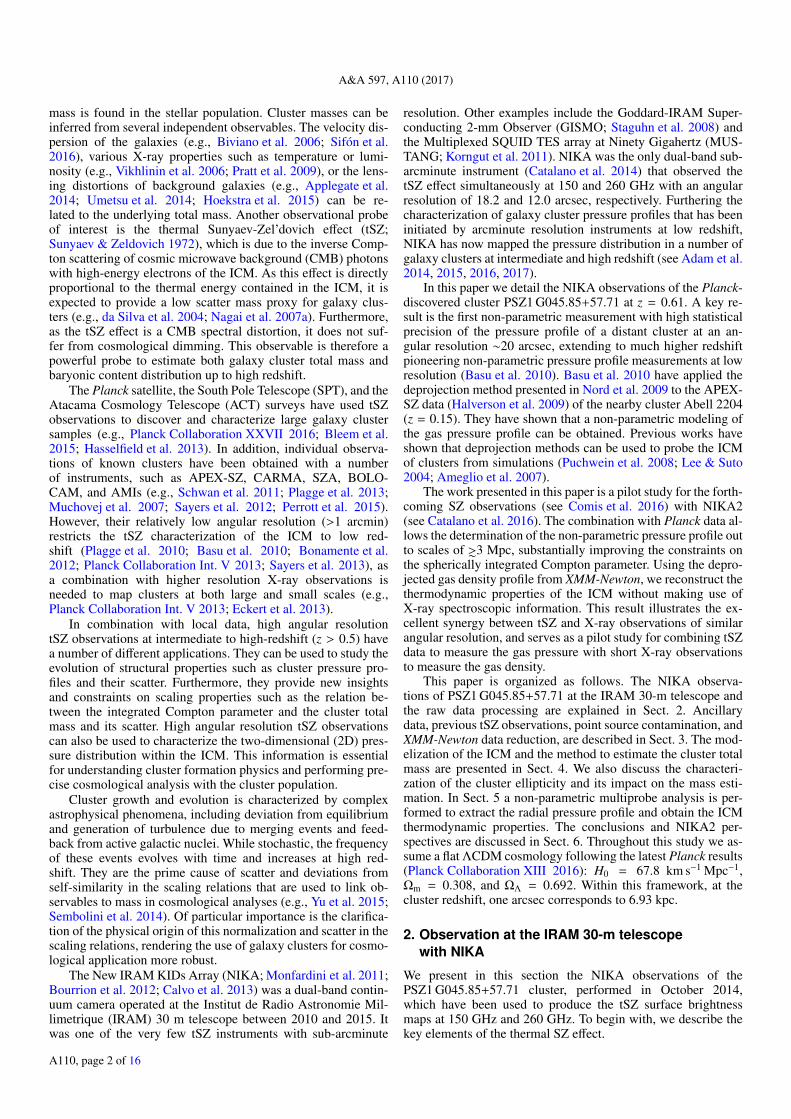
Fig. 1. NIKA tSZ surface brightness maps at 150 GHz (left) and 260 GHz (right). The significance of the measured signal is given by the blackcontours starting at 3σ with 1σ spacing. The maps are smoothed with an additional 10 arcsec Gaussian filter for display purposes and the NIKAbeam FWHMs are represented as white disks in the bottom left-hand corner of the maps. The white crosses indicate the X-ray center. Note thatwe use the original maps (without additional smoothing) in the following analysis.
Planck Compton parameter
15h19m30s 00s 18m30s 18m00s 17m30s 17m00s
29 40’00”
30’00”
20’00”
Right Ascension (J2000) [hr]
Dec
linat
ion
(J20
00)
[deg
ree]
−7.5
−5.0
−2.5
0.0
2.5
5.0
7.5
10.0
12.5
y×
10−6
XMM-Newton X-ray photon count
15h18m30s 25s 20s 15s
29 29’00”
28’00”
27’00”
26’00”
Right Ascension (J2000) [hr]
Dec
linat
ion
(J20
00)
[deg
ree]
0
5
10
15
20
25
30
35
40
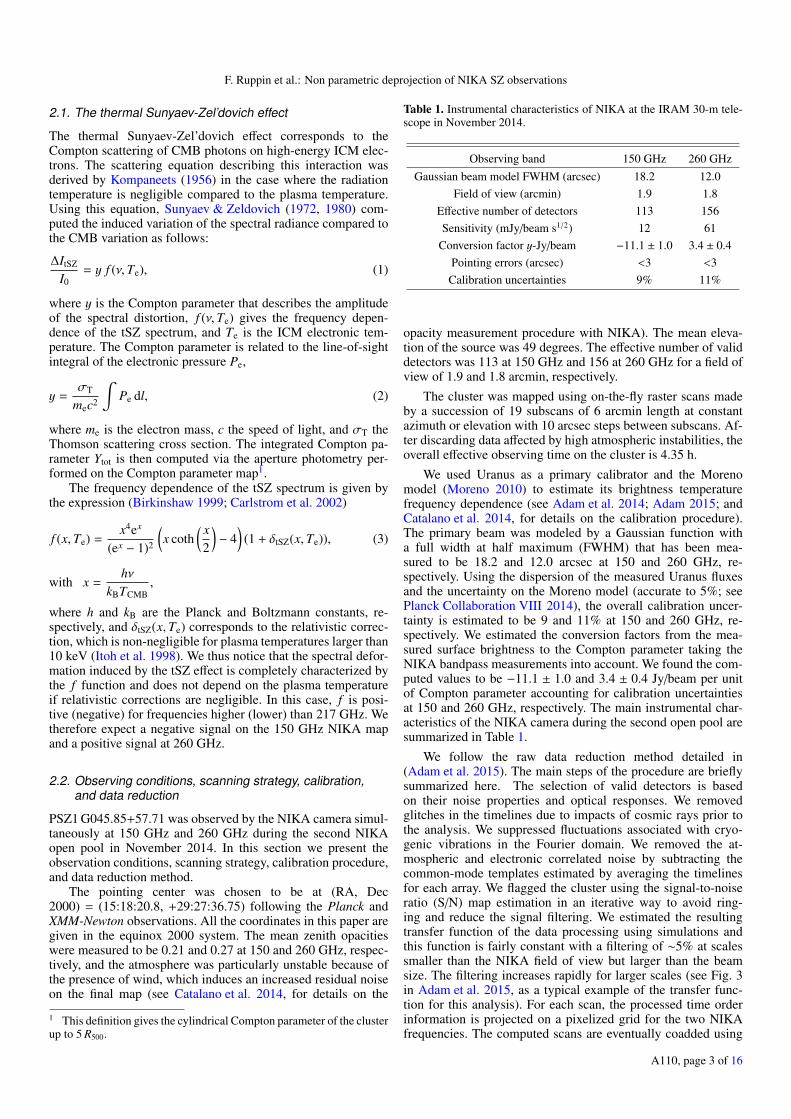
Fig. 2. Left: Planck MILCA Compton pa-rameter map of PSZ1 G045.85+57.71 obtainedby extracting a patch of the Planck full skyy-map (Planck Collaboration XXII 2016). TheXMM-Newton X-ray contours are overlaid inblack to show the effect of the Planck beamdilution on the cluster inner structure. Right:XMM-Newton X-ray photon count map ofPSZ1 G045.85+57.71 smoothed with an ad-ditional 4 arcsec Gaussian filter for displaypurposes.
Table 2. Location and flux of the radio sources observed in the 4.4 × 4.4 arcmin2 field around PSZ1 G045.85+57.71.
Source Identifier Position 1.4 GHz Reference[mJy]
RS1 FIRST J151819.5+292712 15h18m19.5s +29d27m13s 1.71 ± 0.14 FIRST, Becker et al. (1995)RS2 FIRST J151822.4+292917 15h18m22.5s +29d29m18s 2.9 ± 0.5 FIRST, Becker et al. (1995)
inverse variance weighting to obtain the final maps shown inFig. 1.
2.3. NIKA observations
The NIKA tSZ surface brightness maps of PSZ1 G045.85+57.71at 150 and 260 GHz are shown in Fig. 1. The NIKA mapsare centered on the X-ray peak coordinates denoted as a whitecross and were smoothed with a 10 arcsec Gaussian filter fordisplay purposes. We observe a strong tSZ decrement on the150 GHz map, which reaches a 7σ significance at the surfacebrightness peak (−1.9 mJy/beam). The observed galaxy clusterexhibits an elliptical morphology with a major axis going fromthe southwest to the northeast of the center and does not indi-cate the presence of ICM substructure. Furthermore, the max-imum tSZ decrement is aligned with the X-ray peak and thusdoes not indicate that PSZ1 G045.85+57.71 has a disturbed core.
As expected, there is no significant tSZ signal on the 260 GHzmap. Indeed, we can estimate the expected tSZ surface bright-ness peak at 260 GHz knowing the tSZ surface brightness at150 GHz and the tSZ spectrum analytic expression (Eq. (3)). Theestimated value of ∼1 mJy/beam is below the standard deviationof the residual noise in the NIKA 260 GHz map. Furthermore,the 260 GHz map does not present any significant submillime-ter point source contamination given the root mean square (rms)noise on this map.
The residual noise on the map has to be characterized to esti-mate the significance contours of the measured signal at bothNIKA frequencies. Furthermore, the noise covariance matrixCNIKA at 150 GHz has to be estimated to be used for the ICMcharacterization.
Following the procedure described in (Adam et al. 2016), weuse null-map realizations at 150 and 260 GHz to estimate thebest-fit noise power spectrum models at both NIKA frequencies.
A110, page 4 of 16

F. Ruppin et al.: Non parametric deprojection of NIKA SZ observations
The estimated residual noise power spectrum models, togetherwith the integration time per pixel at 150 and 260 GHz, enablethe simulation of Monte Carlo realizations of noise maps thatare used to estimate the S/N on the final maps (see Fig. 1) and tocompute the noise covariance matrix at 150 GHz.
3. PSZ1 G045.85+57.71 ancillary data
This section presents the ancillary data obtained from previousobservations of PSZ1 G045.85+57.71. These data are used inthe following multiprobe ICM characterization and give com-plementary information on the dynamical state of this cluster.
3.1. Previous SZ observations of PSZ1 G045.85+57.71
PSZ1 G045.85+57.71 has been identified by Planck witha S/N of 5.06. It is a member of the early PlanckSZ catalog (Planck Collaboration XXIX 2014) and its de-tection has been confirmed in the second catalog release(Planck Collaboration XXVII 2016). The Planck tSZ mapof PSZ1 G045.85+57.71 is shown in the left panel ofFig. 2. It has been obtained by extracting a patch ofthe Planck full sky y-map using a Gnomonic projection(Planck Collaboration XXII 2016). The patch used in the ICManalysis is centered on the cluster coordinates and is 1.7 de-gree wide. Its integrated Compton parameter estimated at R500is given in the Planck catalog by Y500 = 8.21+1.73
−1.70 × 10⁻⁴ arcmin2
(Planck Collaboration XXXII 2015)2. The corresponding cylin-drical integrated Compton parameter at 5 R500 is given bymultiplying this value by 1.79, when assuming the uni-versal pressure profile of Arnaud et al. (2010). This estima-tion has been compared with the integrated Compton pa-rameter found by aperture photometry on the Planck y-map,Y5R500 = 1.28 ± 0.57 × 10⁻³ arcmin2. The error on the estimatedvalue was computed by performing the same aperture photome-try measurement on the Planck map randomly around the clus-ter, where the noise is homogeneous. The estimate of the clusterintegrated Compton parameter computed by aperture photom-etry on the map is therefore compatible with that given in thePlanck catalog (Planck Collaboration XXXII 2015). The Planckestimated hydrostatic mass assuming the best-fit Y-M scaling re-lation of (Arnaud et al. 2010) as a prior was found to be M500 =7.936+0.894
−0.962 × 10¹⁴ M (Planck Collaboration XXXII 2015). Theuncertainties on this cluster mass estimation does not take intoaccount the intrinsic scatter of the scaling relation or systematicerrors coming from the data selection for the fit of the scaling re-lation. A tSZ follow-up of this cluster has been made at 15 GHzby the Arcminute Microkelvin Imager (AMI) at a slightly bet-ter resolution (3 arcmin compared to the Planck beams of5–10 arcmin; see Perrott et al. 2015). These AMI observationsprovide a joint estimation of both the characteristic angular sizeθs and the integrated Compton parameter Ytot. The latter is equiv-alent to the Planck estimator Y5R500 to within 5% if we assumethe universal pressure profile with universal parameter valuesand the concentration parameter c500 = 1.177 (Arnaud et al.2010; Perrott et al. 2015). The results derived by AMI are com-patible with the Planck results. The combination of both Planckand AMI constraints gives an integrated Compton parameterestimation at YPlanck/AMI
5R500 = 1.47 ± 0.51 × 10⁻³ arcmin2 thus im-proving the Planck estimation by about 10%. This estimation is2 R∆ is the radius within which the mean cluster density is equalto ∆ times the critical density of the Universe at the cluster redshiftρc =
3H(z)2
8πG .
used, along with the NIKA data, to give a first estimate of theradial pressure profile of PSZ1 G045.85+57.71.
3.2. Point source contamination
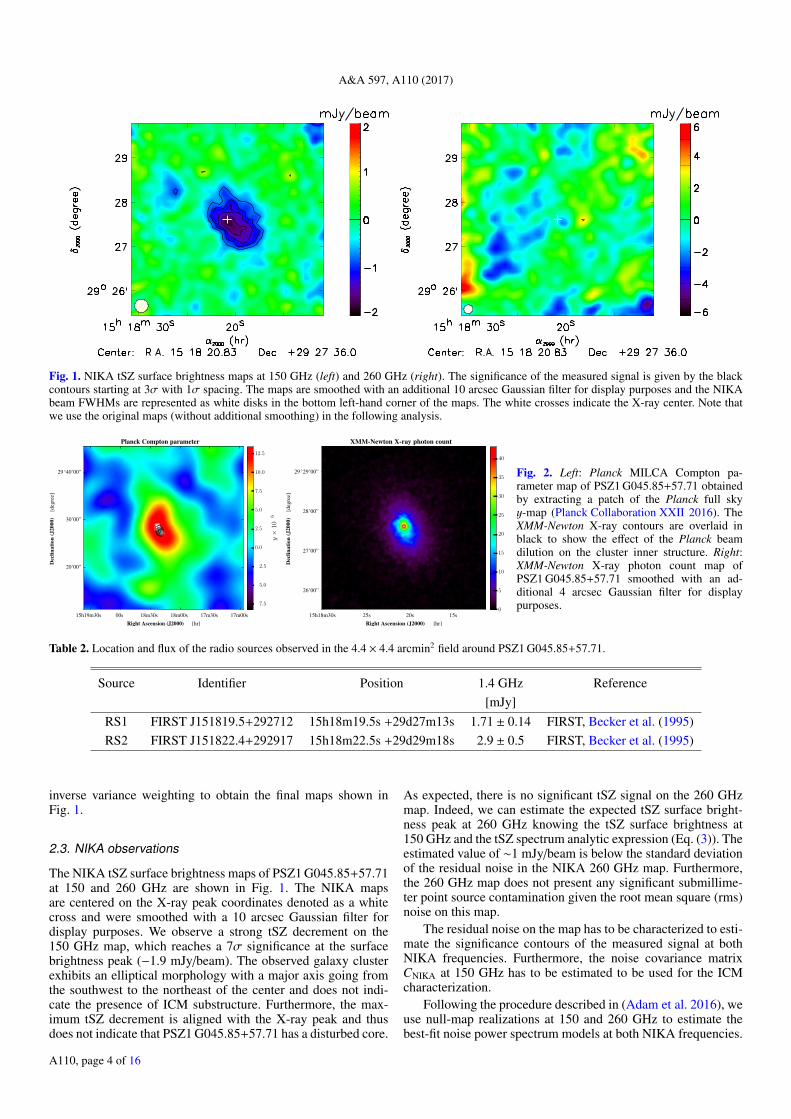
As has been shown in Sayers et al. (2013) and Adam et al.(2016), the point source contamination of the tSZ signal has tobe studied carefully to avoid significant bias in the ICM charac-terization. The NRAO VLA Sky Survey (NVSS; Condon et al.1998) and Faint Images of the Radio Sky at Twenty-Centimeterssurvey (FIRST; Becker et al. 1995), which cover the northernsky at 1.4 GHz, has enabled the detection of two radio sourcesidentified as galaxies in the region observed by NIKA. Thefirst source, hereafter RS1, is located in the southwest region ofPSZ1 G045.85+57.71 at about 40 arcsec from the X-ray center.The second source, named RS2 in the following, is located atabout 2 arcmin toward the north of the X-ray center. The fluxesof RS1 and RS2 are only significant at 1.4 GHz and their val-ues are reported in Table 2. We follow the method detailed inAdam et al. (2016) and model the radio source spectral energydistributions (SED) by a power law, Fν = F1 GHz
(ν
1 GHz
)αradio,
to estimate their expected fluxes in the NIKA bandpasses. Asthere is no other measurement of RS1 and RS2 fluxes referencedin other catalogs at different frequencies, we only constrain theF1 GHz parameter and let the spectral index as a random variablefollowing a Gaussian pdf centered on −0.7 and with a standarddeviation of 0.2, which is typical of radio galaxies (see Witzel1979). The SEDs are thus simulated by computing Monte Carlorealizations of the radio source fluxes and spectral index withintheir error bars. The generated SEDs are then integrated withinthe NIKA bandpasses to predict the expected flux at 150 and260 GHz. The results are reported in Table 3. Given the meanrms noise at the identified radio source locations we thereforeconclude that their contamination at the NIKA frequencies isnegligible.
We also consider the Herschel SPIRE (Griffin et al. 2010)data to identify submillimeter point sources and compute theirexpected fluxes at 150 GHz. Eleven sources are found in theregion observed by NIKA thanks to the SPIRE 250 µm cata-log. The corresponding sources in the other channels (350 µmand 500 µm) are inferred from their respective positions in the250 µm map. Following the procedure detailed in Adam et al.(2016), the fluxes of the sources are measured in the three SPIREchannels by fitting Gaussian functions at the source positionswith a fixed FWHM given by the corresponding Herschel reso-lution in each channel (35.2, 23.9, 17.6 arcsec at 500, 350, and250 µm respectively). A local background is also fitted. Uncer-tainties on the flux of the sources are inferred by computing thedispersion of fluxes estimated by fitting the same Gaussian func-tions at random positions, where the noise is homogeneous. The260 GHz NIKA map was also used to constrain the SED slopeat low frequency for each source. The computed submillime-ter point source fluxes are presented in Table 4. The estimatedfluxes corresponding to identified sources are compatible withthe values reported in the Herschel catalog. A modified black-body spectrum
Fν = A0
(ν
ν0
)βdust
Bν(Tdust) (4)
was used to model the SED of the identified submillimeter pointsources from their estimated fluxes. In this model, A0 is a nor-malization, ν0 a reference frequency, βdust the dust spectral index,and Tdust the dust temperature. A Markov chain Monte Carlo
A110, page 5 of 16
A&A 597, A110 (2017)
Table 3. Best-fit parameters and extrapolation of the fluxes in the NIKA bands of the radio sources in the 4.4 × 4.4 arcmin2 field aroundPSZ1 G045.85+57.71.
Source RA offset Dec offset F1 GHz αradio F150 GHz F260 GHz rms150 GHz rms260 GHz
[arcsec] [arcsec] [mJy] [mJy] [mJy] [mJy] [mJy]RS1 −19.4 −23.9 2.2 ± 0.2 −0.7 ± 0.2 0.11 ± 0.11 0.075 ± 0.092 0.36 1.9RS2 25.2 124.8 3.7 ± 0.7 −0.7 ± 0.2 0.18 ± 0.19 0.13 ± 0.16 0.42 2.2
Notes. The mean rms noise on the flux of the identified point sources at their respective locations is also given at both NIKA frequencies. See textfor details.
Table 4. Positions and fluxes of the 11 submillimeter sources identified in the 4.4 × 4.4 arcmin2 field around PSZ1 G045.85+57.71, measured byfitting Gaussian models to the Herschel maps at each wavelength as described in Sect. 3.2.
Source 250 µm source position 250 µm 350 µm 500 µm 1.15 mm 2.05 mm 2.05 mm rms[mJy] [mJy] [mJy] [mJy] measured [mJy] expected [mJy] [mJy]
SMG1 15:18:22.382, +29:29:03.42 43.6 ± 2.4 51.4 ± 3.4 61.2 ± 4.8 1.9 ± 2.2 0.33 ± 0.42 0.27 ± 0.09 0.42SMG2 15:18:16.978, +29:27:14.60 36.7 ± 2.3 27.3 ± 3.0 13.6 ± 3.5 −2.1 ± 1.9 ** 0.04 ± 0.03 0.36SMG3 15:18:21.859, +29:28:30.33 27.0 ± 2.4 −1.9 ± 9.3 2.1 ± 9.8 −1.3 ± 2.1 ** 0.01 ± 0.01 0.38SMG4 15:18:22.277, +29:26:49.87 24.1 ± 2.5 9.5 ± 9.3 3.6 ± 9.1 −0.2 ± 1.9 −0.22 ± 0.36 0.07 ± 0.05 0.36SMG5 15:18:25.577, +29:28:46.96 19.4 ± 2.2 −4.1 ± 9.5 0.6 ± 9.9 −1.8 ± 2.2 0.27 ± 0.43 0.01 ± 0.02 0.43SMG6 15:18:17.270, +29:28:33.72 18.2 ± 2.4 14.6 ± 3.4 −0.6 ± 9.3 2.3 ± 2.1 0.08 ± 0.38 0.01 ± 0.01 0.39SMG7 15:18:18.969, +29:26:20.75 14.0 ± 2.2 −2.6 ± 9.2 9.0 ± 10.2 1.7 ± 2.1 0.26 ± 0.39 0.09 ± 0.05 0.39SMG8 15:18:23.657, +29:27:36.72 13.9 ± 2.2 −1.9 ± 9.4 −6.9 ± 9.8 −0.8 ± 1.9 0.21 ± 0.36 0.04 ± 0.05 0.36SMG9 15:18:29.306, +29:27:03.83 13.9 ± 2.3 17.3 ± 3.1 9.7 ± 9.8 3.2 ± 3.3 −0.29 ± 0.48 0.02 ± 0.01 0.48
SMG10 15:18:19.522, +29:26:44.27 11.1 ± 2.1 9.7 ± 3.1 6.7 ± 10.0 1.1 ± 1.9 0.51 ± 0.38 0.04 ± 0.02 0.36SMG11 15:18:18.545, +29:27:57.47 8.1 ± 2.2 −4.0 ± 9.0 −3.1 ± 9.7 0.7 ± 1.8 ** 0.01 ± 0.01 0.36
Notes. The 260 GHz NIKA map is also used to constrain each source SED at low frequency. Fluxes at 150 GHZ, which are not available becauseof the tSZ contamination are denoted by double stars **. The expected fluxes at 150 GHz are computed by integrating the estimated SED in theNIKA bandpass. The final column corresponds to the NIKA 150 GHz band rms noise at the source locations.
(MCMC) analysis was performed to compute the best-fit SEDmodel for each source. The estimated SEDs are then integratedin the NIKA 150 GHz bandpass to quantify the point source con-tamination at this frequency. The computed fluxes at 150 GHzare reported in Table 4 and take the SPIRE color correction intoaccount. These results show that the submillimeter point sourcecontamination at 150 GHz is one order of magnitude below thecorresponding NIKA rms noise at this frequency. We thereforeconclude that this contamination is negligible and do not con-sider either radio or submillimeter point sources in the ICM char-acterization developed in Sect. 5.
3.3. XMM-Newton observations
An X-ray follow-up of the Planck-discovered clusters has beenundertaken since Spring 2010 (Planck Collaboration IX 2011).Thus, PSZ1 G045.85+57.71 has been observed for ∼24 ks by theEPIC instruments during XMM-Newton revolution 2303 (2012July 6). The basic data reduction (i.e., production of cleanedand calibrated event files, vignetting correction, point source re-moval, and the production of associated background data sets)followed the procedures described in Adam et al. (2016, and ref-erences therein). About 15 ks of exposure time remained afterthe data cleaning.
The X-ray image shown in Fig. 2, combining the datafrom all three EPIC detectors, was produced as described in
Böhringer et al. (2010). Here the background subtraction, under-taken for each detector separately, was obtained from a modelfit to an image with all sources (including the cluster) excised.The model, consisting of smoothly varying vignetted and unvi-gnetted components, was normalized to the surface brightnessin the outer cluster-free regions of the image and was then sub-tracted to the data.
3.4. Multiprobe combined map of PSZ1 G045.85+57.71
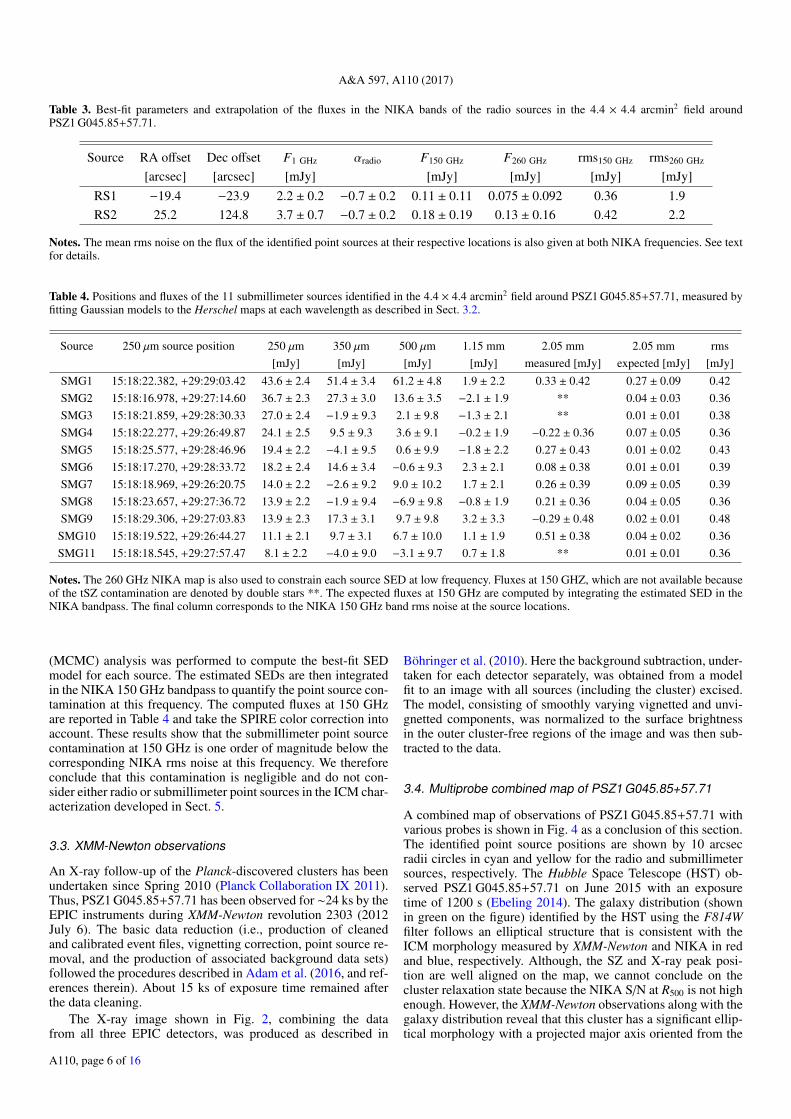
A combined map of observations of PSZ1 G045.85+57.71 withvarious probes is shown in Fig. 4 as a conclusion of this section.The identified point source positions are shown by 10 arcsecradii circles in cyan and yellow for the radio and submillimetersources, respectively. The Hubble Space Telescope (HST) ob-served PSZ1 G045.85+57.71 on June 2015 with an exposuretime of 1200 s (Ebeling 2014). The galaxy distribution (shownin green on the figure) identified by the HST using the F814Wfilter follows an elliptical structure that is consistent with theICM morphology measured by XMM-Newton and NIKA in redand blue, respectively. Although, the SZ and X-ray peak posi-tion are well aligned on the map, we cannot conclude on thecluster relaxation state because the NIKA S/N at R500 is not highenough. However, the XMM-Newton observations along with thegalaxy distribution reveal that this cluster has a significant ellip-tical morphology with a projected major axis oriented from the
A110, page 6 of 16
F. Ruppin et al.: Non parametric deprojection of NIKA SZ observations
FIRST 21 cm
15h18m30s 25s 20s 15s
29 29’00”
28’00”
27’00”
26’00”
Right Ascension (J2000) [hr]
Dec
linat
ion
(J20
00)
[deg
ree]
SPIRE 0.500 mm
15h18m30s 25s 20s 15s
29 29’00”
28’00”
27’00”
26’00”
Right Ascension (J2000) [hr]
Dec
linat
ion
(J20
00)
[deg
ree]
SPIRE 0.350 mm
15h18m30s 25s 20s 15s
29 29’00”
28’00”
27’00”
26’00”
Right Ascension (J2000) [hr]
Dec
linat
ion
(J20
00)
[deg
ree]
SPIRE 0.250 mm
15h18m30s 25s 20s 15s
29 29’00”
28’00”
27’00”
26’00”
Right Ascension (J2000) [hr]
Dec
linat
ion
(J20
00)
[deg
ree]
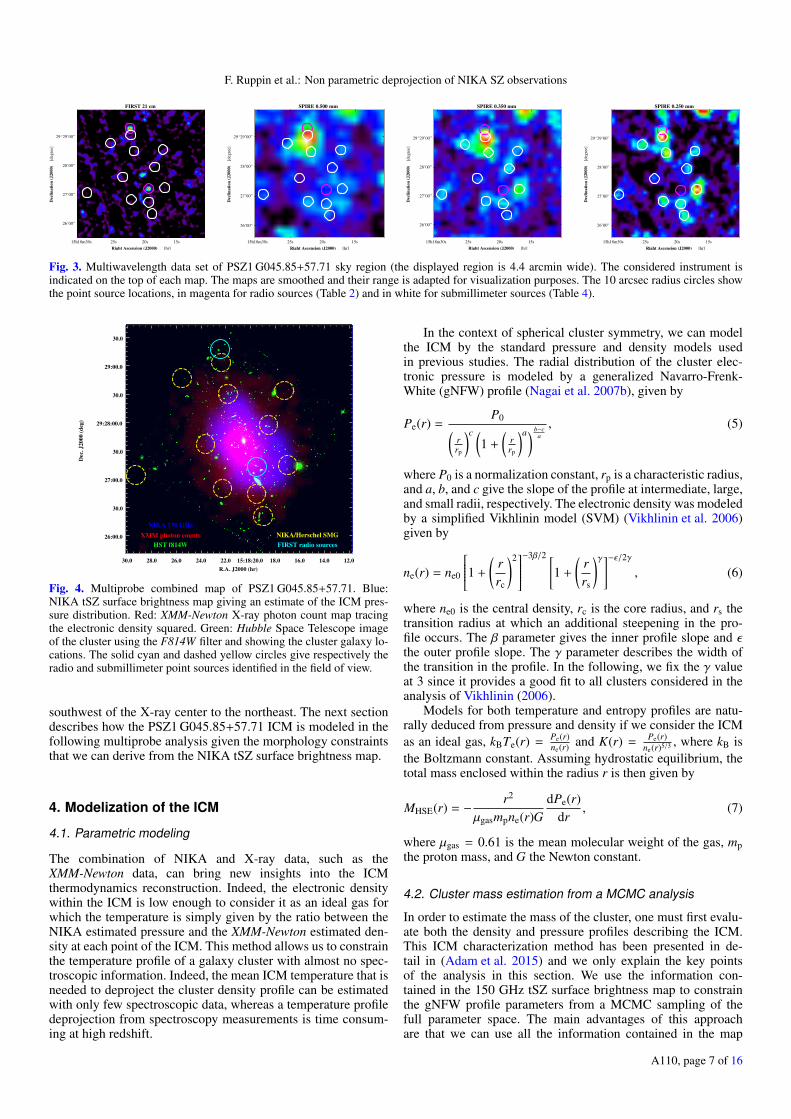
Fig. 3. Multiwavelength data set of PSZ1 G045.85+57.71 sky region (the displayed region is 4.4 arcmin wide). The considered instrument isindicated on the top of each map. The maps are smoothed and their range is adapted for visualization purposes. The 10 arcsec radius circles showthe point source locations, in magenta for radio sources (Table 2) and in white for submillimeter sources (Table 4).
30.0 28.0 26.0 24.0 22.0 15:18:20.0 18.0 16.0 14.0 12.0
30.0
29:00.0
30.0
29:28:00.0
30.0
27:00.0
30.0
26:00.0
R.A. J2000 (hr)
Dec
. J
20
00
(d
eg)
HST f814W FIRST radio sources
NIKA/Herschel SMGXMM photon counts
NIKA 150 GHz
Fig. 4. Multiprobe combined map of PSZ1 G045.85+57.71. Blue:NIKA tSZ surface brightness map giving an estimate of the ICM pres-sure distribution. Red: XMM-Newton X-ray photon count map tracingthe electronic density squared. Green: Hubble Space Telescope imageof the cluster using the F814W filter and showing the cluster galaxy lo-cations. The solid cyan and dashed yellow circles give respectively theradio and submillimeter point sources identified in the field of view.
southwest of the X-ray center to the northeast. The next sectiondescribes how the PSZ1 G045.85+57.71 ICM is modeled in thefollowing multiprobe analysis given the morphology constraintsthat we can derive from the NIKA tSZ surface brightness map.
4. Modelization of the ICM
4.1. Parametric modeling
The combination of NIKA and X-ray data, such as theXMM-Newton data, can bring new insights into the ICMthermodynamics reconstruction. Indeed, the electronic densitywithin the ICM is low enough to consider it as an ideal gas forwhich the temperature is simply given by the ratio between theNIKA estimated pressure and the XMM-Newton estimated den-sity at each point of the ICM. This method allows us to constrainthe temperature profile of a galaxy cluster with almost no spec-troscopic information. Indeed, the mean ICM temperature that isneeded to deproject the cluster density profile can be estimatedwith only few spectroscopic data, whereas a temperature profiledeprojection from spectroscopy measurements is time consum-ing at high redshift.
In the context of spherical cluster symmetry, we can modelthe ICM by the standard pressure and density models usedin previous studies. The radial distribution of the cluster elec-tronic pressure is modeled by a generalized Navarro-Frenk-White (gNFW) profile (Nagai et al. 2007b), given by
Pe(r) =P0(
rrp
)c (1 +
(rrp
)a) b−ca
, (5)
where P0 is a normalization constant, rp is a characteristic radius,and a, b, and c give the slope of the profile at intermediate, large,and small radii, respectively. The electronic density was modeledby a simplified Vikhlinin model (SVM) (Vikhlinin et al. 2006)given by
ne(r) = ne0
1 +
(rrc
)2−3β/2 [1 +
(rrs
)γ]−ε/2γ, (6)
where ne0 is the central density, rc is the core radius, and rs thetransition radius at which an additional steepening in the pro-file occurs. The β parameter gives the inner profile slope and εthe outer profile slope. The γ parameter describes the width ofthe transition in the profile. In the following, we fix the γ valueat 3 since it provides a good fit to all clusters considered in theanalysis of Vikhlinin (2006).
Models for both temperature and entropy profiles are natu-rally deduced from pressure and density if we consider the ICMas an ideal gas, kBTe(r) =
Pe(r)ne(r) and K(r) =
Pe(r)ne(r)5/3 , where kB is
the Boltzmann constant. Assuming hydrostatic equilibrium, thetotal mass enclosed within the radius r is then given by
MHSE(r) = −r2
µgasmpne(r)GdPe(r)
dr, (7)
where µgas = 0.61 is the mean molecular weight of the gas, mpthe proton mass, and G the Newton constant.
4.2. Cluster mass estimation from a MCMC analysis
In order to estimate the mass of the cluster, one must first evalu-ate both the density and pressure profiles describing the ICM.This ICM characterization method has been presented in de-tail in (Adam et al. 2015) and we only explain the key pointsof the analysis in this section. We use the information con-tained in the 150 GHz tSZ surface brightness map to constrainthe gNFW profile parameters from a MCMC sampling of thefull parameter space. The main advantages of this approachare that we can use all the information contained in the map
A110, page 7 of 16

A&A 597, A110 (2017)
to constrain the parameters of interest, marginalize over nui-sance parameters, and identify parameter correlations during theMCMC sampling. The inner slope of the pressure profile can-not be constrained at the considered cluster redshift because ofthe NIKA beam dilution. Therefore, all the gNFW parametersare kept free except for c, which is fixed to the value estimatedby Planck Collaboration Int. V (2013) at c = 0.31. At each stepof the procedure, a set of parameters is generated and definesthe corresponding pressure radial profile. The latter is integratedalong the line of sight to compute a Compton parameter angu-lar profile from which we derive a tSZ surface brightness mapmodel Mmodel at 150 GHz and an integrated Compton parameterYmodel
tot evaluated up to 5 R500. The relativistic corrections in thetSZ spectrum (Eq. (3)) are computed from the temperature esti-mate given by the ratio between the cluster pressure profile andits density profile. Both Mmodel and Ymodel
tot are then comparedto the observed 150 GHz tSZ surface brightness map (Mdata)and integrated Compton parameter (Ydata
tot ) using the followingGaussian likelihood model:
−2lnL = χ2SZ map + χ2
Ytot
=
Npixels∑i=1
[(Mdata − Mmodel)T C−1
NIKA(Mdata − Mmodel)]i
+
(Ydata
tot − Ymodeltot
σdata
)2
· (8)
The MCMC sampling procedure also marginalizes over nui-sance parameters such as the zero level of the NIKA map andthe calibration coefficient uncertainty. The sampling stops whenthe convergence criteria given by Gelman & Rubin (1992) isreached for all the fitted parameters. The final likelihood func-tion marginalized distributions are eventually given by the re-maining chain points after the burn-in cutoff, which discards thefirst 10% of each chain. These distributions are then used to com-pute the gNFW parameter constraints that define the best ICMpressure profile. Both density and pressure profiles are then usedto compute a mass profile using Eq. (7) from which we can de-rive the cluster total mass M500.
4.3. Impact of the departure from sphericity on the ICMthermodynamic reconstruction
A significant amount of disturbed clusters that are characterized,for instance, by the presence of substructures in the ICM, unviri-alized ICM, or merging events, are identified at high redshift byhigh angular resolution observations.
In this context, describing the ICM by a spherical model mayadd dispersion and bias on ICM thermodynamic constrains andgalaxy cluster mass estimations. In particular, this is the case ifthe intrinsic deviation from sphericity is significant, given theresidual noise properties measured on the map.
This section describes the morphology analysis made onboth XMM-Newton X-ray photon count map and NIKA tSZ sur-face brightness map at 150 GHz to check the possibility to re-cover the cluster ellipticity in the individual maps. We then de-scribe the analysis made on simulated tSZ surface brightnessmaps at 150 GHz to study whether a spherical model is appropri-ate to derive PSZ1 G045.85+57.71 ICM thermodynamic proper-ties from the NIKA and XMM-Newton observations.
4.3.1. PSZ1 G045.85+57.71 ellipticity
As shown in Fig. 2 (right panel), the XMM-Newton observationsof PSZ1 G045.85+57.71 reveals a significant elliptical morphol-ogy of the ICM with a projected major axis oriented from thesouthwest of the X-ray center to the northeast. As the infor-mation along the line of sight is lost, we only constrain thelength scales of this cluster in the plane of the sky. The el-lipticity, defined by ε = 1 − b
a , where a and b are the majorand minor axes, respectively, of the considered ellipse, and theorientation of the major axis is estimated by fitting ellipses oniso-number count contours of the XMM-Newton photon countmap. Their respective ellipticity and orientation were computedand show that PSZ1 G045.85+57.71 has a mean ellipticity ofεXMM = 0.33 ± 0.01 and a major axis oriented with an angleθ
majXMM = (70±2) with respect to the RA axis in the clockwise di-
rection. The uncertainties on both estimations are statistical only.As the NIKA rms noise is fairly constant in the cluster re-
gion, the same analysis can been carried out on the NIKA tSZsurface brightness map using constant S/N contours from 3.5 to6.5 with 0.5 steps to fit the ellipses. This analysis shows a muchlarger dispersion on the estimated ellipticity and major-axis ori-entation with εNIKA = 0.4± 0.1 and θmaj
NIKA = (44± 8). The givenerror bars are statistical only and do not take the correlated noiseon the map into account. Indeed, the residual correlated noise onthe NIKA map can induce noise structures with angular scaleslarger than the NIKA beam at 150 GHz that may distort the in-trinsic ICM projected morphology. It is therefore important tocharacterize the bias induced by the spherical cluster assump-tion on the ICM thermodynamic reconstruction. Such a hypoth-esis will be adapted if the induced bias is negligible with respectto the uncertainty on the estimated constraints due to the residualnoise on the NIKA map.
4.3.2. Compatibility between NIKA SZ observationsand the spherical cluster assumption
Although the ellipticity observed on the NIKA map may bedue to residual noise, PSZ1 G045.85+57.71 seems to be intrinsi-cally elliptical as shown by the XMM-Newton map analysis (seeSect. 4.3.1). Therefore, to see if the spherical model assumptioninduces a significant bias on the final ICM characterization wechoose the cluster total mass estimation as a quantitative indica-tor of the induced bias.
Knowing the cluster projected ellipticity and major-axisorientation from the XMM-Newton observations, we derive atSZ surface brightness map from a simulated ellipsoidal clus-ter presenting similar projected morphological properties. Theadopted model is a gNFW pressure profile with a modified ra-dius defined as
r =
√(x cos(θ) − y sin(θ)
a
)2
+
(x sin(θ) + y cos(θ)
b
)2
+
( zc
)2,
(9)
where (a, b, c) define the axis ratios of the triaxial ICM and θis the angle between the major axis and the line of sight. If theθ angle is different from 90, the major-axis length has to be in-creased by a factor 1/sin(θ) to keep the projected ellipticity un-changed. In the following, we consider the ideal case where theprojected cluster ellipticity is equal to its intrinsic one (i.e., fora θ angle of 90). The integration of this pressure model alongthe line of sight gives us a simulated tSZ surface brightness map
A110, page 8 of 16
F. Ruppin et al.: Non parametric deprojection of NIKA SZ observations
HSE
mas
s[×1014M
]
Simulation number
3
4
5
6
7
8
9
10
11
12
0 2 4 6 8 10
1
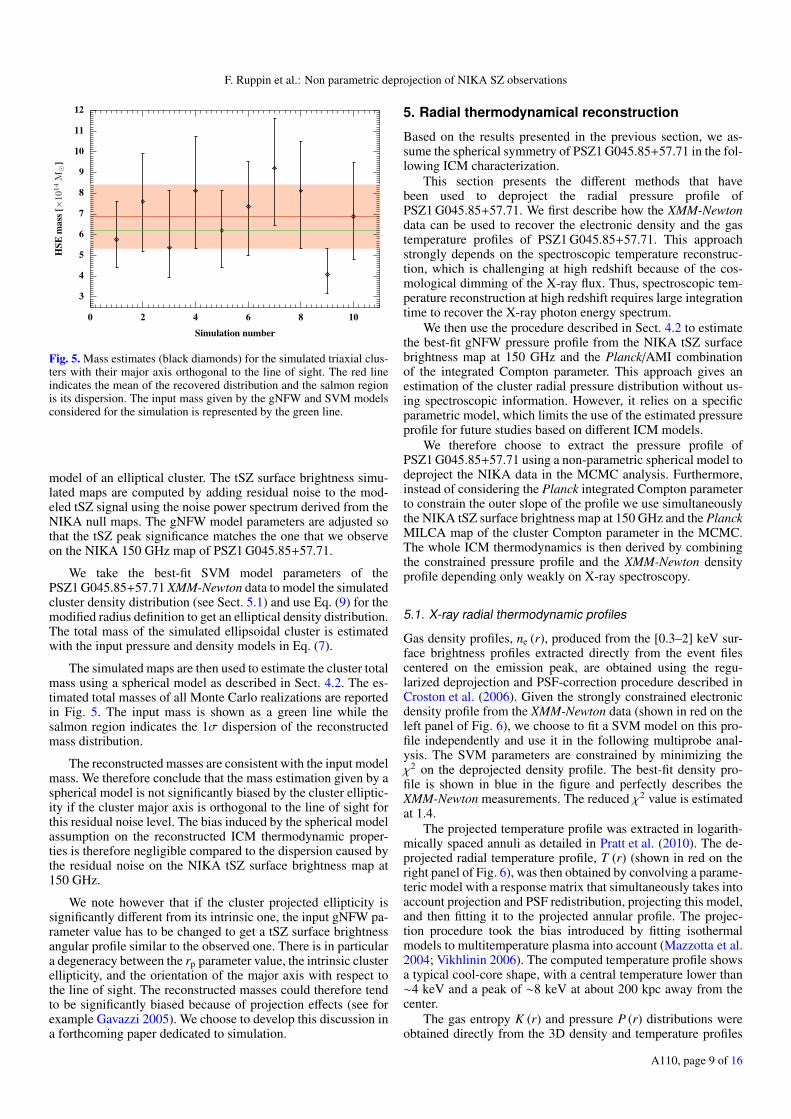
Fig. 5. Mass estimates (black diamonds) for the simulated triaxial clus-ters with their major axis orthogonal to the line of sight. The red lineindicates the mean of the recovered distribution and the salmon regionis its dispersion. The input mass given by the gNFW and SVM modelsconsidered for the simulation is represented by the green line.
model of an elliptical cluster. The tSZ surface brightness simu-lated maps are computed by adding residual noise to the mod-eled tSZ signal using the noise power spectrum derived from theNIKA null maps. The gNFW model parameters are adjusted sothat the tSZ peak significance matches the one that we observeon the NIKA 150 GHz map of PSZ1 G045.85+57.71.
We take the best-fit SVM model parameters of thePSZ1 G045.85+57.71 XMM-Newton data to model the simulatedcluster density distribution (see Sect. 5.1) and use Eq. (9) for themodified radius definition to get an elliptical density distribution.The total mass of the simulated ellipsoidal cluster is estimatedwith the input pressure and density models in Eq. (7).
The simulated maps are then used to estimate the cluster totalmass using a spherical model as described in Sect. 4.2. The es-timated total masses of all Monte Carlo realizations are reportedin Fig. 5. The input mass is shown as a green line while thesalmon region indicates the 1σ dispersion of the reconstructedmass distribution.
The reconstructed masses are consistent with the input modelmass. We therefore conclude that the mass estimation given by aspherical model is not significantly biased by the cluster elliptic-ity if the cluster major axis is orthogonal to the line of sight forthis residual noise level. The bias induced by the spherical modelassumption on the reconstructed ICM thermodynamic proper-ties is therefore negligible compared to the dispersion caused bythe residual noise on the NIKA tSZ surface brightness map at150 GHz.
We note however that if the cluster projected ellipticity issignificantly different from its intrinsic one, the input gNFW pa-rameter value has to be changed to get a tSZ surface brightnessangular profile similar to the observed one. There is in particulara degeneracy between the rp parameter value, the intrinsic clusterellipticity, and the orientation of the major axis with respect tothe line of sight. The reconstructed masses could therefore tendto be significantly biased because of projection effects (see forexample Gavazzi 2005). We choose to develop this discussion ina forthcoming paper dedicated to simulation.
5. Radial thermodynamical reconstruction
Based on the results presented in the previous section, we as-sume the spherical symmetry of PSZ1 G045.85+57.71 in the fol-lowing ICM characterization.
This section presents the different methods that havebeen used to deproject the radial pressure profile ofPSZ1 G045.85+57.71. We first describe how the XMM-Newtondata can be used to recover the electronic density and the gastemperature profiles of PSZ1 G045.85+57.71. This approachstrongly depends on the spectroscopic temperature reconstruc-tion, which is challenging at high redshift because of the cos-mological dimming of the X-ray flux. Thus, spectroscopic tem-perature reconstruction at high redshift requires large integrationtime to recover the X-ray photon energy spectrum.
We then use the procedure described in Sect. 4.2 to estimatethe best-fit gNFW pressure profile from the NIKA tSZ surfacebrightness map at 150 GHz and the Planck/AMI combinationof the integrated Compton parameter. This approach gives anestimation of the cluster radial pressure distribution without us-ing spectroscopic information. However, it relies on a specificparametric model, which limits the use of the estimated pressureprofile for future studies based on different ICM models.
We therefore choose to extract the pressure profile ofPSZ1 G045.85+57.71 using a non-parametric spherical model todeproject the NIKA data in the MCMC analysis. Furthermore,instead of considering the Planck integrated Compton parameterto constrain the outer slope of the profile we use simultaneouslythe NIKA tSZ surface brightness map at 150 GHz and the PlanckMILCA map of the cluster Compton parameter in the MCMC.The whole ICM thermodynamics is then derived by combiningthe constrained pressure profile and the XMM-Newton densityprofile depending only weakly on X-ray spectroscopy.
5.1. X-ray radial thermodynamic profiles
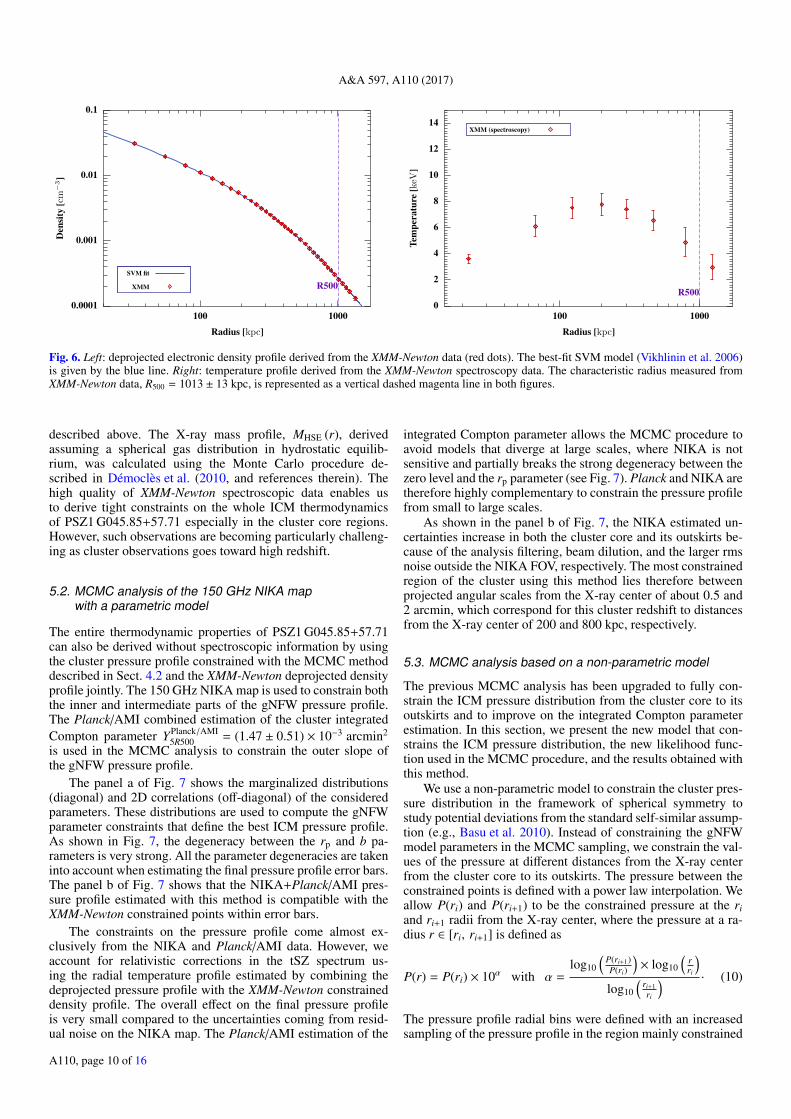
Gas density profiles, ne (r), produced from the [0.3–2] keV sur-face brightness profiles extracted directly from the event filescentered on the emission peak, are obtained using the regu-larized deprojection and PSF-correction procedure described inCroston et al. (2006). Given the strongly constrained electronicdensity profile from the XMM-Newton data (shown in red on theleft panel of Fig. 6), we choose to fit a SVM model on this pro-file independently and use it in the following multiprobe anal-ysis. The SVM parameters are constrained by minimizing theχ2 on the deprojected density profile. The best-fit density pro-file is shown in blue in the figure and perfectly describes theXMM-Newton measurements. The reduced χ2 value is estimatedat 1.4.
The projected temperature profile was extracted in logarith-mically spaced annuli as detailed in Pratt et al. (2010). The de-projected radial temperature profile, T (r) (shown in red on theright panel of Fig. 6), was then obtained by convolving a parame-teric model with a response matrix that simultaneously takes intoaccount projection and PSF redistribution, projecting this model,and then fitting it to the projected annular profile. The projec-tion procedure took the bias introduced by fitting isothermalmodels to multitemperature plasma into account (Mazzotta et al.2004; Vikhlinin 2006). The computed temperature profile showsa typical cool-core shape, with a central temperature lower than∼4 keV and a peak of ∼8 keV at about 200 kpc away from thecenter.
The gas entropy K (r) and pressure P (r) distributions wereobtained directly from the 3D density and temperature profiles
A110, page 9 of 16
A&A 597, A110 (2017)
R500
Den
sity
[cm
−3]
Radius [kpc]
SVM fit
XMM
0.0001
0.001
0.01
0.1
100 1000
1
R500
Tem
pera
ture
[keV
]
Radius [kpc]
XMM (spectroscopy)
0
2
4
6
8
10
12
14
100 1000
1
Fig. 6. Left: deprojected electronic density profile derived from the XMM-Newton data (red dots). The best-fit SVM model (Vikhlinin et al. 2006)is given by the blue line. Right: temperature profile derived from the XMM-Newton spectroscopy data. The characteristic radius measured fromXMM-Newton data, R500 = 1013 ± 13 kpc, is represented as a vertical dashed magenta line in both figures.
described above. The X-ray mass profile, MHSE (r), derivedassuming a spherical gas distribution in hydrostatic equilib-rium, was calculated using the Monte Carlo procedure de-scribed in Démoclès et al. (2010, and references therein). Thehigh quality of XMM-Newton spectroscopic data enables usto derive tight constraints on the whole ICM thermodynamicsof PSZ1 G045.85+57.71 especially in the cluster core regions.However, such observations are becoming particularly challeng-ing as cluster observations goes toward high redshift.
5.2. MCMC analysis of the 150 GHz NIKA mapwith a parametric model
The entire thermodynamic properties of PSZ1 G045.85+57.71can also be derived without spectroscopic information by usingthe cluster pressure profile constrained with the MCMC methoddescribed in Sect. 4.2 and the XMM-Newton deprojected densityprofile jointly. The 150 GHz NIKA map is used to constrain boththe inner and intermediate parts of the gNFW pressure profile.The Planck/AMI combined estimation of the cluster integratedCompton parameter YPlanck/AMI
5R500 = (1.47 ± 0.51) × 10−3 arcmin2
is used in the MCMC analysis to constrain the outer slope ofthe gNFW pressure profile.
The panel a of Fig. 7 shows the marginalized distributions(diagonal) and 2D correlations (off-diagonal) of the consideredparameters. These distributions are used to compute the gNFWparameter constraints that define the best ICM pressure profile.As shown in Fig. 7, the degeneracy between the rp and b pa-rameters is very strong. All the parameter degeneracies are takeninto account when estimating the final pressure profile error bars.The panel b of Fig. 7 shows that the NIKA+Planck/AMI pres-sure profile estimated with this method is compatible with theXMM-Newton constrained points within error bars.
The constraints on the pressure profile come almost ex-clusively from the NIKA and Planck/AMI data. However, weaccount for relativistic corrections in the tSZ spectrum us-ing the radial temperature profile estimated by combining thedeprojected pressure profile with the XMM-Newton constraineddensity profile. The overall effect on the final pressure profileis very small compared to the uncertainties coming from resid-ual noise on the NIKA map. The Planck/AMI estimation of the
integrated Compton parameter allows the MCMC procedure toavoid models that diverge at large scales, where NIKA is notsensitive and partially breaks the strong degeneracy between thezero level and the rp parameter (see Fig. 7). Planck and NIKA aretherefore highly complementary to constrain the pressure profilefrom small to large scales.
As shown in the panel b of Fig. 7, the NIKA estimated un-certainties increase in both the cluster core and its outskirts be-cause of the analysis filtering, beam dilution, and the larger rmsnoise outside the NIKA FOV, respectively. The most constrainedregion of the cluster using this method lies therefore betweenprojected angular scales from the X-ray center of about 0.5 and2 arcmin, which correspond for this cluster redshift to distancesfrom the X-ray center of 200 and 800 kpc, respectively.
5.3. MCMC analysis based on a non-parametric model
The previous MCMC analysis has been upgraded to fully con-strain the ICM pressure distribution from the cluster core to itsoutskirts and to improve on the integrated Compton parameterestimation. In this section, we present the new model that con-strains the ICM pressure distribution, the new likelihood func-tion used in the MCMC procedure, and the results obtained withthis method.
We use a non-parametric model to constrain the cluster pres-sure distribution in the framework of spherical symmetry tostudy potential deviations from the standard self-similar assump-tion (e.g., Basu et al. 2010). Instead of constraining the gNFWmodel parameters in the MCMC sampling, we constrain the val-ues of the pressure at different distances from the X-ray centerfrom the cluster core to its outskirts. The pressure between theconstrained points is defined with a power law interpolation. Weallow P(ri) and P(ri+1) to be the constrained pressure at the riand ri+1 radii from the X-ray center, where the pressure at a ra-dius r ∈ [ri, ri+1] is defined as
P(r) = P(ri) × 10α with α =log10
(P(ri+1)P(ri)
)× log10
(rri
)log10
(ri+1ri
) · (10)
The pressure profile radial bins were defined with an increasedsampling of the pressure profile in the region mainly constrained
A110, page 10 of 16

F. Ruppin et al.: Non parametric deprojection of NIKA SZ observations
R500
Pres
sure
[keV
.cm
3]
Radius [kpc]
NIKA+Planck
XMM
0.0001
0.001
0.01
0.1
1
100 1000
1
a) b)
rp (kpc)
a
b
calibration (Jy.beam-1/y)
zero level (mJy/beam)
P0 (keV.cm-3)
Fig. 7. Panel a): marginalized distributions (diagonal) and 2D correlations (off-diagonal) plots of the parameters of the assumed gNFW model.The MCMC procedure constrains the parameters of interest (from the bottom of the diagonal to the top): P0, rp, a, and b and marginalize over themap zero level and y-mJy/beam calibration coefficient. Panel b): maximum likelihood NIKA+Planck/AMI pressure profile (black), the 1-sigmadispersion (light blue), and XMM-Newton constrained pressure profile (red).
by the NIKA map (see Sect. 5.2). Eleven pressure profile radialbins are defined from ∼0.02 R500 to ∼R500, which are mainly con-strained by the NIKA tSZ surface brightness map, and 3 bins at3, 4, and ∼5 R500, which are constrained by the Planck Comptonparameter map.
Indeed, instead of using the Planck/AMI estimation ofthe integrated Compton parameter to partially break the de-generacy between the map zero level and the pressure pro-file characteristic radius, the Compton parameter map ofPSZ1 G045.85+57.71 (see Fig. 2 left panel) that is obtainedwith MILCA (Planck Collaboration XXII 2016), yPlanck, is usedin combination with the NIKA map, MNIKA, to simultaneouslyconstrain the cluster pressure profile at intermediate and largeangular scales.
We simulated Planck noise maps using the variance perpixel and homogeneous noise power spectrum provided byPlanck Collaboration XXII (2016). These simulations are usedto compute the pixel-to-pixel noise covariance matrix in the con-sidered region of the Planck MILCA y-map CPlanck. At eachstep of the MCMC sampling, a pressure profile is defined us-ing Eq. (10) and is used to derive a tSZ surface brightness map,Mmodel at 150 GHz, and a Compton parameter map ymodel. They
are then respectively compared to the NIKA and Planck data viathe following likelihood function:
−2lnL = χ2NIKA + χ2
Planck
=
NNIKApixels∑i=1
[(MNIKA − Mmodel)T C−1
NIKA(MNIKA − Mmodel)]i
+
NPlanckpixels∑j=1
[(yPlanck − ymodel)T C−1
Planck(yPlanck − ymodel)]
j.
(11)
Uniform priors spanning from 0 to 2 keV cm−3 are used for eachpressure bin. This MCMC procedure also marginalizes over thezero level of the NIKA map and the calibration coefficient uncer-tainty. The correlations between the constrained pressure pointsare taken into account as in Sect. 5.2 to estimate the error barson the pressure profile.
We tested this method on simulations to check the pressureprofile reconstruction. An input pressure distribution modeledas a gNFW profile was used to simulate tSZ surface brightnessmaps on which residual correlated noise was added using the
A110, page 11 of 16

A&A 597, A110 (2017)
Pres
sure
[keV
.cm
−3]
R/R500
SZ (NIKA+Planck)
NIKA+Planck gNFW fit
X-ray (XMM)
1e-05
0.0001
0.001
0.01
0.1
1
0.1 1
1
Fig. 8. Non-parametric pressure profile (blue) depro-jected from the NIKA tSZ surface brightness map andthe Planck Compton parameter map. The 3 radial binsat 3, 4, and 5 R500 are mostly constrained by the Planckdata. A gNFW pressure profile model has been fittedon the NIKA+Planck deprojected pressure points (blacksolid line). XMM-Newton estimated pressure profile (red)based on the deprojected density profile and the temper-ature estimation from spectroscopic observations. TheNIKA/Planck and XMM-Newton estimates are compat-ible within error bars.
noise power spectrum derived from the NIKA null-maps. Theconstrained pressure points are always consistent with the inputpressure profile.
The NIKA+Planck deprojected pressure profile ofPSZ1 G045.85+57.71 is shown in Fig. 8 along with theXMM-Newton estimate in red. The pressure within the ICMis constrained from the cluster core to its outskirts withoutrelying on X-ray spectroscopy at the intermediate redshiftz = 0.61. Such a non-parametric pressure profile deprojec-tion is comparable with what has been achieved with thePlanck satellite for low redshift (z < 0.2) galaxy clusters (seePlanck Collaboration Int. V 2013).
The 1σ error bars of the deprojected pressure points arelarger than the error bars we get from the previous MCMCanalysis because the pressure profile is only constrained by thedata whereas a parametric model fitting induces additional con-straints. In the context of the spherical cluster assumption, sucha non-parametric pressure profile deprojection gives an estimateof the intrinsic ICM pressure distribution without model-inducedbias.
Considering the Planck/AMI integrated Compton parameterin the MCMC analysis enables us to avoid models that divergeat large scales but does not takeall the information containedin the Planck Compton parameter map into account. Using thewhole Planck Compton parameter map in the likelihood estima-tion allows us to constrain both the normalization of the pres-sure profile and the pressure distribution at large scales whereNIKA is not sensitive. Therefore, the three pressure profile radialbins constrained by the Planck map at large radii give a strongconstraint on the pressure profile slope in the cluster outskirts.This highlights the complementarity between large FOV experi-ments, albeit with low resolution, such as Planck and the NIKAinstrument, which benefit from the IRAM 30 m telescope highresolution.
All the deprojected pressure values in Fig. 8 are compatiblewith the pressure profile derived with the previous MCMC anal-ysis based on a gNFW modeling of the pressure distribution (seeSect. 5.2). The pressure profile of PSZ1 G045.85+57.71 is there-fore well-described by a gNFW model. The agreement betweenNIKA/Planck and XMM-Newton estimates is good as detailed inthe following section.
The maximum likelihood tSZ surface brightness map andCompton parameter map have been used to compute residualmaps for both NIKA and Planck observations. The top and bot-tom panels of Fig. 9 show the raw data, maximum likelihoodmodel, and residual maps for NIKA and Planck, respectively.Although residuals are seen in the southwest region of the NIKAmap, the S/N in both residual maps is always lower than 3, whichtherefore allows us to conclude that there are no significant sub-structures in PSZ1 G045.85+57.71 and that the NIKA 150 GHzmap of this cluster is well described by a projected sphericalmodel, given the amount of residual correlated noise.
5.4. Integrated Compton parameter estimation
Both parametric and non-parametric deprojected pressureprofiles are then used to estimate the cluster integratedCompton parameter Yparam
500 = 4.23+0.68−0.62 × 10⁻⁴ arcmin2 and
Ynon−param500 = 5.61+0.68
−0.59 × 10⁻⁴ arcmin2, which are in agreementwith the Planck estimation Y500 = 8.21+1.73
−1.70 × 10⁻⁴ arcmin2
(Planck Collaboration XXXII 2015). The best relative uncer-tainty is obtained with the non-parametric pressure profiledeprojection because this method gives the most stringentconstraints on the cluster pressure distribution from its coreup to 5 R500. Thus, the relative uncertainty on the integratedCompton parameter tracing the total thermal energy withinthe ICM is improved by a factor 2 with respect to the Planckestimate because the pressure profile is much more constrainedat each scale. Furthermore, the NIKA high angular resolutionallows us to completely break the θs − Ytot degeneracy observedin both Planck and AMI observations (Perrott et al. 2015).
This result highlights the necessity of a high resolution tSZfollow-up of Planck-discovered clusters to better constrain theY − M scaling relation used for future cosmology studies. In-deed, a non-parametric joint analysis of both NIKA and Planckdata leads to a deprojected pressure profile, which is constrainedat every scale and is not affected by model-induced bias. Thisapproach allows us to give a stringent constraint on the inte-grated Compton parameter used to calibrate the Y − M scalingrelation. The PSZ1 G045.85+57.71 integrated Compton param-eter estimations derived from SZ observations are summarizedin Table 5.
A110, page 12 of 16

F. Ruppin et al.: Non parametric deprojection of NIKA SZ observations
Fig. 9. NIKA tSZ surface brightness at 150 GHz, maximum likelihood tSZ map and residual (top row) and Planck Compton parameter map,maximum likelihood Compton parameter map and residual (bottom row) computed from a non-parametric model based MCMC analysis. Theresidual maps does not indicate any significant substructure since no S/N over 3 is observed. The NIKA beam at 150 GHz and the Planck effectivebeam of 10 arcmin FWHM are shown in the bottom left-hand corner of the top and bottom row maps, respectively.
Table 5. Estimations of PSZ1 G045.85+57.71 integrated Comp-ton parameter (Y500) from the constraint derived by Planck(Planck Collaboration XXXII 2015), from the 2D model based MCMCanalysis (see Sect. 4.2), and from the non-parametric model basedMCMC analysis (see Sect. 5.3).
Data Method Y500 (arcmin2)Planck catalog 8.21+1.73
−1.70 × 10⁻⁴
NIKA + Planck/AMI parametric 4.23+0.68−0.62 × 10⁻⁴
NIKA + Planck map non-parametric 5.61+0.68−0.59 × 10⁻⁴
5.5. Thermodynamics of the cluster
In this section, we use the complementarity between NIKA andXMM-Newton data sets to fully constrain the thermodynamicsof PSZ1 G045.85+57.71. As both the cluster density and pres-sure profiles estimated from non-parametric deprojection meth-ods are consistent with parametric models (see Figs. 6 and 8),we choose for convenience to combine the best-fit SVM modelof the XMM-Newton density profile and the best-fit gNFW modelof the NIKA/Planck pressure profile to constrain the whole ICMthermodynamics.
The maximum likelihood pressure values computed from thenon-parametric analysis were therefore fitted by a gNFW modelby taking into account the correlations between each pressurepoints. A reduced χ2 of 1.13 was computed for the fit. Thisemphasizes the good agreement between the NIKA deprojectedpressure points and the standard gNFW model. The pressureprofile constrained by the 150 GHz NIKA map is shown inFig. 10 (top left panel) in black together with the deprojectedpressure points from the XMM-Newton analysis in red. All theXMM-Newton estimated pressure points are compatible with theNIKA constrained pressure profile within the 68% confidence
level uncertainties shown in blue in Fig. 10. The XMM-Newtonestimate of the pressure profile can only be inferred with spec-troscopic information while tSZ observations directly probe thepressure distribution within the ICM. Comparing both estimatedpressure profiles allows us then to bring strong constraints on thecluster pressure distribution as the two methods are completelyindependent.
The NIKA pressure profile estimate is compared with theuniversal pressure profile computed using the REXCESS rep-resentative sample of nearby clusters (Böhringer et al. 2007;Arnaud et al. 2010). The solid and dashed orange lines in Fig. 10(top left panel) give the cool-core and morphologically disturbedsubsample mean pressure profile, respectively. The normaliza-tion of the two profiles was computed using the XMM-Newtontotal mass estimation taking into account the mass dependenceof the shape of the profile (Arnaud et al. 2010). As shown in thebottom part of Fig. 10 (top left panel), the cool-core and mor-phologically disturbed cluster universal profiles are both withinthe 2σ error bars of the PSZ1 G045.85+57.71 pressure profileestimation. Therefore, the NIKA estimated profile alone doesnot bring significant information on the relaxation state of thiscluster.
The cluster temperature, entropy, and mass profiles werecomputed by combining both the NIKA estimated pressure pro-file and the fitted SVM density profile as explained in Sect. 4.1.
The estimated temperature profile shown in Fig. 10 (top rightpanel) is compatible with that estimated from the XMM-Newtonspectroscopic observations and its shape is consistent with thatexpected for a cool-core cluster. The core temperature goes downto ∼4 keV and the maximum temperature of ∼7 keV is reached ata distance of ∼200 kpc from the X-ray center. The NIKA-XMMcombined temperature profile (without spectroscopy) seems tobe flatter in the cluster outskirts than that estimated by the XMMdata alone (with spectroscopy). This could be an indication of
A110, page 13 of 16
A&A 597, A110 (2017)
−2
0
2
100 1000
R500
χ
Radius [kpc]
Pres
sure
[keV.cm
−3]
NIKA+Planck
XMM
REXCESS CC
REXCESS disturbed
0.0001
0.001
0.01
0.1
1
1
R500
Tem
pera
ture
[keV
]
Radius [kpc]
NIKA+Planck+XMM (no spectro.)
XMM (with spectro.)
0
5
10
15
20
100 1000
1
−6−4−202
100 1000
R500
χ
Radius [kpc]
Ent
ropy
[keV.cm
2]
NIKA+Planck+XMM (no spectro.)
XMM (with spectro.)
REXCESS CC
REXCESS disturbed
Self-similar baseline
10
100
1000
10000
1
R500
HSE
mas
s[M
]
Radius [kpc]
NIKA+Planck+XMM (no spectro.)
XMM (with spectro.)
1011
1012
1013
1014
1015
100 1000
1
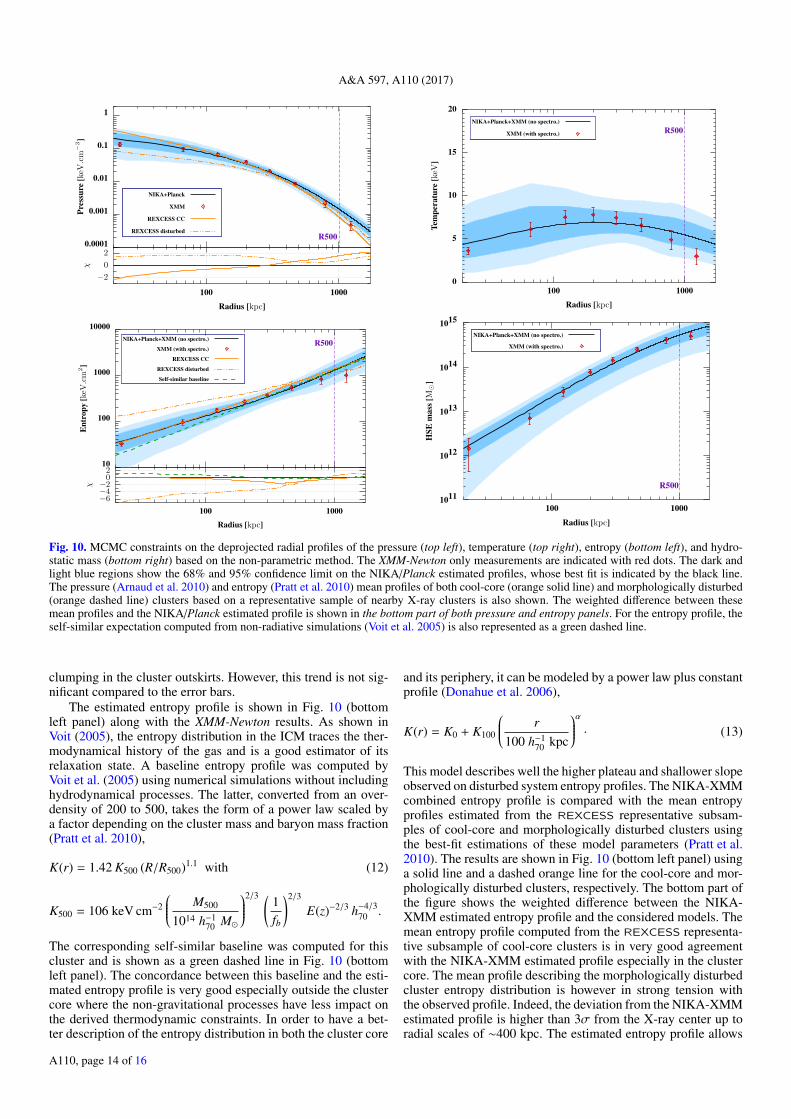
Fig. 10. MCMC constraints on the deprojected radial profiles of the pressure (top left), temperature (top right), entropy (bottom left), and hydro-static mass (bottom right) based on the non-parametric method. The XMM-Newton only measurements are indicated with red dots. The dark andlight blue regions show the 68% and 95% confidence limit on the NIKA/Planck estimated profiles, whose best fit is indicated by the black line.The pressure (Arnaud et al. 2010) and entropy (Pratt et al. 2010) mean profiles of both cool-core (orange solid line) and morphologically disturbed(orange dashed line) clusters based on a representative sample of nearby X-ray clusters is also shown. The weighted difference between thesemean profiles and the NIKA/Planck estimated profile is shown in the bottom part of both pressure and entropy panels. For the entropy profile, theself-similar expectation computed from non-radiative simulations (Voit et al. 2005) is also represented as a green dashed line.
clumping in the cluster outskirts. However, this trend is not sig-nificant compared to the error bars.
The estimated entropy profile is shown in Fig. 10 (bottomleft panel) along with the XMM-Newton results. As shown inVoit (2005), the entropy distribution in the ICM traces the ther-modynamical history of the gas and is a good estimator of itsrelaxation state. A baseline entropy profile was computed byVoit et al. (2005) using numerical simulations without includinghydrodynamical processes. The latter, converted from an over-density of 200 to 500, takes the form of a power law scaled bya factor depending on the cluster mass and baryon mass fraction(Pratt et al. 2010),
K(r) = 1.42 K500 (R/R500)1.1 with (12)
K500 = 106 keV cm−2 M500
1014 h−170 M
2/3 (1fb
)2/3
E(z)−2/3 h−4/370 .
The corresponding self-similar baseline was computed for thiscluster and is shown as a green dashed line in Fig. 10 (bottomleft panel). The concordance between this baseline and the esti-mated entropy profile is very good especially outside the clustercore where the non-gravitational processes have less impact onthe derived thermodynamic constraints. In order to have a bet-ter description of the entropy distribution in both the cluster core
and its periphery, it can be modeled by a power law plus constantprofile (Donahue et al. 2006),
K(r) = K0 + K100
r100 h−1
70 kpc
α · (13)
This model describes well the higher plateau and shallower slopeobserved on disturbed system entropy profiles. The NIKA-XMMcombined entropy profile is compared with the mean entropyprofiles estimated from the REXCESS representative subsam-ples of cool-core and morphologically disturbed clusters usingthe best-fit estimations of these model parameters (Pratt et al.2010). The results are shown in Fig. 10 (bottom left panel) usinga solid line and a dashed orange line for the cool-core and mor-phologically disturbed clusters, respectively. The bottom part ofthe figure shows the weighted difference between the NIKA-XMM estimated entropy profile and the considered models. Themean entropy profile computed from the REXCESS representa-tive subsample of cool-core clusters is in very good agreementwith the NIKA-XMM estimated profile especially in the clustercore. The mean profile describing the morphologically disturbedcluster entropy distribution is however in strong tension withthe observed profile. Indeed, the deviation from the NIKA-XMMestimated profile is higher than 3σ from the X-ray center up toradial scales of ∼400 kpc. The estimated entropy profile allows
A110, page 14 of 16
F. Ruppin et al.: Non parametric deprojection of NIKA SZ observations
us to conclude that PSZ1 G045.85+57.71 is a cool-core clus-ter, confirming the indications from the temperature profile. Thisemphasizes the complementarity between tSZ and X-ray obser-vations to constrain the full thermodynamic state of a cluster.
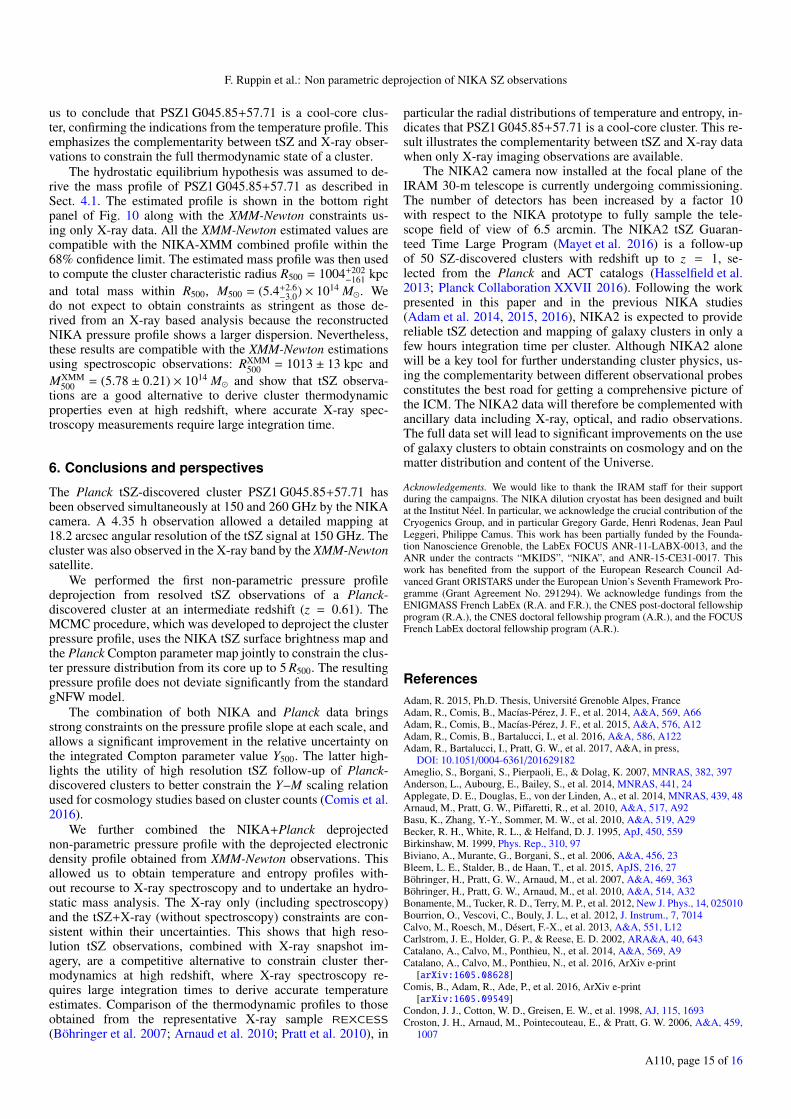
The hydrostatic equilibrium hypothesis was assumed to de-rive the mass profile of PSZ1 G045.85+57.71 as described inSect. 4.1. The estimated profile is shown in the bottom rightpanel of Fig. 10 along with the XMM-Newton constraints us-ing only X-ray data. All the XMM-Newton estimated values arecompatible with the NIKA-XMM combined profile within the68% confidence limit. The estimated mass profile was then usedto compute the cluster characteristic radius R500 = 1004+202
−161 kpcand total mass within R500, M500 = (5.4+2.6
−3.0) × 1014 M. Wedo not expect to obtain constraints as stringent as those de-rived from an X-ray based analysis because the reconstructedNIKA pressure profile shows a larger dispersion. Nevertheless,these results are compatible with the XMM-Newton estimationsusing spectroscopic observations: RXMM
500 = 1013 ± 13 kpc andMXMM
500 = (5.78 ± 0.21) × 1014 M and show that tSZ observa-tions are a good alternative to derive cluster thermodynamicproperties even at high redshift, where accurate X-ray spec-troscopy measurements require large integration time.
6. Conclusions and perspectives
The Planck tSZ-discovered cluster PSZ1 G045.85+57.71 hasbeen observed simultaneously at 150 and 260 GHz by the NIKAcamera. A 4.35 h observation allowed a detailed mapping at18.2 arcsec angular resolution of the tSZ signal at 150 GHz. Thecluster was also observed in the X-ray band by the XMM-Newtonsatellite.
We performed the first non-parametric pressure profiledeprojection from resolved tSZ observations of a Planck-discovered cluster at an intermediate redshift (z = 0.61). TheMCMC procedure, which was developed to deproject the clusterpressure profile, uses the NIKA tSZ surface brightness map andthe Planck Compton parameter map jointly to constrain the clus-ter pressure distribution from its core up to 5 R500. The resultingpressure profile does not deviate significantly from the standardgNFW model.
The combination of both NIKA and Planck data bringsstrong constraints on the pressure profile slope at each scale, andallows a significant improvement in the relative uncertainty onthe integrated Compton parameter value Y500. The latter high-lights the utility of high resolution tSZ follow-up of Planck-discovered clusters to better constrain the Y–M scaling relationused for cosmology studies based on cluster counts (Comis et al.2016).
We further combined the NIKA+Planck deprojectednon-parametric pressure profile with the deprojected electronicdensity profile obtained from XMM-Newton observations. Thisallowed us to obtain temperature and entropy profiles with-out recourse to X-ray spectroscopy and to undertake an hydro-static mass analysis. The X-ray only (including spectroscopy)and the tSZ+X-ray (without spectroscopy) constraints are con-sistent within their uncertainties. This shows that high reso-lution tSZ observations, combined with X-ray snapshot im-agery, are a competitive alternative to constrain cluster ther-modynamics at high redshift, where X-ray spectroscopy re-quires large integration times to derive accurate temperatureestimates. Comparison of the thermodynamic profiles to thoseobtained from the representative X-ray sample REXCESS
(Böhringer et al. 2007; Arnaud et al. 2010; Pratt et al. 2010), in
particular the radial distributions of temperature and entropy, in-dicates that PSZ1 G045.85+57.71 is a cool-core cluster. This re-sult illustrates the complementarity between tSZ and X-ray datawhen only X-ray imaging observations are available.
The NIKA2 camera now installed at the focal plane of theIRAM 30-m telescope is currently undergoing commissioning.The number of detectors has been increased by a factor 10with respect to the NIKA prototype to fully sample the tele-scope field of view of 6.5 arcmin. The NIKA2 tSZ Guaran-teed Time Large Program (Mayet et al. 2016) is a follow-upof 50 SZ-discovered clusters with redshift up to z = 1, se-lected from the Planck and ACT catalogs (Hasselfield et al.2013; Planck Collaboration XXVII 2016). Following the workpresented in this paper and in the previous NIKA studies(Adam et al. 2014, 2015, 2016), NIKA2 is expected to providereliable tSZ detection and mapping of galaxy clusters in only afew hours integration time per cluster. Although NIKA2 alonewill be a key tool for further understanding cluster physics, us-ing the complementarity between different observational probesconstitutes the best road for getting a comprehensive picture ofthe ICM. The NIKA2 data will therefore be complemented withancillary data including X-ray, optical, and radio observations.The full data set will lead to significant improvements on the useof galaxy clusters to obtain constraints on cosmology and on thematter distribution and content of the Universe.
Acknowledgements. We would like to thank the IRAM staff for their supportduring the campaigns. The NIKA dilution cryostat has been designed and builtat the Institut Néel. In particular, we acknowledge the crucial contribution of theCryogenics Group, and in particular Gregory Garde, Henri Rodenas, Jean PaulLeggeri, Philippe Camus. This work has been partially funded by the Founda-tion Nanoscience Grenoble, the LabEx FOCUS ANR-11-LABX-0013, and theANR under the contracts “MKIDS”, “NIKA”, and ANR-15-CE31-0017. Thiswork has benefited from the support of the European Research Council Ad-vanced Grant ORISTARS under the European Union’s Seventh Framework Pro-gramme (Grant Agreement No. 291294). We acknowledge fundings from theENIGMASS French LabEx (R.A. and F.R.), the CNES post-doctoral fellowshipprogram (R.A.), the CNES doctoral fellowship program (A.R.), and the FOCUSFrench LabEx doctoral fellowship program (A.R.).
ReferencesAdam, R. 2015, Ph.D. Thesis, Université Grenoble Alpes, FranceAdam, R., Comis, B., Macías-Pérez, J. F., et al. 2014, A&A, 569, A66Adam, R., Comis, B., Macías-Pérez, J. F., et al. 2015, A&A, 576, A12Adam, R., Comis, B., Bartalucci, I., et al. 2016, A&A, 586, A122Adam, R., Bartalucci, I., Pratt, G. W., et al. 2017, A&A, in press,
DOI: 10.1051/0004-6361/201629182Ameglio, S., Borgani, S., Pierpaoli, E., & Dolag, K. 2007, MNRAS, 382, 397Anderson, L., Aubourg, E., Bailey, S., et al. 2014, MNRAS, 441, 24Applegate, D. E., Douglas, E., von der Linden, A., et al. 2014, MNRAS, 439, 48Arnaud, M., Pratt, G. W., Piffaretti, R., et al. 2010, A&A, 517, A92Basu, K., Zhang, Y.-Y., Sommer, M. W., et al. 2010, A&A, 519, A29Becker, R. H., White, R. L., & Helfand, D. J. 1995, ApJ, 450, 559Birkinshaw, M. 1999, Phys. Rep., 310, 97Biviano, A., Murante, G., Borgani, S., et al. 2006, A&A, 456, 23Bleem, L. E., Stalder, B., de Haan, T., et al. 2015, ApJS, 216, 27Böhringer, H., Pratt, G. W., Arnaud, M., et al. 2007, A&A, 469, 363Böhringer, H., Pratt, G. W., Arnaud, M., et al. 2010, A&A, 514, A32Bonamente, M., Tucker, R. D., Terry, M. P., et al. 2012, New J. Phys., 14, 025010Bourrion, O., Vescovi, C., Bouly, J. L., et al. 2012, J. Instrum., 7, 7014Calvo, M., Roesch, M., Désert, F.-X., et al. 2013, A&A, 551, L12Carlstrom, J. E., Holder, G. P., & Reese, E. D. 2002, ARA&A, 40, 643Catalano, A., Calvo, M., Ponthieu, N., et al. 2014, A&A, 569, A9Catalano, A., Calvo, M., Ponthieu, N., et al. 2016, ArXiv e-print
[arXiv:1605.08628]Comis, B., Adam, R., Ade, P., et al. 2016, ArXiv e-print
[arXiv:1605.09549]Condon, J. J., Cotton, W. D., Greisen, E. W., et al. 1998, AJ, 115, 1693Croston, J. H., Arnaud, M., Pointecouteau, E., & Pratt, G. W. 2006, A&A, 459,
1007
A110, page 15 of 16
A&A 597, A110 (2017)
da Silva, A. C., Kay, S. T., Liddle, A. R., & Thomas, P. A. 2004, MNRAS, 348,1401
de Haan, T., Benson, B. A., Bleem, L. E., et al. 2016, ApJ, 832, 95Démoclès, J., Pratt, G. W., Pierini, D., et al. 2010, A&A, 517, A52Donahue, M., Horner, D. J., Cavagnolo, K. W., & Voit, G. M. 2006, ApJ, 643,
730Ebeling, H. 2014, Beyond MACS: A Snapshot Survey of the Most Massive
Clusters of Galaxies at z > 0.5, HST Proposal ID 13671, 22Eckert, D., Ettori, S., Molendi, S., Vazza, F., & Paltani, S. 2013, A&A, 551, A23Gavazzi, R. 2005, A&A, 443, 793Gelman, A., & Rubin, D. B. 1992, Statist. Sci., 7, 457Griffin, M. J., Abergel, A., Abreu, A., et al. 2010, A&A, 518, L3Halverson, N., Lanting, T., Ade, P. A. R., et al. 2009, ApJ, 701, 42Hasselfield, M., Hilton, M., Marriage, T. A., et al. 2013, JCAP, 1307, 008Hoekstra, H., Herbonnet, R., Muzzin, A., et al. 2015, MNRAS, 449, 685Itoh, N., Kohyama, Y., & Nozawa, S. 1998, ApJ, 502, 7Kompaneets, A. 1956, Zh. Eksp. Teor. Fiz., 31, 876Korngut, P. M., Dicker, S. R., Reese, E. D., et al. 2011, ApJ, 734, 10Lee, J., & Suto, Y. 2004, ApJ, 601, L599Mayet, F., Adam, R., Adane, A., et al. 2016, ArXiv e-print
[arXiv:1602.07941]Mazzotta, P., Rasia, E., Moscardini, L., & Tormen, G. 2004, MNRAS, 354, 10Monfardini, A., Benoit, A., Bideaud, A., et al. 2011, ApJS, 194, 24Moreno, R. 2010, Neptune and Uranus planetary brightness temperature
tabulation, Tech. Rep., ESA Herschel Science Center, ftp://ftp.sciops.esa.int/pub/hsc-calibration/PlanetaryModels/ESA2
Muchovej, S., Mroczkowski, T., Carlstrom, J. E., et al. 2007, ApJ, 663, 708Nagai, D., Kravtsov, A. V., & Vikhlinin, A. 2007a, ApJ, 668, 1Nagai, D., Vikhlinin, A., & Kravtsov, A. V. 2007b, ApJ, 655, 98Nord, M., Basu, K., Pacaud, F., et al. 2009, A&A, 506, 623Perrott, Y. C., Olamaie, M., Rumsey, C., et al. 2015, A&A, 580, A95Plagge, T., Benson, B. A., Ade, P. A. R., et al. 2010, ApJ, 716, 1118
Plagge, T. J., Marrone, D. P., Abdulla, Z., et al. 2013, ApJ, 770, 112Planck Collaboration IX. 2011, A&A, 536, A9Planck Collaboration Int. V. 2013, A&A, 550, A131Planck Collaboration VIII. 2014, A&A, 571, A8Planck Collaboration XXIX. 2014, A&A, 571, A29Planck Collaboration XXXII. 2015, A&A, 581, A14Planck Collaboration XIII. 2016, A&A, 594, A13Planck Collaboration XXII. 2016, A&A, 594, A22Planck Collaboration XXIV. 2016, A&A, 594, A24Planck Collaboration XXVII. 2016, A&A, 594, A27Pratt, G. W., Croston, J. H., Arnaud, M., & Böhringer, H. 2009, A&A, 498, 361Pratt, G. W., Arnaud, M., Piffaretti, R., et al. 2010, A&A, 511, A85Puchwein, E., Sijacki, D., & Springel, V. 2008, ApJ, 687, L53Riess, A. G., Strolger, L.G., Casertano, S., et al. 2007, ApJ, 659, 98Sayers, J., Czakon, N. G., Bridge, C., et al. 2012, ApJ, 749, L15Sayers, J., Czakon, N. G., Mantz, A., et al. 2013, ApJ, 768, 177Schwan, D., Ade, P. A. R., Basu, K., et al. 2011, Rev. Sci. Instrum., 82, 091301Sehgal, N., Trac, H., Acquaviva, V., et al. 2011, ApJ, 732, 44Sembolini, F., Petris, M. D., Yepes, G., et al. 2014, MNRAS, 440, 3520Sifón, C., Battaglia, N., Hasselfield, M., et al. 2016, MNRAS, 461, 248Staguhn, J., Allen, C., Benford, D., et al. 2008, J. Low Temperature Phys., 151,
709Sunyaev, R. A., & Zeldovich, Y. B. 1972, Comm. Astrophys. Space Phys., 4,
173Sunyaev, R. A., & Zeldovich, Ya. B. 1980, ARA&A, 18, 537Umetsu, K., Medezinski, E., Nonino, M., et al. 2014, ApJ, 795, 163Vikhlinin, A. 2006, ApJ, 640, 710Vikhlinin, A., Kravtsov, A., Forman, W., et al. 2006, ApJ, 640, 691Voit, G. M. 2005, Rev. Mod. Phys., 77, 207Voit, G. M., Kay, S. T., & Bryan, G. L. 2005, MNRAS, 364, 909Witzel, A., Pauliny-Toth, I. I. K., & Nauber, U. 1979, AJ, 84, 942Yu, L., Nelson, K., & Nagai, D. 2015, ApJ, 807, 12
A110, page 16 of 16