monitoring of particulate pollution through bio …
TRANSCRIPT

[i]
MONITORING OF PARTICULATE POLLUTION THROUGH BIO-MAGNETIC
ASPECTS OF ROADSIDE PLANTS IN AIZAWL, MIZORAM
THESIS SUBMITTED TO MIZORAM UNIVERSITY IN PARTIAL
FULFILMENT FOR THE AWARD OF THE DEGREE OF DOCTOR OF
PHILOSOPHY
IN ENVIRONMENTAL SCIENCE
By
BIKU MONI CHUTIA
(Ph.D Registration No - MZU/ Ph.D/ 571 of 13.05.2013)
DEPARTMENT OF ENVIRONMENTAL SCIENCE
SCHOOL OF EARTH SCIENCES & NATURAL RESOURCES
MANAGEMENT, MIZORAM UNIVERSITY
AIZAWL – 796004
2016

[ii]
DECLARATION
I, Shri Biku Moni Chutia hereby declare that the subject matter of this thesis entitled
“MONITORING OF PARTICULATE POLLUTION THROUGH BIO-MAGNETIC ASPECTS
OF ROADSIDE PLANTS IN AIZAWL, MIZORAM” is the record of work done by me, that
the content of the thesis did not form basis for the award of any previous degree or to
anybody else, and that I have not submitted the thesis in any other University/ Institute for
any other degree.
This is being submitted to the Mizoram University for the degree of Doctor of
Philosophy in the Department of Environmental science.
(Dr. P.K. Rai)
Head Supervisor
Department of Environmental Science Department of Environmental Science
Mizoram University Mizoram University
(Biku Moni Chutia)
Date:
Place: Aizawl

[iii]
DEPARTMENT OF ENVIRONMENTAL SCIENCE
SCHOOL OF EARTH SCIENCE AND NATURAL RESOURCES MANAGEMENT
MIZORAM UNIVERSITY (A CENTRAL UNIVERSITY)
TANHRIL, AIZAWL 796004: MIZORAM, INDIA
Dr. P. K. Rai. Tel.: 0389-2330385(0)
Assistant Professor Email: [email protected]
__________________________________________________________________________________
CERTIFICATE
This is to certify that the thesis entitled “MONITORING OF PARTICULATE POLLUTION
THROUGH BIO-MAGNETIC ASPECTS OF ROADSIDE PLANTS IN AIZAWL,
MIZORAM” submitted by Shri Biku Moni Chutia for the award of degree of Doctor of
Philosophy of the Mizoram University, Aizawl, embodies the record of original investigation
carried out by him under my supervision. He has been duly registered and the thesis
presented is worthy of being considered for the award of the Ph.D. Degree. The work has not
been submitted for any degree of any other University.
(Dr. S. K. Patil) (Dr. P.K. Rai)
Joint Supervisor Supervisor
Indian Institute of Geomagnetism Department of Environmental Science
Allahabad Mizoram University
Head
Department of Environmental Science
Mizoram University
Date:
Place: Aizawl

[iv]
ACKNOWLEDGEMENTS
I express my feelings of gratitude to the Almighty God, for successful completion of this
piece of research work.
I am extremely grateful and deeply indebted to my supervisor Dr. P.K. Rai,
Department of Environmental science, School of Earth Sciences and Natural Resources
Management, Mizoram University, Aizawl, for his valuable guidance, consistent and
stimulating advice, constant encouragement and untiring help throughout the research work.
I express my deep sense of gratitude to my joint supervisor Prof. S.K. Patil, Dr. K. S.
Krishnan Geomagnetic Research Laboratory, Indian Institute of Geomagnetism, Allahabad,
who has been a constant source of inspiration to me.
I am also thankful to Prof. B.P. Mishra (Head, Department of Environmental Science)
and Prof. H Lalramnghinglova (Department of Environmental Science) who have been a
constant source of inspiration to me and also for providing valuable inputs with pleasure, as
and when required. I also thank all the faculty members and non teaching staffs of the
Department of Environmental Science, for their constant support and necessary help during
the tenure of this work.
Thanks are also due to my all friends and research scholars who provided me friendly
atmosphere and helpful attitude at each step of the study in various ways.
Words fail to express my humble gratitude and profound regards to my loving parents
and family members for their affection, encouragement, cooperation and blessing during the
course of this work which have always been a source of inspiration for me.
I also wishes to acknowledge the Department of Biotechnology (DBT), for providing
financial assistance in the form of research project.
Date: (Biku Moni Chutia)
Place: Aizawl

[v]
CONTENTS Page No.
Title page i
Declaration ii
Certificate iii
Acknowledgements iv
Contents v
List of Figures vi
List of Tables vii-viii
List of Photo plates ix
CHAPTER 1 INTRODUCTION 1-18
CHAPTER 2 REVIEW OF LITERATURE 19-47
CHAPTER 3 STUDY AREA AND STUDY SITES 48-54
CHAPTER 4 MATERIAL AND METHODS 55-65
CHAPTER 5 RESULTS AND DISCUSSION 66-89
CHAPTER 6 SUMMARY AND CONCLUSIONS 90-92
REFERENCES
PUBLICATIONS
93-132

[vi]
List of Figures Page No.
Fig. 3.1 Map of the study area, Aizawl, Mizoram, North East India. 50
Fig. 3.2 Mean monthly rainfall (mm), maximum and minimum humidity
(%) & maximum and minimum temperature (°C) at Aizawl during 53
the study period 2012 to 2014.
Fig. 5.1 Concentration of SPM (µg m-3
) at different sites of Aizawl. 68
Fig. 5.2 Concentration of SPM (µg m-3
) at different sites of Aizawl. 68
Fig. 5.3 Concentration of RSPM (µg m-3
) at different sites of Aizawl. 69
Fig. 5.4 Concentration of RSPM (µg m-3
) at different sites of Aizawl. 69

[vii]
List of Tables Page No.
Table 4.1 Vegetation characteristics of common roadside plant species 58
selected for the study.
Table 5.1 The average concentration of two air pollutants (SPM and RSPM) 67
at four different study sites during 2013 - 14.
Table 5.2 The average concentration of two air pollutants (SPM and RSPM) 67
at four different study sites during 2014 - 15.
Table 5.3 Summary of the magnetic data (mean and standard error) for
roadside dusts on different selective plant (tree & shrubs) leaves 73
at Ramrikawn area.
Table 5.4 Summary of the magnetic data (mean and standard error) for
roadside dusts on different selective plant (tree & shrubs) leaves 74
at Tanhril area.
Table 5.5 Summary of the magnetic data (mean and standard error) for
roadside dusts on different selective plant (tree & shrubs) leaves 75
at Zarkawt area.
Table 5.6 Summary of the magnetic data (mean and standard error) for
roadside dusts on different selective plant (tree & shrubs) leaves 76
at Durtlang area.
Table 5.7 Summary of the magnetic data (mean and standard error) for
roadside dusts on different selective plant (tree & shrubs) leaves 77
at Ramrikawn area.
Table 5.8 Summary of the magnetic data (mean and standard error) for
roadside dusts on different selective plant (tree & shrubs) leaves 78
at Tanhril area.
Table 5.9 Summary of the magnetic data (mean and standard error) for
roadside dusts on different selective plant (tree & shrubs) leaves 79
at Zarkawt area.
Table 5.10 Summary of the magnetic data (mean and standard error) for
roadside dusts on different selective plant (tree & shrubs) leaves 80
at Durtlang area.

[viii]
Table 5.11 Correlation between magnetic measurements of Mangifera indica 82
with SPM and RSPM at four different study sites.
Table 5.12 Correlation between magnetic measurements of Artocarpus 83
heterophyllus with SPM and RSPM at four different study sites.
Table 5.13 Correlation between magnetic measurements of Ficus bengalensis 83
with SPM and RSPM at four different study sites.
Table 5.14 Correlation between magnetic measurements of Psidium guajava 84
with SPM and RSPM at four different study sites.
Table 5.15 Correlation between magnetic measurements of Lantana camara 84
with SPM and RSPM at four different study sites.
Table 5.16 Correlation between magnetic measurements of Bauhinia variegata 85
with SPM and RSPM at four different study sites.
Table 5.17 Correlation between magnetic measurements of Cassia auriculata 85
with SPM and RSPM at four different study sites.
Table 5.18 Correlation between magnetic measurements of Hibiscus rosa-sinensis 86
with SPM and RSPM at four different study sites.
Table 5.19 Correlation between magnetic measurements of Ficus religiosa 86
with SPM and RSPM at four different study sites.
Table 5.20 Correlation between magnetic measurements of Bougainvillea 87
spectabilis with SPM and RSPM at four different study sites.

[ix]
Lists of Photo plates Page No.
Plate. 3.1 Different sampling points. 51
Plate. 4.1 Selected plant species for the study. 59
Plate. 4.2 Selected plant species for the study. 60
Plate. 4.3 Selected plant species for the study. 61
Plate. 4.4 Selected plant species for the study. 62
Plate. 4.5 Selected plant species for the study. 63

[1]
CHAPTER - 1
INTRODUCTION
___________________________________________________________________________
1.1 Environment
―Environment‖ is the surrounding which constitutes all the conditions where organisms live
and thus consists of air, water, soil, food and sunlight which are the basic needs of all living
beings and the plant life to carry on their functions. In short, we can say that the environment
consists of both biotic and abiotic substances which create favorable conditions for the
existence and development of living organisms. Environment can be defined in a number of
ways such as:
1. ‗Environment refers to the sum total of conditions which surrounds man at a given point in
space and time‘ (Park, 1980).
2.‗Environment is defined as a holistic view of the world as it functions at any point of time,
with a multitude of spatial elemental and socio-economic systems distinguished by quality
and attributes of space and mode of behaviour of abiotic and biotic forms (Dikshit, 1984).
3. ‗Environment is the sum of all social, economical, biological, physical or chemical factors
which constitute the surroundings of man, who is both creator and moulder of his
environment‘ (Purohit and Ranjan, 2003).
4. ‗Environment is that whole outer physical and biological system in which man and other
organisms live with many interacting components‘ (Santra, 2013).

[2]
1.2 Components of Environment
The entire environment consists of both the biotic (living) and abiotic (non-living)
components of the planet earth. The abiotic environment is subdivided into three broad
categories they are:
(a) Lithospheric component
(b) Hydrospheric component
(c) Atmospheric component
Whereas the biotic component of the environment consists of biosphere including the plant
component, animal (including man as physical man) component and micro-organismic
components.
The entire environment is divided into four segments. These are:
(a) Atmosphere
(b) Hydrosphere
(c) Lithosphere
(d) Biosphere
1.3 Environmental Pollution
Environmental pollution is the unfavourable alteration of our surroundings, wholly or largely
as a by product of man‘s actions, through direct or indirect effects of the changes in the

[3]
energy pattern, radiation levels, chemical and physical constitution and abundance of
organisms. Environmental pollution is a global problem and is common to both developed as
well as developing countries which attracts the attention of human beings for its severe long
term consequences. The decline in environmental quality as a consequence of pollution is
evidenced by loss of vegetation, biological diversity, excessive amount of harmful chemical
in the ambient atmosphere and in food grains, growing risks of environmental accidents and
threat to life support system. Since pollution is viewed from different angles by different
people but it is commonly agreed to be the outcome of urban-industrial and technological
revolution and rapacious and speedy exploitation of natural resources, increased rate of
exchange of matter and energy and ever increasing industrial wastes, urban effluents and
consumer goods. Holdgate (1979), defined environmental pollution as the introduction by
man, into the environment of substances or energy liable to cause interference with legitimate
uses of environment. Singh (1991), has defined pollution in a very simple manner i.e.
‗Disequilibrium condition from equilibrium condition in any system‘. This definition may be
applied to all types of pollution ranging from physical to economic, political, social and
religious pollution. Over past couple of decades, various sources of pollution were identified
that altered the composition of water, air and soil of the environment. The substances, which
cause pollution, are known as pollutants. A pollutant can be any chemical (toxic metal,
radionuclides, organo-phosphorus compound, gases) or geochemical substances (dust,
sediment), biological organism or product, or physical substance (heat, radiation, sound
wave) that is released intentionally by man into the environment with actual or potential
adverse, harmful or unpleasant or inconvenient effects. Such undesirable effect may be direct
(affecting man) or indirect, being mediated via his resource organisms or climate changes.

[4]
Depending on the nature of pollutants and also subsequent pollution of environmental
components, the pollution may be categorized under six major heads such as:
a) Air Pollution
b) Water Pollution
c) Soil/Land Pollution
d) Noise Pollution
e) Radioactive Pollution
f) Thermal Pollution
Among them Air pollution is one of the main type causing a serious problem making threat
to the environment, human, plants, animals and all the living organisms.
1.4 Air Pollution
Air pollution is the introduction of particulates, biological molecules, or other harmful
materials into Earth's atmosphere, causing disease, death to humans, damage to other living
organisms such as food crops, or the natural or built environment. Air pollution may come
from anthropogenic or natural sources (Assadi et al., 2011).
The atmosphere is a complex natural gaseous system that is essential to support life on
planet Earth. Stratospheric ozone depletion due to air pollution has been recognized as a
threat to human health as well as to the Earth's ecosystems.

[5]
1.4.1 Pollutants
An air pollutant is a substance in the air that can have adverse effects on humans and the
ecosystem. The substance can be solid particles, liquid droplets, or gases. A pollutant can be
of natural origin or man-made. Pollutants are classified as primary or secondary. Primary
pollutants are usually produced from a process, such as ash from a volcanic eruption. Other
examples include carbon monoxide gas from motor vehicle exhaust, or the sulfur dioxide
released from factories. Secondary pollutants are not emitted directly. Rather, they form in
the air when primary pollutants react or interact. Ground level ozone is a prominent example
of a secondary pollutant. Some pollutants may be both primary and secondary: they are both
emitted directly and formed from other primary pollutants.
Major primary pollutants include:
Sulfur oxides (SOx),Nitrogen oxides (NOx), Carbon monoxide (CO), Volatile organic
compounds, Particulates,Toxic metals, Chlorofluorocarbons (CFCs), Ammonia (NH3)
and Radioactive pollutants etc.
Secondary pollutants include:
Photochemical smog, Ozone (O3) and Peroxyacetyl nitrate (PAN) etc.
Minor air pollutants include:
A large number of minor hazardous air pollutants, A variety of persistent organic
pollutants, which can attach to particulates.

[6]
1.4.2 Sources
There are various locations, activities or factors which are responsible for releasing pollutants
into the atmosphere. These sources can be classified into two major categories.
1.4.2.1 Natural sources
Dust from natural sources, usually large areas of land with few or no vegetation.
Methane, emitted by the digestion of food by animals, for example cattle.
Radon gas from radioactive decay within the Earth's crust. Radon is a colorless, odorless,
naturally occurring, radioactive noble gas that is formed from the decay of radium. It is
considered to be a health hazard. Radon gas from natural sources can accumulate in
buildings, especially in confined areas such as the basement and it is the second most
frequent cause of lung cancer, after cigarette smoking.
Smoke and carbon monoxide from wildfires.
Vegetation, in some regions, emits environmentally significant amounts of VOCs on
warmer days. These VOCs react with primary anthropogenic pollutants—specifically,
NOx, SO2, and anthropogenic organic carbon compounds — to produce a seasonal haze
of secondary pollutants. Black gum, poplar, oak and willow are some examples of
vegetation that can produce abundant VOCs. The VOC production from these species
result in ozone levels up to eight times higher than the low-impact tree species.
Volcanic activity, which produces sulfur, chlorine, and ash particulates.

[7]
1.4.2.2 Anthropogenic (man-made) sources
These are mostly related to the burning of multiple types of fuel.
Stationary sources include smoke stacks of power plants, manufacturing facilities
(factories) and waste incinerators, as well as furnaces and other types of fuel-burning
heating devices. In developing and poor countries, traditional biomass burning is the
major source of air pollutants; traditional biomass includes wood, crop waste and dung.
Mobile sources include motor vehicles, marine vessels, and aircraft.
Controlled burn practices in agriculture and forest management. Controlled or prescribed
burning is a technique sometimes used in forest management, farming, prairie restoration
or greenhouse gas abatement. Fire is a natural part of both forest and grassland ecology
and controlled fire can be a tool for foresters. Controlled burning stimulates the
germination of some desirable forest trees, thus renewing the forest.
Fumes from paint, hair spray, varnish, aerosol sprays and other solvents.
Waste deposition in landfills, which generate methane. Methane is highly flammable and
may form explosive mixtures with air. Methane is also an asphyxiant and may displace
oxygen in an enclosed space. Asphyxia or suffocation may result if the oxygen
concentration is reduced to below 19.5% by displacement.
Military resources, such as nuclear weapons, toxic gases, germ warfare and rocketry.

[8]
1.5 Particulate matter (PM)/Dust pollution
PMs are a mixture of particles and droplets in the air, consisting of a variety of components
such as organic compounds, metals, acids, soil, and dust (U.S. Environmental Protection
Agency 1996; Ciencewicki and Jaspers, 2007). PM is one of six ‗criteria pollutants‘
designated by the US Clean Air Act of 1971 (Wilson et al., 2005). PM has been widely
studied in recent years and the United Nation estimated that over 600 million people in urban
areas worldwide were exposed to dangerous levels of traffic generated air pollutants
(Cacciola et al., 2002).
PM is either directly emitted into the atmosphere from various natural and anthropogenic
sources, or can be formed from gases through chemical reactions. Particulate matter air
pollution is derived from vehicle emissions, forest fires, industrial, domestic and agricultural
pollutants. A wide range of natural and anthropogenic emission sources contribute to
particulate matter concentrations in the atmosphere such as windblown soil dust, marine and
biogenic aerosol, road traffic and off-road vehicles, stationary combustion processes,
industrial and construction processes, and combustion of agricultural waste (El-Fadel and
Massoud, 2000). Fine particles are characterised by their etiology, their ability to remain
suspended in the air and to carry material which is absorbed on the surface. The smaller the
particle diameter, the longer it remain suspended in the air and the more hazardous it is.
Particulate matters (PMs) can be classified as coarse, fine and ultrafine depending upon their
particle size. PMs measured in urban air used in health effects studies and for regulation are:
• Nuclei mode (smaller than 0.1 μm), often referred to as ultrafine particles (UFPs); they do
not last long in the air since they deposit or rapidly form fine particles by coagulation.
[9]
• Accumulation mode (between 0.1 and approximately 1.0–2.5 μm) account for the majority
of the mass of suspended particles and deposit slowly leading to a long atmospheric life time
of 5 to 10 days and the build-up of visible haze. These particles may readily penetrate indoor
spaces and are most strongly linked to adverse health effects.
• Coarse mode (larger than 1 μm), which extends upto 100 μm; they deposit relatively
quickly with a lifetime of less than 2 days. (Robert et al., 2003).
Atmospheric PM with aerodynamic diameter <10mm (PM10) or <2.5m (PM2.5) are of
considerable concern for public health (Schwartz et al., 1996; NEPC, 1998; Beckett et al.,
1998 ; Borja-Aburto et al., 1998 ; Prajapati and Tripathi, 2008 a-b ; Rai, 2013, 2015). The
ultrafine particles with typical dimension of nanometre-length scale are most hazardous
(Wahlin et al., 2006) as it causes several life threatening diseases of varying dimension
(Samet et al., 2000; Veranth et al., 2003; Brook et al., 2004; Wahlin et al., 2006; Rai, 2015).
Ultrafine particles are responsible for the bulk of adverse health effects associated with
particles in ambient air (Penttinen et al., 2001; Rai, 2013, 2015). Ultrafine PM is more potent
than fine or coarse PM towards inducing cellular damage (Le et al., 2002) and also passes
rapidly into the circulatory system (Nemmar et al., 2001). Suspended particulate matter
(SPM) is of the greatest concern as it contributes 50% to total air pollution and causes
respiratory disorders in human beings on prolonged exposure (Freer-Smith et al., 2004) as it
include all airborne particles in the size range of 0.5µ to 100µ. Its effects attributed to mild
eye irritation, mortality. Sirajuddin and Ravichandran (2010) also studied SPM related
respiratory disorders such as nose block, sneezing, cough and hyperacidity in Tiruchirappalli,
India. Bhattacharjee et al., 2012, noted that PMS<4.6 µm and PMS<1.1 µm are hazardous to
human health due to its capacity to be inhaled into the bronchial region and deposited in the

[10]
alveolar region. Epidemiologic findings suggest that short term particulate matter (PM)
exposure can trigger acute or terminal health events whereas long term particulate matter
(PM) exposure however could promote life shortening chronic illness. Additional evidence
suggests that PM exposure over time can alter lung function, lung tissue and structure, air
way responsiveness and respiratory defence mechanisms and can increase susceptibility to
respiratory infection and damage respiratory cells (EPA, 1996 and 1997).
A second major concern is the ability of airborne particles to impact climate through
absorption or scattering of solar radiation (Charlson et al., 1992; Haywood and Shine, 1995;
Schwartz, 1996), alteration of cloud properties (Charlson et al., 1992; Jones et al., 1994;
Boucher and Lohmann, 1995; Haywood and Boucher, 2000) and decreasing surface albedo
after deposition to snow and ice (Hansen and Nazarenko, 2004; Jacobson, 2004; Roberts and
Jones, 2004). With an atmospheric residence time ranging from days to weeks, particulate
matter is not only a local concern but a global one, the generation of pollutants in one region
impacting the air quality of another. There may be several kinds of airborne particulate such
as dust, smoke, fume, mist, fog, smog, haze etc.
Dust causes some of the highest concentrations of ambient primary PM in many areas
around the globe. Environmental contamination and human exposure with respect to dust
pollution have dramatically increased during the past ten years (Faiz et al., 2009).Solid
matter, which is composed of soil, anthropogenic metallic constituents, and natural biogenic
materials, is called dust/particulate (Ferreira-Baptista and DeMiguel, 2005; Fathi and Clare,
2011; Rai, 2013). The particles of dust that deposit from the atmosphere and accumulate
along roadsides are called road dust particles and originate from the interaction of solid,
liquid and gaseous metals (Akhter and Madany, 1993; Faiz et al., 2009; Fathi and Clare,

[11]
2011, Rai, 2013). According to an estimate, dust pollution comprises around 40% of the total
air pollution problem in India (Khan et al., 1989; Rai et al., 2014 ).
Dust pollution in the atmosphere, particularly of pollutant particles below 10 µm (PM10),
is of current concern worldwide due to adverse health effects associated with their inhalation
(Morris et al., 1995; Oberdorster, 2000; Pope et al., 2004; Calderon-Garciduenas et al., 2004;
Faiz et al., 2009; Rai, 2011a, 2011b, 2013, 2015). Moreover, PM in dust is thought to be the
most harmful pollution component widely present in the environment (Bealey et al., 2007;
Rai, 2013). Further, the implication of the intake of dust particles with high concentration of
heavy metals poses potentially deleterious effects on the health of human beings (Faiz et al.,
2009; Fathi and Clare, 2011).
1.6 Biomonitoring of air pollution
In view of abovementioned detrimental impacts of PM, it is quite obvious to investigate the
feasible and eco-sustainable green technologies of its determination. Although, there are
many conventional (physical and chemical) devices are discussed for the assessment of air
pollution, however, biomonitoring is an efficient tool in urban areas (Rai, 2013). Biological
monitors are organisms that provide quantitative information on some aspects of the
environment, such as pollutant load in the atmosphere. In this regard, the air cleansing
capacity of urban trees presents an alternative approach to foster an integrated approach to
the sustainable management of urban ecosystem (Rai, 2013). Lichens, bryophytes or mosses
and certain conifers are proved to be potent biomonitoring tool of air pollution in recent
times. However, in urban and peri-urban regions higher plants are mostly suitable for
monitoring of dust or PM pollution (Faiz et al., 2009; Rai, 2013). Further, urban trees and
[12]
shrubs planted in street canyons proved to be efficient dust capturing tools (Moreno et al.,
2003; Urbat et al., 2004; Rai and Panda, 2014). Spreading widely in urban areas and easily
collected, tree leaves could improve the scanning resolution in the spatial scale (Mitchell et
al., 2010; Gang et al., 2013). Because of quick, economical, sensitive, efficient and non-
destructive features of environmental magnetism measurements, the magnetic properties of
tree leaves as proxy in monitoring and mapping of PM pollution have shown increasing
attention during recent past (Gang et al., 2013, Rai et al., 2014). Moreover, tree leaves are
efficient passive pollution collectors, as it provides a large surface area for particle
deposition, a large number of samples and sampling sites and requires no protection from
vandalism (Sant‘Ovaia et al., 2012). Therefore, urban angiosperm trees offer positive
biological, ecological and aerodynamic effects in comparison to lower group of plants
(Moreno et al., 2003; Urbat et al., 2004; Rai, 2013).
Biomagnetic monitoring with the urban roadside tree leaves, is found to be fruitful in the
area of PM pollution science. The concept of environmental magnetism as a proxy for
atmospheric pollution levels was reported by several researchers based on analysis of soils,
street or roof dusts (Hay et al., 1997; Hoffmann et al.,1999; Xie et al., 2000, 2001),
vegetation samples including tree bark samples etc (Kletetschka et al., 2003; Urbat et al.,
2004). However, researchers have emphasized and demonstrated the usefulness of plant
leaves in monitoring the dust or PM (Matzka and Maher,1999; Moreno et al., 2003;
Jordanova et al., 2003; Urbat et al., 2004; Pandey et al., 2005; Maher, 2009). Maher and her
group are leading in performing a cascade of magnetic studies in relation to the
environmental pollution, thus extending it to a specialized sub-discipline of environmental
geomagnetism (Matzka and Maher, 1999; Maher et al., 2008). Thus, in view of this,

[13]
magnetic biomonitoring studies of roadside plant leaves are performed in Singrauli and
Varanasi region of India (Pandey et al., 2005), in some cities of Portugal and hilly areas of
Nepal etc. (Gautam et al.,2005). Additionally, a series of works in European countries is
conducted as described elsewhere (e.g., Matzka and Maher, 1999; Maher, 2009).
The particles of dust that deposit from the atmosphere and accumulate along roadside are
called road dust particles which originate from the interaction of solid, liquid and gaseous
metals (Rai, 2013). Since the roadside vegetation obviously comes into direct contact with
particulates, irrespective of the sources. Therefore, investigation carried out with tree/plant
leaves provide an impetus in such environmental studies (Faiz et al., 2009). However, the
diversity of plants is investigated for the biomagnetic monitoring potential. Moreover, this
study is limited mostly to the plants prevailing in temperate conditions, and therefore, quest
is there to investigate it in context of tropical plants. Moreover, advancement in
instrumentation or methodology in magnetic studies may improve the understanding of this
research field (Rai, 2013).
1.7 Biomagnetic monitoring of particulates through roadside plant leaves
The concept of environmental magnetism as a proxy for atmospheric pollution levels has
been reported by several researchers based on analysis of soils and street or roof dust (Hay et
al., 1997; Hoffmann et al., 1999; Shu et al., 2000; Xie et al., 2000; Gautam et al., 2005;
Jordanova et al., 2003; Urbat et al., 2004), and vegetation samples including tree bark
(Kletetschka et al., 2003; Urbat et al., 2004), however, a cascade of researches have
emphasized the use of plant leaves in monitoring the dust (Matzka and Maher, 1999; Moreno
et al., 2003; Jordanova et al., 2003; Urbat et al., 2004; Pandey et al., 2005; Maher et al.,

[14]
2008; Maher, 2011; Rai, 2011b). Maher and her group were the leading ones in performing a
cascade of magnetic studies in relation to environment, thus extending it into specialized
discipline i.e. environmental geomagnetism (Maher, 1998 a,b; Maher and Dennis, 2001).
The fact that magnetic biomonitoring studies of plant leaves may act as proxy of ambient
particulate pollution is well proved now and also emphasized at several places in this review.
In conjunction with our small discussion on the advantages of biomonitoring through
magnetic properties in earlier section, it is worth to mention that magnetic biomonitoring of
pollutants by measurements taken from roadside tree leaves is potentially efficient, as
samples are abundant and hundreds of samples can be collected and analysed within few
days (Rai, 2011b). Leaves with large surface areas per unit of weight, favourable surface
properties (a waxy coating), and a long lifespan, such as conifer needles or evergreen tree
leaves, are considered to be good accumulators of PM from the atmosphere (Freer-Smith et
al., 1997; Alfani et al., 2000). Leaves are potentially efficient receptors and biomonitors of
particulate pollution, as they provide a large total surface for particle collection, numbers of
samples and sample sites can be high (i.e. hundreds), and, in pollution contexts, the leaves
themselves are insignificantly magnetic. Further, tree leaves also preclude sampling problems
associated with the use of artificial particle collectors (including power requirements).
Moreover, magnetic techniques are sensitive and rapid (e.g. Matzka and Maher, 1999;
Muxworthy et al., 2003; Maher et al., 2008; Szonyi et al., 2008; Hansard et al., 2011).
Magnetic measurements of leaves from several deciduous species can be inter-calibrated
(Mitchell et al., 2010), optimizing sampling density and resultant spatial resolution of the
proxy PM10 data.

[15]
Thus, in view of this, magnetic biomonitoring studies of roadside plant leaves were
performed in Singrauli Industrial region (Pandey et al., 2005) and hilly areas of Nepal
(Gautam et al., 2005), in addition to a series of pioneer works in European countries by a few
group led by Professor B.A. Maher (e.g. Matzka and Maher, 1999; Maher, 2009).
Magnetic properties of leaves (Muxworthy et al., 2003; Moreno et al., 2003; Urbat et al.,
2004; Pandey et al., 2005; Maher et al., 2008; Mitchell and Maher, 2009; Maher, 2009) have
been used to identify the spread of pollution derived from vehicular emission.
Therefore, the biomagnetic monitoring, using tree leaves as sampling surfaces, can
generate high spatial-resolution PM10 proxy data (Hansard et al., 2011). Strong correlation
has been demonstrated between magnetic properties i.e. leaf saturation remanent
magnetization (SIRM) and/or magnetic susceptibility (χ) values and the amount of PM/dust
on the leaf surface (e.g. Halsall et al., 2008; Maher et al., 2008; Szonyi et al., 2008; Hansard
et al., 2011). Correlations between magnetic parameters of plant leaves and toxic metals,
such as lead, zinc and iron, have also been investigated (e.g. Lu and Bai, 2006; Maher et al.,
2008; Morton-Bermea et al., 2009; Hansard et al., 2011). Also, studies (Shu et al., 2001;
Muxworthy et al., 2003; Saragnese et al., 2011) have found correlations between magnetic
properties and levels of pollution (i.e., PM10 concentration and heavy metals).
While comparing the meteorological data and pollution data with reference to magnetic
properties of urban particulates, Muxworthy et al. (2001), found that the magnetic hysteresis
parameters generally had a stronger correlation with the meteorological data than with the
pollution data.

[16]
Moreover, biomagnetic monitoring approach may provide a robust means to achieve
measurement and sourcing of PM10 at unprecedented levels of spatial resolution and is
applicable all around the world (Maher, 2009) (e.g. Shu et al., 2001, in China; Gautam et al.,
2005, in Nepal; Pandey et al., 2005, in India; Chaparro et al., 2006, in Argentina; Kim et al.,
2007, in Korea; Szonyi et al., 2008, in Europe). Magnetic biomonitoring (Matzka and Maher,
1999; Maher, 2009) seems to be a valuable means both to gain significantly enhanced spatial
resolution for pollutant data, and test proposed particulate source or health linkages.
In general, the magnetic properties of roadside tree leaves is greater when compared to
those lying within the city centre, as demonstrated in case of birch leaves (Matzka and
Maher, 1999). Several studies have investigated the biomonitoring of PAH (Lehndorff and
Schwark, 2004; Lehndorff et al., 2006; Lehndorff and Schwark, 2009) and trace
element/heavy metals (Lehndorff and Schwark, 2008) in particulates through the study of
magnetic properties in pine trees. Strong correlation between the magnetic susceptibility of
pine needles and their metal (Fe) content has been demonstrated due to deposition of fly ash
particles (Schadlich et al., 1995; Maher et al., 2008). A significant correlation was identified
by Maher et al. (2008) between lead, iron and leaf magnetic values in their study on PM.
1.8 Scope of the study
Rapid urbanization and continuously expanding population in and around Aizawl city, India
have caused rapid increase in motor vehicles, which perhaps increases the particulate matters
in the atmosphere of Aizawl. Aizawl district is located in an Indo-Burma hot spot region is
connected to the National Highway road (NH 54;Pushpak) passing through the Airport,
Silchar, Shillong and finally to Guawahati which harbours heavy vehicular fleet. Therefore,
[17]
vehicular pollution is possibly a primary contributor of particulates, specifically respirable
particulate matter (RSPM), having human health implications. A preliminary study in Aizawl
(Lalrinpuii and Lalramnghinglova, 2008) shows a higher level of suspended particulate
matter (SPM) and respirable particulate matter (RSPM). Further, PM below the size of 10
µm (PM10), are specifically hazardous to human health (Saldiva et al., 2002), therefore their
monitoring is pertinent at least in this regions.
Apart from vehicular dust, the anthropogenic sources viz., soil erosion; mining and stone
quarrying activities are important sources of air pollution prevailing in peri-urban and rural
regions of Aizawl (Rai et al., 2014). Furthermore, increasing, airborne dust particles emitted
from geologic media pose threats to human health and the environment (Faiz et al., 2009).
Since the rocks of Aizawl are very fragile, the weathered rock dust may also be deposited on
plant leaves. In India, several researches demonstrated significant correlation between
magnetic parameter and PM (Pandey et al., 2005; Prajapati et al., 2006), however, they
analyzed only one magnetic parameter, i.e., isothermal remanent magnetization (IRM).
However, the present study is intended with three important parameters, i.e., magnetic
susceptibility, ARM and SIRM as to provide an accurate and useful correlations. Therefore,
present study aims to investigate the magnetic properties of ten roadside plant leaves at four
spatially distant sites in order to compare their capability to accumulate particulates and to
establish the relationship between magnetic properties and ambient PM.

[18]
1.8 Objectives
(1). To evaluate particulate matter at selected sites in Aizawl.
(2). To measure quality of particulates matter captured on leaves of selected roadside
plants in Aizawl.
(3). To correlate ambient PM with magnetic properties of leave content.

[19]
CHAPTER- 2
REVIEW OF LITERATURE
___________________________________________________________________________
Air pollution is a serious problem all over the world which causes adverse impact on human
health (Rai, 2015) and other living beings. Particulate Matter (PM2.5, PM10), Ozone (O3),
Lead (Pb), Carbon Monoxide (CO), Benzene (C6H6), Nickel (Ni), Sulphur Dioxide (SO2) and
Nitrogen Dioxide (NO2) are some of the parameters which have significant impact on
environmental pollution (Dohare and Panday, 2014).
Prakash and Punyaseshudu (2015), investigated variations of SO2, NO2, SPM and RSPM
since 5 years during summer and winter seasons in Agra. For this reason, data of daily air
pollutants from four pollution monitoring stations i.e., Taj Mahal, Itam-ud-daulah, Rambagh
and Nunhai areas in Agra were analyzed. The concentrations of these parameters were
monitored by continuous monitoring equipment for a period of five years (from 2010 to
2014). There were significant monthly variations in concentrations of air quality parameters.
Analysis showed that SO2 and NO2 levels are less compared to RSPM and SPM pollutants
which are in acceptable limits of NAAQS standards, whereas RSPM and SPM levels
exceeded the standards of NAAQS at all monitoring stations. It was also observed that the
pollutant concentrations are high in all years of winter season compared to summer season
due to stable atmospheric conditions. Also high concentrations of NO2, RSPM and SPM
pollutants were observed in Rambagh and Nunhai stations as compared to Taj Mahal and
Itam-ud-daulah stations.

[20]
The study of Kamath and Lokeshappa (2014), presented the data of the ambient air
quality status of residential, industrial and sensitive areas of Bangalore. SO2, NOX and RSPM
were collected over six sites in Bangalore. It has been observed (Kamath and Lokeshappa,
2014) that the concentrations of the pollutants are high in summer in comparison to the pre
monsoon and post monsoon seasons. From their study, it was observed that the RSPM levels
at all selected sites exceeds the prescribed limits as stipulated by Central Pollution Control
Board (CPCB) New Delhi. A part from this the SO2 and NOX levels in industrial areas
remain under prescribed limits of CPCB.
Kapoor et al. (2013) calculated the mean concentrations of SO2, NO2, SPM and RSPM in
urban, industrial and forest areas of Udaipur for two years i.e. from September, 2010 to
August, 2012. Rajpura Dariba mines, Hindustan Zinc Smelter, Debari, Madri Industrial Area
and Sukher are some places of Udaipur which was selected for Sampling. Minimum three
recording was taking out in a day i.e. morning, noon and evening hours and polythene bags
were used for bring the samples to laboratory. The concentration of NOx was measured by
modified Jacob and Hochheiser while SOx was measured by Modified West and Gaeke
method. CO was measured by carbon monoxide analyser and particulate matter was
measured using filter paper. It has been observed that concentration of suspended particulate
matter (SPM) ranges between 118.39 (rainy season) to 528.56 (summer season) μg/m3. SO2
ranges between 6.29 (rainy season) to 68.27 (winter season) μg/m3 , NO2 ranges between
4.33 (rainy season) to 42.09 (winter season) μg/m3 and CO between 304.62 (rainy season) to
1620.54 (winter season) μg/m3 during the study period.
Khandbahale and Saler (2013), determined the levels of pollutants like SOX, NOX and
SPM on three representative sites viz. Industrial (I), Commercial(C) and Residential(R) of
[21]
Nashik city. The selected sites for Ambient Air Quality Monitoring were places of maximum
pollution and heavy traffic. A continuous sampling had been carried out at all three sites. Site
1:- VIP Company, MIDC areas, Satpur, Nashik: this site represents the industrial site. Site 2:-
RTO colony tank, Pandit colony, Nashik: this site represents the residential area. Site 3:-
NMC building, min road, Nashik: this site represents the commercial area. All the sites have
two way traffic system, open loop signal control and high vehicle density. Level of SPM
crossed the limit at all the sites but SOX and NOX were not exceeded the limit at all sites.
Harikrishnan et al. (2012) studied the ambient quality of air in Hosur, Tamil Nadu. Under
the provision of the Air Act, 1981, the CPCB has introduced 4th version of National Ambient
Air Quality Standard (NAAQS-2009). The aim of this revised national standard is to provide
uniform air quality for all. There are 12 identified health based parameter which are to
measure at national level. Three locations nearby Hosur Bus Stand, nearby SIPCOT II and
nearby Gandhi road were selected for monitoring. These locations cover the major part of the
Hosur where the busy roads meet and bus terminals through they are receiving higher
emissions. The results showed that PM10 concentration varies between 45-127 μg/m3 where
PM2.5 concentration was higher at all three locations. This value are higher than the 24 hrs
PM10 (100 μg/m3) and around higher than 24 hrs PM2.5 (60 μg/m
3) National Ambient Air
Quality Standard prescribed by the CPCB of India.
Balashanmugam et al. (2012) studied the quality of ambient air of Puducherry, India. For
ambient air quality monitoring eight sites were selected which have heavy traffic and
commercial areas. SPM, NO2, SOX, and CO are the parameter for which continuous sampling
has been carried out and sites of monitoring were indira Gandhi signal (1), Rajiv Gandhi
signal (2), Bus stand (3), Kanniyakoil (4), Nehru street (5), Tindivanam high road (6),

[22]
Cuddalore main road (7), Muruga theatre junction (8). Monitoring of particulates was done
by ―High Volume Sampler‖. Wattman filter paper GF/A (20.3cmX 25.4cm) of HVS was kept
at 15-34oC, 50% relative humidity for 24 hr and weighed. The filter paper was placed in HVS
on the filter holder and air was drawn through a 410 cm2 portion of the filter at a flow rate of
1.80 LPM (liquid flow rate) . The filter paper was removed after sampling and weighed. The
mass concentration of particulate expressed in μg/m3 and was calculated by measuring the
mass of particulates collected and the volume of air sampled. For the monitoring of nitrogen
oxides ambient air was continues drawn at a rate of 2 LPM through 35 ml of sodium
hydroxide solution for 8 hr and Jacobs and Hochhesier method was used for estimation of
NOX. In the case of SOx tetrachloromercurate solution was used and ambient air was
continuous drawn at a rate of 1.5 LPM for 8 hour through it. SPM concentration exceeded the
limit at all the eight sampling sites. CO concentration crossed the limit at seven sites out of
eight sites. SO2 was within limit at all eight sites. NO2 level crossed the limit at all eight sites.
Rohtak city is located at 70 km from Delhi having an area of 441100 hac. Six sites of
sampling which are University campus, Delhi bye pass, Medical mor, New bus stand,
Bhivani stand and Hissar rod. Ambient Air Quality monitoring was done using ―High
Volume Sampler‖(Envirotech APM-415-411), 8 hour daily for suspended particulate matter
and 4 hour daily for gaseous pollutants with a frequency of once in a week in winter, summer
and monsoon. The work of Shukla et al. (2010) showed variation in the pollutant level during
winter, summer and monsoon season in the city. The concentrations of SO2 at University
campus, Hissar road, Medical mor, New bus stand, Delhi bye pass and Bhiwani stand were
12.97, 32.03, 20.08, 22.68, 18.43 and 28.59 μg/m3 in summer; 14.00, 38.52, 24.68, 22.13,
29.35 and 38.38 μg/m3 in winter; and 9.25, 29.39, 17.62, 21.38, 18.41 and 27.21 μg/m
3 in

[23]
monsoon seasons respectively. The levels of SO2 were below the permissible limit (80
μg/m3) as prescribed by NAAQS in all the three seasons at all six sites. SO2 was found to be
minimum at University campus in monsoon season and maximum in winter season at Hissar
road (Shukla et al., 2010). The concentrations of NO2 at University campus, Hissar road,
Medical mor, New bus stand, Delhi bye pass and Bhiwani stand were 42.59, 117.90, 79.99,
81.54, 86.26 and 118.35 μg/m3 in winter; 40.02, 113.73, 79.13, 75.41, 84.36 and 105.14
μg/m3 in summer and 37.59, 93.75, 54.04, 70.24, 63.53 and 89.90 μg/m
3 in monsoon seasons
respectively . NO2 level exceeds the prescribed NAAQS (80 μg/m3 ) at New bus stand, Delhi
bye pass, Bhiwani stand and Hissar road in winter, at Delhi bye pass, Bhiwani stand and
Hissar road in summer and at Bhiwani stand and Hissar road in monsoon season. NO2 level
remains within safety limit (Shukla et al., 2010) at Medical mor and University campus in all
the three seasons. The mean NO2 concentration was observed minimum at University
campus in monsoon season and maximum at Bhiwani stand in winter season. The mean
values of SPM at University campus, Hissar road, Medical mor, New bus stand, Delhi bye
pass and Bhiwani stand were 354.93, 1216.37, 704.56, 686.86, 678.70 and 1025.39 μg/m3 in
summer; 404.54, 1310.76, 757.22, 756.87, 771.44 and 1146.13 μg/m3 in winter and 245.14,
915.91, 593.86, 607.12, 414.72 and 785.74 μg/m3 in monsoon seasons respectively. SPM
was found to be lowest at University campus in monsoon season and highest at Hissar road in
winter season. The level of SPM was observed above the safety limit (Shukla et al., 2010) in
all the three seasons at all the sites, except University campus in monsoon season.
The study of Meena et al. (2012) presented the data of the ambient air quality status of
residential area of Himalayan region viz. Garhwal (New Tehri) and Kumaon (Muktheshwar)
in state of Uttarakhand India. There were two manual station set up at both the place New

[24]
Tehri and Muktheswar. 24 hourly monitoring was carried out at each station and ambient air
quality was monitored in two phases. First one was on December 2010 and second one on
June 2011. Respirable dust sampler (APM- 460NL)/High Volume Sampler was used for
monitoring of ambient air. Suspended particulate matter collected on EPM 2000 filter paper
for 8 hr and gaseous sampling was conducted for 4 hr in respective of absorbing media. After
the sampling following results were obtained: The concentration of various pollutants like
PM10, SOX, NOX, Benzo(a) Pyrene, Benzene, Toluene, Lead and Nickel in μg/m3 were 15,
6.5, 6, 0.5,BDL, BDL, BDL, BDL at southy coat New Tehri, 27, 8, 6.25, 0.6, BDL, BDL,
BDL, BDL at THDC, new Tehri,10, 4, 7, 1.15, at Hotel Krishna and 23, 4, 6.5, 0.2, BDL,
BDL, BDL, BDL respectively for phase one. In phase І all the pollutants were within the
limits as per (NAAQS-2009). In phase II monitoring the concentration of various pollutants
like PM10, SOX, NOX, Benzo (a) Pyrene, Benzene, Toluene, Lead and Nickel in μg/m3 were
22, 4, 10, BDL, BDL, BDL, BDL, BDL at Southey coat New Tehri, 32, 4, 5, 1.5, BDL, BDL,
BDL, BDL at THDC, New Tehri and 23, 4, 12, 1.5, BDL, BDL, BDL, BDL, at Mukteshwar
respectively. The phase II monitoring was carried out in only 3 places instead of 4 places. In
phase two monitoring it was found that all the parameters were within the limits of NAAQS-
2009.
Kumar et al. (2011) made an attempt to express the Ambient Air Quality of Jaipur city in
the form of Air Quality Index (AQI). For Ambient Air Quality monitoring twelve sites in
residential, industrial and commercial areas of the city were selected. The study was carried
out to evaluate Suspended Particulate Matter (SPM), Respirable Suspended Particulate
Matter (RSPM), sulphur dioxide (SO2) and oxides of nitrogen (NOx) by sampling for a
period of 24 hrs in winter season of the year, 2009-2010. The results showed that SPM
[25]
concentrations in the area of study were varied between maximum i.e. 854.33 μg/m3 and
minimum i.e. 79.81 μg/m3. RSPM in the study area ranges between maximum of 340.85
μg/m3 and minimum of 46.64 μg/m
3. This exceeds the CPCB prescribed values except Tilak
Nagar. Sulphur dioxide in the study areas ranged between the minimum value i.e.11.67
μg/m3 and maximum value i.e. 39.76 μg/m
3. Oxides of nitrogen in the study area ranged
between maximum of 61.86 μg/m3 and minimum of 16.55 μg/m
3. The Air Quality Index
values in the study areas vary between maximum of 102.71 and minimum of 52.04. The
results of air quality monitoring show that the pollution concentrations were highly variable
at different sampling sites. Particulate pollutants concentration exceeded the permissible
standards in all sites except Tilak Nagar. The concentrations of gaseous pollutants were
observed to be within permissible limits in all the sites.
The ambient air quality of Pune city was carried out at selected location. Three locations
SNDT college (karve road), Swargate (Jedhe Chowk) and Deccan (karve road) were selected.
The selection of sites was based on the traffic density, pollution status and traffic
congestions. The frequency of sampling was once in a week for six month i.e. from June
2006 to November 2006. The sampling was done at a height 10 m above road level. About
22 samples were collected from each sampling location i.e. total 66 number of samples. The
sampling was done using calibrated Respirable dust sampler (RDS) (Envirotech model APM
460 BL) with a flow rate of 1.1m3/min equipped with glass fiber filter paper (whatmann 41
GF/A). The parameters were lead oxide and particulate matter with size less than 10 micron
(PM10). The PM10 was monitored for 12 hrs and analyzed gravimetrically. Lead oxide
concentration was determined spectrophotometrically (AAS). The average level of PM10 and
lead oxide were 120.35 μg/m3 and 0.65 μg/m
3 respectively. The results showed that lead

[26]
oxide concentration was decreased and well within the ambient air quality standard of
0.75μg/m3 where as the PM10 concentration was very high as compare to 60 μg/m3 of
standard. (Gidde, 2007).
The research of Bhuyan et al. (2010) showed the use of Air Quality Index (AQI)
describing air pollution in Choudwar area of Cuttack district. AQI was computed for ten
sampling station in the choudwar area within the radius of 10kms from core zone. Agrahat
(1), Nergundi Railway station (2), Narapada (3), Kapeleshwar (4), Khutuni (5), Ghantikhal
(6), Near arati steel (7), Dautatabad(8), Kayalapada(9) and Gurudijhatia (10) are ten sites
selected for air sampling. Out of these four stations (4, 5, 6, 7) are located in industrial belt
and other six stations are located in rural area. During the study period SPM was found to be
minimum (102.2 μg/m3) at rural area i.e. site 3 in monsoon 2007 and maximum at industrial
area i.e. site 4 in post monsoon 2007 and pre monsoon 2008. NO2 was found to be minimum
(12.8 μg/m3) at rural area i.e. site 3 in pre monsoon 2007, 2008 and maximum (38.3 μg/m
3)
at industrial site i.e. site 6 in post monsoon 2008. SO2 was found to be minimum (0.8 μg/m3)
at rural area i.e. site 1 in pre monsoon 2007 and maximum (8.4 μg/m3) at industrial area i.e.
site 4 in post monsoon 2007, 2008. The average value of AQI at site 1, 2, 4,5,6,7 and 8 are
53.3, 57.7, 57.6, 69.0, 68.7, 70.9 and 53.6, respectively which shows Moderate air pollution
and at site 3, 4 and 5 are 44.4, 49.7 and 48.6 which shows light air pollution.
Prakash and Bassin (2010), analyzed the status of ambient air in Delhi city by employing
the Air Quality Index (AQI). 24 hourly average concentrations of four major pollutant such
as SPM, RSPM, SO2 and NO2 were analyzed at three different locations (industrial at
Mayapuri, commercial at town Hall and Residential at Sarojini ) for a year 2009. Sampling
was carried out using HVS and RDS at the flow rate of 0.8-1.3 m3/min. average

[27]
concentration of SPM at all three sites ranged between 160-1009 μg/m3 at industrial, 160-
1140 μg/m3 at commercial and 72-831 μg/m
3 at residential site while RSPM varies from 62-
664 μg/m3 at industrial,48-619 μg/m
3 at commercial and 28-483 μg/m
3 at residential site.
Average concentration of SO2 and NO2 at all the sites ranged between 2-28 μg/m3 and 17-
110 μg/m3, at industrial,2-28 μg/m
3 and 15-107 μg/m
3 at commercial and 2-18 μg/m
3 and 16-
94 μg/m3 at residential sites respectively. The AQIs were calculated using IND-AQI
procedure. The calculated AQI values for 24 hourly average NO2 and SO2 concentrations
were categorized as good to moderate and good during the study period at all three sites. AQI
value estimated for SPM showed about 62% in industrial, 55% in commercial and 47% in
residential under very poor category while AQI values for RSPM varied about 54% in
industrial,42% in commercial and 59% in residential sites under poor category. Over all AQI
was found to fall under the category of poor to very poor due to RSPM and SPM
respectively. Daily average concentration and AQI for particulate matter shows a maximum
pollutant concentration during winter months and general trend of minimum values occurs in
monsoon.
Ambient Air Quality in respect to SPM, NOx, SO2 and CO was monitored over various
parts of Calcutta by Mandal (2000). Urbanized areas of the western part of Calcutta was the
most polluted area compared to other areas which is highly urbanized, closed to the Howrah
Industrial Sector and with high density of population which lead to greater concentration of
pollutants in this area.
In a study, conducted in the city Kanpur, it was found out that average pollution level in
the city expressed in PM10 was 225.68 μg/cu-m during the year 2004 (Gupta, 2007). One of
the monitoring stations i.e., Vikas Nagar registers wild fluctuations in the level of PM10. It

[28]
varies from 295 to 463μg/cu m during summer and from 42.5 to122 μg/cu-m during the
monsoon and winter seasons respectively.
A study conducted on the ambient air quality of the city Lucknow during Diwali
festival showed varied concentrations of PM10, SO2 and NOx. In this study, PM10, SO2, NOx
and 10 trace metals associated with PM10 were estimated at four representative locations,
during day and night times for Pre Diwali (day before Diwali) and Diwali day. On Diwali
day 24 h average concentration of PM10, SO2, and NOx was found to be 753.3, 139.1, and
107.3 μg /cu-m, respectively, and these concentrations were found to be higher at 2.49 and
5.67 times for PM10, 1.95 and 6.59 times for SO2 and 1.79 and 2.69 for NOx, when compared
with the respective concentration of Pre Diwali and normal day, respectively (Barman et al.,
2008).
In Indian cities airborne particulate matter seems to be a very serious problem
(Agarwal et al., 2006) even in sites of ecological relevance like Aizawl, Mizoram, NE India
(Lalrinpuii and Lalramnghinglova, 2008; Rai and Chutia, 2014). Moreover, national studies
also revealed that leaves are sensitive and highly exposed parts of a plant and may act as
persistent absorbers of dust in a polluted environment. They act as pollution receptors and
reduce dust concentration of the air (Nowak, 1994). The capacity of leaves as dust receptors
depends upon their surface geometry, phyllotaxy, epidermal and cuticular features, leaf
pubescence, and height and canopy of trees (Nowak, 1994).
Particulate matter (PM) in the atmosphere is a major environmental concern, especially
with respect to its impact on human health (Revuelta et al., 2014; Sgrigna et al., 2015; Rai,
2015). In recent Anthropocene era, rapid pace of industrialization and urbanization has given
birth to dust or particulate matter (PM) pollution, impact of which may be correlated with

[29]
urban planning as well as topography of the particular region (Rai, 2011 a,b, Rai, 2013).
Besides social and economic problems, the development model of the so-called Third World
has caused serious degradation of air quality particularly in relation to huge emission of PM
and hence posed challenges in the research fields of atmospheric science and technology.
Environmental contamination and human exposure with respect to dust or PM pollution have
dramatically increased during the past ten years (Faiz et al., 2009). In the current phase of
science and technology, roads act as reservoir of PM. Roads, have a wide variety of primary,
or direct, ecological effects as well as secondary, or indirect, ecological effects on the
landscapes that they penetrate (Coffin, 2007). The particles of dust that deposit from the
atmosphere and accumulate along roadsides are called road dust particles and originate from
the interaction of solid, liquid and gaseous metals (Akhter and Madany, 1993; Faiz et al.,
2009). Since the roadside vegetation obviously comes into direct contact with particulates,
irrespective of the sources, it is quite obvious to investigate their pollution science,
particularly in context of the role of plant leaves. Further, the implication of the intake of dust
particles with high concentration of heavy metals poses potentially deleterious effects on the
health of human beings (Faiz et al., 2009). Moreover, apart from human health implications,
there may be concomitant multifaceted impacts of dust particles or PM on global climate
(Maher, 2009).
It is now well established through a series of researches that urban PM may also contain
magnetic particles (Hunt et al., 1984; Flanders, 1994; Morris et al., 1995; Matzka and Maher,
1999; Petrovsky and Ellwood, 1999; Maher et al., 2008; Rai, 2011 a, b). These are derived
from the presence of iron impurities in fuels, which form upon combustion of a non-volatile
residue, often a mix of strongly magnetic (magnetite-like) and weakly magnetic (haematite-
[30]
like) iron oxides. Magnetite has been identified specifically as a combustion-derived
component of vehicle exhaust materials (Abdul-Razzaq and Gautam, 2001; Maher et al.,
2008). Apart from vehicular emissions, other natural sources (rock dust, street dust,
sediments etc.) may also contribute to magnetic minerals in the atmosphere (Maher et al.,
2008; Maher, 2009).
Magnetic minerals particularly those derived from vehicular combustion are having a size
range of 0.1-0.7 µm (Pandey et al., 2005; Maher, 2009). This grain size is particularly
dangerous to humans because of its ability to be inhaled into the lungs ((Pandey et al., 2005;
Maher, 2009; Hansard et al., 2011). Further, Matzka and Maher (1999) found that the grain
size of magnetic particles from vehicle emissions to be of the order of 0.3- 3µ, a size of
particular potential hazard to health. Iron often occurs as an impurity in fossil fuels during
industrial, domestic, or vehicle combustion which ultimately forms a non-volatile residue,
often comprising glassy spherules of magnetic nature, with easily measurable magnetization
levels (Matzka and Maher, 1999). Also, combustion-related particles in vehicles, via exhaust
emissions and abrasion or corrosion of engine and vehicle body material can generate non
spherical magnetite particles (Pandey et al., 2005; Maher, 2009).
Several researchers opined that environmental magnetism studies act as a proxy for
vehicle derived pollutants through roadside plant leaves (Maher, 2009). Moreover, magnetic
properties of PM may also act as a valuable tool in assessing the phenomenon of atmospheric
climate change through the study of Chinese Loess Plateau. Dust or aerosol may act as
indicators as well as agents of climate change, through radiative, cloud condensation and
ocean biogeochemical effects (Watkins and Maher, 2003; Watkins et al., 2007; Maher,
2011).

[31]
2.1 Particulate matter (PM)/dust pollution
Solid matter, which is composed of soil, anthropogenic metallic constituents, and natural
biogenic materials, is called dust (Ferreira-Baptista and DeMiguel, 2005). The particulates
belong to the class of poorly soluble particles that also encompasses carbon black, coal mine
dust, and titanium dioxide (Borm et al., 2004; Moller et al., 2008). Measurements of the PM
in ambient air are usually reported as the mass of particles with an aerodynamic diameter that
is less than 2.5 µm (PM2.5) or 10 µm (PM10) (Zhu et al., 2006). Aforesaid particle sizes are
emphasized in view of their pertinent health impacts.
Dust pollution in the atmosphere, particularly of pollutant particles below 10 µm (PM10),
is of current concern worldwide due to adverse health effects associated with their inhalation
(Morris et al., 1995; Oberdorster, 2000; Calderon- Garciduenas et al., 2004; Pope et al.,
2004; Faiz et al., 2009). Moreover, PM in dust is thought to be the most harmful pollution
component widely present in the environment, with no known level at which adverse human
health effects occur (Bealey et al., 2007).
Therefore, a well defined particulate pollution control policy structure is needed in view
of their adverse impacts on flora and fauna, including human beings. Craig et al. (2008)
made a guidance document in order to reflect critical science and policy aspects of air quality
risk management including i) health effects, ii) air quality emissions, measurement and
modelling, iii) air quality management interventions, and iv) clean air policy challenges and
opportunities. It was based on findings of five annual meetings of the NERAM (Network for
Environmental Risk Assessment and Management) International Colloquium Series on Air
Quality Management (2001-2006) as well as researches of international repute.

[32]
As discussed earlier, that PM also comprises magnetic particles, therefore, it is necessary
to characterize them and also to investigate their sources.
2.2 Sources of PM and characterization of magnetic particles
Sources of particulate pollution may be natural or anthropogenic in nature. Emission sources
may include natural processes such as wildfires, volcano eruption and dust storms. The
magnetic particles derived from multifaceted resources may be ferromagnetic,
antiferromagnetic and ferrimagnetic depending on the nature of spin acquired on the
application of magnetic fields.
Biogenic ferrimagnets are also reported to be present in the organisms like termites
(Maher, 1998a,b) and bacteria (Fassbinder et al., 1990). Man-made pollution encompass
combustion processes used for heating, power production, industry, and traffic vehicles
(Hansard et al., 2011). Road traffic is considered to be one of the major sources of
environmental pollution in urban areas, whereas other anthropogenic activities like power
plants, metallurgy, mining, dust originating from fragile rocks are of minor importance
(Bucko et al., 2010, 2011). Although vehicles are the prime source of particulates (Maricq,
1999; Maher et al., 2008), however, other sources may also come in to play depending on the
geography of particular landscapes (Rai, 2011b).
It has been shown that vehicle derived pollutants simultaneously release deleterious fine-
grained particulates and magnetic particles into the atmosphere (Pandey et al., 2005). Apart
from vehicle derived particulates, street dust, also contains larger particles of PM posing little
health risk (Simonich and Hites, 1995; Rautio et al., 1998a,b,c; Veijalainen, 1998;
Bargagli,1998; Steinnes et al., 2000; Wolterbeek, 2002; Urbat et al., 2004). In a case study

[33]
on Geochemical and mineral magnetic characterization of urban sediment particulates,
Manchester, UK by Robertson et al. (2003), largely ferrimagnetic multi-domain mineral
magnetic composition of the particulates were recorded, indicating inputs of anthropogenic
origin, primarily particulates derived from automobiles.
Industrial activity such as burning of fossil fuels also produces magnetically enhanced
particulates in environment (Blundell et al., 2009; Hansard et al., 2011). Xia et al. (2008)
showed that the magnetic assemblage in the dustfall, mainly originating by coal burning, is
dominated by pseudo-single domain (PSD) magnetite associated with maghaemite and
haematite. These particulates consist of coarse-grained multidomain and stable single domain
magnetic minerals. The presence of magnetite as the dominant magnetic mineral has been
confirmed by numerous analyses in different areas (Moreno et al., 2003; Urbat et al., 2004;
Lehndorff et al., 2006; Maher, 2009; Saragnese et al., 2011; Hansard et al., 2011). In a case
study on magnetic properties of roadside dust in Seoul, Korea Kim et al. (2007) grouped
magnetic materials into three types i.e. magnetic spherules possibly emitted from factories
and domestic heating systems, aggregates derived from vehicle emission or motor vehicle
brake systems, and angular magnetic particles of natural origin. There may be several
magnetic minerals associated with particulates (having different magnetic status) derived
from terrestrial environment.
2.3 Health impacts of PM pollution
PM is associated with many adverse human health impacts (Jahn et al., 2011; Rohr and
Wyzga, 2012; Taner et al., 2013; Hicken et al., 2014; Pascal et al., 2014; Yadav et al., 2014;
Rai and Panda, 2014; Rai et al., 2014; Kim et al., 2015; Yang et al., 2015). PM vehicular

[34]
emissions, notably in the ultrafine fraction, have been specifically associated with endpoints
such as oxidative stress and mitochondrial damage (Li et al., 2003), lipid peroxidation
(Pereira et al., 2007), up regulation of genes relevant to vascular inflammation (Gong et al.,
2007), and early atherosclerosis and oxidative stress (Araujo et al., 2008). Progression of
atherosclerosis has also been reported due to exposure of PM pollution (Suwa et al., 2002).
Inhalation exposure studies have shown that short term exposure to diesel exhaust has an
acute inflammatory effect on normal human air ways resulting in marked neutrophilia,
activation of mast cells and neutrophils and the production of cytokines and chemokine
associated with neutrophil accumulation and activation (Salvi et al., 2000; Frampton, 2001;
Stenfors et al., 2004). Epidemiologic studies conducted in different parts of the world have
demonstrated an important association between ambient levels of motor vehicle traffic
emissions and increased symptoms of asthma and rhinitis (Rai, 2013). Additionally, recent
human and animal laboratory-based studies have shown that particulate toxic pollutants, and
in particular diesel exhaust particles (DEP), can enhance allergic inflammation and induce
the development of allergic immune responses (Salvi et al., 2000; Frampton, 2001; Stenfors
et al., 2004).
Diesel exhaust-exposed workers have been shown to have an increased risk of lung
cancer (Nielsen et al., 1996 a,b; Scheepers et al., 2002). Methods for the assessment of
exposures to diesel exhaust were evaluated by comparing underground workers (drivers of
diesel-powered excavators) at an oil shale mine in Estonia with surface workers and it was
observed that underground miners were also occupationally exposed to benzene and
polycyclic aromatic hydrocarbons, as indicated by excretion of urinary metabolites of
benzene and pyrene and increased O6-alkylguanine DNA adducts were detected in the white

[35]
blood cells of underground workers, suggesting higher exposure to nitroso-compounds
(Scheepers et al., 2002). Diesel exhaust consists of a complex mixture of particulates which
contain known genotoxicants, one of which is benzene. Muzyka et al. (1998) indicated
significant differences in 5-aminolevulinic acid (ALA) synthesis and heme formation
between the exposed workers to PM containing benzene when compared to the non-exposed
individuals.
Chen et al. (2004) reported that ambient air pollution had acute and chronic effects on
mortality, morbidity, hospital admissions, clinical symptoms, lung function changes, etc. in
China. Schoket (1999), in his exhaustive study found that in Silesia, Poland, and Northern
Bohemia, Czech Republic, where coal-based industry and domestic heating are the major
sources of PAHs, significant differences have been observed in white blood cell DNA
adducts and cytogenetic biomarkers between environmentally exposed and rural control
populations, and significant seasonal variations of DNA damage have been detected. Further,
Schoket (1999) found that in Copenhagen, Athens, Genoa and Cairo, Bus drivers, traffic
policemen and local residents have been involved in biomarker studies and differences have
been measured in the level of DNA damage of urban and rural populations.
Traffic originating from increased number of vehicles may cause multiple adverse health
effects including asthma and allergic diseases, cardiac effects, respiratory symptoms, reduced
lung function growth, adverse reproductive outcomes, premature mortality, and lung cancer
(White et al., 2005; Samet, 2007).
Various studies showed PM exposure, associated with elevated levels of c-reactive
protein, a marker of systemic inflammation that may be important and independent predictor

[36]
of cardiovascular diseases. For example, a recent study reported associations between CRP
and interleukin (IL)-6 with PM in subjects with coronary artery disease (Delfino et al., 2008).
inflammatory lung injury, bone marrow and blood cell responses, enhanced human alveolar
macrophage production of proinflammatory cytokines, elevated blood plasma viscosity (Ghio
et al., 2004), endothelial dysfunction and brachial artery vasoconstriction and triggering of
myocardial infarction. Polichetti et al. (2009) extensively reviewed the impact of PM on
cardiovascular system. Particulate matter is also linked with psychosocial stress and high
blood pressure (Hicken et al., 2014).
In literatures, it is well documented that particulate pollution causes adverse health
impact particularly in the size range of less than 10μm (Curtis et al., 2006; Lipmann, 2007;
Zeger et al., 2008; Mitchell et al., 2010). PM pollutants are associated with adverse effects
on respiratory system (Schwartz, 1996; Pope et al., 2002; Knutsen et al., 2004; Knox, 2006;
Maher et al., 2008; Hansard et al., 2011). If these particulates of size lower than 10μm causes
inflammation and diminished pulmonary function can be unavoidable (Seaton et al., 1995;
Knutsen et al., 2004; Maher et al., 2008). Further, PM with aerodynamic diameter smaller
than 2.5 μm (PM2.5) have even more deleterious health impacts because when inhaled they
penetrate deeper than PM10 and can reach lungs alveola (Rizzio et al., 1999; Harrison and
Yin, 2000; Wichmann and Peters, 2000; Saragnese et al., 2011). Links with lung cancer
(Pope et al., 2002) and increased cardiovascular mortality rates (Schwartz, 1996) have also
been established. Lung diseases due to PM may be attributed to presence of inflammatory
cells in the airways including neutrophils (PMN), eosinophils and monocytes (Mo), and
increased numbers of alveolar macrophages (AM) (Becker et al., 2002).

[37]
Global records showed PM below size 2.5 μm causes 3% of mortality from cardio-
pulmonary disease; 5% of mortality from cancer of the trachea, bronchus and lung; and 10%
of mortality from acute respiratory infections in children under five (Cohen et al., 2005;
Maher, 2009). It is well established through literatures that air pollution with PM in children
results in detectable effects indicated by a number of biomarkers of exposure and early
effects (Pedersen et al., 2006). Aforesaid hypothesis was tested through a family pilot study
which was conducted in the Czech Republic through fluorescence in situ hybridization
(FISH) and it was concluded that micronuclei (MN) is a valuable and sensitive biomarker for
early biological effect in children and adults living in two different areas characterised with
significant exposure differences in c-PAHs concentrations during winter (Pedersen et al.,
2006).
There has been considerable concern on the pulmonary effects of particulates less than
2.5 μm (PM2.5) or 10 μm (PM10), as they can reach the alveoli and translocate to the
circulation, whereas particles of larger size deposit mainly in the upper airways and can be
cleared by the mucociliary system (Oberdorster et al., 2005; Moller et al., 2008). In the
recent past, many studies highlighted the role of ambient airborne PM as an important
environmental pollutant for many different cardiopulmonary diseases and lung cancer
(Valavanidis et al., 2008). Further, it has increasingly being realized that generation of
reactive oxygen species (ROS) and oxidative stress is an important toxicological mechanism
of particle induced lung cancer (Knaapen et al., 2004; Risom et al., 2005). The fraction of
PM contains a number of constituents that may increase the generation of ROS by a variety
of reactions such as transition metal catalyses, metabolism, redoxcycling of quinones, and
inflammation. PM, thus, can generate oxidative damage to DNA, including guanine

[38]
oxidation, which is mutagenic (Kasai, 1997; Moller et al., 2008). The oxidative stress
mediated by PM and resulting DNA damage may originate from generation of ROS from the
surface of particles, soluble compounds such as transition metals or organic compounds,
altered function of mitochondria or NADPH-oxidase, and activation of inflammatory cells
capable of generating ROS and reactive nitrogen species (Risom et al., 2005). Production of
reactive oxygen species (ROS) and the secretion of inflammatory cytokines could interact by
inducing cell death by apoptosis (Shukla et al., 2000; Haddad, 2004; Dagher et al., 2006).
In view of the abovementioned deleterious impacts of PM, it is important to investigate
the feasible and eco-sustainable control technologies.
2.4 Magnetic biomonitoring approach of particulates for roadside plant leaves
In the light of several health hazard concerns mentioned in previous sections of the review, it
is necessary to have a bird‘s eye view on the existing technologies, their limitations and an
overview on biomonitoring potential of plant leaves.
2.4.1 Existing technologies
Dust particles can be removed from the atmosphere by dry, wet or occult deposition
(National Expert Group on Transboundary Air Pollution, 2001). Dry deposition is the
removal of pollutants by sedimentation under gravity, diffusion processes (i.e., Brownian
motion) or by turbulent transfer resulting in impaction and interception. However, existing
technologies for abatement of particulates are not cost-effective. Okona-Mensah et al. (2005)
mentioned the use of Benzo[a]pyrene (B[a]P), Dibenzo[a, h]anthracene (DBA) and
dibenzo[a, l]pyrene (DB[a, l]P) in control of PAH, however, hand in hand they reviewed the
advantages of biomonitoring approach over these chemicals as they are carcinogenic. It is

[39]
well known that vehicle-derived PM10 values decrease not only with increased distance from
roads, but also with increased height (e.g. Maher et al., 2008; Mitchell and Maher, 2009;
Mitchell et al., 2010). Therefore, conventional monitoring stations are not option for
particulate pollution monitoring as they distantly located from residential area and their
height is in excess of 3 m (Mitchell et al., 2010).
Although several volatile and semi-volatile organic compounds are also frequently
analysed using passive biomonitors (Eriksson et al., 1989; Simonich and Hites, 1994;
Davidson et al., 2003; Urbat et al., 2004), however, vegetation-atmosphere partitioning
seems to be effective in abatement approaches (Calamari et al., 1991; Yang et al., 1991;
Jensen et al., 1992; Franzaring, 1997; Ockenden et al., 1998; Wenzel et al., 2000; Kylin et
al., 2002; Davidson et al., 2003; Urbat et al., 2004).
2.4.2 Biomonitoring and biomagnetic monitoring of particulates
Although, there are many conventional (physical and chemical) devices for assessment of air
pollution, however, biomonitoring is an efficient tool (Rai et al., 2014). Biological monitors
are organisms that provide quantitative information on some aspects of their environment,
such as how much of a pollutant is present (Martin and Coughtrey, 1982). In this regard, the
air cleansing capacity of urban trees presents an alternative approach to foster an integrated
approach to the sustainable management of urban ecosystems (Pandey and Agrawal, 1993;
Nowak and Rowntree, 1994; Nowak and Dwyer, 2000; Nowak et al., 2002; Randolph, 2004).
Biomonitoring of dust pollution and its biochemical impact has attracted the attention of
both national and international scientific communities. Internationally, the quantification and
valuation of pertinent ecosystem services have drawn much attention over the last decade

[40]
(Nowak, 1994; Taha, 1996, 1997; McPherson et al., 1997, 1998, 1999; Beckett et al., 1998;
Nowak et al., 1998, 2000, 2002, 2006; Rosenfeld et al., 1998; Scott et al., 1998; Akbari et
al., 2001; Akbari, 2002).
Besides the application of advanced technologies in prevention and amelioration, the
option of employing natural mechanisms to effect ecological abatement is occasionally
adopted by design but commonly contributes by default. The main advantage of the plant‘s
use as bio-monitor is that they are wide-spread providing a high density of sampling points
(Moreno et al., 2003). Moreover, the most economical and reasonable method for
biomonitoring heavy metal levels in the atmosphere is using plants (Celik et al., 2005).
Among trees, evergreen species are better traps for particles than deciduous ones because of
their greater leaf longevity, which can accumulate pollutants throughout the year (Gratani
and Varone, 2006, 2007). Further, it might be worth mentioning that conifers also trap better
because of larger leaf area.
Therefore, vegetation is an efficient sink for dust originating from diverse sources. Dust
particles from the air mainly adhere to the outside of plants. This is in contrast to air polluting
gases and very small particles (<0.1 mm) which are largely absorbed via an important part
via the stomata into the leaves. The use of different plant materials as biomonitors of
anthropogenic contamination is discussed in detail in Markert (1993).
Likewise, in the past decade there has been increased interest, in many parts of the world,
in the study of tree leaves as bio accumulators of trace elements/metals present in dust, in the
surroundings of industrial facilities (Helmisaari et al., 1995; Nieminen and Helmisaari, 1996;
Bussotti et al., 1997; Giertych et al., 1997; Mieieta and Murín, 1998; Rautio et al., 1998a,b,c)
[41]
and in urban environments (Alfani et al., 1996; Monaci et al., 2000), although few studies
have been made of rural and background areas (Loppi et al., 1997; Ukonmaanaho et al.,
1998; Ceburnis and Steinnes, 2000). Lehndorff and Schwark (2009) investigated the spatial
distribution of three-ring polycyclic aromatic hydrocarbons and their derivatives (PAH-3) in
Greater Cologne Conurbation (GCC) using pine needle as passive samplers.
Lichens, bryophytes or mosses and certain conifers were proved to be potent
biomonitoring tool of air pollution in recent times (Al- Alawi et al., 2007; Al-Alawi and
Mandiwana, 2007; Larsen et al., 2007; Tretiach et al., 2007; Nali et al., 2007; Batarseh et al.,
2008). Plants as well as lichens were also used in an integrated way for diagnosis of air
quality (Nali et al., 2007). Use of Pine as well as cypress bark was found fruitful in
biomonitoring of air pollutants particularly heavy metals (Al-Alawi et al., 2007; Al-Alawi
and Mandiwana, 2007; Batarseh et al., 2008).
However, biomagnetic monitoring, using tree leaves as sampling surfaces, can generate
high spatial resolution PM10 proxy data (Hansard et al., 2011). Since, atmospheric pollutants
also consist of complex mixture of magnetic particles, which are derived from iron impurities
in the fuel, biomagnetic monitoring through roadside plant leaves is extremely relevant in
present scenario (Hansard et al., 2011). Also, tree leaves are abundant in number and hence
are convenient for sampling. Moreover, lichens and mosses may be less abundant in severely
polluted urban areas and they are also climate specific unlike roadside tree plant leaves.
Therefore, in urban areas higher plants are mostly suitable for monitoring dust pollution as
lichens and mosses are often missing (Al-Alawi and Mandiwana, 2007). Moreover, magnetic
techniques, using natural surfaces as passive collectors of particulate pollution, are sensitive,
rapid, and relatively cheap (Mitchell et al., 2010).

[42]
2.5 Global researches on environmental magnetism
With the advent of environmental magnetism, magnetic measurement is becoming an
important means in particulate pollution study (Zhang et al., 2007). In environmental
magnetism, there is growing interest in using magnetic methods in sediment tracing in the
urban environment (Beckwith et al., 1990; Matzka and Maher, 1999; Xie et al., 2001).
In plants and soil samples, minerals capable of acquiring magnetic remanence include
mainly the iron oxides (magnetite, maghemite and hematite), oxyhydroxides (goethite) and
sulphides (greigite). Magnetic iron sulphides are found only in reducing (anoxic)
environments, such as estuarine muds, where organic matter is consumed by bacteria in the
absence of oxygen. The strongest naturally occurring magnetic minerals are magnetite and
maghemite, while hematite and goethite are magnetically much weaker.
The excellent potential of environmental magnetism as a proxy for atmospheric pollution
levels has been reported by several researchers based on analysis of soils and street or roof
dust (Hay et al., 1997; Hoffmann et al., 1999; Shu et al., 2000; Xie et al., 2000; Urbat et al.,
2004), and vegetation samples including tree bark (Kletetschka et al., 2003) and leaves or
needles (Matzka and Maher, 1999; Jordanova et al., 2003; Moreno et al., 2003). In urban
particulates, a strong correlation has been observed between magnetic susceptibility as well
as remanence and PM10 concentrations (e.g. Morris et al., 1995; Muxworthy et al., 2003;
Sagnotti et al., 2006; Szönyi et al., 2008; Sagnotti et al., 2009; Hansard et al., 2011), as a
proxy for particulate pollution concentrations (Hansard et al., 2011).
Active sampling i.e. through air filters has been used to discriminate particle sources and
compare magnetic data with geochemical and meteorological data (Shu et al., 2001;

[43]
Muxworthy et al., 2001, 2003; Spassov et al., 2004; McIntosh et al., 2007). Passive methods
include the study of soils and street dust (Hay et al., 1997; Hoffmann et al., 1999; Xie et al.,
2000; Urbat et al., 2004; Shilton et al., 2005; McIntosh et al., 2007) and natural surfaces such
as tree bark, tree leaves and pine needles (e.g. Flanders, 1994; Matzka and Maher, 1999;
Moreno et al., 2003; Urbat et al., 2004; McIntosh et al., 2007).
Blaha et al. (2008) analysed fly ash samples from a black coal-fired power plant in
Germany through the comparison of the bulk sample grain-size (0.5-300 µm) and grain-size
spectra from magnetic extracts (1-186.5 µm) and showed that strongly magnetic particles
mainly occur in the fine fractions of <63 mm.
Although environmental magnetism parameters have been optimized as qualitative proxy
indicators of the distribution of anthropogenic particulates, heavy metals and organic
materials, however, Kim et al. (2009) proposed a quantitative magnetic proxy which is
suitable for the monitoring of spatial and temporal pollution patterns in urban areas. In
aforesaid study, performed in south-western Seoul, Kim et al. (2009) analysed road dust
samples with thermomagnetic data in conjunction with intensive electron microscopy and
found predominance of carbon-bearing iron-oxides, indicating that anthropogenic
particulates mostly originated from fossil fuel combustions.
Muxworthy et al. (2003) advocated that saturation isothermal remanent magnetization
(SIRM) was found to be strongly correlated with the PM mass, and not only acts as a proxy
for PM monitoring but also is a viable alternative to magnetic susceptibility when the
samples are magnetically too weak.

[44]
In several researches (Brilhante et al., 1989; Charlesworth and Lees, 1997; Xie et al.,
2001), there is report on possible linkages between magnetic properties and heavy metals in
street dust. Moreover, in aerosols, magnetite is associated to heavy metals e.g. zinc, cadmium
and chromium (Georgeaud et al., 1997) and to mutagenic organic compounds (Morris et al.,
1995), also dangerous to human health (Moreno et al., 2003). Significant correlation between
sample mutagenicity and magnetic susceptibility for urban dust samples has already been
established (Morris et al., 1995). Traditional geochemical methods (e.g. AAS, ICP-MS) are
relatively complex, time-consuming and expensive, and are therefore not suitable for
performing mapping or monitoring of large-scale heavy metal or sediment pollution (Zhang
et al., 2011).
Vehicle-derived pollutants act as major source of pollutants in the landscapes where
intensive industries are not present. It has been shown that vehicle derived pollutants
simultaneously release deleterious fine-grained particulates and magnetic particles into the
atmosphere (Pandey et al., 2005; Maher, 2009). Xie et al. (2001) on his investigation on
Liverpool street dust suggested that magnetic properties, and mean values of some element
concentrations and the organic matter content may be obtained with a small number of
samples from a sampling period of one or several days.
Hoffmann et al. (1999) did the magnetic mapping of soil surface emanating due to
vehicle pollution by measuring profiles of magnetic susceptibility along a German motorway.
Further, one more study on magnetic properties dusts was done in the Munich city, which
demonstrated high correlation between total PM10 dust mass and its magnetic concentration
as revealed by having high saturation remanent magnetization {(SIRM) the magnetization

[45]
retained by a sample after exposure to a large magnetic field, e.g. 300 mT or 1 T} (Matzka,
1997; Matzka and Maher, 1999).
Industrial sources e.g. thermal power plants emit fly ashes which also contribute to higher
magnetic values (Schadlich et al., 1995; Pandey et al., 2005; Sharma and Tripathi, 2008;
Hansard et al., 2011).
Environmental magnetic proxies provide a rapid means of assessing the degree of
industrial heavy metal pollution in air, soils and sediments (Zhang et al., 2011). Roadside
dusts act as a common source for the heavy metals and magnetic carriers as revealed by a
strong positive inter-correlation between the concentrations of heavy metals (Fe, Mn, Cr, Zn,
Pb, and Cu) and magnetic susceptibility (Lu et al., 2008 a,b).
The association/correlation of magnetic properties with heavy metals may be
demonstrated in soil samples (Lu et al., 2008 a,b). The magnetic parameters could provide a
proxy measure for the level of heavy metal contamination and could be a potential tool for
the detection and mapping of contaminated soils. Lu et al. (2008a,b) investigated
concentrations of copper (Cu) and zinc (Zn) and various magnetic parameters in
contaminated urban roadside soils using chemical analysis and magnetic measurements and
their results revealed that high magnetic susceptibility may be attributed to anthropogenic
soft ferrimagnetic particles. Lu and Bai. (2006) also demonstrated a straight linear correlation
between the magnetic mineral concentration-related parameters and the concentrations of Cu,
Zn, Cd and Pb. Hu et al. (2007) demonstrated significant correlations between heavy metals
and several magnetic properties of the topsoils (fromurban and agricultural site) in the
Shanghai indicated that the magnetic techniques can be used for monitoring soil pollution.

[46]
Alagarsamy, (2009) performed the environmental assessment of heavy metal concentrations
and its impact in the coastal environment using magnetic techniques and found strong
relationships between Anhysteretic Remanent Magnetization and heavy metals which may be
attributed to role of iron oxides checking metal concentrations.
Road dust extracted from snow, collected near a busy urban highway and a low traffic
road in a rural environment (southern Finland), was studied using magnetic, geochemical and
micromorphological analyses by Bucko et al. (2010) and results revealed the a decreasing
trend in χ and selected trace elements was observed with increasing distance from the road
edge.
Shilton et al. (2005) demonstrated significant correlations between the organic matter
content of urban street dust and certain mineral magnetic properties, however, this group
suggested that since the relationship may vary for different roads, even, within same area,
therefore, caution should be taken before making the remark that magnetic parameters offer
potential as a proxy for organic content.
McIntosh et al. (2007) found that concentration and grain-size trends across the roads act
as the source of the magnetic signal where the relationships between IRM1T (magnetic
concentration) and the concentration of NOx and PM10 showed that the magnetic signal is
specific to traffic-related emissions and not to total particle mass. Saragnese et al. (2011)
investigated that superparamagnetic particles of nanometric dimension were identified in the
PM by magnetic techniques and proposed a model linking total nitrogen oxides with
magnetic particles.

[47]
In the light of abovementioned discussion, it is quite clear that magnetic parameters may
assist in multifaceted environmental geomagnetic studies (e.g. soil, street dust, sediments
etc.).

[48]
CHAPTER- 3
STUDY AREA AND STUDY SITES
________________________________________________________________
3.1 Description of study area
Mizoram (21◦56'–24
◦31'N and 92
◦16'–93
◦26'E) is one of the eight states under northeast India
(Figure 3.1), and it covers an area of 21,081 km2. The tropic of cancer divides the state into
two almost equal parts. The state is bordered with Myanmar to the east and south,
Bangladesh to the west, and by the Indian states of Assam, Manipur and Tripura to the north.
The altitude is approaching to near the Myanmar border. The forest vegetation of state falls
under three major categories, i.e., tropical wet evergreen forest, tropical semi-evergreen
forest and sub-tropical pine forest (Champion and Seth, 1968). This region falls within the
Indo-Burma hot spot regions (Rai, 2009). Aizawl district comes under Indo-Burma hotspot
region of North East India (Rai, 2009, 2012), having variety of diverse plant species possess
varying leaf morphology which can be utilized in sampling of dust deposition and hence, the
study of magnetic parameters. The diversity of tropical evergreen plants prevails along the
roadsides of Aizawl district, and therefore, it can retain the pollutants throughout the year;
offering no seasonal constraint (Rai et al., 2014).
Aizawl (21◦58'–21
◦85'N and 90
◦30'–90
◦60'E), the capital of the Mizoram state is 1132 m
above the sea level (asl). The altitude of Aizawl district varies from 800 to 1200 m asl. The
climate of the area is typically monsoonic. The annual average rainfall is amounting ca. 2350
mm. This area experiences distinct seasons. The ambient air temperature is normally ranging
from 20 to 30◦C in summer and 11 to 21
◦C in winter (Laltlanchhuang, 2006; Rai et al., 2014).

[49]
The meteorological data may enable to correlate the air pollution including the dust or
particulate deposition; therefore average meteorological data (Figure 2) of the study area are
also included for the study period. Landscape Geography may also affect the dispersal of
particulates, therefore, we recorded latitude and longitude for different sampling sites.
3.2 Study sites
The study was carried out in Aizawl district from four different sampling points.
Site 1. Durtlang (23◦46.11'N and 92
◦44.08'E): Durtlang is a connecting road between
Mizoram and Assam and is one of the main and busy roads of this city with very high traffic
density. Vehicles are the main source of pollution at this site.
Site 2. Zarkawt (23◦44.17'N and 92
◦43.01'E): Zarkawt is a commercial place of Aizawl.
Because of high traffic density the emission of dust particles is usually very high in this area.
Site 3. Ramrikawn (23◦44.85'N and 92
◦40.81'E): Ramrikawn is very densely populated
commercial area with markets, bus as well as taxi stand and Food Corporation of India (FCI).
FCI provides space for food grain storage for entire Mizoram state. Due to existence of FCI
in Ramrikawn area, there is a frequent movement of heavy duty vehicles coming from all
parts of India through National highway of Pushpak (NH-54). Moreover, Ramrikawn is also
having a public bus and taxi stand, vehicular movement is rendered high in this area. Stone
quarrying activities are also found in this area may lead emission of dust particles. Biomass
burning through shifting cultivation is very common in this region (Rai, 2009, 2012); poses
an enhanced load of suspended particulate matters in the atmosphere. Keeping in view, the
specific Ramrikawn site is included in present investigation.
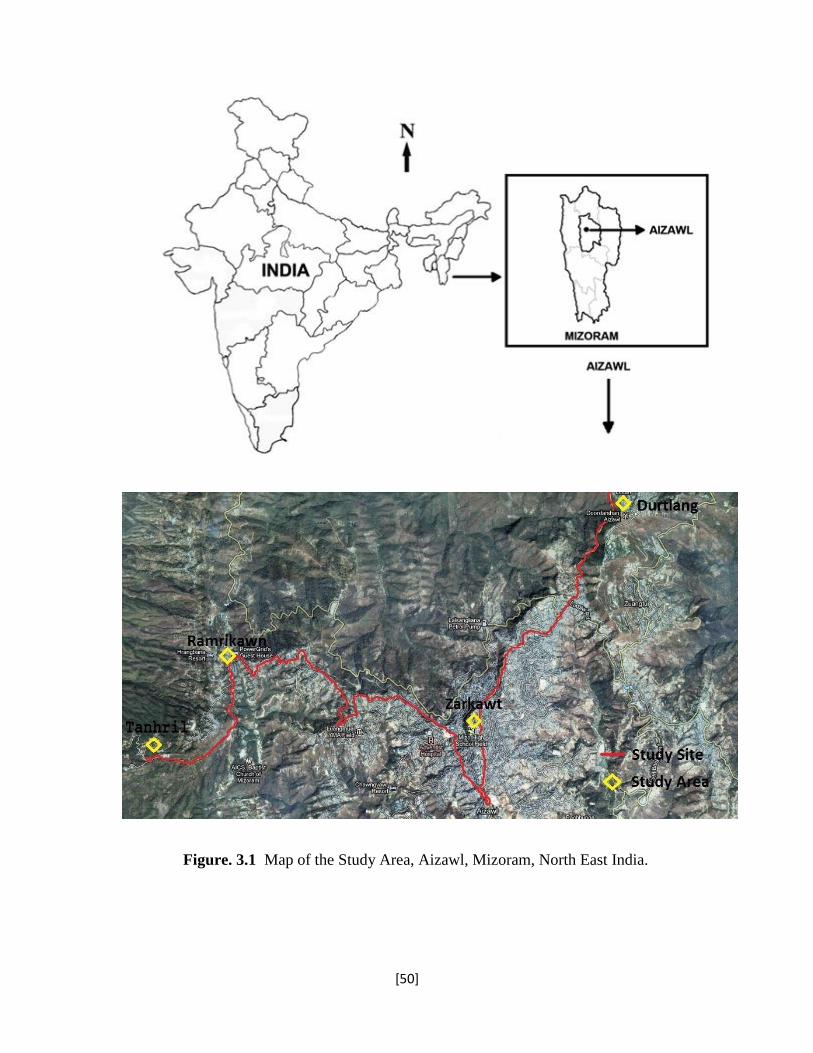
[50]
Figure. 3.1 Map of the Study Area, Aizawl, Mizoram, North East India.

[51]
Photo plate 3.1: Different sampling points.

[52]
Site 4. Tanhril (23◦44.24'N and 92
◦39.64'E): Tanhril is a rural area having low vehicular
activity, located in western part of Aizawl district. However, the load of vehicles is very low
and less frequent in comparison to other site and therefore included as reference or control
site in order to compare the results recorded from other sites.
3.3 Study Area Meteorology
The meteorological data from 2012 to 2014 was procured from Border Roads Task Force
(BRTF), Puspak, Aizawl. The study site characteristics may be presented as follows.
3.3.1 Temperature
The average ambient temperature at Aizawl site ranged from 10.9°C to 28.7°C. The
maximum and minimum monthly temperature values were 28.6°C (April) and 10.9°C
(January) during 2012; 28.7°C (March) and 11.9°C (December) during 2013; 28.8°C
(March) and 12.4°C (December) during 2014 (Figure 3.2).
3.3.2 Relative Humidity
The relative humidity range from 33.0% to 97.8%. The maximum and minimum monthly
humidity values were 97.2% (September) and 33.3% (February) during 2012; 97.8%
(August) and 27.7% (February) during 2013; 98.4% (August) and 26.3% (February) during
2014 (Figure 3.2).

[53]
3.3.3 Rainfall
During the year 2012-2014, Aizawl received total annual rainfall of 2213 mm. The maximum
and minimum monthly rainfall values were 412.0 mm (August) and 0.70 mm (February)
during 2012; 505.5 mm (June) and 007.3 mm (February) during 2013; 507.0 mm (June) and
2.4 mm (February) during 2014 (Figure 3.2).
Figure. 3.2 Mean monthly rainfall (mm), maximum and minimum humidity (%) &
maximum and minimum temperature (°C) at Aizawl during the study period 2012 to 2014.

[54]
3.4 Sources of Pollution
The Aizawl district, capital of Mizoram is heavily entrapped with heavy vehicles load
resulting in increased quantity of vehicular emission particularly dust/particulates in urban
areas. Rapid urbanization and continuously expanding population has been the major cause
of increase in the number of vehicles and hence particulates. On every crossway in Aizawl,
there is a heavy traffic fleet of maxi cab and state transport buses, which are the major mode
of transport connecting different parts of Aizawl. Particularly during the late morning and
evening time, there is heavy traffic all around the Aizawl city. Also, a part of Aizawl district
is connected to the National Highway road NH 54 (Pushpak) going to Airport, Silchar,
Shillong and finally Guwahati which harbours heavy vehicular fleet. Apart from vehicular
dust generation other anthropogenic sources are soil erosion, mining and stone quarrying
activities. Since the rocks of Aizawl are very fragile, the weathered rock dust may also get
deposited on plant leaves. Particularly, particulates below the size of 10 micron pose serious
threat to vegetation and human health. Moreover shifting cultivation is very common. The
soot particles from the burning of the remains of the plant material also takes a great role in
the pollution of the particular area.

[55]
CHAPTER- 4
MATERIAL AND METHODS
__________________________________________________________________
4.1 Air quality analysis
Sampling was done using ‗High Volume Sampler‘ (Envirotech APM 460) on 24 hour basis for
Suspended Particulate Matter (SPM) and Respirable Suspended Particulate Matter (RSPM)
during the months of May, 2013 to May, 2015 with a frequency of once in a week at four
sampling sites (details given in Figure. 3.1). Once the sampling was over, the samples were
brought to the laboratory and concentration of different pollutants was determined. RSPM
were trapped by glass fibre filter papers (GF/A) of Whatman and SPM were collected in the
separate containers at average air flow rate of 1.5 m3/min.
High Volume Sampler with a cyclone attachment fractionates the dust into respirable
and non-respirable fractions. The suspended particles enter the cyclone where coarse
non-respirable suspended particulate matter (NRSPM) is separated from the air stream by
centrifugal force. It falls through the cyclone‘s conical hopper and gets collected in the
pre-weighed cyclonic cup. The fine dust comprising the respirable fraction (RSPM or
PM10) of the suspended particulate matter is collected on a pre-weighed Whatman glass
microfibre filter paper (GF/A 20.3 x 25.4 cm). The Sampler is fixed at a breathing height of 2
m above the ground level and flow rate is noted after 5 minutes of starting of the sampling.
The RSPM collected over the GF filter paper and the NRSPM collected in the cyclonic
cup are weighed using an electronic top loading weighing balance. The concentration of the
particulate matter is estimated on the net mass collected divided by the volume of air
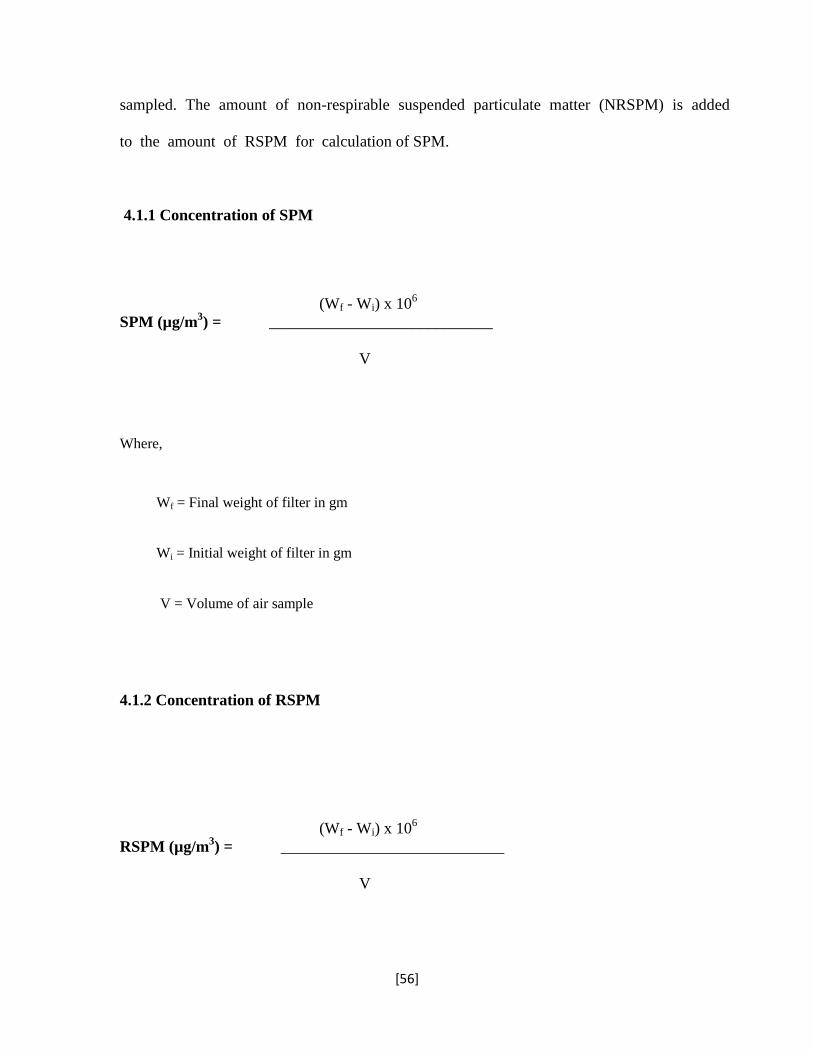
[56]
sampled. The amount of non-respirable suspended particulate matter (NRSPM) is added
to the amount of RSPM for calculation of SPM.
4.1.1 Concentration of SPM
(Wf - Wi) x 106
SPM (µg/m3) = ____________________________
V
Where,
Wf = Final weight of filter in gm
Wi = Initial weight of filter in gm
V = Volume of air sample
4.1.2 Concentration of RSPM
(Wf - Wi) x 106
RSPM (µg/m3) = ____________________________
V

[57]
Where,
Wf = Final weight of filter in gm
Wi = Initial weight of filter in gm
V = Volume of air sample
4.2 Magnetic parameters
• For magnetic analysis, sampling was conducted during the months of May, 2013 to May,
2015. Ten socio-economically important and evergreen plant species of common
occurrence along the roadside i.e. Mangifera indica, Hibiscus rosa-sinensis,
Bougainvillea spectabilis, Cassia auriculata, Lantana camara, Artocarpus heterophyllus,
Psidium guajava, Ficus bengalensis, Ficus religiosa and Bauhinia variegata were
selected for the study. At each site, 5 leaves of almost similar size from branches facing
roadside are plucked through random selection in early hours of forenoon time (08 AM to
12 AM) and placed in polythene bags. Leaves are collected from the tree on the side
nearest to the road at a height of approximately 2 m to avoid possible contamination from
ground splash. Preference is usually given to oldest leaves from the newest twig in order
to select leaves of similar age and exposure time. The leaves are brought in to laboratory
of Department of Environmental Science, Mizoram University. Leaves are dried at 35◦C
and make them powder form. After that packed them into the 10 cc plastic sample pots
and 2 gm of each sample were taken for magnetic analysis (Walden,1999).
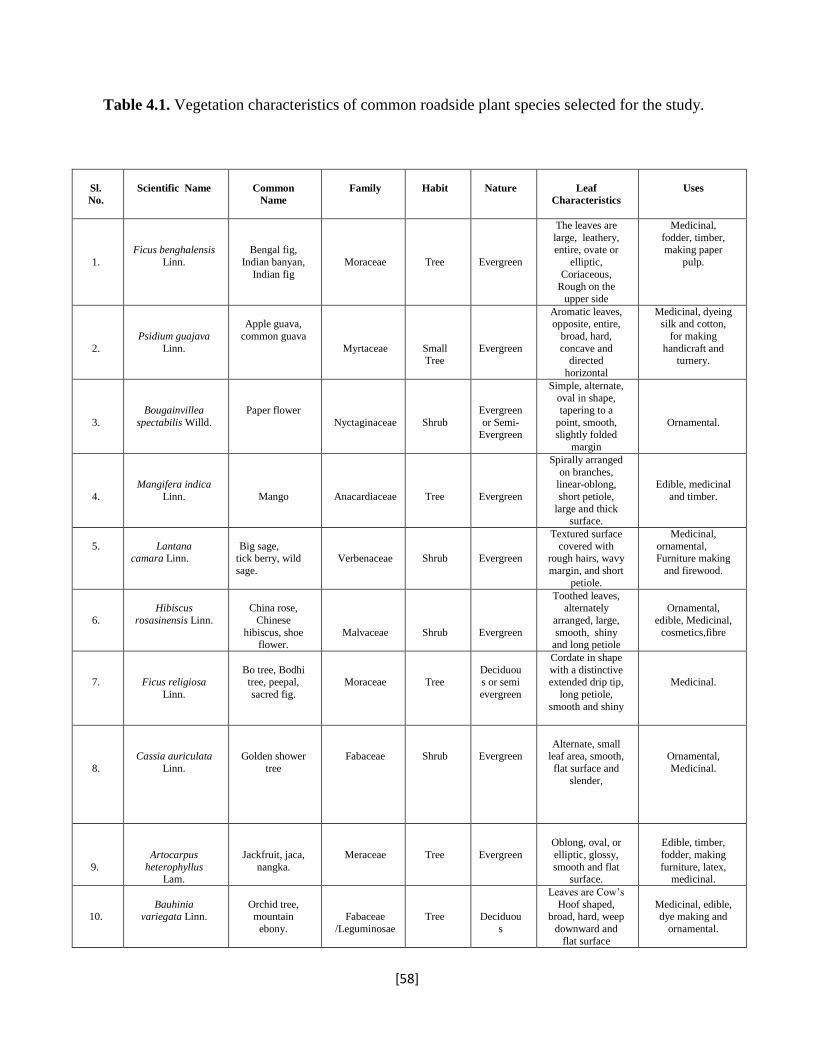
[58]
Table 4.1. Vegetation characteristics of common roadside plant species selected for the study.
Sl.
No.
Scientific Name
Common
Name
Family
Habit
Nature
Leaf
Characteristics
Uses
1.
Ficus benghalensis
Linn.
Bengal fig,
Indian banyan,
Indian fig
Moraceae
Tree
Evergreen
The leaves are
large, leathery, entire, ovate or
elliptic,
Coriaceous, Rough on the
upper side
Medicinal,
fodder, timber, making paper
pulp.
2.
Psidium guajava
Linn.
Apple guava,
common guava
Myrtaceae
Small Tree
Evergreen
Aromatic leaves, opposite, entire,
broad, hard,
concave and directed
horizontal
Medicinal, dyeing silk and cotton,
for making
handicraft and turnery.
3.
Bougainvillea
spectabilis Willd.
Paper flower
Nyctaginaceae
Shrub
Evergreen
or Semi- Evergreen
Simple, alternate,
oval in shape, tapering to a
point, smooth, slightly folded
margin
Ornamental.
4.
Mangifera indica
Linn.
Mango
Anacardiaceae
Tree
Evergreen
Spirally arranged
on branches, linear-oblong,
short petiole,
large and thick surface.
Edible, medicinal
and timber.
5.
Lantana camara Linn.
Big sage, tick berry, wild
sage.
Verbenaceae
Shrub
Evergreen
Textured surface
covered with rough hairs, wavy
margin, and short
petiole.
Medicinal,
ornamental, Furniture making
and firewood.
6.
Hibiscus
rosasinensis Linn.
China rose,
Chinese
hibiscus, shoe flower.
Malvaceae
Shrub
Evergreen
Toothed leaves, alternately
arranged, large,
smooth, shiny and long petiole
Ornamental,
edible, Medicinal,
cosmetics,fibre
7.
Ficus religiosa
Linn.
Bo tree, Bodhi tree, peepal,
sacred fig.
Moraceae
Tree
Deciduous or semi
evergreen
Cordate in shape
with a distinctive extended drip tip,
long petiole,
smooth and shiny
Medicinal.
8.
Cassia auriculata
Linn.
Golden shower
tree
Fabaceae
Shrub
Evergreen
Alternate, small leaf area, smooth,
flat surface and
slender,
Ornamental,
Medicinal.
9.
Artocarpus
heterophyllus Lam.
Jackfruit, jaca,
nangka.
Meraceae
Tree
Evergreen
Oblong, oval, or
elliptic, glossy,
smooth and flat surface.
Edible, timber,
fodder, making
furniture, latex, medicinal.
10.
Bauhinia variegata Linn.
Orchid tree, mountain
ebony.
Fabaceae
/Leguminosae
Tree
Deciduou
s
Leaves are Cow‘s
Hoof shaped, broad, hard, weep
downward and
flat surface
Medicinal, edible, dye making and
ornamental.

[59]
Bougainvillea spectabilis.
Cassia auriculata.
Photo plate 4.1: Selected plant species for the study.

[60]
Mangifera indica.
Artocarpus heterophyllus.
Photo plate 4.2: Selected plant species for the study.

[61]
Ficus bengalensis.
Ficus religiosa.
Photo plate 4.3: Selected plant species for the study.

[62]
Psidium guajava.
Hibiscus rosa-sinensis.
Photo plate 4.4: Selected plant species for the study.
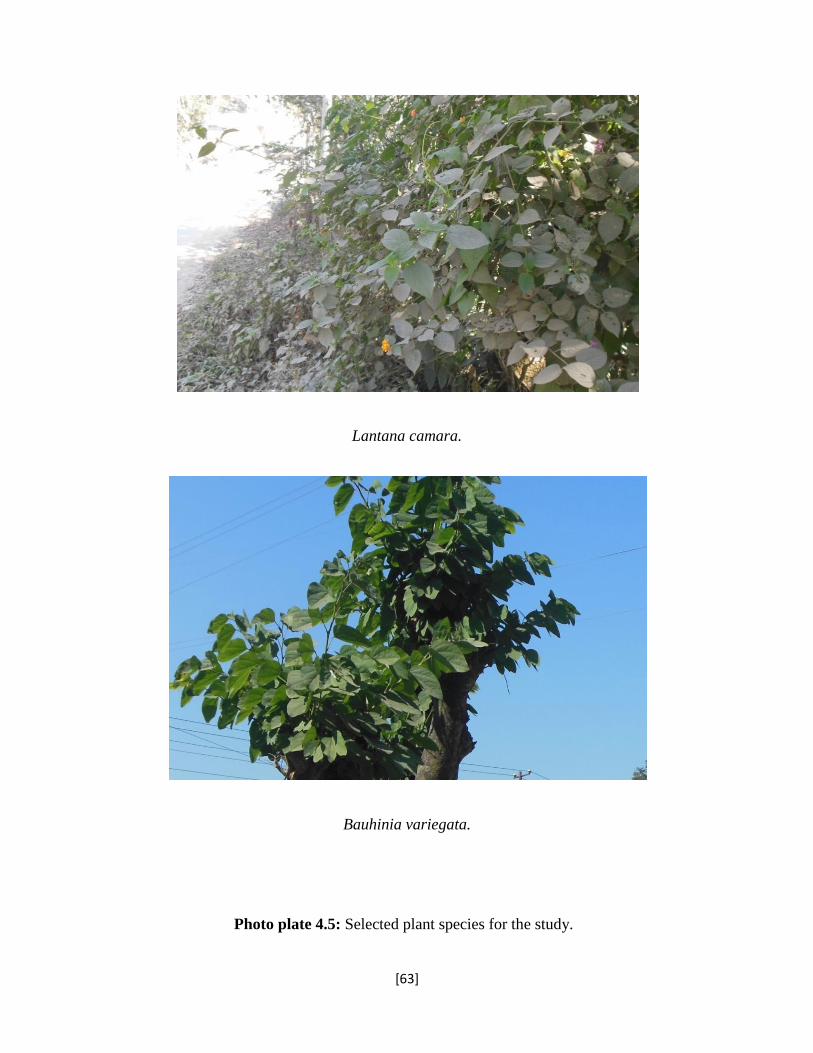
[63]
Lantana camara.
Bauhinia variegata.
Photo plate 4.5: Selected plant species for the study.

[64]
The magnetic parameters such as magnetic susceptibility (χ), anhysteretic remanent
magnetization (ARM) and saturation isothermal remanent magnetization (SIRM) were
carried out with dried leaves in 10 cc plastic sample pots at K.S. Krishnan Geomagnetic
Research Lab of Indian Institute of Geomagnetism, Allahabad, Uttar Pradesh, India.
4.2.1 Magnetic susceptibility (χ )
The magnetic susceptibility reflects the total composition of the dust deposited on the leaves,
with a prevailing contribution from ferromagnetic minerals, which could show higher
susceptibility values than paramagnetic and diamagnetic minerals, such as, clayor quartz
(Maher and Thompson, 1999; Evans and Heller, 2003; Sant‘Ovaia et al., 2012). A Bartington
(Oxford, England) MS-2B dual frequency susceptibility meter was used (Dearing, 1999) in
measurements. The sensitivity of this instrument was in the range of 10−6m
3kg−1
.
χ LF (10-6
m3kg
-1) = (value/mass) x 10
4.2.2 Anhysteretic remanent magnetisation (ARM)
ARM indicates the magnetic concentration and is also sensitive to the presence of fine grains
∼0.04–1 µm (Thompson and Oldfield,1986), Thus, falling within the respirable size range of
PM2.5; are possessed with high burden of toxicity (Power et al., 2009). ARM was induced in
samples using a Molspin (Newcastle-upon-Tyne, England) A.F. Demagnetiser, whereby a DC
biasing field is generated in the presence of an alternating field, which peaks at 100 milli-Tesla
(mT). The nature of this magnetic field magnetizes the fine magnetic grains and the amount of
magnetization retained within the sample (remanence) when removed from the field was
measured using a Molspin1A magnetometer. The samples were then demagnetised to remove
this induced field in preparation for the subsequent magnetic analysis (Walden, 1999).

[65]
ARM (10-5
Am2kg
-1) =Value/ (mass x 0.4 x 79.6)
4.2.3 Saturation Isothermal remanent magnetisation (SIRM)
SIRM indicates the total concentration of magnetic grains (Evans and Heller, 2003) and can
be used as a proxy of PM concentration (Muxworthy et al., 2003). SIRM involves with
measuring the magnetic remanence of samples once removed from an induced field. Using a
Molspin Pulse Magnetizer, a saturation isothermal remanent magnetization (SIRM) of 800
mT in the forward field was induced with the samples. At this high magnetization field, all
magnetic grains within the sample become magnetized (Power et al., 2009). SIRM is actually
the highest level of magnetic remanence that can be induced in a particular sample through
application of high magnetic field; Unit- Am2.The instruments used for ARM and SIRM are
fully automated.
4.2.4 S-ratio
The ratio of IRM-300 and SIRM is defined as the S-ratio (King and Channell, 1991). The S-
ratio mainly reflects the relative proportion of antiferromagnetic to ferrimagnetic minerals in a
sample. A ratio close to 1.0 reflects almost pure magnetite while ratios of <0.8 indicate the
presence of some antiferromagnetic minerals, generally goethite or haematite (Thompson,
1986).
4.3 Statistical analysis
All statistical calculation was performed using Statistical Programme for Social Science
(SPSS version 11.2).

[66]
CHAPTER- 5
RESULTS AND DISCUSSION
_________________________________________________________________
5.1 Particulate pollutants
The average seasonal values of two air pollutants (SPM and RSPM) recorded at four study
sites throughout two years sampling period is presented in Tables 5.1 and 5.2.
The average concentration of SPM at Ramrikawn, Tanhril, Zarkawt and Durtlang were
263.12 ±0.01, 210.91±0.16, 223.51±0.11 and 220.22±0.24 µg/m3 in summer; 260.01±0.12,
207.07±0.41, 229.21±0.02 and 224.07±0.01 µg/m3 in winter and 98.04±0.04, 42.9±0.21,
93.01±0.29 and 87.03±0.32 µg/m3 in rainy seasons respectively for the year of 2013-14. In
2014-15, the mean values of SPM at Ramrikawn, Tanhril, Zarkawt and Durtlang were 272.15
±0.11, 217.11±0.06, 230.81±0.21 and 227.72±0.14 µg/m3 in summer; 277.11±0.08,
214.08±0.19, 236.06±0.08 and 231.52±0.03 µg/m3 in winter and 93.04±0.12, 49.7±0.06,
98.31±0.07 and 81.09±0.28 µg/m3 in rainy seasons respectively.
The mean values of RSPM at Ramrikawn, Tanhril, Zarkawt and Durtlang were 228.09
±0.23, 102.31±0.02, 189.03±0.08 and 183.41±0.03 µg/m3 in summer; 232.23±0.19,
109.28±0.04, 200.61±0.41 and 190.15±0.11 µg/m3 in winter and 71.21±0.83, 20.18±0.12,
63.18±0.19 and 56.91±0.05 µg/m3 in rainy seasons respectively for the year of 2013-14. In
2014-15, average concentration of RSPM at Ramrikawn, Tanhril, Zarkawt and Durtlang were
231.18 ±0.01, 108.82±0.07, 192.08±0.02 and 188.38±0.12 µg/m3 in summer; 237.07±0.06,
114.51±0.11, 203.21±0.21 and 193.62±0.23 µg/m3 in winter and 78.17±0.29, 21.12±0.26,
72.05±0.08 and 61.06±0.09 µg/m3 in rainy seasons respectively.

[67]
Table 5.1: The average concentration of two air pollutants (SPM and RSPM) at four different study sites during 2013 - 14.
Air Pollutants
Ramrikawn
Tanhril
Zarkawt
Durtlang
CPCB
standard (Residential
and Rural
area)
Summer
Winter
Rainy
Summer
Winter
Rainy
Summer
Winter
Rainy
Summer
Winter
Rainy
SPM (µg m-3
)
263.12±
0.01
260.01±
0.12
98.04±
0.04
210.91±
0.16
207.07±
0.41
42.9±
0.21
223.51±
0.11
229.21±
0.02
93.01±
0.29
220.22±
0.24
224.07±
0.01
87.03±
0.32
200
RSPM (µg m-3
)
228.09±
0.23
232.23±
0.19
71.21±
0.83
102.31±
0.02
109 .28±
0.04
20.18±
0.12
189.03±
0.08
200.61±
0.41
63.18±
0.19
183.41±
0.03
190.15±
0.11
56.91±
0.05
100
Table 5.2: The average concentration of two air pollutants (SPM and RSPM) at four different study sites during 2014 - 15.
Air Pollutants
Ramrikawn
Tanhril
Zarkawt
Durtlang
CPCB
standard (Residential
and Rural
area)
Summer
Winter
Rainy
Summer
Winter
Rainy
Summer
Winter
Rainy
Summer
Winter
Rainy
SPM (µg m-3
)
272.15±
0.11
277.11±
0.08
93.04±
0.12
217.11±
0.06
214.08±
0.19
49.7±
0.06
230.81±
0.21
236.06±
0.08
98.31±
0.07
227.72±
0.14
231.52±
0.03
81.09±
0.28
200
RSPM (µg m-3
)
231.18±
0.01
237.07±
0.06
78.17±
0.29
108.82±
0.07
114.51±
0.11
21.12±
0.26
192.08±
0.02
203.21±
0.21
72.05±
0.08
188.38±
0.12
193.62±
0.23
61..06±
0.09
100
SPM- Suspended particulate matter, RSPM- Respirable suspended particulate matter, CPCB -Central Pollution Control Board, New Delhi, India.

[68]
Figure 5.1: Concentration of SPM (µg m-3
) at different sites of Aizawl.
Figure 5.2: Concentration of SPM (µg m-3
) at different sites of Aizawl.
0
50
100
150
200
250
Summer
Winter
Rainy
Co
nce
ntr
atio
n (
µg
m-3
)
Concentration of SPM
(2013-14)
0
50
100
150
200
250
300
Summer
Winter
Rainy
Conce
ntr
atio
n (µ
g m
-3 )
Concentration of SPM
(2014-15)

[69]
Figure 5.3: Concentration of RSPM (µg m-3
) at different sites of Aizawl.
Figure 5.4: Concentration of RSPM (µg m-3
) at different sites of Aizawl.
0
50
100
150
200
250
RamrikawnTanhril
ZarkawtDurtlang
Summer
Winter
Rainy
Concentration of RSPM
2013-14
Conce
ntr
atio
n (µ
g m
-3 )
0
50
100
150
200
250
RamrikawnTanhril
ZarkawtDurtlang
Summer
Winter
Rainy
Concentration of RSPM
2014-15
Conce
ntr
atio
n (µ
g m
-3 )

[70]
The ambient PM concentrations were recorded highest at Ramrikawn, followed by
Zarkawt and Durtlang, while lowest values were recorded at Tanhril site. The quantity of
SPM and RSPM at four different the sites were much higher than the prescribed limits of
Central Pollution Control Board (CPCB) of India during summer and winter season. The
values of particulate pollutants were lowest in rainy season which may be because of large
precipitations whereas summer and winter seasons were characterized by nearly same
concentration at all four different study sites. During winter season there is increased
atmospheric stability, which in turn allows for less general circulation and thus more stagnant
air masses (Verma and Singh, 2006). It prevents an upward movement of air, hence
atmospheric mixing is retarded and pollutants are trapped near the ground. Secondly, cold
starts in winter lead to longer period incomplete combustion and longer warm up times for
catalytic converter, which generate more pollution (Shukla et al., 2010). Vehicular exhaust,
construction work, commercial activities; practice of jhum cultivation, bad road condition (at
the time of study) may be the reason for the augmented concentration of air pollutants at
different study sites. During rainy season very negligible PMs were found in plant leaves
therefore we were not taking this season for magnetic analysis.
5.2 Magnetic analysis
The average magnetic data collected throughout two years sampling period is presented in
Tables 5.3 to 5.10, respectively for all ten tree leaves.
5.2.1 Magnetic susceptibility (χ)
Magnetic susceptibility (χ) values of Ramrikawn site ranged from 20.22±0.07 to 52.28±0.21
(10-7
m3
kg-1
) in winter with maximum in Ficus benghalensis (52.28±0.21) (10-7
m3
kg-1
) and

[71]
minimum in Bauhinia variegata (20.22±0.07) (10-7
m3
kg-1
); 15.33±0.37 to 29.11±0.22 (10-7
m3
kg-1
) in summer with maximum in Artocarpus heterophyllus (29.11±0.22) (10-7
m3
kg-1
)
and minimum in Bauhinia variegata (15.33±0.37) (10-7
m3 kg
-1).
The minimum and maximum values of Magnetic susceptibility (χ) in Tanhril site
ranged from 11.13±0.02 (10-7
m3
kg-1
) (Cassia auriculata ) to 27.98±1.74 (10-7
m3
kg-1
)
(Ficus bengalensis) and 7.73±0.11 (10-7
m3
kg-1
) (Bauhinia variegata) to 15.11±0.27 (10-7
m3
kg-1
) (Artocarpus heterophyllus) during the winter and summer respectively.
Similarly the values of Magnetic susceptibility (χ) in Zarkawt site ranged from
17.27±0.91 (10-7
m3
kg-1
) (Ficus religiosa) to 45.53±0.19 (10-7
m3
kg-1
) (Mangifera indica)
and 13.23±0.55 (10-7
m3
kg-1
) (Bauhinia variegata) to 27.97±0.11(10-7
m3
kg-1
) (Mangifera
indica) during the winter and summer respectively.
Magnetic susceptibility (χ) values of Durtlang site ranged from 14.19±0.12 to
37.01±0.12 (10-7
m3
kg-1
) in winter with maximum in Ficus benghalensis (37.01±0.12) (10-7
m3
kg-1
) and minimum in Cassia auriculata (14.19±0.12) (10-7
m3
kg-1
); 10.11±0.43 to
25.12±0.52 (10-7
m3
kg-1
) in summer with maximum in Ficus benghalensis (25.12±0.52) (10-7
m3
kg-1
) and minimum in Bauhinia variegata (10.11±0.43) (10-7
m3
kg-1
). Several researches
demonstrated that magnetic susceptibility is a useful proxy parameter to monitor the regional
distribution of air PM matter pollution or relative changes in an area (e.g., Moreno et al.,
2003; Gautam et al., 2005; Sant‘Ovaia et al., 2012; Rai et al., 2014).
5.2.2 Anhysteretic remanent magnetisation (ARM)
ARM values of Ramrikawn site ranged from 8.24±0.31 to 48.72±0.92 (10-5
Am2
kg-1
) in
winter with maximum in Ficus benghalensis (48.72±0.92) (10-5
Am2
kg-1
) and minimum in
Bauhinia variegata (8.24±0.31) (10-5
Am2
kg-1
); 13.39±0.11 to 26.92±0.77 (10-5
Am2
kg-1
) in

[72]
summer with maximum in Artocarpus heterophyllus (26.92±0.77) (10-5
Am2
kg-1
) and
minimum in Cassia auriculata (13.39±0.11) (10-5
Am2
kg-1
).
The minimum and maximum values of ARM in Tanhril site ranged from
5.01±0.11(10-5
Am2
kg-1
) (Psidium guajava) to 23.31±0.51 (10-5
Am2
kg-1
) (Ficus
bengalensis) and 6.23±0.71 (10-5
Am2 kg
-1) (Bauhinia variegata) to 13.21±0.63 (10
-5 Am
2 kg
-
1) (Artocarpus heterophyllus) during the winter and summer respectively.
Similarly the values of ARM in Zarkawt site ranges from 8.19±0.41 (10-5
Am2
kg-1
)
(Lantana camara) to 42.33±0.73 (10-5
Am2
kg-1
) (Mangifera indica) and 10.27±0.49(10-5
Am2
kg-1
) (Cassia auriculata ) to 25.92±0.11 (10-5
Am2
kg-1
) (Mangifera indica) during the
winter and summer respectively.
ARM values of Durtlang site ranged from 4.46±0.23 to 33.28±0.07 (10-5
Am2
kg-1
) in
winter with maximum in Mangifera indica (33.28±0.07) (10-5
Am2
kg-1
) and minimum in
Psidium guajava (4.46±0.23) (10-5
Am2
kg-1
); 9.01±0.27 to 23.97±0.07 (10-5
Am2
kg-1
) in
summer with maximum in Ficus benghalensis (23.97±0.07) (10-5
Am2 kg
-1) and minimum in
Bauhinia variegata (9.01±0.27) (10-5
Am2
kg-1
).

[73]
Table 5.3: Summary of the magnetic data (mean and standard error) for roadside dusts on different selective plant (tree & shrubs) leaves at
Ramrikawn area.
Plants
χ
(10-7
m3 kg
-1)
ARM
(10-5
Am2 kg
-1)
SIRM
(10-5
Am2 kg
-1)
ARM/ χ
(102Am
-1)
SIRM/ χ
(102Am
-1)
S-ratio
2013-14 (Winter)
2014-15 (Winter)
2013-14 (Winter)
2014-15 (Winter)
2013-14 (Winter)
2014-15 (Winter)
2013-14 (Winter)
2014-15 (Winter)
2013-14 (Winter)
2014-15 (Winter)
2013-14 (Winter)
2014-15 (Winter)
Mangifera indica
46.27 0.71 48.56 0.22 44.960.17 43.77 0.28 284.96 0.72 296.21 0.17 0.97 0.90 6.15 6.09 0.963 0.967
Artocarpus heterophyllus
38.21 0.42 38.41 0.17 23.10 0.31 24.11 0.17 265.21 0.61 278.19 0.19 0.60 0.62 6.94 7.24 0.951 0.959
Ficus bengalensis
49.71 0.21 52.28 0.21 43.01 0.27 48.72 0.92 314.52 0.11 298.15 0.31 0.86 0.93 6.32 5.70 0.961 0.967
Psidium guajava
44.780.15 47.11 0.12 40.74 0.49 40.23 0.21 292.62 0.77 301.27 0.11 0.90 0.85 6.53 6.39 0.952 0.957
Lantana camara
37.09 0.81 38.12 0.91 8.24 0.31 9.19 0.44 203.70 0.52 211.90 0.71 0.22 0.24 5.49 5.55 0.951 0.958
Bauhinia variegata
20.22 0.07 21.44 0.27 18.47 0.97 17.27 0.23 262.14 0.94 273.47 0.56 0.91 0.80 12.96 12.75 0.941 0.947
Cassia auriculata
21.45 0.25 21.77 0.72 20.77 0.14 19.29 0.14 242.72 0.09 273.33 0.13 0.96 0.88 11.31 12.55 0.947 0.944
Hibiscus rosa-sinensis
25.12 0.38 26.33 0.21 23.72 0.22 24.17 0.32 266.19 0.36 276.72 0.22 0.94 0.91 10.59 10.50 0.931 0.934
Ficus religiosa
23.42 0.14 24.17 0.17 22.32 0.36 23.91 0.14 277.41 0.41 291.72 0.11 0.95 0.98 11.84 12.06 0.941 0.952
Bougainvillea spectabilis
28.42 0.08 29.22 0.27 29.32 0.22 30.01 0.24 273.41 0.31 278.22 0.11 1.03 1.02 9.62 9.52 0.938 0.939

[74]
Table 5.4: Summary of the magnetic data (mean and standard error) for roadside dusts on different selective plant (tree & shrubs) leaves at
Tanhril area.
Plants
χ
(10-7
m3 kg
-1)
ARM
(10-5
Am2 kg
-1)
SIRM
(10-5
Am2 kg
-1)
ARM/ χ
(102Am
-1)
SIRM/ χ
(102Am
-1)
S-ratio
2013-14 (Winter)
2014-15 (Winter)
2013-14 (Winter)
2014-15 (Winter)
2013-14 (Winter)
2014-15 (Winter)
2013-14 (Winter)
2014-15 (Winter)
2013-14 (Winter)
2014-15 (Winter)
2013-14 (Winter)
2014-15 (Winter)
Mangifera indica
23.71 0.11 23.19 0.72 10.71 0.24 12.10 0.13 177.41 0.41 181.09 0.02 0.45 0.52 7.48 7.80 0.941 0.952
Artocarpus heterophyllus
24.44 0.27 24.48 0.71 20.24 0.08 19.22 0.26 206.11 0.37 218.28 0.98 0.82 0.78 8.43 8.91 0.919 0.928
Ficus bengalensis
25.19 0.91 27.98 0.14 21.76 0.82 23.31 0.51 203.96 0.56 214.520.93 0.86 0.83 8.09 7.66 0.901 0.912
Psidium guajava
23.11 0.21 23.27 0.23 5.01 0.11 5.67 0.27 154.2 0.17 158.27 0.42 0.21 0.24 6.66 6.80 0.954 0.958
Lantana camara
19.72 0.41 19.83 0.44 7.19 0.18 8.27 0.51 140.41 0.44 148.17 0.27 0.36 0.41 7.12 7.47 0.954 0.957
Bauhinia variegata
12.14 0.03 11.94 0.27 10.23 0.99 10.37 0.24 112.42 0.26 130.44 0.29 0.84 0.86 9.26 10.92 0.877 0.881
Cassia auriculata
11.13 0.02 12.67 0.17 09.18 0.19 11.27 0.79 133.76 0.29 140.51 0.11 0.82 0.88 12.01 11.08 0.881 0.897
Hibiscus rosa-sinensis
12.13 0.11 12.44 0.27 10.18 0.18 11.21 0.03 168.76 0.18 172.12 0.17 0.83 0.90 13.91 13.83 0.982 0.981
Ficus religiosa
11.41 0.14 11.92 0.22 10.74 0.19 9.27 0.13 122.47 0.03 131.24 0.32 0.94 0.77 10.73 11.01 0.931 0.929
Bougainvillea spectabilis
11.14 0.09 11.29 0.14 9.38 0.11 11.22 0.73 150.44 0.15 156.21 0.22 0.84 0.99 13.50 13.83 0.873 0.877

[75]
Table 5.5: Summary of the magnetic data (mean and standard error) for roadside dusts on different selective plant (tree & shrubs) leaves at
Zarkawt area.
Plants
χ
(10-7
m3 kg
-1)
ARM
(10-5
Am2 kg
-1)
SIRM
(10-5
Am2 kg
-1)
ARM/ χ
(102Am
-1)
SIRM/ χ
(102Am
-1)
S-ratio
2013-14 (Winter)
2014-15 (Winter)
2013-14 (Winter)
2014-15 (Winter)
2013-14 (Winter)
2014-15 (Winter)
2013-14 (Winter)
2014-15 (Winter)
2013-14 (Winter)
2014-15 (Winter)
2013-14 (Winter)
2014-15 (Winter)
Mangifera indica
43.08 0.21 45.53 0.19 40.27 0.01 42.33 0.73 271.21 0.09 268.19 0.92 0.93 0.92 6.29 5.89 0.960 0.958
Artocarpus heterophyllus
39.19 0.42 40.23 0.27 12.76 0.29 13.27 0.17 266.11 0.61 268.19 0.27 0.32 0.32 6.79 6.66 0.953 0.951
Ficus bengalensis
43.19 0.17 44.28 0.76 40.71 0.42 38.91 0.53 281.03 0.52 289.09 0.05 0.94 0.87 6.50 6.52 0.960 0.962
Psidium guajava
34.62 0.29 36.19 0.72 9.53 0.38 12.13 0.91 273.41 0.63 295.12 0.17 0.27 0.33 7.89 8.15 0.953 0.961
Lantana camara
33.87 0.54 33.96 0.17 8.19 0.41 12.240.14 201.42 0.26 219.210.03 0.24 0.36 5.94 6.45 0.952 0.961
Bauhinia variegata
17.42 0.92 18.19 0.12 16.43 0.03 16.330.14 248.720.6 246.11 0.72 0.94 0.89 14.27 13.52 0.934 0.931
Cassia auriculata
21.14 0.11 22.77 0.72 17.69 0.22 18.97 0.12 232.09 0.12 250.17 0.91 0.83 0.83 10.97 10.98 0.912 0.921
Hibiscus rosa-sinensis
26.14 0.18 26.77 0.03 24.69 0.08 25.17 0.21 256.09 0.29 263.12 0.14 0.94 0.94 9.79 9.82 0.972 0.978
Ficus religiosa
17.270.91 19.24 0.31 16.230.31 18.040.91 203.91 0.13 219.03 0.74 0.93 0.93 11.80 11.38 0.940 0.942
Bougainvillea spectabilis
22.07 0.39 22.11 0.27 20.12 0.21 21.71 0.17 238.72 0.28 267.11 0.03 0.91 0.98 10.81 12.08 0.901 0.912

[76]
Table 5.6: Summary of the magnetic data (mean and standard error) for roadside dusts on different selective plant (tree & shrubs) leaves at
Durtlang area.
Plants
χ
(10-7
m3 kg
-1)
ARM
(10-5
Am2 kg
-1)
SIRM
(10-5
Am2 kg
-1)
ARM/ χ
(102Am
-1)
SIRM/ χ
(102Am
-1)
S-ratio
2013-14 (Winter)
2014-15 (Winter)
2013-14 (Winter)
2014-15 (Winter)
2013-14 (Winter)
2014-15 (Winter)
2013-14 (Winter)
2014-15 (Winter)
2013-14 (Winter)
2014-15 (Winter)
2013-14 (Winter)
2014-15 (Winter)
Mangifera indica
34.27 0.24 36.27 0.27 31.17 0.62 33.28 0.07 242.45 0.21 249.24 0.87 0.90 0.91 7.07 6.87 0.933 0.924
Artocarpus heterophyllus
29.01 0.38 31.92 0.12 5.09 0.73 7.27 0.11 153.83 0.34 162.17 0.13 0.17 0.22 5.30 5.08 0.961 0.960
Ficus bengalensis
36.77 0.09 37.01 0.12 31.42 0.51 29.56 0.91 270.210.64 274.39 0.49 0.85 0.79 7.34 7.41 0.943 0.940
Psidium guajava
26.81 0.25 27.11 0.45 4.46 0.23 8.16 0.42 153.11 0.27 171.42 0.18 0.16 0.30 5.71 6.32 0.962 0.968
Lantana camara
28.59 0.39 29.11 0.12 4.48 0.29 7.21 0.16 153.21 0.31 167.81 0.33 0.15 0.24 5.35 5.76 0.963 0.972
Bauhinia variegata
17.23 0.13 17.49 0.27 15.97 0.14 16.27 0.49 171.01 0.24 178.72 0.29 0.92 0.93 9.92 10.21 0.907 0.919
Cassia auriculata
14.19 0.12 14.78 0.27 12.91 0.44 11.02 0.74 149.11 0.14 137.39 0.67 0.90 0.74 10.50 9.29 0.938 0.941
Hibiscus rosa-sinensis
16.12 0.23 16.18 0.17 14.47 0.38 15.17 0.22 192.77 0.11 201.23 0.27 0.89 0.93 11.95 12.43 0.931 0.938
Ficus religiosa
14.19 0.32 15.93 0.23 12.23 0.17 13.270.72 167.57 0.31 180.24 0.11 0.86 0.83 11.80 11.31 0.895 0.899
Bougainvillea spectabilis
17.19 0.07 18.21 0.19 15.23 0.04 15.77 0.91 201.57 0.21 220.12 0.17 0.88 0.86 11.72 12.08 0.925 0.931

[77]
Table 5.7: Summary of the magnetic data (mean and standard error) for roadside dusts on different selective plant (tree & shrubs) leaves at
Ramrikawn area.
Plants
χ
(10-7
m3 kg
-1)
ARM
(10-5
Am2 kg
-1)
SIRM
(10-5
Am2 kg
-1)
ARM/ χ
(102Am
-1)
SIRM/ χ
(102Am
-1)
S-ratio
2013-14 (Summer)
2014-15 (Summer)
2013-14 (Summer)
2014-15 (Summer)
2013-14 (Summer)
2014-15 (Summer)
2013-14 (Summer)
2014-15 (Summer)
2013-14 (Summer)
2014-15 (Summer)
2013-14 (Summer)
2014-15 (Summer)
Mangifera indica
27.27 0.96 26.11 0.81 26.01 0.51 24.17 0.27 301.710.11 293.220.23 0.95 0.92 11.06 11.23 0.951 0.942
Artocarpus heterophyllus
28.36 0.74 29.11 0.22 26.52 0.19 26.92 0.77 331.090.66 321.760.27 0.93 0.92 11.67 11.05 0.947 0.942
Ficus bengalensis
24.42 0.31 27.190.11 23.72 0.22 25.11 0.72 281.430.18 293.150.41 0.97 0.92 11.52 10.78 0.931 0.942
Psidium guajava
26.12 0.41 28.47 0.71 24.09 0.23 25.41 0.27 290.530.27 286.140.22 0.92 0.89 11.12 10.05 0.942 0.944
Lantana camara
23.21 0.08 25.37 0.11 22.01 0.17 23.77 0.22 271.510.29 287.170.11 0.94 0.93 11.69 11.31 0.944 0.946
Bauhinia variegata
15.33 0.37 17.81 0.56 14.35 0.11 15.25 0.28 177.140.09 168.290.47 0.93 0.85 11.55 9.44 0.901 0.908
Cassia auriculata
15.43 0.26 16.29 29 13.39 0.11 14.29 0.03 180.110.03 184.270.19 0.86 0.87 11.67 11.31 0.901 0.912
Hibiscus rosa-sinensis
19.77 0.03 21.29 0.04 17.56 0.57 20.14 0.27 191.110.07 188.270.16 0.88 0.94 9.66 8.84 0.943 0.948
Ficus religiosa
18.74 0.01 17.19 0.57 16.52 0.71 15.44 0.24 165.110.08 171.470.25 0.88 0.89 8.81 9.97 0.931 0.933
Bougainvillea spectabilis
21.47 0.56 22.10 0.17 18.54 0.29 20.27 0.33 170.770.52 168.57 0.77 0.86 0.91 7.95 7.62 0.941 0.944

[78]
Table 5.8: Summary of the magnetic data (mean and standard error) for roadside dusts on different selective plant (tree & shrubs) leaves at
Tanhril area.
Plants
χ
(10-7
m3 kg
-1)
ARM
(10-5
Am2 kg
-1)
SIRM
(10-5
Am2 kg
-1)
ARM/ χ
(102Am
-1)
SIRM/ χ
(102Am
-1)
S-ratio
2013-14 (Summer)
2014-15 (Summer)
2013-14 (Summer)
2014-15 (Summer)
2013-14 (Summer)
2014-15 (Summer)
2013-14 (Summer)
2014-15 (Summer)
2013-14 (Summer)
2014-15 (Summer)
2013-14 (Summer)
2014-15 (Summer)
Mangifera indica
12.33 0.11 14.39 0.24 10.38 0.11 12.41 0.27 141.330.21 161.190.39 0.84 0.86 11.46 11.20 0.867 0.891
Artocarpus heterophyllus
15.07 0.71 15.11 0.27 13.11 0.29 13.21 0.63 152.17 0.91 148.420.17 0.86 0.87 10.09 9.82 0.917 0.911
Ficus bengalensis
12.41 0.76 11.09 0.44 11.27 0.44 10.02 0.71 189.560.72 196.030.31 0.90 0.90 15.27 17.67 0.871 0.887
Psidium guajava
14.77 0.09 11.17 0.91 13.21 0.11 10.110.14 201.11 0.77 180.44 0.19 0.89 0.90 13.61 16.15 0.901 0.913
Lantana camara
11.81 0.07 12.01 0.24 10.81 0.17 11.17 0.54 132.770.05 138.140.95 0.91 0.93 11.24 11.50 0.867 0.877
Bauhinia variegata
7.73 0.11 9.39 0.06 6.23 0.71 7.74 0.44 119.270.21 110.010.03 0.80 0.82 15.42 11.71 0.863 0.861
Cassia auriculata
9.11 0.44 11.19 0.25 7.14 0.33 10.51 0.71 106.720.31 117.440.97 0.78 0.93 11.71 10.49 0.887 0.884
Hibiscus rosa-sinensis
11.08 0.14 13.81 0.14 10.11 0.25 11.27 0.83 108.230.55 112.110.31 0.91 0.81 9.76 8.11 0.801 0.813
Ficus religiosa
8.11 0.56 10.11 0.87 6.29 0.07 8.17 0.55 109.230.56 106.230.07 0.77 0.80 13.46 10.50 0.831 0.838
Bougainvillea spectabilis
11.48 0.16 12.18 0.22 10.03 0.22 11.19 0.13 119.55 0.11 134.310.11 0.87 0.91 10.41 11.02 0.861 0.877

[79]
Table 5.9: Summary of the magnetic data (mean and standard error) for roadside dusts on different selective plant (tree & shrubs) leaves at
Zarkawt area.
Plants
χ
(10-7
m3 kg
-1)
ARM
(10-5
Am2 kg
-1)
SIRM
(10-5
Am2 kg
-1)
ARM/ χ
(102Am
-1)
SIRM/ χ
(102Am
-1)
S-ratio
2013-14 (Summer)
2014-15 (Summer)
2013-14 (Summer)
2014-15 (Summer)
2013-14 (Summer)
2014-15 (Summer)
2013-14 (Summer)
2014-15 (Summer)
2013-14 (Summer)
2014-15 (Summer)
2013-14 (Summer)
2014-15 (Summer)
Mangifera indica
26.77 0.09 27.97 0.11 24.47 0.26 25.92 0.11 291.110.26 298.410.77 0.91 0.92 10.87 10.66 0.941 0.947
Artocarpus heterophyllus
24.20 0.72 25.26 0.92 22.94 0.56 24.19 0.12 277.560.17 268.240.56 0.94 0.95 11.46 10.61 0.961 0.967
Ficus bengalensis
22.11 0.51 24.41 0.93 19.12 0.81 20.97 0.33 248.110.12 259.120.74 0.86 0.85 11.22 10.61 0.921 0.931
Psidium guajava
26.11 0.09 26.38 0.14 24.27 0.23 24.38 0.11 301.140.23 316.130.19 0.92 0.92 11.53 11.98 0.932 0.939
Lantana camara
20.75 0.18 23.27 0.17 20.05 0.08 21.01 0.21 244.310.12 247.110.14 0.96 0.90 11.77 10.61 0.931 0.944
Bauhinia variegata
13.23 0.71 13.27 0.23 11.27 0.08 11.21 0.14 170.260.01 183.240.26 0.85 0.84 12.86 13.80 0.891 0.893
Cassia auriculata
13.23 0.55 13.48 0.24 10.27 0.49 10.38 0.17 168.23 0.56 171.280.07 0.77 0.77 12.71 12.70 0.887 0.884
Hibiscus rosa-sinensis
17.48 0.13 18.19 0.49 15.17 0.19 16.14 0.47 183.180.44 180.130.41 0.86 0.88 10.47 9.90 0.938 0.933
Ficus religiosa
16.27 0.17 18.56 0.18 13.49 0.13 16.27 0.56 124.480.14 129.230.78 0.82 0.87 7.65 6.96 0.930 0.933
Bougainvillea spectabilis
18.31 0.91 17.44 0.29 15.42 0.79 16.72 0.57 168.11 0.65 159.230.12 0.84 0.95 9.18 9.13 0.938 0.934

[80]
Table 5.10: Summary of the magnetic data (mean and standard error) for roadside dusts on different selective plant (tree & shrubs) leaves at
Durtlang area.
Plants
χ
(10-7
m3 kg
-1)
ARM
(10-5
Am2 kg
-1)
SIRM
(10-5
Am2 kg
-1)
ARM/ χ
(102Am
-1)
SIRM/ χ
(102Am
-1)
S-ratio
2013-14 (Summer)
2014-15 (Summer)
2013-14 (Summer)
2014-15 (Summer)
2013-14 (Summer)
2014-15 (Summer)
2013-14 (Summer)
2014-15 (Summer)
2013-14 (Summer)
2014-15 (Summer)
2013-14 (Summer)
2014-15 (Summer)
Mangifera indica
23.19 0.74 24.77 0.04 20.92 0.07 21.73 0.02 227.290.61 241.110.23 0.90 0.87 9.80 9.73 0.932 0.938
Artocarpus heterophyllus
20.11 0.14 23.19 0.45 18.52 0.29 21.22 0.02 197.44 0.21 192.110.16 0.90 0.91 9.67 8.28 0.924 0.919
Ficus bengalensis
23.17 0.19 25.12 0.52 21.22 0.11 23.97 0.07 290.470.26 286.120.14 0.91 0.95 12.53 11.39 0.917 0.921
Psidium guajava
15.12 0.31 17.92 0.77 14.22 0.44 16.31 0.17 188.240.35 201.190.17 0.94 0.91 12.44 11.22 0.912 0.922
Lantana camara
14.03 0.11 15.97 0.41 12.56 0.41 13.97 0.47 153.420.71 167.140.17 0.89 0.87 10.93 10.46 0.891 0.901
Bauhinia variegata
10.11 0.43 12.17 0.29 9.010.27 10.24 0.06 128.17 0.52 121.110.07 0.89 0.84 12.67 9.95 0.889 0.884
Cassia auriculata
12.42 0.72 14.41 0.17 10.42 0.99 12.120.07 103.210.03 112.010.19 0.83 0.84 8.30 7.77 0.897 0.892
Hibiscus rosa-sinensis
13.32 0.72 13.92 0.07 11.48 0.56 12.79 0.92 110.02 0.11 118.230.49 0.86 0.91 8.25 8.49 0.891 0.897
Ficus religiosa
11.72 0.24 13.18 0.17 10.48 0.14 11.29 0.43 114.110.31 110.440.49 0.89 0.85 9.73 8.37 0.842 0.850
Bougainvillea spectabilis
13.14 0.77 13.77 0.72 11.07 0.14 11.19 0.79 168.23 0.18 161.440.17 0.84 0.81 12.80 11.72 0.917 0.921

[81]
5.2.3 Saturation Isothermal remanent magnetisation (SIRM)
SIRM values of Ramrikawn site ranged from 203.70±0.52 to 314.52±0.11(10-5
Am2
kg-1
) in
winter with maximum in Ficus benghalensis (314.52±0.11) (10-5
Am2
kg-1
) and minimum in
Lantana camara (203.70±0.52) (10-5
Am2
kg-1
); 165.11±0.08 to 331.09±0.66 (10-5
Am2
kg-1
)
in summer with maximum in Artocarpus heterophyllus (331.09±0.66) (10-5
Am2
kg-1
) and
minimum in Ficus religiosa (165.11±0.08) (10-5
Am2
kg-1
).
The minimum and maximum values of SIRM in Tanhril site ranged from 112.42±0.26
(10-5
Am2
kg-1
) (Bauhinia variegata) to 218.28±0.98 (10-5
Am2
kg-1
) (Artocarpus
heterophyllus) and 106.23±0.07(10-5
Am2 kg
-1) (Ficus religiosa) to 201.11±0.77(10
-5 Am
2 kg
-
1) (Psidium guajava) during the winter and summer respectively.
Similarly the values of SIRM in Zarkawt site ranges from 201.42±0.26(10-5
Am2
kg-1
)
(Lantana camara) to 295.12±0.17(10-5
Am2
kg-1
) (Psidium guajava) and 124.48±0.14(10-5
Am2
kg-1
) (Ficus religiosa) to 316.13±0.19 (10-5
Am2
kg-1
) (Psidium guajava) during the
winter and summer respectively.
SIRM values of Durtlang site ranged from 137.39±0.67 to 274.39±0.49 (10-5
Am2 kg
-1)
in winter with maximum in Ficus benghalensis (274.39±0.49) (10-5
Am2
kg-1
) and minimum
in Cassia auriculata (137.39±0.67) (10-5
Am2
kg-1
); 103.21±0.03 to 290.47±0.26 (10-5
Am2
kg-1
) in summer with maximum in Ficus benghalensis (290.47±0.26) (10-5
Am2
kg-1
)and
minimum in Cassia auriculata (103.21±0.03) (10-5
Am2 kg
-1).
The values of ARM/ χ and SIRM/ χ can reflect the grain size of magnetic minerals
(Thompson and Oldfield, 1986; Evans and Heller, 2003). The results show that the ARM/ χ
and SIRM/ χ values are found to be low at all studied sites (Table 5.3 to 5.10). ARM/ χ
values are ranged from 0.15 to 1.03 (102Am
-1) and SIRM/ χ values are ranged from 5.08 to

[82]
17.67 (102Am
-1) respectively for all study sites. Low values of ARM/ χ and SIRM/ χ indicate
relatively large grain size of magnetic particles present in leaf samples (Yin et al., 2013). S-
ratio of leaf samples are ranging from 0.801 to 0.982 (Tables 5.3 to 5.10), which indicates
that these leaf samples are dominated by ‗soft‘ magnetic minerals with a low coercive force,
associated partly with ‗hard‘ magnetic minerals with a relatively high coercive force
(Robinson, 1986).
Table 5.11: Correlation between magnetic measurements of Mangifera indica with SPM and RSPM at
four different study sites.
Magnetic
Parameter
SPM ( R2 )
RSPM ( R2 )
2013-14
2014-15
2013-14
2014-15
Winter
Summer
Winter
Summer
Winter
Summer
Winter
Summer
χ
0.787
0.435
0.695
0.279
0.920
0.924
0.932
0.815
ARM
0.759
0.502
0.595
0.315
0.971
0.950
0.943
0.820
SIRM
0.751
0.531
0.765
0.440
0.970
0.895
0.993
0.850

[83]
Table 5.12: Correlation between magnetic measurements of Artocarpus heterophyllus with SPM and
RSPM at four different study sites.
Magnetic
Parameter
SPM ( R2 )
RSPM ( R2 )
2013-14
2014-15
2013-14
2014-15
Winter
Summer
Winter
Summer
Winter
Summer
Winter
Summer
χ
0.611
0.777
0.497
0.69
0.738
0.905
0.807
0.986
ARM
0.117
0.734
0.267
0.629
0.006
0.910
0.003
0.967
SIRM
0.323
0.770
0.349
0.782
0.179
0.806
0.171
0.799
Table 5.13: Correlation between magnetic measurements of Ficus bengalensis with SPM and RSPM at
four different study sites.
Magnetic
Parameter
SPM ( R2 )
RSPM ( R2 )
2013-14
2014-15
2013-14
2014-15
Winter
Summer
Winter
Summer
Winter
Summer
Winter
Summer
χ
0.876
0.424
0.876
0.445
0.954
0.933
0.907
0.943
ARM
0.761
0.569
0.899
0.449
0.9
0.955
0.817
0.918
SIRM
0.857
0.329
0.618
0.470
0.995
0.774
0.970
0.899

[84]
Table 5.14: Correlation between magnetic measurements of Psidium guajava with SPM and RSPM at
four different study sites.
Magnetic
Parameter
SPM ( R2 )
RSPM ( R2 )
2013-14
2014-15
2013-14
2014-15
Winter
Summer
Winter
Summer
Winter
Summer
Winter
Summer
χ
0.941
0.487
0.917
0.613
0.738
0.536
0.744
0.833
ARM
0.864
0.483
0.950
0.565
0.452
0.570
0.549
0.815
SIRM
0.660
0.388
0.589
0.322
0.568
0.403
0.616
0.510
Table 5.15: Correlation between magnetic measurements of Lantana camara with SPM and RSPM at
four different study sites.
Magnetic
Parameter
SPM ( R2 )
RSPM ( R2 )
2013-14
2014-15
2013-14
2014-15
Winter
Summer
Winter
Summer
Winter
Summer
Winter
Summer
χ
0.815
0.688
0.783
0.648
0.955
0.733
0.964
0.782
ARM
0.160
0.646
0.027
0.698
0.032
0.688
0.093
0.747
SIRM
0.665
0.663
0.512
0.738
0.695
0.689
0.696
0.739

[85]
Table 5.16: Correlation between magnetic measurements of Bauhinia variegata with SPM and RSPM.
Magnetic
Parameter
SPM ( R2 )
RSPM ( R2 )
2013-14
2014-15
2013-14
2014-15
Winter
Summer
Winter
Summer
Winter
Summer
Winter
Summer
χ
0.858
0.751
0.828
0.943
0.990
0.848
0.992
0.856
ARM
0.778
0.836
0.554
0.942
0.998
0.887
0.950
0.859
SIRM
0.745
0.598
0.764
0.337
0.853
0.666
0.854
0.518
Table 5.17: Correlation between magnetic measurements of Cassia auriculata with SPM and RSPM at
four different study sites.
Magnetic
Parameter
SPM ( R2 )
RSPM ( R2 )
2013-14
2014-15
2013-14
2014-15
Winter
Summer
Winter
Summer
Winter
Summer
Winter
Summer
χ
0.683
0.757
0.507
0.778
0.761
0.981
0.651
0.928
ARM
0.872
0.837
0.551
0.808
0.859
0.950
0.531
0.531
SIRM
0.691
0.588
0.644
0.600
0.670
0.527
0.567
0.499
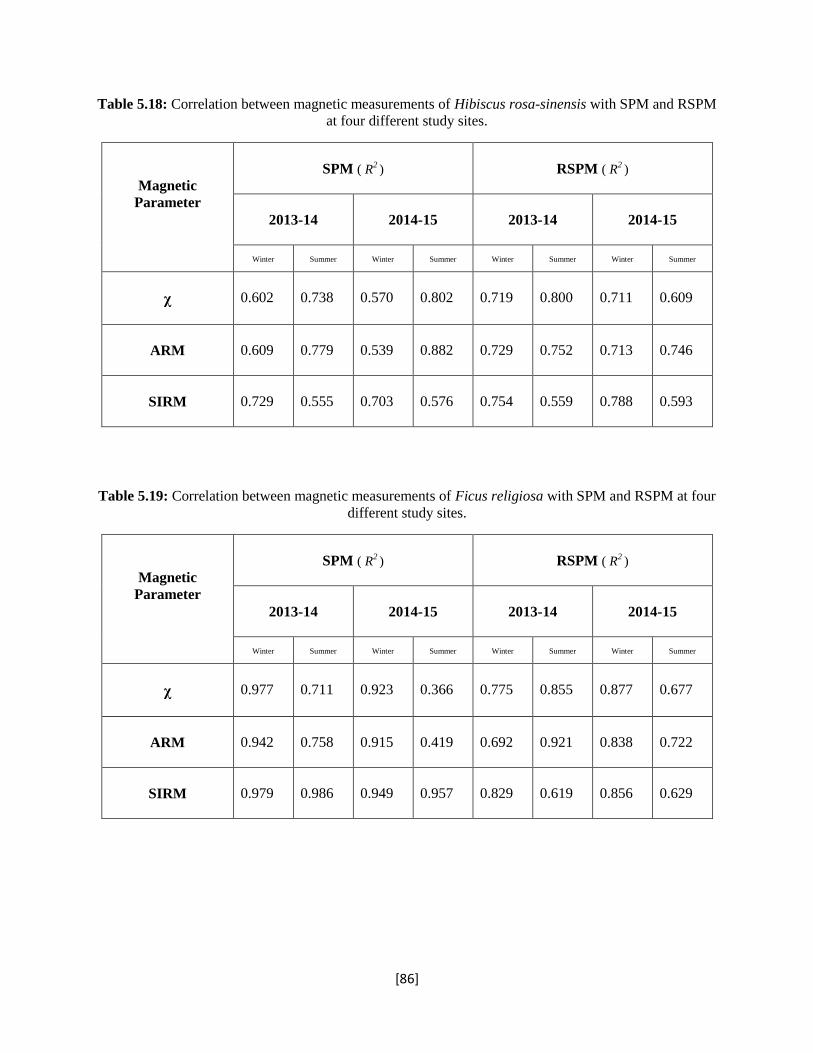
[86]
Table 5.18: Correlation between magnetic measurements of Hibiscus rosa-sinensis with SPM and RSPM
at four different study sites.
Magnetic
Parameter
SPM ( R2 )
RSPM ( R2 )
2013-14
2014-15
2013-14
2014-15
Winter
Summer
Winter
Summer
Winter
Summer
Winter
Summer
χ
0.602
0.738
0.570
0.802
0.719
0.800
0.711
0.609
ARM
0.609
0.779
0.539
0.882
0.729
0.752
0.713
0.746
SIRM
0.729
0.555
0.703
0.576
0.754
0.559
0.788
0.593
Table 5.19: Correlation between magnetic measurements of Ficus religiosa with SPM and RSPM at four
different study sites.
Magnetic
Parameter
SPM ( R2 )
RSPM ( R2 )
2013-14
2014-15
2013-14
2014-15
Winter
Summer
Winter
Summer
Winter
Summer
Winter
Summer
χ
0.977
0.711
0.923
0.366
0.775
0.855
0.877
0.677
ARM
0.942
0.758
0.915
0.419
0.692
0.921
0.838
0.722
SIRM
0.979
0.986
0.949
0.957
0.829
0.619
0.856
0.629

[87]
Table 5.20: Correlation between magnetic measurements of Bougainvillea spectabilis with SPM and
RSPM at four different study sites.
Magnetic
Parameter
SPM ( R2 )
RSPM ( R2 )
2013-14
2014-15
2013-14
2014-15
Winter
Summer
Winter
Summer
Winter
Summer
Winter
Summer
χ
0.941
0.772
0.919
0.892
0.886
0.736
0.915
0.737
ARM
0.975
0.803
0.933
0.779
0.834
0.706
0.811
0.595
SIRM
0.892
0.332
0.671
0.549
0.925
0.890
0.923
0.977
Ramrikawn site showed slightly higher magnetic values comparing to the other sites.
On the other hand, Ramrikawn and Zarkawt experienced relatively higher deposition of
magnetic grains, originating from PM. χ, ARM and SIRM values are found to be higher for
Ficus bengalensis, Mangifera indica, Artocarpus heterophyllus, Psidium guajava and
Lantana camara when compared to other plants. The spatial trends of these three magnetic
parameters display similar trends having Ramrikawn with maximum value and Tanhril area
with minimum value. The correlation coefficients indicated significant relationship between
the concentration of PM and magnetic measurement for ten plant leaves (Tables 5.11 to 5.20.
). Hansard et al. (2011) studied atmospheric particle pollution emitted by a combustion plant
using the tree leaves. Results show that a significant correlation is obtained between the
SIRM and PM10. Hu et al. (2008) also observed a good correlation of magnetic parameters
(magnetic susceptibility, ARM and SIRM) with air pollutants particularly heavy metals.
Further, Kardel et al. (2011) recorded significant correlation between leaf SIRM and ambient
[88]
PM concentrations. The other studies also demonstrated a significant correlation between
magnetic parameter and PM as studied elsewhere (Pandey et al., 2005; Prajapati et al., 2006).
Muxworthy et al. (2003) advocated that the value of SIRM is strongly correlated with the PM
mass. This is not only act as a proxy for PM monitoring but also is a viable alternative to
magnetic susceptibility since the samples are magnetically too weak.
The average magnetic concentration data (Table 5.3 to 5.10) demonstrated that the
accumulation of PM on tree leaves varies at different study sites. The results suggested that
Ramrikawn and Zarkawt experience the heaviest load of particulates in comparison to the
low-deposition sites of Durtlang and Tanhril area. Ramrikawn recorded the highest values of
magnetic parameters which may be attributed to heavy vehicular load (due to presence of
FCI, India), street dust and dust from fragile rocks. Zarkawt and Durtlang may have
vehicular pollution as only source of PM while Tanhril, being a village area is relatively free
from vehicular pollution and other anthropogenic activities.
The processes which are responsible for large particulate deposition on leaves are
sedimentation under gravity, diffusion and turbulent transfer giving rise to impaction and
interception (Speak et al., 2012). Zhang et al. (2001) and Mitchell et al. (2010) emphasized
complex dependence of deposition velocities (vd) on different variables such as particle size
and density, terrain vegetation and chemical species. Further, landscape geography and
architecture may also affect particulate concentration and its deposition on vegetation. Also,
the dust collection capacity of plants depends on shape and surface geometry of plant leaves,
leaf size and characteristics such as roughness, porosity, plant height, canopy and aspect and
distance from emission road and buildings (Sternberg et al., 2010; Rai, 2013). Ficus
bengalensis, Mangifera indica, Artocarpus heterophyllus, Psidium guajava and Lantana

[89]
camara leaves were more rough when compared to Bauhinia variegata, Cassia auriculata ,
Hibiscus rosa-sinensis, Ficus religiosa and Bougainvillea spectabilis which may be
attributed to its high magnetic concentrations.
Sitewise, plants from Ramrikawn, Zarkawt and Durtlang showed high pollutant
magnetic concentration due to tall buildings which may tend to concentrate the pollutants
through the low dispersal of pollutants. Also, the presence of trees in street canyons may
prevent the dispersal of pollutants (Sternberg et al., 2010; Speak et al., 2012; Hofman et al.,
2013). At Tanhril site dispersal of particulates may take place due to lack of high buildings
and multilane condition. Further, at Ramrikawn site there exist narrow as well as poor roads
with heavy traffic, street dust load and tall buildings.

[90]
CHAPTER - 6
SUMMARY AND CONCLUSIONS
______________________________________________________________________________
Biomonitoring of atmospheric particulate matter using magnetic properties of tree leaves is a
useful approach to delineate primary anthropogenic airborne particulate pollution, which
leads to the deterioration of ambient air quality and causes adverse effects to human health.
From the present study, we can conclude that; The total amount of Suspended Particulate
Matter (SPM) and Respirable Suspended Particulate Matter (RSPM) were found much higher
at different sites than the prescribed limits of Central Pollution Control Board (CPCB) of
India during summer and winter season. The ambient PM concentrations were recorded
highest at Ramrikawn, followed by Zarkawt and Durtlang, while lowest values were recorded
at Tanhril site. Magnetic properties of tree leaves change significantly in different sampling
sites. Magnetic concentration data suggest that the deposition of PM on tree leaves varies due
to different traffic behavior between sites and due to other activities like soil erosion, mining
and stone quarrying etc. Among ten plant species Ficus bengalensis, Mangifera indica,
Artocarpus heterophyllus, Psidium guajava and Lantana camara were found as good PM
accumulator. Trees with high PM collecting potential can solve the problems of air
particulate pollution to a great extent. The magnetic properties of tree leaves in Aizawl city
also revealed that the magnetic fraction of dust is dominated by multidomain magnetite-like
ferromagnetic particles. The magnetic parameters of these plants showed significant positive
correlation with ambient PM thus, may act as proxy of ambient PM. Biomagnetic
monitoring of PM through plant leaves provides a rapid and economic technique for

[91]
monitoring atmospheric PM pollution, thus paves the way to the innovation of an eco-
sustainable environmental monitoring and hence possible management.
The major findings of the present study can be summarized as follows:
1. The total amount of Suspended Particulate Matter (SPM) and Respirable Suspended
Particulate Matter (RSPM) were found much higher at different sites than the
prescribed limits of CPCB of India during summer and winter season.
2. The values of particulate pollutants were lowest in rainy season. Which may be
attributed to large precipitations while summer and winter seasons were
characterized by nearly same concentrations at all study sites.
3. The ambient PM concentrations were recorded highest at Ramrikawn, followed by
Zarkawt and Durtlang, while lowest values were recorded for Tanhril site.
4. Magnetic properties of tree leaves changed significantly at different study sites.
5. Magnetic data suggest that the deposition of PM on tree leaves varies due to different
traffic behavior between different sites.
6. The ARM/ χ and SIRM/ χ values were found to be low at all studied sites.
7. Low values of ARM/ χ and SIRM/ χ indicate relatively large grain size of magnetic
particles present in leaf samples.
8. S-ratio of leaf samples were ranging from 0.801 to 0.982, which indicates that these
leaf samples are dominated by multidomain magnetite-like ferromagnetic particles.

[92]
9. PM deposition capacity was found to be higher for Ficus bengalensis, Mangifera
indica, Artocarpus heterophyllus, Psidium guajava and Lantana camara comparing to
other plants.
10. The magnetic parameters of these plants showed significant positive correlation with
ambient PM thus, may act as proxy of ambient PM pollution.
The present study is a strong first step and warrants further efforts which may paves the
way to screen the feasibility of this plants in context of their potentially to be planted in other
urban areas with varying pollution load. The plant species constituting Green Belt of
effective dust capturing plant species should be developed around residential areas/industrial
areas, as the tree can act as efficient biological filters, removing significant amounts of
particulate pollution from urban atmospheres. This is a cost effective technology for
controlling particulate and gaseous emission generated due to vehicular movement, domestic
emission and even industrial emission. Present study is, perhaps, a novel contribution in the
area of bio-magnetic monitoring studied with several magnetic parameters. Results indicated
that the bio-magnetic monitoring is applied for environmental geomagnetism which act as
proxy for ambient PM pollution and further employed as an eco-sustainable tool for
environmental management in urban and peri-urban regions.
[93]
REFERENCES
___________________________________________________________________________
Abdul-Razzaq, W. and Gautam, M. (2001). Discovery of magnetite in the exhausted material
from a diesel engine. Applied Physics Letters, 78: 2018-2019.
Agarwal, R., Jayaraman, G., Anand, S. and Marimuthu, P. (2006). Assessing respiratory
morbidity through pollution status and meteorological conditions for Delhi.
Environmental Monitoring and Assessment, 114:489-504.
Akbari, H. (2002). Shade trees reduce building energy use and CO2 emissions from power
plants. Environmental Pollution, 116: S119-S126.
Akbari, H., Pomerantz, M. and Taha, H. (2001). Cool surfaces and shade trees to reduce
energy use and improve air quality in urban areas. Solar Energy, 70: 295-310.
Akhter, M.S. and Madany, I.M. (1993). Heavy metals in street and house dust in Bahrain,
Water, Air and Soil Pollution, 66: 111-119.
Alagarsamy, R. (2009). Environmental magnetism and application in the continental shelf
sediments of India. Marine Environmental Research, 68 (2): 49-58.
Al-Alawi, M., Batarseh, M.I., Carreras, H., Alawi, M., Jiries, A. and Charlesworth, S.M.
(2007). Aleppo pine bark as a biomonitor of atmospheric pollution in the arid
environment of Jordan. Clean, 35 (5): 438-443.
Al-Alawi, M.M. and Mandiwana, K.L. (2007). The use of Aleppo pine needles as biomonitor
of heavy metals in the atmosphere. Journal of Hazardous Materials,148: 43-46.

[94]
Alfani, A., Baldantoni, D., Maisto, G., Bartoli, G. and Virzo de Santo, A. (2000). Temporal
and spatial variation in C, N, S and trace element contents in the leaves of Quercus
ilex within the urban area of Naples. Environmental Pollution, 109: 119-129.
Alfani, A., Bartoli, G., Rutigliano, F.A., Maisto, G. and Virzo de Santo, A. (1996). Trace
metal biomonitoring in the soil and the leaves of Quercus ilex in the urban area of
Naples. Biological Trace Element Research, 51: 117-131.
Araujo, J.A., Barajas, B., Kleinman, M., Wang, X., Bennett, B.J., Gong, K.W., Navab, M.,
Harkema, J., Sioutas, C., Lusis, A.J. and Nel, A.E. (2008). Ambient particulate
pollutants in the ultrafine range promote early atherosclerosis and systemic
oxidative stress. Circulation Research, 102: 589-596.
Assadi, A., Pirbalouti, A.G., Teimori, N. and Assadi, L. (2011). Impact of air pollution on
physiological and morphological characteristics of Eucalyptus camaldulensis Den.
Journal of Food, Agriculture and Environment, 9(2): 676-679.
Balashanmugam, P., Ramanathan, A.R. and Kumar, V.K. (2012). Ambient Air Quality
Monitoring in Puducherry. International Journal of Engineering Research and
Applications, 2 (2).
Bargagli, R. (1998). Trace Elements in Terrestrial Plants: an Ecophysiological Approach to
Biomonitoring and Biorecovery. Springer, Berlin, 324 pp.
Barman, S.C., Singh, R., Negi, M.P.S. and Bhargava S.K. (2008). Ambient air quality of
Lucknow City (India) during use of fireworks on Diwali Festival. Environmental
Monitoring and Assessment, 137: 495-504.

[95]
Batarseh, M., Ziadat, A., Al-Alawi, M., Berdanier, B. and Jiries, A. (2008). The use of
cypress tree bark as an environmental indicator of heavy metals deposition in
Fuheis City, Jordan. International Journal of Environment and Pollution, 33 (2/3):
207-217.
Bealey, W.J., Mcdonald, A.G., Nemitz, E., Donovan, R., Dragosits, U., Duffy, T.R. and
Fowler, D. (2007). Estimating the reduction of urban PM10 concentrations by trees
within an environmental information system for planners. Journal of
Environmental Management, 85: 44-58.
Becker, S., Soukup, J.M. and Gallagher, J.E. (2002). Differential particulate air pollution
induced oxidant stress in human granulocytes, monocytes and alveolar
macrophages. Toxicology in Vitro, 16: 209-218.
Beckett, K.B., Freer-Smith, P.H. and Taylor, G. (1998). Urban woodlands: their role in
reducing the effects of particulate pollution. Environmental Pollution, 99: 347- 360.
Beckwith, P.R., Ellis, J.B. and Revitt, D.M. (1990). Applications of magnetic measurements
to sediment tracing in urban highway environments. Science of the Total
Environment, 93: 449-463.
Bhattacharya, T., Chakraborty, S., Kagathara, M. and Thakur, B. (2012). Ambient air
quality and the air pollution tolerance indices of some common plant species of
Anand city, Gujarat, India. Report and opinion, 4 (9): 7-15.
Bhuyan, P. K., Samantray, P. and Rout, S.P. (2010). Ambient Air Quality Status in
Choudwar Area of Cuttack District. International Journal Of Environmental
Sciences, 1(3).

[96]
Blaha, U., Sapkota, B., Appel, E., Stanjek, H. and Rösler, W. (2008). Micro-scale grain-size
analysis and magnetic properties of coal-fired power plant fly ash and its relevance
for environmental magnetic pollution studies. Atmospheric Environment, 42(36):
8359-8370.
Blundell, A., Hannam, J.A., Dearing, J.A. and Boyle, J.F. (2009). Detecting atmospheric
pollution in surface soils using magnetic measurements: a reappraisal using an
England and Wales database. Environmental Pollution, 157(10): 2878-2890.
Borja-Aburto, V.H., Castillejos, M., Gold, D.R., Bierzwinski, S. and Loomis, D. (1998).
Mortality and ambient fine particles in southwest Mexico city, 1993–1995. Environ.
Health Perspect, 106: 849-855.
Borm, P.J., Schins, R.P. and Albrecht, C. (2004). Inhaled particles and lung cancer, part B:
paradigms and risk assessment. International Journal of Cancer, 110: 3-14.
Boucher, O. and Lohmann, U. (1995). The sulfate-CCN-cloud albedo effect – a sensitivity
study with 2 general-circulation models. Tellus Series B-Chemical and Physical
Meteorology, 47 (3): 281-300.
Brilhante, O., Daly, L. and Trabuc, P. (1989). Application of magnetism to detect pollution
caused by heavy metals in the environment. Comptes rendus de l’Académie des
Sciences Paris, 309 (2): 2005-2012.
Brook, R. D., Franklin, B., Cascio, W., Hong,Y. L., Howard, G., Lipsett, M., Luepker, R.,
Mittleman, M., Samet, J., Smith, S.C. and Tager, I. (2004). Air pollution and
cardiovascular disease a statement for healthcare professionals from the expert

[97]
panel on population and prevention science of the American Heart Association.
Circulation, 109 (21): 2655-2671.
Bucko, M.S., Magiera, T., Johanson, Bo., Petrovsky, E. and Pesonen, L.J. (2011).
Identification of magnetic particulates in road dust accumulated on roadside snow
using magnetic, geochemical and micro-morphological analyses. Environmental
Pollution, 159: 1266-1276.
Bucko, M.S., Magiera, T., Pesonen, L.J. and Janus, B. (2010). Magnetic, geochemical, and
microstructural characteristics of road dust on roadsides with different traffic
volumesdcase study from Finland. Water, Air, and Soil Pollution, 209: 295-306.
Bussotti, F., Cenni, E., Cozzi, A. and Ferretti, M. (1997). The impact of geothermal power
plants on forest vegetation. A case study at Travale (Tuscany, Central Italy).
Environmental Monitoring and Assessment, 45: 181-194.
Cacciola, R.R., Sarva, M. and Polosa, R. (2002). Adverse respiratory effects and allergic
susceptibility in relation to particulate air pollution: Flirting with disaster. Allergy,
57:281-286.
Calamari, D., Bacci, E., Focardi, S., Gaggi, C., Morosini, M. and Vighi, M. (1991). Role of
plant biomass in the global environmental partitioning of chlorinated hydrocarbons.
Environmental Science and Technology, 25: 1489-1495.
Calderon-Garcidue_n, L., Reed, W., Maronpot, R.R., Henriquez-Roldan, C., Delago-
Chavez, R., Calderon-Garciduenas, A., Dragustinovis, I., Franco-Lira, M., Aragon-
Flores, M., Solt, A.C., Altenburg, M., Torres-Jardon, R. and Swenburg, J.A. (2004).

[98]
Brain inflammation and Alzheimer‘s-like pathology in individuals exposed to
severe air pollution. Toxicologic Pathology, 32: 650-658.
Ceburnis, D. and Steinnes, E. (2000). Conifer needles as biomonitors of atmospheric heavy
metal deposition: comparison with mosses and precipitation, role of the canopy.
Atmospheric Environment, 34: 4265-4271.
Çelik, A., Kartal, A.A., Akdogan, A. and Kaska, Y. (2005). Determining the heavy metal
pollution in Denizli (Turkey) by using Robinio pseudoacacia L. Environmental
International, 31: 105-112.
Champion, H. and Seth, S.K. (1968). A revised survey of forest types of India. Government
of India Press, Delhi.
Chaparro, M.A.E., Gogorza, C.S.G., Chaparro, M.A.E., Irurzun, M.A. and Sinito, A.M.
(2006). Review of magnetism and heavy metal pollution studies of various
environments in Argentina. Earth, Planets and Space, 58: 1411-1422.
Charlesworth, S.M. and Lees, J.A. (1997). The use of mineral magnetic measurements in
polluted urban lakes and deposited dusts, Coventry, UK. Physics and Chemistry of
the Earth, 22: 203-206.
Charlson, R.J., Schwartz, S.E., Hales, J.M., Cess, R.D., Coakley, J.A., Hansen, J.E. and
Hofmann, D.J. (1992). Climate forcing by anthropogenic aerosols. Science, 255
(5043): 423-430.
Chen, B., Hong, C. and Kan, H. (2004). Exposures and health outcomes from outdoor air
pollutants in China. Toxicology, 198: 291-300.

[99]
Ciencewicki, J. and Jaspers, I. (2007). Air Pollution and Respiratory Viral Infection.
Inhalation Toxicology, 19 (14):1135-1146.
Coffin, A.W. (2007). From roadkill to road ecology: a review of the ecological effects of
roads. Journal of Transport Geography, 15: 396-406.
Cohen, A.J., Anderson, H.R., Ostro, B., Pandey, K.D., Krzyzanowski, M., Kunzli, N.,
Gutschmidt, K., Pope, A., Romieu, I., Samet, J.M. and Smith, K. (2005). The global
burden of disease due to outdoor air pollution. Journal of Toxicology and
Environmental Health, Part A, Current Issues, 68(13-14): 1301-1307.
Craig, L., Brook, J.R., Chiotti, Q., Croes, B., Gower, S., Hedley, A., Krewski, D., Krupnick,
A., Krzyzanowski, M., Moran, M.D., Pennell, W., Samet, J.M., Schneider, J.,
Shortreed, J. and Williams, M. (2008). Air pollution and public health: a guidance
document for risk managers. Journal of Toxicology and Environmental Health, Part
A 71 (9-10): 588-698.
Curtis, L., Rea, W., Smith-Willis, P., Fenyves, E. and Pan, Y. (2006). Adverse health effects
of outdoor pollutants. Environment International, 32: 815-830.
Dagher, Z., Garcon, G., Billet, S., Gosset, P., Ledoux, F., Courcot, D., Aboukais A. and
Shirali, P. (2006). Activation of different pathways of apoptosis by air pollution
particulate matter (PM2.5) in human epithelial lung cells (L132) in culture.
Toxicology, 225: 12-24.

[100]
Davidson, D.A., Wilkinson, A.C. and Blais, J.M. (2003). Orographic cold-trapping of
persistent organic pollutants by vegetation in mountains of Western Canada.
Environmental Science and Technology, 37: 209-215.
Dearing, J. (1999). Magnetic susceptibility. In Walden, J., Oldfield, F. & Smith, J. P. (Eds.),
Environmental magnetism: a practical guide. Technical guide no. 6 (pp: 35-62).
Cambridge, England: Quaternary Research Association.
Delfino, R.J., Staimer, N., Tjoa, T., Polidori, A., Arhami, M., Gillen, D.L., Kleinman, M.T.,
Vaziri, N.D., Longhurst, J., Zaldivar, F. and Sioutas, C. (2008). Circulating
biomarkers of inflammation, antioxidant activity, and platelet activation are
associated with primary combustion aerosolsin subjects with coronary artery
disease. Environmental Health Perspectives, 116(7): 898-906.
Dikshit, K.R. (1984). A prologue to the symposium on geography and teaching of
environment, Dept of Geography, Poona University.
Dohare, D. and Panday, V. (2014). Monitoring of ambient air quality in India - A review.
International Journal of Engineering Sciences & Research Technology, 3(12): 237-
244.
El-Fadel, M. and Massoud, M. (2000). Particulate matter in urban areas: health-based
economic assessment. The Science of the Total Environment, 257: 133-146.
Environmental Protection Agency. (U.S.) (1996). Air Quality Criteria for Particulate Matter.
Research Triangle Park, N.C. Office of Research and Development, Office of
Health and Environmental Assessment. EPA report no. EPA/600/P-95/001aF.

[101]
Environmental Protection Agency. (U.S.) (1997). Regulatory Impact Analysis for the
Particulate Matter and OzoneNational Ambient Air Quality Standards and
Proposed Regional Haze Rule. Research Triangle Park, N.C.: Innovative Strategies
and Economics Group, Office of Air Quality Planning and Standards.
Eriksson, G., Jensen, S., Kylin, H. and Strachan,W. (1989). The pine needle as a monitor of
atmospheric pollution. Nature, 341: 42-44.
Evans, M.E. and Heller, F. (2003). Environmental magnetism: principles and applications of
enviromagnetics (International Geophysics). London: Academic Press. Elsevier,
299 pp.
Faiz, Y., Tufail, M., Javed M.T., Chaudhry, M.M. and Siddique, N. (2009). Road dust
pollution of Cd, Cu, Ni, Pb and Zn along Islamabad Expressway, Pakistan. Micro
chemical Journal, 92: 186-192.
Fassbinder, J.W.E., Stanjek, H. and Vali, H. (1990). Occurrence of magnetic bacteria in soil.
Nature, 343: 161-163.
Fathi, Z. and Clare, W. (2011). Urban Airborne Particulate Matter- Origin, Chemistry, Fate
and Health Impacts. Springer Verlag XXIII, 656 p.
Ferreira-Baptista, L. and DeMiguel, E. (2005). Geochemistry and risk assessment of street
dust in Luanda, Angola: a tropical urban environment. Atmospheric Environment,
39: 4501-4512.
Flanders, P.J. (1994). Collection, measurement, and analysis of airborne magnetic
particulates from pollution in the environment. Journal of Applied Physics, 75:
5931-5936.
[102]
Frampton, M.W. (2001). Systematic and cardiovascular effects of airway injury and
inflammation: Ultrafine particle exposure in humans. Environmental Health
Perspectives, 109: 529-532.
Franzaring, J. (1997). Temperature and concentration effects in biomonitoring of organic air
pollutants. Environmental Monitoring and Assessment, 46: 209-220.
Freer-Smith, P. H., El-Khatib, A. A. and Taylor, G. (2004). Capture of particulate pollution
by trees: A comparison of species typical of semi-arid areas (Ficus nitida and
Eucalyptus globulus) with European and North-American species. Water, Air, and
Soil Pollution, 155: 173-187.
Freer-Smith, P.H., Holloway, S. and Goodman, A. (1997). The uptake of particulates by an
urban woodland, site description and particulate composition. Environmental
Pollution, 95 (1): 27-35.
Gang, Y., Shouyun, H., Liwan, C., Wolfgang, R. and Erwin, A. (2013). Magnetic properties
of tree leaves and their significance in atmospheric particle pollution in Linfen City,
China. Chin. Geogr. Sci., 23(1): 59-72.
Gautam, P., Blaha, U. and Appel, E. (2005). Magnetic susceptibility of dust-loaded leaves as
a proxy of traffic-related heavy metal pollution in Kathmandu city, Nepal.
Atmospheric Environment, 39: 2201-2211.
Georgeaud, V.M., Rochette, P., Ambrosi, J.P., Vandamme, D. and Williamson, D. (1997).
Relationship between heavy metals and magnetic properties in a large polluted

[103]
catchments, the Etang de Berre (South France). Physics and Chemistry of the Earth,
22 (1-2): 211-214.
Ghio, A.J. and Huang, Y.T. (2004). Exposure to concentrated ambient particles (CAPs): a
review. Inhalation Toxicology, 16: 53-59.
Gidde, M.R. (2007). Ambient Air Quality In Metropolitan Pune. Paper of Bharti
Vidhyapeeth University Research Journal, 5(2).
Giertych, M.J., De Temmerman, L.O. and Rachwal, L. (1997). Distribution of elements
along the length of Scots pine needles in a heavily polluted and control
environment. Tree Physiology, 17: 697-703.
Gong, K.W., Zhao, W., Li, N., Barajas, B., Kleinman, M., Sioutas, C., Horvath, S., Lusis,
A.J., Nel, A. and Araujo, J.A. (2007). Air-pollutant chemicals and oxidized lipids
exhibit genome-wide synergistic effects on endothelial cells. Genome Biology, 8:
R149.
Gratani, L. and Varone, L. (2006). Carbon sequestration by Quercus ilex L. and Quercus
pubescens Willd. and their contribution to decreasing air temperature in Rome.
Urban Ecosystems, 9: 27-37.
Gratani, L. and Varone, L. (2007). Plant crown traits and carbon sequestration capability by
Platanus hybrida Brot. in Rome. Landscape and Urban Planning, 81: 282-286.
Gupta, U. (2007). Valuation of Urban Air Pollution: A Case Study of Kanpur City in India.
Environmental and Resource Economics.

[104]
Haddad, J.J. (2004). Redox and oxidant-mediated regulation of apoptosis signaling pathways:
immunopharmaco- redox conception of oxidative siege versus cell death
commitment. International Immunopharmacology, 4: 475-493.
Halsall, C.J., Maher, B.A., Karloukovski, V.V., Shah, P. and Watkins, S.J. (2008). A novel
approach to investigating indoor/outdoor pollution links: combined magnetic and
PAH measurements. Atmospheric Environment, 42: 8902-8909.
Hansard, R., Maher, B.A. and Kinnersley, R. (2011). Biomagnetic monitoring of industry
derived particulate pollution. Environmental Pollution, 159: 1673-1681.
Hansen, J. and Nazarenko, L. (2004). Soot climate forcing via snow and ice albedos.
Proceedings of the National Academy of sciences of the United States of America.
101 (2):423-428.
Harikrishnan, S., Pradeep, S., Ramalingam, M., Prasanna. N. and Manivasagan, V. (2012).
Ambient Air Quality Monitoring and Possible Health Effects Due to Air Pollution
in Hosur Town, Tamilnadu, India. Universal Journal of Environmental Research
and Technology, 2(4): 254-260.
Harrison, R.M. and Yin, J. (2000). Particulate matter in the atmosphere: which particle
properties are important for its effects on health? The Science of the Total
Environment, 249: 85-101.
Hay, K.L., Dearing, J.A., Baban, S.M.J. and Loveland, P. (1997). A preliminary attempt to
identify atmospherically derived pollution particles in English topsoils from

[105]
magnetic susceptibility measurements. Physics and Chemistry of the Earth, 22:
207-210.
Haywood, J. and Boucher, O. (2000). Estimates of the direct and indirect radiative forcing
due to tropospheric aerosols: A review. Reviews of Geophysics, 38 (4): 513-543.
Haywood, J. M. and Shine, K. P. (1995). The effect of anthropogenic sulfate and soot on the
clear sky planetaryradiation budget, Geophys. Res. Lett., 22: 603-606.
Helmisaari, H.S., Derome, J., Fritze, H., Nieminen, T., Palmgren, K., Salemaa, M. and
Vanha-Majamaa, I. (1995). Copper in Scots pine forest around a heavy metal
smelter in south-western Finland. Water, Air, & Soil Pollution, 85: 1727-1732.
Hicken, M.T., Dvonch, J.T., Schulz, A.J., Mentz, G. and Max, P. (2014). Fine particulate
matter air pollution and blood pressure: The modifying role of psychosocial stress.
Environmental Research, 133: 195-203.
Hoffmann, V., Knab, M. and Appel, E. (1999). Magnetic susceptibility mapping of roadside
pollution. Journal of Geochemical Exploration, 66: 313-326.
Hofman, J., Stokkaer, I., Snauwaert, L. and Samson, R. (2013). Spatial distribution
assessment of particulate matter in an urban street canyon using biomagnetic leaf
monitoring of tree crown deposited particles. Environ. Pollut., 183: 123-132.
Holdgate, M.W. (1979). A perspective of Environmental pollution. Cambridge Univ. Press,
Cambridge.
Hu, S.Y., Duan, X.M., Shen, M.J., Blaha, U., Roesler, W., Yan, H.T., Appel, E. and
Hoffmann, V. (2008). Magnetic response to atmospheric heavy metal pollution
recorded by dust-loaded leaves in Shougang industrial area, western Beijing. Chin.
Sci. Bull., 53(10): 1555-1564.

[106]
Hu, X.F., Su, Y., Ye, R., Li, X.Q. and Zhang, G.L. (2007). Magnetic properties of the urban
soils in Shanghai and their environmental implications. Catena, 70 (3): 428-436.
Hunt, A., Jones, J. and Oldfield, F. (1984). Magnetic measurements and heavy metals in
atmospheric particulates of anthropogenic origin. Science of the Total Environment,
33: 129-139.
Jacobson, M.Z. (2004). Climate response of fossil fuel and biofuel soot, accounting for
soot's feedback to snow and sea ice albedo and emissivity. Journal of Geophysical
Research-Atmospheres, 109 (D21201): 1-15.
Jahn, H.J., Schneider, A., Breitner, S., Eibner, R., Wendisch, M. and Kramer, A. (2011).
Particulate matter pollution in the megacities of the Pearl River Delta, China – A
systematic literature review and health risk assessment. International Journal of
Hygiene and Environmental Health, 214(4): 281-295.
Jensen, S., Eriksson, G., Kylin, H. and Strachan, W. (1992). Atmospheric pollution by
persistent organic compounds: monitoring with pine needles. Chemosphere, 24:
229-245.
Jones, A., Roberts, D.L. and Slingo, A. (1994). A climate model study of indirect radiative
forcing by anthropogenic sulfate aerosols. Nature, 370 (6489): 450-453.
Jordanova, N.V., Jordanova, D.V., Veneva, L., Yorova, K. and Petrovsky, E. (2003).
Magnetic response of soils and vegetation to heavy metal pollution - a case study.
Environmental Science and Technology, 37: 4417-4424.

[107]
Kamath. and Lokeshappa. (2014). Air Quality Indexing for selected areas in Bangalore city,
Karnataka State, India. International Journal of Innovative Research in Science,
Engineering and Technology, 3(8): 15625- 15630.
Kapoor, C.S., Bamniya, B. R., Jain, S. and Kapoor, K. (2013). Status and Monitoring of
Ambient Air Quality of ‛Cityof Lakes‘ Udaipur, (Raj.) India. Research in Health
and Nutrition, 1(1).
Kardel, F., Wuyts, K., Maher, B.A., Hansard, R. and Samson, R. (2011). Leaf saturation
isothermal remanent magnetization (SIRM) as a proxy for particulate matter
monitoring: inter-species differences and in-season variation. Atmos. Environ., 45:
5164-5171.
Kasai, H. (1997). Analysis of a form of oxidative DNA damage, 8- hydroxy-20-
deoxyguanosine, as a marker of cellular oxidative stress during carcinogenesis.
Mutation Research, 387: 147-163.
Khan, A.M., Pandey, V., Yunus, M. and Ahmad, K.J. (1989) Plants as dust scavengers - A
case study. Indian For, 115 (9): 670-672.
Khandbahale, D.S. and Saler, R.S. (2013). Ambient Air Quality Monitoring in Nashik city
(Maharashtra, India). Bionano Frontier, 6 (2).
Kim, K., Kabir, E. and Kabir, S. (2015). A review on the human health impact of airborne
particulate matter. Environment International, 74: 136-143.
Kim, W., Doh, S.J. and Yu, Y. (2009). Anthropogenic contribution of magnetic particulates
in urban roadside dust. Atmospheric Environment, 43 (19): 3137-3144.

[108]
Kim, W., Doh, S.J., Park, Y.H. and Yun S, T. (2007). Two-year magnetic monitoring in
conjunction with geochemical and electron microscopic data of roadside dust in
Seoul, Korea. Atmospheric Environment, 41: 7627-7641.
King, J.W. and Channell, J.E.T. (1991). Sedimentary magnetism, environmental magnetism
and magnetostratigraphy. Reviews of Geophysics, 29: 358-370.
Kletetschka, G., Zila, V. and Wasilewski, P.J. (2003). Magnetic anomalies on the tree trunks.
Studia Geophysica et Geodaetica, 47: 371-379.
Knaapen, A.M., Borm, P.J., Albrecht, C. and Schins, R.P. (2004). Inhaled particles and lung
cancer. Part A: mechanisms. International Journal of Cancer, 109: 799-809.
Knox, E.G. (2006). Roads, railways and childhood cancers. Journal of Epidemiology and
Community Health, 60:136-141.
Knutsen, S., Shavlik, D., Chen, L.H. and Petersen, F. (2004). The association between
ambient particulate air pollution levels and risk of cardiopulmonary and all-cause
mortality during 22 years follow-up of a non-smoking cohort. Results from the
AHSMOG study. Epidemiology, 15: S45.
Kumar, A., Garg, A. and Pandel, U. (2011). A Study of Ambient Air Quality Status in Jaipur
City (Rajasthan, India), Using Air Quality Index. Nature and Science, 9(6).
Kylin, H., Söderkvist, K., Undemann, A. and Franich, R. (2002). Seasonal variation of the
terpene content, an overlooked factor in the determination of environmental
pollutants in pine needles. Bulletin of Environmental Contamination and
Toxicology, 68: 155-160.

[109]
Lalrinpuii, H. and Lalramnghinglova, H. (2008). Assessment of air pollution in Aizawl city.
Current Science, 94(7): 852-853.
Laltlanchhuang, S.K. (2006). Studies of the impact of disturbance on secondary productivity
of forest ecosystem with special reference to surface, sub-surface litter insect and
other non- insect groups. M.Sc. dissertation. Mizoram University.
Larsen, R.S., Bell, J.N.B., James, P.W., Chimonides, P.J., Rumsey, F.J., Tremper, A. and
Purvis, O.W. (2007). Lichen and bryophyte distribution on oak in London in
relation to air pollution and bark acidity. Environmental Pollution, 146: 332- 340.
Le Tertre, A., Medina, S., Samoli. E., Forsberg, B., Michelozzi. P., Boumghar, A., Vonk,
J.M., Bellini, A., Atkinson, R., Ayres, J.G., Sunyer, J., Schwartz, J. and
Katsouyanni, K. (2002). Short-term effects of particulate air pollution on
cardiovascular diseases in eight European cities. J Epidemiol Commun Health, 56:
773-779.
Lehndorff, E. and Schwark, L. (2004). Biomonitoring of air quality in the Cologne
conurbation using pine needles as a passive sampler: Part IIdPAH distribution.
Atmospheric Environment, 38 (23): 3793-3808.
Lehndorff, E. and Schwark, L. (2008). Accumulation histories of major and trace elements
on pine needles in the Cologne Conurbation as function of air quality. Atmospheric
Environment, 42 (5): 833-845.

[110]
Lehndorff, E. and Schwark, L. (2009). Biomonitoring airborne parent and alkylated three-
ring PAHs in the Greater Cologne Conurbation II: regional distribution patterns.
Environmental Pollution, 157 (5): 1706-1713.
Lehndorff, E., Urbat, M. and Schwark, L. (2006). Accumulation histories of magnetic
particles on pine needles as function of air quality. Atmospheric Environment, 40
(36): 7082-7096.
Li, N., Sioutas, C., Cho, A., Schmitz, D., Misra, C., Sempf, J., Wang, M., Oberley, T.,
Froines, J. and Nel, A. (2003). Ultrafine particulate pollutants induce oxidative
stress and mitochondrial damage. Environmental Health Perspectives, 111: 455-
460.
Lipmann, M. (2007). Health effects of airborne particulate matter. New England Journal of
Medicine, 357(23): 2395-2397.
Loppi, S., Nelli, L., Ancora, S. and Bargagli, R. (1997). Passive monitoring of trace elements
by means of tree leaves, epiphytic lichens and bark substrate. Environmental
Monitoring and Assessment, 45: 81-88.
Lu, S.G. and Bai, S.Q. (2006). Study on the correlation of magnetic properties and heavy
metals content in urban soils of Hangzhou City, China. Journal of Applied
Geophysics, 60(1): 1-12.
Lu, S.G., Bai, S.Q. and Fu, L.X. (2008a). Magnetic properties as indicators of Cu and Zn
contamination in soils. Pedosphere, 18(4): 479-485.

[111]
Lu, S.G., Zheng, Y.W. and Bai, S.Q. (2008b). A HRTEM/EDX approach to identification of
the source of dust particles on urban tree leaves. Atmospheric Environment, 42(26):
6431-6441.
Maher, B.A. (1998a). Magnetic biomineralisation in termites. Proceedings of the Royal
Society of London, 265: 233-237.
Maher, B.A. (1998b). Magnetic properties of modern soils and Quaternary loessic paleosols:
paleoclimatic implications. Palaeogeography, Palaeoclimatology, Palaeoecology,
137: 25-54.
Maher, B.A. (2009). Rain and dust: magnetic records of climate and pollution. Elements, 5:
229-234.
Maher, B.A. (2011). The magnetic properties of Quaternary aeolian dusts and sediments, and
their palaeo climatic significance. Aeolian Research.
Maher, B.A. and Dennis, P.F. (2001). Evidence against dust-mediated control of glacial-
interglacial changes in atmospheric CO2. Nature, 41(6834): 176-180.
Maher, B.A. and Thompson, R. (1999). Quaternary, Climates, Environments and Magnetism.
Cambride University Press, 390 pp.
Maher, B.A., Mooreb, C. and Matzka, J. (2008). Spatial variation in vehicle-derived metal
pollution identified by magnetic and elemental analysis of roadside tree leaves.
Atmospheric Environment, 42: 364-373.
Mandal, S. (2000). Progressive Decrease of Air Pollution Level from West to East Calcutta.
Indian Journal of Environmental Protection, 20(1): 6-10.

[112]
Maricq, M. (1999). Examination of the size-resolved and transient nature of motor vehicle
particle emissions. Environmental Science and Technology, 33:1618-1626.
Markert, B. (1993). Plants as Biomonitors. Indicators for Heavy Metals in the Terrestrial
Environment. VCH Verlagsgesellschaft, Weinheim, 645 pp.
Martin, M.H. and Coughtrey, P.J. (1982). Biological monitoring of heavy metal pollution:
land and air. Applied Science Publishers, New York.
Matzka, J. (1997). Magnetische, elektronenmikroskopische und lichtmikroskopische
Untersuchungen an StaKuben und Aschen sowie an einzelen Aschepartikeln.
Diploma thesis. Inst. Allg. Angew. Geophysik, University of MuK nchen,
MuKnchen, Germany.
Matzka, J. and Maher, B.A. (1999). Magnetic biomonitoring of roadside tree leaves:
identification of spatial and temporal variations in vehicle-derived particulates.
Atmospheric Environment, 33: 4565-4569.
McIntosh, G., Gómez-Paccard, M. and Luisa Osete, M. (2007). The magnetic properties
ofparticles deposited on Platanus x hispanica leaves in Madrid, Spain, and their
temporal and spatial variations. Science of the Total Environment, 382: 135-146.
McPherson, E.G., Nowak, D., Heisler, G., Grimmond, S., Souch, C., Grant, R. and Rowntree,
R. (1997). Quantifying urban forest structure, function, and value: the Chicago
Urban Forest Climate Project. Urban Ecosystems, 1: 49-61.

[113]
McPherson, E.G., Scott, K.I. and Simpson, J.R. (1998). Estimating cost effectiveness of
residential yard trees for improving air quality in Sacramento, California, using
existing models. Atmospheric Environment, 32: 75-84.
McPherson, E.G., Simpson, J.R., Peper, P.J. and Xiao, Q. (1999). Benefit-cost analysis of
Modesto‘s municipal urban forest. Journal of Arboriculture, 25: 235-248.
Meena J.P., Pathak, A.K., Soni, A.K., Soni, D.K. and Kumar, A. (2012). Study of Ambient
Air Quality Monitoring on Himalayan Regions Garhwal and Kumaon, Uttarakhand,
India. International Journal of Applied Engineering and Technology, 2 (3).
Mièieta, K. and Murín, G. (1998). Three species of genus Pinus suitable as bioindicators of
polluted environment. Water, Air, and Soil Pollution, 104: 413-422.
Mitchell, R. and Maher, B.A. (2009). Evaluation and application of biomagnetic monitoring
of traffic-derived particulate pollution. Atmospheric Environment, 43: 2095-2103.
Mitchell, R., Maher, B. and Kinnersley, R. (2010). Rates of particulate pollution deposition
onto leaf surfaces: temporal and inter-species magnetic analyses. Environmental
Pollution, 158(5): 1472-1478.
Moller, P., Folkmann, J.K., Forchhammer, L., Brauner, E.V., Danielsen, P.H., Risom, L. and
Loft, S. (2008). Air pollution, oxidative damage to DNA, and carcinogenesis.
Cancer Letters, 266: 84-97.
Monaci, F., Moni, F., Lanciotti, E., Grechi, D. and Bargagli, R. (2000). Biomonitoring of
airborne metals in urban environments: new tracers of vehicle emission, in place of
lead. Environmental Pollution, 107: 321-327.

[114]
Moreno, E., Sagnotti, L., Dinare_s-Turell, J., Winkler, A. and Cascella, A. (2003).
Biomonitoring of traffic air pollution in Rome using magnetic properties of tree
leaves. Atmospheric Environment, 37: 2967-2977.
Morris, W.A., Versteeg, J.K., Bryant, D.W., Legzdins, A.E., Mccarry, B.E. and Marvin,
C.H. (1995). Preliminary comparisons between mutagenicity and magnetic
susceptibility of respirable airborne particulate. Atmospheric Environment, 29:
3441- 3450.
Morris, W.A., Versteeg, J.K., Bryant, D.W., Legzdins, A.E., Mccarry, B.E. and Marvin, C.H.
(1995). Preliminary comparisons between mutagenicity and magnetic susceptibility
of respirable airborne particulate. Atmospheric Environment, 29: 3441-3450.
Morton-Bermea, O., Hernandez, E., Martinez-Pichardo, E., Soler-Arechalde, A.M., Lozano
Santa-Cruz, R., Gonzalez-Hernandez, G., Beramendi-Orosco, L. and Urrutia-
Fucugauchi, J. (2009). Mexico City topsoils: heavy metals vs. magnetic
susceptibility. Geoderma, 151 (3-4): 121-125.
Muxworthy, A. R., Matzka, J., Davila, A. F. and Petersen, N. (2003). Magnetic signature of
daily sampled urban atmospheric particles. Atmospheric Environment, 37: 4163-
4169.
Muxworthy, A.R., Matzka, J. and Peterson, N. (2001). Comparison of magnetic parameters
of urban particulate matter with pollution and meteorological data. Atmospheric
Environment, 35: 4379-4386.
[115]
Muzyka, V., Veimer, S. and Schmidt, N. (1998). On the carcinogenic risk evaluation of
diesel exhaust: Benzene in airborne particles and alterations of heme metabolism in
lymphocytes as markers of exposure. The Science of the Total Environment, 217:
103-111.
Nali, C., Balducci, E., Frati, L., Paoli, L., Loppi, S. and Lorenzini, G. (2007). Integrated
biomonitoring of air quality with plants and lichens: a case study on ambient ozone
from central Italy. Chemosphere, 67: 2169-2176.
Nemmar, A., Vanbilloen, H., Hoylaerts, M.F., Hoet, P.H., Verbruggen, A. and Nemery, B.
(2001). Passage of intratracheally instilled ultrafine particles from the lung into the
systemic circulation in hamster. Am J Respir Crit Care Med, 164 (9):1665-1668.
NEPC. (1998). Ambient Air Quality: National Environment Protection Measure for
Ambient Air Quality. National Environment Protection Council Service
Corporation, Adelaide.
Nielsen, P.S., Andreassen, A., Farmer, P.B., Ovrebo, S. and Autrup, H. (1996a).
Biomonitoring of diesel exhaust-exposed workers. DNA and haemoglobin adducts
and urinary OHP as markers of exposure. Toxicology Letters, 86: 27-37.
Nielsen, P.S., de Pater, N., Okkels, H. and Autrup, H. (1996b). Environmental air pollution
and DNA adducts in Copenhagen bus drivers—effect of GSTM1 and NAT2
genotypes on adduct levels. Carcinogenesis, 17: 1021-1027.

[116]
Nieminen, T. and Helmisaari, H.S. (1996). Nutrient translocation in the foliage of Pinus
sylvestris L. growing along a heavymetal pollution gradient. Tree Physiol, 16: 825-
831.
Nowak, D.J. (1994). Air pollution removal by Chicago’s urban forest. In: McPherson, E.G.,
Nowak, D.J., Rowntree, R.A. (Eds.), Chicago’s Urban Forest Ecosystem: Results of
the Chicago Urban Forest Climate Project. USDA, Forest Service, Gen. Tech. Rep.
NE-186, pp: 63-81.
Nowak, D.J. and Dwyer, J.F. (2000). Understanding the benefits and costs of urban forest
ecosystems. In: Kuser, J.E. (Ed.), Handbook of Urban and Community Forestry in
the Northeast. Kluwer Academic/Plenum Publishers, New York, pp. 11-25.
Nowak, D.J. and Rowntree, R.A. (1994). Chicago‘s urban Forest Ecosystem: Results of the
Chicago Urban Forest Climate Project. USDA, Forest Service, Gen. Tech. Rep. NE-
186. pp. 63-81.
Nowak, D.J., Civerolo, J.C., Rao, S.T., Sistla, G., Luley, C.J. and Crane, D.E. (2000). A
modeling study of the impact of urban trees on ozone. Atmospheric Environment,
34: 1601-1613.
Nowak, D.J., Crane, D.E. and Stevens, J.C. (2006). Air pollution removal by urban trees and
shrubs in the United States. Urban Forestry and Urban Greening, 4: 115-123.
Nowak, D.J., Crane, D.E., Stevens, J.C. and Ibarra, M. (2002). Brooklyn‘s Urban Forest.
USDA, Forest Service, Gen. Tech. Rep. NE-290, 109 pp.

[117]
Nowak, D.J., McHale, P.J., Ibarra, M., Crane, D., Stecens, J. and Luley, C. (1998). Modeling
the effects of urban vegetation on air pollution. In: Gryning, S., Chaumerliac, N.
(Eds.), Air Pollution Modeling and Its Application XII. Plenum, New York,pp. 399-
407.
Oberdörster, G. (2000). Toxicology of ultrafine particles: in vivo studies. Philosophical
Transactions of the Royal Society of London, 358: 2719-2740.
Oberdorster, G., Oberorster, E. and Oberdorster, J. (2005). Nanotoxicology: an emerging
discipline evolving from studies of ultrafine particles. Environmental Health
Perspectives, 113: 823-839.
Ockenden,W.A., Steinnes, E., Parker, C. and Jones, K.C. (1998). Observations on persistent
organic pollutants in plants: implications for their use as passive air samplers and
for POP cycling. Environmental Science and Technology, 32: 2721-2726.
Okona-Mensah, K.B., Battershill, J., Boobis, A. and Fielder, R. (2005). An approach to
investigating the importance of high potency polycyclic aromatic hydrocarbons
(PAHs) in the induction of lung cancer by air pollution. Food and Chemical
Toxicology, 43(7): 1103-1116.
Pandey, J. and Agrawal, M. (1993). Protection of plants against air pollutants: role of
chemical protectants. Journal of Environmental Management, 37: 163-174.
Pandey, S.K., Tripathi, B.D., Prajapati, S.K., Mishra, V.K., Upadhyay, A.R., Rai, P.K. and
Sharma, A.P. (2005). Magnetic properties of vehicle derived particulates and
amelioration by Ficus infectoria: a keystone species. Ambio: a Journal on Human
Environment, 34(8): 645-647.

[118]
Park, C.C. (1980). Ecology and Environmental management, Butterworths, London. pp 28.
Pascal, M.,Falq, G., Wagner, V., Chatignoux, E., Corso, M., Blanchard, M., Host, S., Pascal,
L. and Larrieu, S. (2014). Short-term impacts of particulate matter (PM10, PM10–2.5,
PM2.5) on mortality in nine French cities. Atmospheric Environment, 95: 175-184.
Pedersen, M., Vinzents, P., Petersen, J.H., Kleinjans, J.C., Plas, G., Kirsch-Volders, M.,
Dostal, M., Rossner, P., Beskid, O., Sram, R.J. and Merlo, D.F. (2006). Cytogenetic
effects in children and mothers exposed to air pollution assessed by the frequency
of micronuclei and fluorescence in situ hybridization (FISH): A family pilot study
in the Czech Republic. Mutation Research, 608: 112-120.
Penttinen, P., Timonen, K. L., Tiittanen, P., Mirme, A., Ruuskanen, J. and Pekkanen, J.
(2001).Ultrafine particles in urban air and respiratory health among adult
asthmatics. Eur. Respir. J., 17: 428-435.
Pereira, C.E., Heck, T.G., Saldiva, P.H. and Rhoden, C.R. (2007). Ambient particulate air
pollution from vehicles promotes lipid peroxidation and inflammatory responses in
rat lung. Brazilian Journal Medical Biological Research, 40: 1353-1359.
Petrovsky, E. and Ellwood, B.B. (1999). Magnetic monitoring of pollution of air, land and
waters. In: Maher, B.A., Thompson, R. (Eds.), Quaternary Climates, Environments
and Magnetism. Cambridge University Press, Cambridge, pp. 279-322.
Polichetti, G., Cocco, S., Spinali, A., Trimarco, V. and Nunziata, A. (2009). Effects of
particulate matter (PM10, PM2.5 and PM1) on the cardiovascular system. Toxicology,
261: 1-8.

[119]
Pope, C.A., Hansen, M.L., Long, R.W., Nielsen, K.R., Eatough, N.L., Wilson, W.E. and
Eatough, D.J. (2004). Ambient particulate air pollution, heart rate variability, and
blood markers of inflammation in a panel of elderly subjects. Environmental
Health Perspectives, 112: 339-345.
Pope, III. C.A, Burnett, R.T., Thun, M.J., Calle, E.E., Krewski, D., Ito, K. and Thurston,
G.D. (2002). Lung cancer, cardiopulmonary mortality and long-term exposure to
fine particulate air pollution. Journal of American Medical Association, 287: 1132-
1141.
Power, A, L., Worsley, A. T. and Booth, C. (2009). Magneto-biomonitoring of intra-urban
spatial variations of particulate matter using tree leaves. Environ Geochem Health,
31: 315-325.
Prajapati, S.K. and Tripathi, B.D. (2008a). Anticipated performance index of some tree
species considered for green belt development in and around an urban area: a case
study of Varanasi City, India. Journal of Environmental Management, 88(4):
1343-1349.
Prajapati, S.K. and Tripathi, B.D. (2008b). Biomonitoring seasonal variation of urban air
Polycyclic Aromatic Hydrocarbons (PAHs) using Ficus benghalensis leaves.
Environmental Pollution, 151: 543-548.
Prajapati, S.K., Pandey, S.K. and Tripathi, B.D. (2006). Magnetic biomonitoring of road-
side tree leaves as a proxy of vehicular pollution. Environ. Monit. Assess., 120: 169-
175.

[120]
Prakash, M. and Bassin, J.K. (2010). Analysis Of Ambient Air Quality Using Air Quality
Index – A Case Study. International Journal of Advanced Engineering Technology,
1(1):106-114.
Prakash, T.J. and Punyaseshudu, D. (2015). Analysis of air pollution in Tropical urban region
during summer and winter seasons. International Journal of innovations in
Engineering and Technology, 5(1): 86-94.
Purohit, S.S. and Ranjan, R. (2003). Ecology, Environment and Pollution. Agro bios (India),
pp 10.
Rai, P.K. (2009). Comparative Assessment of Soil Properties after Bamboo Flowering and
Death in a Tropical Forest of Indo-Burma Hot spot. Ambio: A Journal on Human
Environment, 38 (2): 118-120.
Rai, P.K. (2011a). Dust deposition capacity of certain roadside plants in Aizawl, Mizoram:
Implications for environmental geomagnetic studies. In: Recent Advances in Civil
Engineering, S.B. Dwivedi et al. (Eds), pp. 66-73.
Rai, P.K. (2011b). Biomonitoring of particulates through magnetic properties of road-side
plant leaves. In: Advances in Environmental Chemistry, D. Tiwari (Ed.), Excel
India Publishers, New Delhi, pp. 34-37.
Rai, P.K. (2012). An Eco-sustainable Green Approach for Heavy metals Management: Two
Case Studies of Developing Industrial Region. Environmental Monitoring and
Assessment, 184: 421-448.

[121]
Rai, P.K. (2013). Environmental magnetic studies of particulates with special reference to
bio magnetic monitoring using roadside plant leaves. Atmospheric Environment,
72: 113-129.
Rai, P.K. (2015). Multifaceted health impacts of Particulate Matter (PM) and its
management: An overview. Environmental Skeptics and Critics, 4(1): 1-26.
Rai, P.K. and Chutia, B.M. (2014). Assessment of Ambient air quality status before and
after Shifting Cultivation in an Indo-Burma hotspot region. International
Research Journal of Environment Sciences, 3(11): 1-5.
Rai, P.K. and Panda, L.S. (2014). Dust capturing potential and air pollution tolerance index
(APTI) of some road side tree vegetation in Aizawl, Mizoram, India: an Indo-
Burma hot spot region. Air Quality, Atmospheric, and Health, 7(1): 193-101.
Rai, P.K., Chutia, B.M. and Patil, S.K. (2014). Monitoring of spatial variations of
particulate matter (PM) pollution through bio-magnetic aspects of roadside plant
leaves in an Indo-Burma hot spot region. Urban Forestry & Urban Greening, 13:
761-770.
Randolph, J. (2004). Environmental Land Use Planning and Management. Island Press,
Washington, DC, 664 pp.
Rautio, P., Huttunen, S. and Lamppu, J. (1998a). Effects of sulphur and heavy metal
deposition on foliar chemistry of Scots pines in Finnish Lapland and on the Kola
Peninsula. Chemosphere, 36 (4-5): 979-984.
Rautio, P., Huttunen, S. and Lamppu, J. (1998b). Seasonal foliar chemistry of northern Scots
pine under sulphur and heavy metal pollution. Chemosphere, 37 (2), 271-278.
[122]
Rautio, P., Huttunen, S. and Lamppu, J. (1998c). Element concentrations in Scots pine
needles on radial transects across a subartic area. Water, Air, and Soil Pollution,
102: 389-405.
Revuelta, M.A., McIntosh, G., Pey, J., Perez, N., Querol, X. and Alastuey, A. (2014).
Partitioning of magnetic particles in PM10, PM2.5 and PM1 aerosols in the urban
atmosphere of Barcelona (Spain). Environmental Pollution, 188: 109-117.
Risom, L., Møller, P. and Loft, S. (2005). Oxidative stress-induced DNA damage by
particulate air pollution. Mutation Research, 592: 119-137.
Rizzio, E., Giaveri, G., Arginelli, D., Gini, L., Profumo, A. and Gallorini, M. (1999). Trace
elements total content and particle sizes distribution in the air particulate matter of a
rural-residential area in the north Italy investigated by instrumental neutron
activation analysis. Science of the Total Environment, 226: 47-56.
Robert, D., Brook, Jeffrey, R. and Sanjay, R. (2003). Air Pollution: The ―Heart ―of the
Problem. Current Hypertension Reports Current Science, 5: 32-39.
Roberts, D.L. and Jones, A. (2004). Climate sensitivity to black carbon aerosol from fossil
fuel combustion. Journal of Geophysical Research-Atmospheres, 109 (D16).
Robertson, D.J., Taylor, K.G. and Hoon, S.R. (2003). Geochemical and mineral magnetic
characterisation of urban sediment particulates, Manchester, UK. Applied
Geochemistry, 18(2): 269-282.
Robinson, S.G. (1986). The late Pleistocene palaeoclimatic record of North Atlantic deepsea
sediments revealed by mineral-magnetic measurements. Phys. Earth Planet. Inter.,
42(1-2): 22-47.

[123]
Rohr, C.A. and Wyzga, R.E. (2012). Attributing health effects to individual particulate
matter constituents. Atmospheric Environment, 62: 130-152.
Rosenfeld, A.H., Romm, J.J., Akbari, H. and Pomerantz, M. (1998). Cool communities:
strategies for heat islands mitigation and smog reduction. Energy and Buildings, 28:
51-62.
Sagnotti, L., Macrí, P., Egli, R. and Mondolio, M. (2006). Magnetic properties of
atmospheric particulate matter from automatic air sampler stations in Latium
(Italy): towards a definition of magnetic fingerprints for natural and anthropogenic
PM10 sources. Journal of Geophysical Research, 111: B12S22.
Sagnotti, L., Taddeucci, J., Winkler, A. and Cavallo, A. (2009). Compositional,
morphological, and hysteresis characterization of magnetic airborne particulate
matter in Rome, Italy. Geochemistry Geophysics Geosystems, 10: 17.
Saldiva, P.H., Clarke, R.W., Coull, B.A., Stearns, R.C., Lawrence, J., Murthy, G.G., Diaz, E.,
Koutrakis, P., Suth, H., Tsuda, A. and Godleski, J.J. (2002). Lung inflammation
induced by concentrated ambient air particles is related to particle composition.
American Journal of Respiratory and Critical Care Medicine, 165: 1610-1617.
Salvi, S.S., Nordenhall, C., Blomberg, A., Rudell, B., Pourazar, J., Kelly, F.J., Wilson, S.,
Sandstrom, T., Holgate, S.T. and Frew, A.J. (2000). Acute exposure to diesel
exhaust increases IL-8 and GRO-production in healthy human airways. American
Journal of Respiratory and Critical Care Medicine, 161: 550-557.

[124]
Samet, J. M., Dominici, F., Curriero, F. C., Coursac, I. and Zeger, S.L. (2000). Fine
particulate air pollution and mortality in 20 U.S. cities, 1987-1994. N. Engl. J.
Med, 343: 1742-1749.
Samet, J.M. (2007). Traffic, Air Pollution, and Health. Inhalation Toxicology, 19(12): 1021-
1027.
Sant'Ovaia, H., Lacerda, M.J. and Gomes, C. (2012). Particle pollution - An environmental
magnetism study using biocollectors located in northern Portugal. Atmospheric
Environment, 61: 340-349.
Santra, S.C. (2013). Environmental Science. 3rd
Ed. New Central Book Agency (P) Ltd, pp
3.
Saquib, M. and Khan, F.A. (1999). Air pollution impacts on the growth and reproductive
behaviour of mustard. Journal of Environmental Biology, 20(2): 107-110.
Saragnese, F., Lanci, L. and Lanza, R. (2011). Nanometric-sized atmospheric particulate
studied by magnetic analyses. Atmospheric Environment, 45: 450-459.
Schadlich, G., Weissflog, L. and Schuurmann, G. (1995). Magnetic susceptibility in conifer
needles as indicator of flyash deposition. Fresenius Environmental Bulletin, 4: 7-12.
Scheepers, P.T., Coggon, D., Knudsen, L.E., Anzion, R., Autrup, H., Bogovski, S., Bos, R.P.,
Dahmann, D., Farmer, P., Micka, V., Muzyka, V., Neumann, H.G., Poole, J.,
Schmidt-Ott, A., Seiler, F., Volf, J. and Zwirner-Baier, I. (2002). Biomarkers for
Occupational Diesel exhaust Exposure Monitoring (BIOMODEM)—a study in
underground mining. Toxicology Letters, 134: 305-317.

[125]
Schoket, B. (1999). DNA damage in humans exposed to environmental and dietary
polycyclic aromatic hydrocarbons. Mutation Research, 424: 143-153.
Schwartz, J. (1996). Air pollution and hospital admissions for respiratory disease.
Epidemiology, 7: 20-28.
Schwartz, J., Dockery, D.W. and Neas, L.M. (1996). Is daily mortality associated
specifically with fine particles? J. Air Waste Manage. Assoc, 46: 927-939.
Schwartz, S.E. (1996). The Whitehouse effect – Shortwave radiative forcing of climate by
anthropogenic aerosols: An overview. Journal of Aerosol Science, 27(3): 359- 382.
Scott, K.I., McPherson, E.G. and Simpson, J.R. (1998). Air pollutant uptake by Sacramento‘s
urban forest. Journal of Arboriculture, 24: 224-233.
Seaton, A., Mac Nee, W., Donaldson, K. and Godden, D. (1995). Particulate air pollution and
acute health effects. The Lancet, 345(8943): 176-178.
Sgrigna, G., Saebo, A., Gawronski, S., Popek, R. and Calfapietra, C. (2015). Particulate
Matter deposition on Quercus ilex leaves in an industrial city of central Italy.
Environmental Pollution, 197: 187-194.
Sharma, A. and Tripathi, B.D. (2008). Magnetic mapping of fly-ash pollution and heavy
metals from soil samples around a point source in a dry tropical environment.
Environmental Monitoring and Assessment, 138 (1-3): 31-39.
Shilton, V.F., Booth, C.A., Smith, J.P., Giess, P., Mitchell, D.J. and Williams, C.D. (2005).
Magnetic properties of urban street dust and their relationship with organic matter
content in theWest Midlands, UK. Atmospheric Environment, 39: 3651-3659.

[126]
Shu, J., Dearing, J., Morse, A., Yu, L. and Li, C. (2000). Magnetic properties of daily
sampled total suspended particulates in Shanghai. Environmental Science and
Technology, 34: 2393-2400.
Shu, J., Dearing, J.A., Morse, A.P., Yu, L. and Yuan, N. (2001). Determining the sources of
atmospheric particles in Shanghai, China, from magnetic and geochemical
properties. Atmospheric Environment, 35: 2615-2625.
Shukla, A., Timblin, C., BeruBe, K., Gordon, T., McKinney, W., Driscoll, K., Vacek, P. and
Mossman B.T. (2000). Inhaled particulate matter causes expression of nuclear
factor (NF)-kB-related genes and oxidant-dependent NF-kB activation in vitro.
American Journal of Respiratory Cell and Molecular Biology, 23: 182-187.
Shukla, V., Dalal, P. and Chaudhry, D. (2010). Impact of vehicular exhaust on ambient air
quality of Rohtak city. Journal of Environmental Biology, 31(6): 929-932.
Simonich, S. and Hites, R. (1994). Importance of vegetation in removing polycyclic
hydrocarbons from the atmosphere. Nature, 370: 49-51.
Simonich, S. and Hites, R. (1995). Organic pollutant accumulation in vegetation.
Environmental Science and Technology, 29: 2905-2914.
Singh, S. (1991). Environmental Geography. Prayag Pustak Bhawan, pp 466-507.
Sirajuddin, M. and Ravichandran, M. (2010). Ambient air quality in an urban area and its
effects on plants and human beings: A case study of Tiruchiraalli, India.
Kathmandu University Journal of Science, Engineering and Technology, 6(2):13-
19.

[127]
Spassov, S., Egli, R., Heller, F., Nourgaliev, D.K. and Hannam, J. (2004). Magnetic
quantification of urban pollution sources in atmospheric particulate matter.
Geophysical Journal International, 159: 555-564.
Speak, A.F., Rothwell, J.J., Lindley, S.J. and Smith, C.L. (2012). Urban particulate pollution
reduction by four species of green roof vegetation in a UK city. Atmos. Environ.,
61: 283-293.
Steinnes, E., Lukina, N., Nikonov, V., Aamlid, D. and Royset, O. (2000). A gradient study of
34 elements in the vicinity of a copper-nickel smelter in the Kola Peninsula.
Environmental Monitoring and Assessment, 60: 71-80.
Stenfors, N., Nordenhall, C., Salvi, S.S., Mudway, I., Soderberg, M., Blomberg, A.,
Helleday, R., Levin, J.O., Holgate, S.T., Kelly, F.J., Frew, A.J. and Sandstrom, T.
(2004). Different airway inflammatory responses in asthmatic and healthy humans
exposed to diesel. European Respiratory Journal, 23: 82-86.
Sternberg, T.,Viles, H., Cathersides, A., and Edwards, M. (2010). Dust particulate deposition
by ivy(Hedera helix L.) on historic walls in urban environment. Sci.Total Environ.,
409: 162-168.
Suwa, T., Hogg, J.C., Quinlan, K.B., Ohgami, A., Vincent, R. and Van Eeden, S.F. (2002).
Particulate air pollution induces progression of atherosclerosis. Journal of the
American College of Cardiology, 39(6): 935-942.
Szönyi, M., Sagnotti, L. and Hirt, A.M. (2008). A refined biomonitoring study of airborne
particulate matter pollution in Rome, with magnetic measurements of Quercus Ilex
tree leaves. Geophysical Journal, 173: 127-141.

[128]
Taha, H. (1996). Modeling the impacts of increased urban vegetation on the ozone air quality
in the South Coast Air Basin. Atmospheric Environment, 30: 3423-3430.
Taha, H. (1997). Modeling the impacts of large-scale albedo changes on ozone air quality in
the South Coast Air Basin. Atmospheric Environment, 31: 1667-1676.
Taner, S., Pekey. B. and Pekey, H. (2013). Fine particulate matter in the indoor air of
barbeque restaurants: Elemental compositions, sources and health risks. Science of
the Total Environment, 454-455: 79-87.
Thompson, R. (1986). Modelling magnetization data using SIMPLEX. Phys. Earth planet.
Inter., 42: 113-127.
Thompson, R. and Oldfield, F. (1986). Environmental magnetism. Allen and Unwin, London,
227 pp.
Tretiach, M., Adamo, P., Bargagli, R., Baruffo, L., Carletti, L., Crisafulli, P., Giordano, S.,
Modenesi, P., Orlando, S. and Pittao, E. (2007). Lichen and moss bags as
monitoring devices in urban areas. Part I: influence of exposure on sample vitality.
Environmental Pollution, 146: 380-391.
Ukonmaanaho, L., Starr, M., Hirvi, J.-P., Kokko, A., Lahermo, P., Mannio, J., Paukola, T.,
Ruoho-Airola, T. and Tanskanen, H. (1998). Heavy metal concentrations in various
aqueous and biotic media in Finnish Integrated Monitoring catchments. Boreal
Environment Research, 3: 235-249.
Urbat, M., Lehndorff, E. and Schwark, L. (2004). Biomonitoring of air quality in the Cologne
conurbation using pine needles as a passive sampler - part 1: magnetic properties.
Atmospheric Environment, 38: 3781-3792.

[129]
Valavanidis, A., Fiotakis, K. and Vlachogianni, T. (2008). Airborne particulate matter and
human health: toxicological assessment and importance of size and composition of
particles for oxidative damage and carcinogenic mechanisms. Journal of
Environmental Science and Health, Part C, 26(4): 339-362.
Veijalainen, H. (1998). The applicability of peat and needle analysis in heavy metal
deposition surveys. Water, Air, and Soil Pollution, 107: 367-391.
Veranth, J.M., Gelein, R. and Oberdorster, G. (2003). Vaporization-Condensation
generation of ultrafine hydrocarbon particulate matter for inhalation toxicology
studies. Aerosol science and technology, 37: 603-609.
Verma, A. and Singh, S.N. (2006). Biochemical and Ultra structural Changes in Plant
Foliage exposed to Auto pollution. Environmental Monitoring and Assessment, 120:
585-602.
Wahlin, P., Berkowicz, R. and Palmagren, F. (2006). Characterisation of traffic generated
particulate matter in Copenhagen. Atmospheric Environment, 40: 2151-2159.
Walden, J. (1999). Sample collection and preparation. In J. Walden, F. Oldfield & J. P. Smith
(Eds.), Environmental magnetism: a practical guide. Technical guide no. 6 (pp: 26-
34). Cambridge, England: Quaternary Research Association.
Watkins, S.J. and Maher, B.A. (2003). Magnetic characterisation of present-day deep-sea
sediments and sources in the North Atlantic. Earth and Planetary Science Letters,
214: 379-394.

[130]
Watkins, S.J., Maher, B.A. and Bigg, G.R. (2007). Ocean circulation at the Last Glacial
Maximum: a combined modeling and magnetic proxy-based study.
Paleoceanography, 22.
Wenzel, K.-D.,WeiXflog, L., Manz, M., Hubert, A. and Schüürmann, G. (2000). Differences
in time-dependent accumulation of hydrophobic xenobiotics in pine needles.
Fresenius Environmental Bulletin, 9: 47-55.
White, R.H., Spengler, J.D., Dilwali, K.M., Barry, B.E. and Samet, J.M. (2005). Report of
workshop on traffic, health, and infrastructure planning. Archives of Environmental
and Occupational Health, 60: 70-76.
Wichmann, H.E. and Peters, A. (2000). Epidemiological evidence of the effects of ultrafine
particle exposure. Philosophical Transaction of the Royal Society of London, Part
A, 358: 2751-2769.
Wilson, J.G., Kingham, S., Pearce, J. and Sturman, A.P. (2005). A review of intraurban
variations in particulate air pollution: Implications for epidemiological research.
Atmospheric Environment, 39: 6444-6462.
Wolterbeek, B. (2002). Biomonitoring of trace element air pollution: principles, possibilities
and perspectives. Environmental Pollution, 120: 11-21.
Xia, D.S., Chen, F.H., Bloemendal, J., Liu, X.M., Yu, Y. and Yang, L.P. (2008). Magnetic
properties of urban dustfall in Lanzhou, China, and its environmental implications.
Atmospheric Environment, 42 (9): 2198-2207.

[131]
Xie, S., Dearing, J.A. and Bloemendal, J. (2000). The organic matter content of street dust in
Liverpool, UK, and its association with dust magnetic properties. Atmospheric
Environment, 34: 269-275.
Xie, S., Dearing, J.A., Boyle, J.F., Bloemendal, J. and Morse, A.P. (2001). Association
between magnetic properties and element concentrations of Liverpool street dust
and its implications. Journal of Applied Geophysics, 48: 83-92.
Yadav, R., Beig, G. and Jaffrrey, S.N.A. (2014). The linkages of anthropogenic emissions
and meteorology in the rapid increase of particulate matter at a foothill city in the
Arawali range of India. Atmospheric Environment, 85: 147-151.
Yang, S.N., Connell, D.W., Hawker, D.W. and Kayal, S.I. (1991). Polycyclic aromatic
hydrocarbons in air, soil and vegetation of an urban roadway. The Science of the
Total Environment, 102: 229-240.
Yang, T.H., Masumi, S, Weng, S.P., Chen, H.W., Chuang, H.C. and Chuang, K.J. (2015).
Personal exposure to particulate matter and inflammation among patients with
periodontal disease. Science of the Total Environment, 502: 585-589.
Yin, G., Hu, S., Cao, L., Roesler, W. and Appel, E. (2013). Magnetic properties of tree leaves
and their significance in atmospheric particle pollution in Linfen city, China. Chin.
Geogr. Sci., 23(1): 59-72.
Zeger, S.L., Dominici, F., McDermott, A. and Samet, J.M. (2008). Mortality in the medicare
population and chronic exposure to fine particulate air pollution in urban centers
(2000–2005). Environmental Health Perspectives, 116(12): 1614-1619.

[132]
Zhang, C., Qiao, Q., Piper, J.D.A. and Huang, B. (2011). Assessment of heavy metal
pollution from a Fe-smelting plant in urban river sediments using environmental
magnetic and geochemical methods. Environmental Pollution. http://
dx.doi.org/10.1016/j.envpol.2011.04.006.
Zhang, L., Gong, S., Padro, J. and Barrie, L. (2001). A size segregated particle dry deposition
scheme for an atmospheric aerosol module. Atmospheric Environment, 35(3): 549-
560.
Zhang, W., Yu, L., Lu, M., Hutchinson, M. and Feng, H. (2007). Magnetic approach to
normalizing heavy metal concentrations for particle size effects in intertidal
sediments in the Yangtze Estuary, China. Environmental Pollution, 147: 238-244.
Zhu, Y., Kuhn, T., Mayo, P. and Hinds, W.C. (2006). Comparison of daytime and nighttime
concentration profiles and size distributions of ultrafine particles near a major
highway. Environmental Science and Technology, 40: 2531-2536.