particulate air pollution - pat goodman
TRANSCRIPT

Particulate Air pollution
Prof.
Pat Goodman
(On Behalf of the Project Team)
Why worry about Particulate air pollution?
• Adverse health effects
• Death! (Dublin 1982)
• Harvard 6 cities (Reduced Life expectancy)
• The Environment itself

Dublin SMOG 1982Dublin 1982 Case Fatality Rates
Kelly and Clancy, Irish Medical Journal; 77:10: 322-324. 1984C
FR
2
3
4
5
6
7
8
9
1 0
J a n '8 0 J a n '8 1 J a n '8 2 J a n '8 3
D a te
Dr Pat Goodman EPA Conference Portlaoise Oct 2006
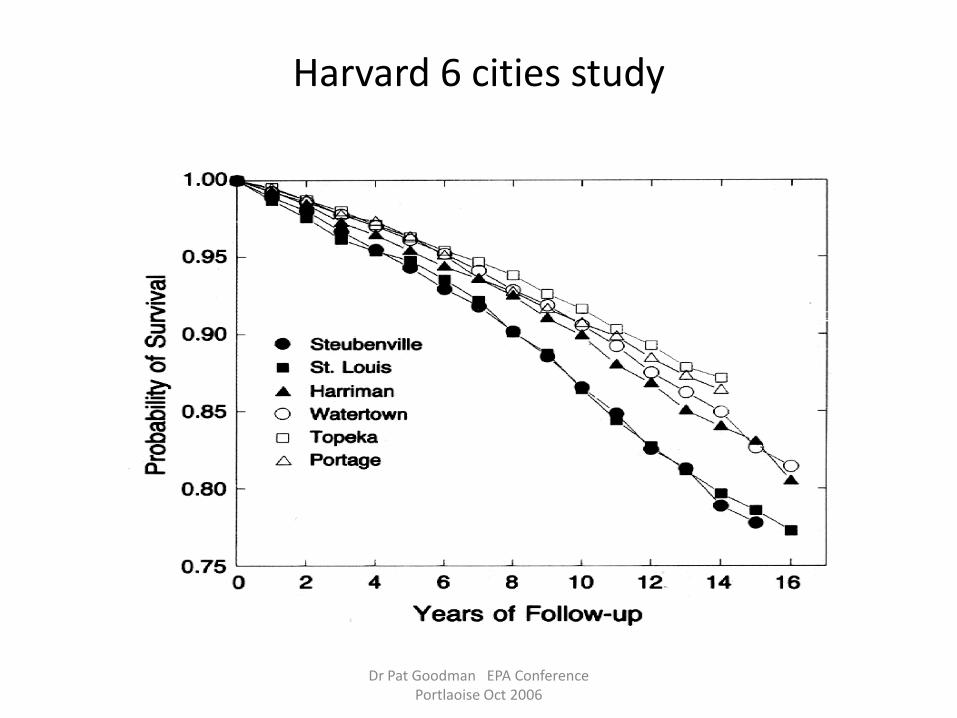
Harvard 6 cities study
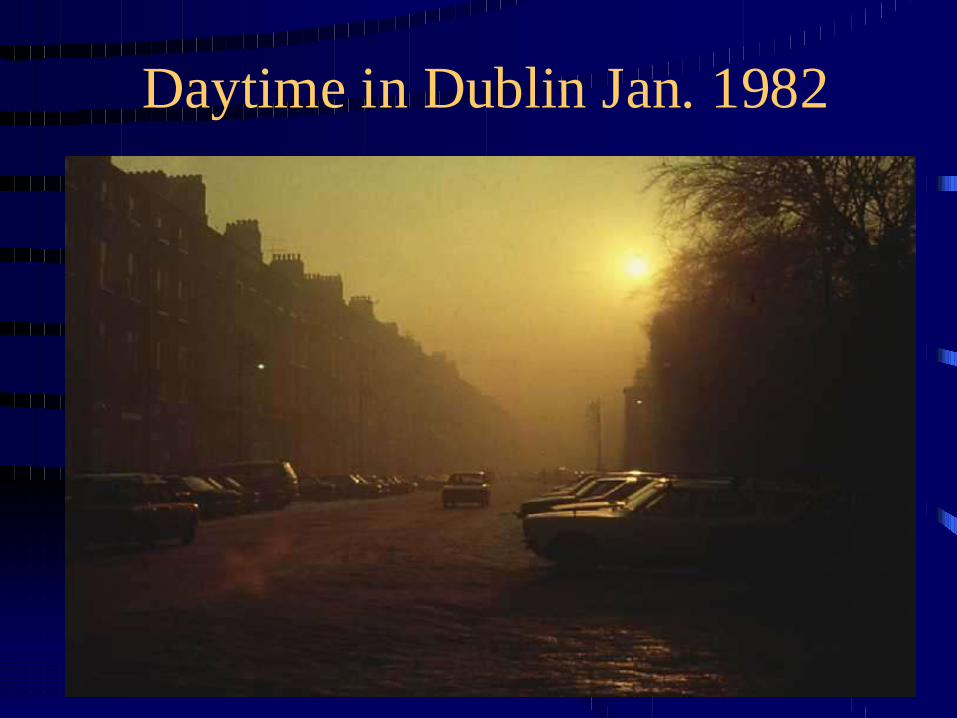
Daytime in Dublin Jan. 1982
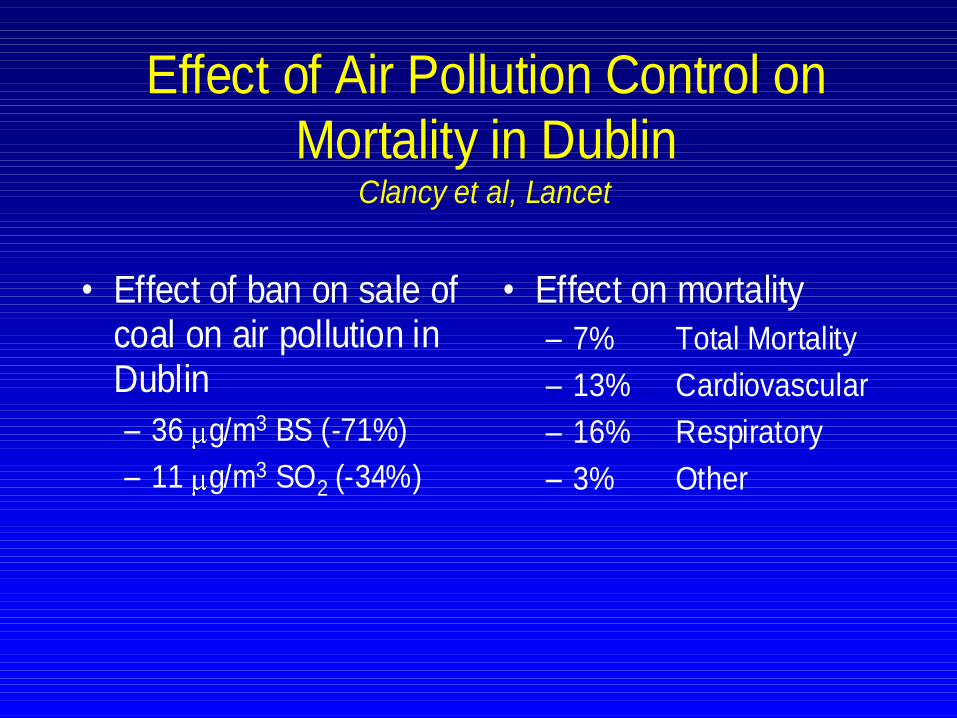
Effect of Air Pollution Control on
Mortality in DublinClancy et al, Lancet
• Effect of ban on sale ofcoal on air pollution inDublin
– 36 g/m3 BS (-71%)
– 11 g/m3 SO2 (-34%)
• Effect on mortality
– 7% Total Mortality
– 13% Cardiovascular
– 16% Respiratory
– 3% Other
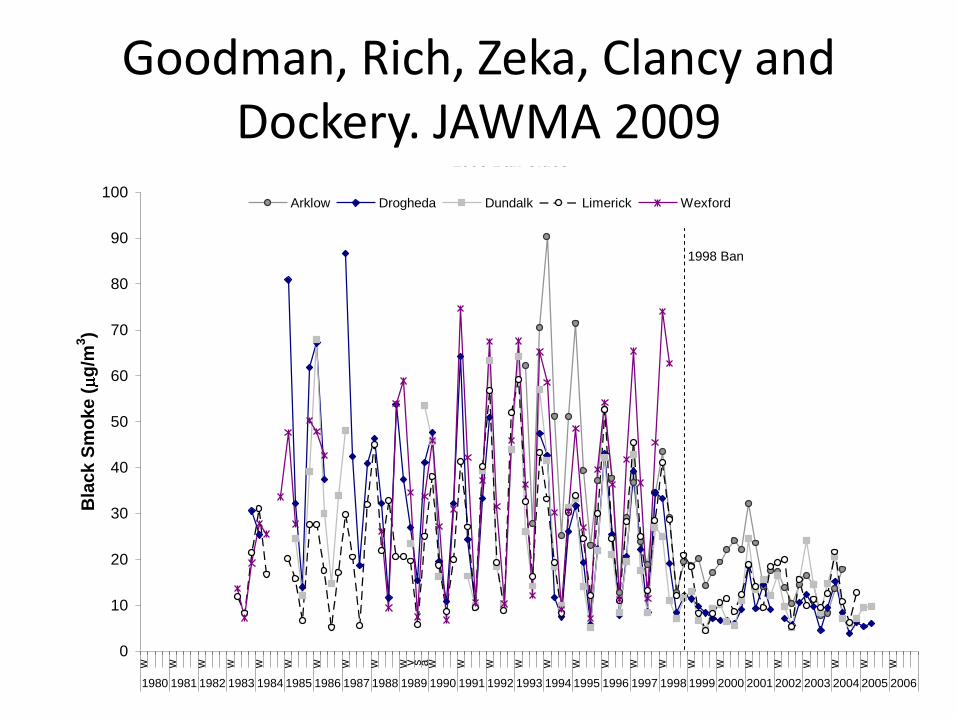
Goodman, Rich, Zeka, Clancy and Dockery. JAWMA 2009
1998 Ban Cities
0
10
20
30
40
50
60
70
80
90
100
w w w w w w w w w w v s a w w w w w w w w w w w w w w w w w
1980 1981 1982 1983 1984 1985 1986 1987 1988 1989 1990 1991 1992 1993 1994 1995 1996 1997 1998 1999 2000 2001 2002 2003 2004 2005 2006
Bla
ck S
mo
ke (
g/m
3)
Arklow Drogheda Dundalk Limerick Wexford
1998 Ban

Goodman, Rich, Zeka, Clancy and Dockery. JAWMA 20092000 Ban Cities
0
10
20
30
40
50
60
70
80
90
100
w w w w w w w w w w v s a w w w w w w w w w w w w w w w w w
198019811982198319841985198619871988198919901991199219931994199519961997199819992000200120022003200420052006
Bla
ck S
mo
ke (
g/m
3)
Celbridge Galway Leixlip Naas waterford
2000 Ban

The Current Study

The Contribution of Solid Fuel Use to Particulate and PAH Air
Pollution in Ireland
Collaborative Team Project
• DIT– Project lead– Literature Review– Chemical Analysis
• DCC– Site selection– Running of monitoring networks (BS and PM) – Staff training
• HSE– Local management of monitoring networks
Harvard Advisor Prof. Doug Dockery
Study components
• Air pollution monitoring
– PM10/2.5
– Black Smoke
• Chemical analysis of samples
– BaP and PAHs
• Literature review
• Final report

Monitoring site selection and Populations (2006 CSO)
• Navan 24,851
– Has natural gas and no coal ban
• Killarney 14,603
– No natural gas, no coal ban
• Tralee 22,744
– Coal ban but no natural gas
• Letterkenny 17,586
– No coal ban and no natural gas
Site selection
• Have support of local HSE staff
• Local staff have been trained to change filters and check on the equipment
• Filters are sent to DCC/DIT for weighing and chemical analysis
• Periodic site visits by DCC and DIT staff
Monitoring
• Measurement of Black Smoke throughout 12 month period
• Dichot Partisols used for measurement of PM2.5 and PM10 at chosen sites, each for a total of 6 months
• Monitoring split to measure during both summer and winter periods
• Chemical analysis of PM filters and a selection of Black Smoke filters
Chemical Analysis
• Quantitative Analysis is being undertaken for the 7 USEPA PAH ( Benz(a)anthracene, benzo(a) pyrene, benzo(b)fluoranthene, benzo(k)fluoranthene, chrysene, dibenz(a,h)fluoranthene, indeno(1,2,3-c,d)pyrene) all of which are suspected carcinogens and known products of fossil fuel combustion.
• The analysis is being conducted using High Performance Liquid Chromatography (HPLC) with diode array and programmable fluorescence detectors in series. Fluorescence excitation and emission wavelengths will be optimised for each PAH using PAH standards.

Site selection Navan
April 1st – June 27th
January 2012–March 2012
3 local staff involved
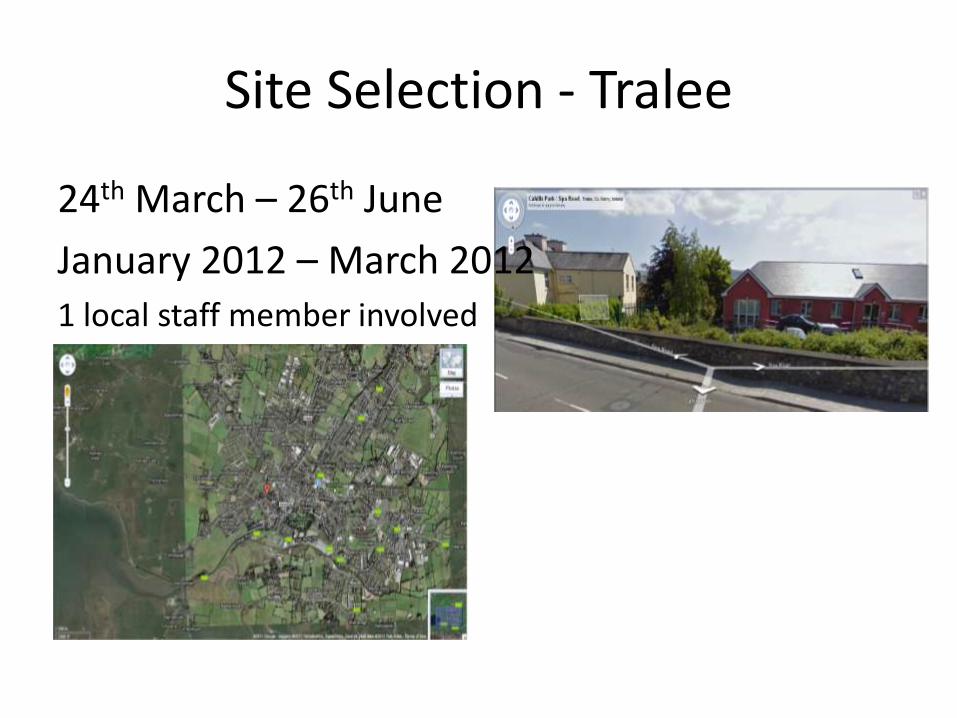
Site Selection - Tralee
24th March – 26th June
January 2012 – March 20121 local staff member involved
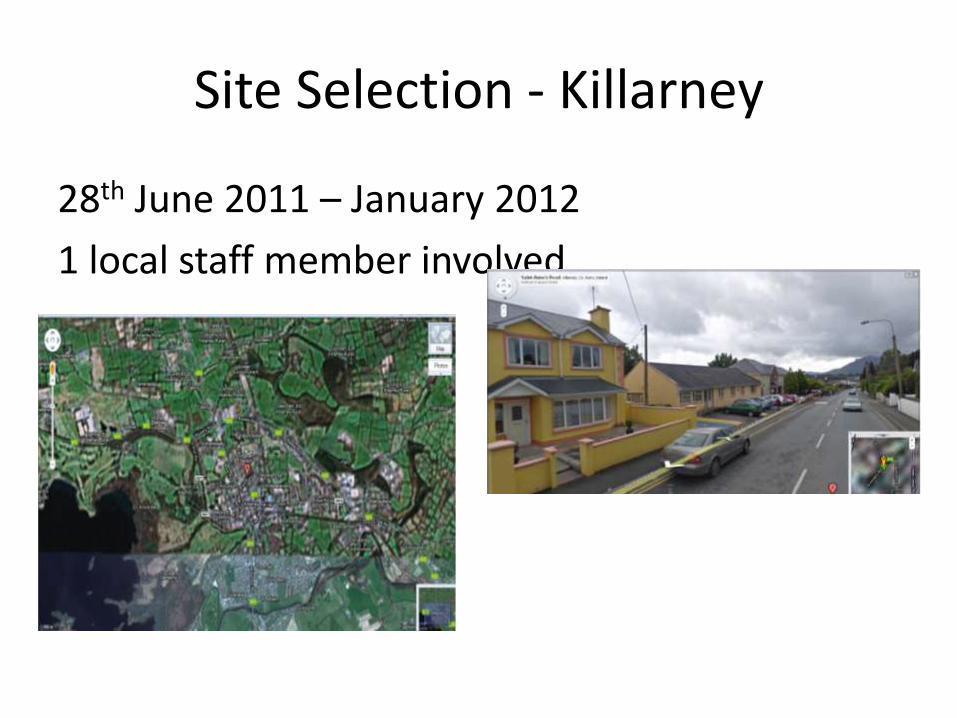
Site Selection - Killarney
28th June 2011 – January 2012
1 local staff member involved

Site Selection - Letterkenny
8th July 2011 – January 2012
4 local staff involved
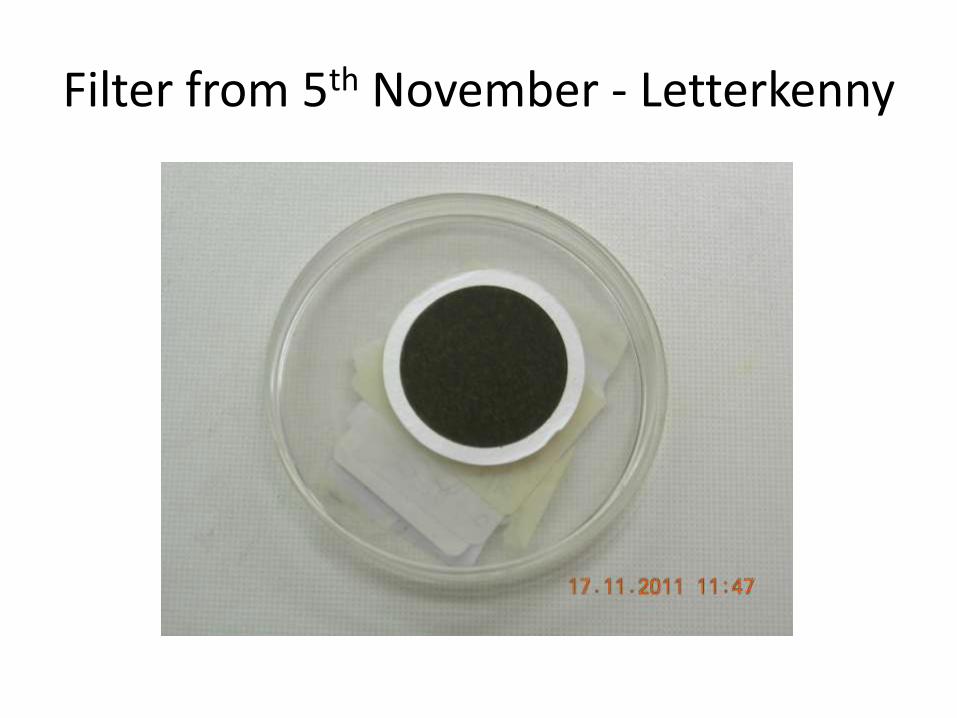
Filter from 5th November - Letterkenny

Sample Treatment
• Extraction: filter sonicated for 60 min in 30 ml acetonitrile
• Volume Reduction: Turbovap at 40oC to 0.5 ml followed by addition of internal standard (B(e)P) and made up to 1 ml.
• Analysis: HPLC with fluorescence detection
PAH Analysis
Interim Results
• Monitoring is not completed yet
• Data presented is based on a data gathered to date (but not on a full year)
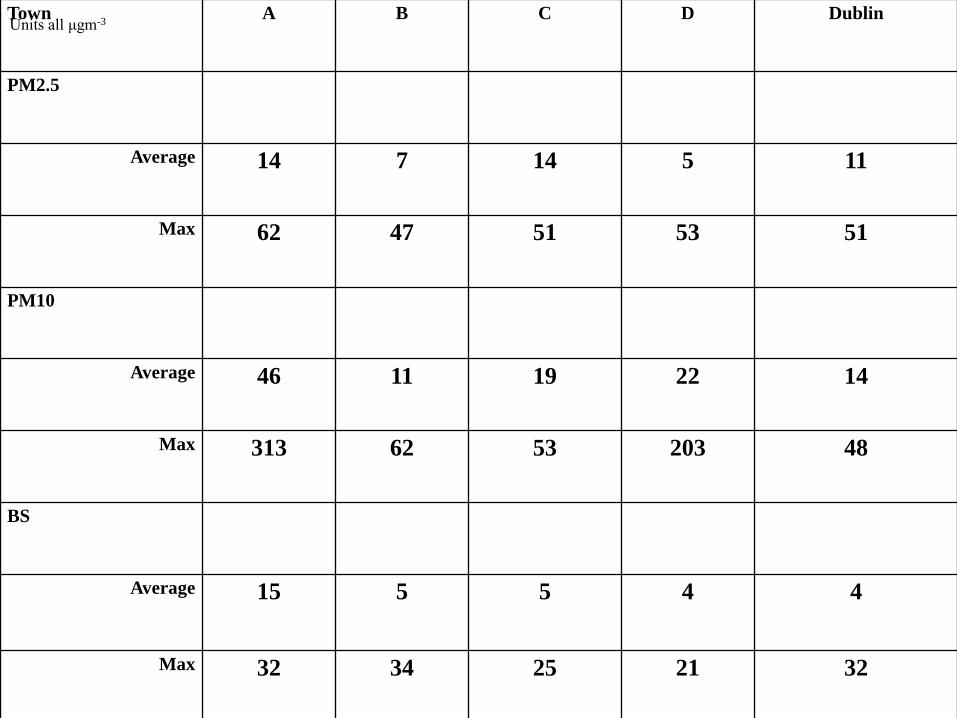
Town A B C D Dublin
PM2.5
Average 14 7 14 5 11
Max 62 47 51 53 51
PM10
Average 46 11 19 22 14
Max 313 62 53 203 48
BS
Average 15 5 5 4 4
Max 32 34 25 21 32
Units all μgm-3

0
0.5
1
1.5
2
2.5
3
3.5
4
4.5
A Annual B Annual C Annual D Annual
PAH
-TE
F V
alu
en
gm-3
Urban Site
PAH TEF Value in relationto upcoming legislated limit during episodes
pm2.5
pm2.5-10
EU Limit
Linear (EU Limit)
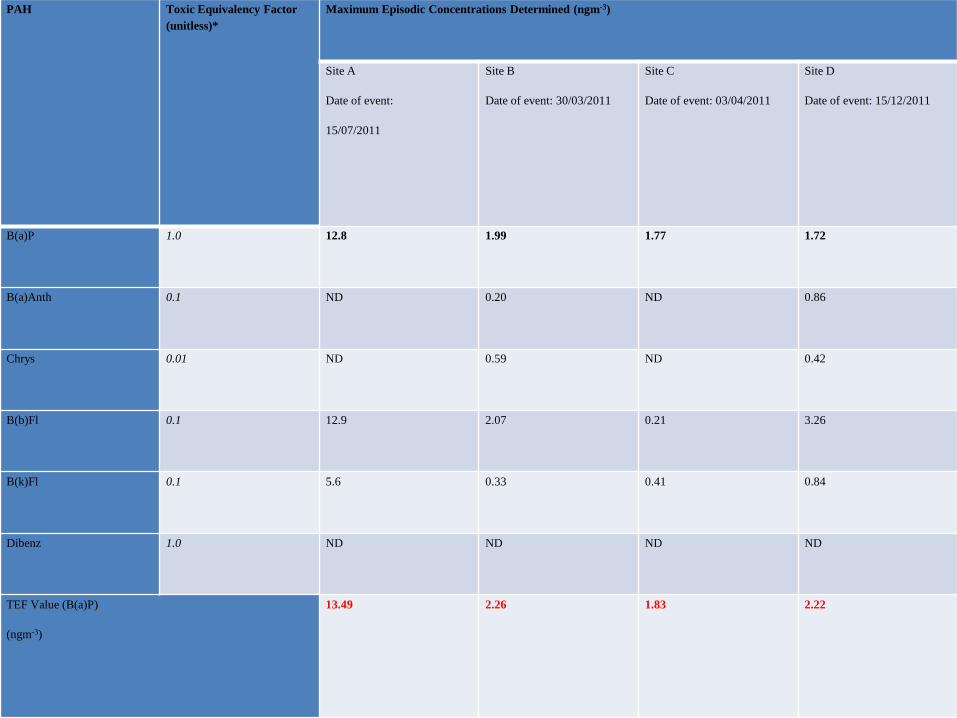
PAH Toxic Equivalency Factor
(unitless)*
Maximum Episodic Concentrations Determined (ngm-3)
Site A
Date of event:
15/07/2011
Site B
Date of event: 30/03/2011
Site C
Date of event: 03/04/2011
Site D
Date of event: 15/12/2011
B(a)P 1.0 12.8 1.99 1.77 1.72
B(a)Anth 0.1 ND 0.20 ND 0.86
Chrys 0.01 ND 0.59 ND 0.42
B(b)Fl 0.1 12.9 2.07 0.21 3.26
B(k)Fl 0.1 5.6 0.33 0.41 0.84
Dibenz 1.0 ND ND ND ND
TEF Value (B(a)P)
(ngm-3)
13.49 2.26 1.83 2.22
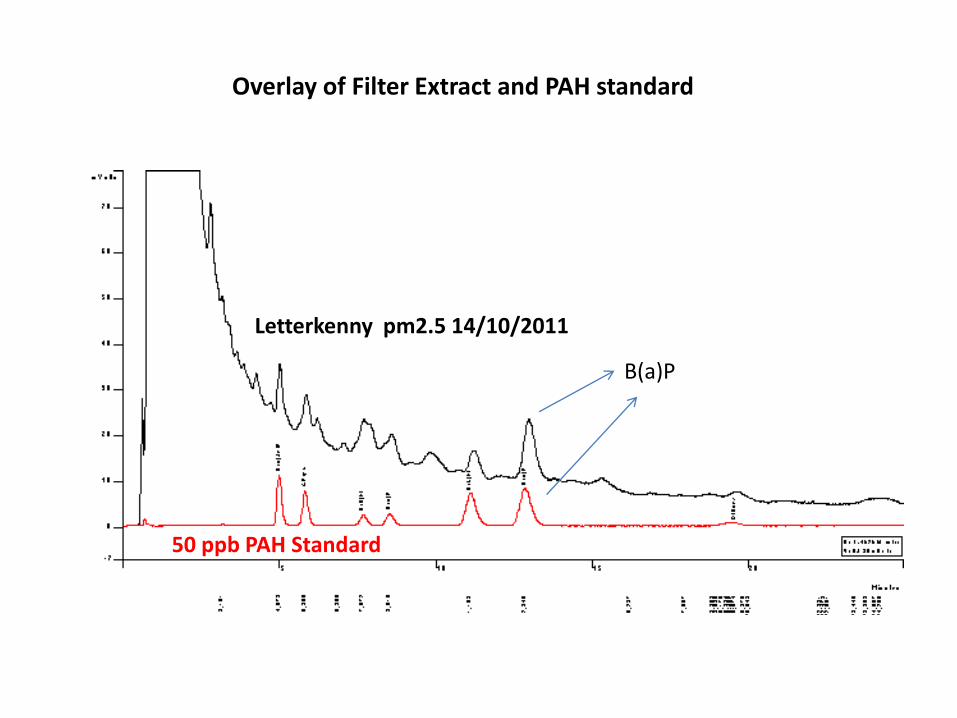
Letterkenny pm2.5 14/10/2011
50 ppb PAH Standard
B(a)P
Overlay of Filter Extract and PAH standard

Letterkenny pm2.5 5/11/2011Estimated at ~350ppb
50 ppb Standard
B(a)P
Overlay of Filter Extract and PAH standard
Issues and Problems
• Initial filters were faulty
• PM2.5-PM10 fraction need to do batch analysis to for PAH work
• HPLC is limited, GC mass spec ordered
• Exploring possibility of x-Ray flour with Prof Dockery
Discussion and Conclusions
• Work is ongoing, final report due end Nov 2012
• Some PM levels giving cause for concern
• As data is interim more detailed analysis incorporating meteorological data is needed
• Domestic heating is most likely the source of the higher levels observed

Any Questions?