regulatory effects on particulate pollution in the early ... · pdf fileregulatory effects on...
TRANSCRIPT

Regulatory effects on particulate pollution in the early hoursof Chinese New Year, 2015
Yonghang Lai & Peter Brimblecombe
Received: 19 February 2017 /Accepted: 3 August 2017 /Published online: 23 August 2017# The Author(s) 2017. This article is an open access publication
Abstract Human activities are a key driver of air pol-lution, so it is hardly surprising that celebrations affectair quality. The use of fireworks contributes to highparticulate concentrations in many parts of the world,with the Chinese Lunar New Year (spring festival) par-ticularly noticeable, as firecrackers are traditionally usedto drive off evil spirits. Fireworks lead to short-termpeaks in the concentration of PM10, PM2.5 and SO2.Regulatory actions that restrict the use of fireworks havebeen evident in China since the 1990s. This paperinvestigates the particulate concentrations in nine Chi-nese cities (Beijing, Chengdu, Chongqing, Tianjin,Xi’an, Nanjing, Shanghai, Guangzhou and Shenzhen,along with Hong Kong (a Special Administrative Re-gion) and Taipei and Kaohsiung (Taiwan) with a partic-ular focus on the celebrations of 2015. Extremely highconcentrations of particulate matter were observed, withsome sites revealing peak PM10 concentrations in ex-cess of 1000 μg m−3 in the early hours of the New Year.In Beijing, Tianjin and Chongqing, the activities caused
high particulate matter concentrations at most sitesthroughout the city. These peaks in particulate load inthe early hours of Chinese New Year do not appear to beclosely related to meteorological parameters. However,in cities where fireworks appear to be better regulated,there are fewer sharp pollution peaks just after midnight,although lowered air quality can still be found in theouter parts of some cities, remote from regulatory pres-sures. A few cities seem to have been effective at reduc-ing the impact of the celebrations on air quality, withNanjing a recent example. An increasing focus on lightdisplays and electric lanterns also seems to offer a senseof celebration with much reduced impacts on air quality.
Keywords China . Fireworks . HongKong . PM2.5 .
PM10 . Taiwan
Introduction
Human activities are a key driver of air pollution so it ishardly surprising that celebrations and cultural activitiescan have a profound impact. One of the best studied isthe regularly occurring weekend effect, which is definedas the difference of air pollutant concentrations betweenweekdays and weekends, with a general reduction ofmajor pollutants. For instance, Qin et al. (2004) reportedthat the average concentrations of NOx, CO, NMOCand PM10 at weekends were lower than those on week-days in southern California. It was first observed in theUSA in the 1970s (Jimenez et al. 2005), and since then,many studies have reported these effects that are
Environ Monit Assess (2017) 189: 467DOI 10.1007/s10661-017-6167-0
Highlights Fireworks at Chinese New Year create intensemorning particulate peaksThe highest values often observed at the outskirts of citiesFirework particulate pollution peaks more evident in NorthernChinaPublic displays, lights and lanterns may lower particulateconcentrations
Y. Lai : P. Brimblecombe (*)School of Energy and Environment, City University of HongKong, Kowloon Tong, Hong Konge-mail: [email protected]

influenced by traffic rush hours (e.g., Cerro et al. 2014;Henschel et al. 2015), population size (e.g., Butenhoffet al. 2015) and degree of urbanisation (e.g., Huryn andGough 2014). The phenomenon can also be seen inChina; for example, both Tang et al. (2008) and Leiet al. (2015) reported lower concentrations of primarypollutants at weekends compared with those on week-days in Shanghai and Beijing, respectively.
Holidays often mean that factories are close andpeople spend more time at home, leading to lowerpollutant concentration, which has been termed theholiday effect. For example, the drastic decrease ofprimary pollutant emissions (83–98% of NO) dur-ing the Jewish Day of Atonement was reported byLevy (2013). Meanwhile, Tan et al. (2009) re-vealed lower concentrations of NOx, CO andnon-methane hydrocarbons at Chinese New Year.As this is such a major holiday, it is hardly sur-prising that the holiday effect is widely observed.The concentrations of SO2 and PM10 in Taiwanfrom 1994 to 2006 were lower during ChineseNew Year (or the Spring Festival, sometimestermed the Lantern Festival in Taiwan), while theconcentration of ozone was higher (no titration byNO). In China, the Spring Festival led to a generalimprovement in air quality (e.g. Li et al. 2006;Tan et al. 2009; Gong et al. 2014; Lei et al. 2015;Zhao et al. 2015). However, this is not always trueas research on the Spring Festival effect in 31 keyChinese cities found no significant reduction in theconcentration of PM2.5 and PM10 during the hol-iday compared with the period that followed (Chenet al. 2014). In Shanghai, there can also be aSpring Festival rush hour as people prepare forthe holiday (Huang et al. 2012), which not onlyenhances primary pollutant concentrations but alsoshowed sharp peaks in particulate peaks duringpast New Year celebrations (Zhang et al. 2010).
A range of cultural activities can directly enhanceprimary pollutants, such as the Sunday roast of Vic-torian England (Brimblecombe 1987) or barbecues(Tsai et al. 2015). There are numerous reports onthe impact of key events where fireworks contributeto visibility reduction (Singh et al. 2015), toxicmetals (e.g., Camilleri and Vella 2010; Kong et al.2015a), illicit use of the metalloid arsenic (Sterbaet al. 2013) and enhanced particulate loads in: Spain(Moreno et al. 2010), Slovenia (Mlakar et al. 2012),the USA on Independence Day (Seidel and Birnbaum
2015) or German New Year (Drewnick et al. 2006), inIndia during the Diwali festival (Ravindra et al. 2003;Perrino et al. 2011; Chatterjee et al. 2013; Bhatnagar andDadhich 2015) or the numerous festivals that occurthroughout the summer in Malta (Camilleri and Vella2010). Air pollution from fireworks is frequently ob-served at the Chinese Lunar New Year (Spring Festival)period; widely celebrated in Asia and within the Chinesediaspora. Firecrackers are thought to drive away evilspirits, that lurk around to torment human beings, butthe noise causes them to vanish into thin air (Wong1967); however, such celebrations contribute to a reduc-tion in air quality. Tsai et al. (2012) found that theaverage concentration of PM10 rose to high levels overKaohsiung Harbour, influenced by fireworks duringTaiwan’s lantern festival. Gong et al. (2014) reported areduction in aerosol during the Spring Festival andrevealed that the concentrations of major air pollutantshad significantly decreased around the holiday, but ashort-term peak could be seen for PM10, NO2 and SO2,due to fireworks along with peaks in the concentrationof a range of metals Sr, K, Ba, Pb, Al, Mg, and Cu,(Chang et al. 2011), dicarboxylic acids (Wang et al.2007). There has been concern that even relatively shortexposures to metallic elements from fireworks mighthave health implications (Yang et al. 2014). Additional-ly perchlorates associated with fireworks as an oxidantcan have health effects along with the potential to causebroader ecological damage (Sijimol and Mohan 2014).The impact of New Year fireworks on air quality hasbeen studied in a number of Chinese urban areas:Yanshui in Taiwan (Chang et al. 2011), Beijing (Wanget al. 2007), Jinan (Yang et al. 2014), Lanzhou (Zhaoet al. 2014), Nanning (Yan 2011), Pearl River Delta(Zhao et al. 2015), Wuxi (Cao 2014) and Xian (Wanget al. 2008; Shen et al. 2009; Zhou et al. 2013).
This paper examines the cultural and administra-t ive characterist ics affecting the pattern ofpollutants on the eve of Chinese New Year, 2015.Previous studies have examined Chinese New Yearin specific locations, often describing the holidayeffect. Here, we focus on the concentration ofparticulate matter derived from fireworks in citiesacross the region to examine the influence of dif-fering approaches to regulation. The paperconsiders a number of Chinese cities (Beijing,Chengdu, Chongqing, Tianjin, Xi’an, Nanjing,Shanghai, Guangzhou and Shenzhen, along withHong Kong (a Special Administrative Region)
467 Page 2 of 14 Environ Monit Assess (2017) 189: 467

and Taipei and Kaohsiung (Taiwan). The cities aremarked on the weather chart displayed in Fig. 1.We review the impact of this celebration acrossGreater China and see 2015 as an exemplar of thetypes of changes that may be underway. Evidenceof aerosols from fireworks were found from aerosolcharacteristics in Xinxiang (Feng et al. 2016) andTianjin (Liu et al. 2016) during the celebrations of2015. It also places earlier work into perspectiveand allows us to consider of the role of regulatoryactivities in the face of the social norms of China’sculture of Nian when mythology justifies the use offireworks to frighten evil spirits (Chao et al. 2014;Ye et al. 2016). Regulatory activities that restrictthe use of fireworks have been evident in Chinasince the 1990s, but in 2006, Beijing initiated apolicy to allow people to use fireworks over limitedperiods although the application of such restrictionson fireworks may vary over time. It is often be-lieved that it may be hard to gain broad acceptanceof tough regulation regarding the use of fireworksat New Year. Despite this, there are some cities thatseem to have grappled with the problem quite suc-cessfully for a considerable period of time. HongKong, possibly due to its colonial past, has hadstrict regulations regarding fireworks, while nearbyGuangzhou and Shenzhen have tended to retainbans introduced in the 1990s. The paper will con-tribute to the debate on whether enhanced regula-tory activity can be undertaken in a sensitive way,which is successful in retaining cultural values.
Method
The date of Chinese New Year is set according to thelunar calendar. In 2015, the first day of the New Yearwas 19 February. Since the holiday period is different indifferent locations, our definition of the holiday periodfollows the local statutory definitions:
& Mainland China: Starting 18 February, ending 24February.
& Hong Kong: Starting 19 February, ending 21February
& Taiwan: Starting 18 February, ending 23 February.
In this study, the hourly and daily measurements ofsix pollutants were taken as PM2.5, PM10, CO, NO2,
O3 and SO2 concentrations from available air qualitymonitoring stations in each of the cities for the 2015New Year period. In much of the analysis, only theparticulate matter was used, as the particulate matterconcentrations show the clearest signature of the NewYear event. The data were derived from observationsmade by various government agencies, which providedinformation as shown below:
& Mainland China: Data for 11 monitoring stations inBeijing and Shenzhen, ten in Guangzhou andShanghai, eight stations in Tianjin, seven stationsin Chengdu, 12 stations in Chongqing, 13 stations inXi’an and nine stations in Nanjing (http://aqicn.org/city/).
& Hong Kong: Hong Kong Environmental ProtectionDepartment (HKEPD) data for 12 general stationsand three roadside stations (http://epic.epd.gov.hk/EPICDI/air/station/?lang=en)
& Taiwan: Taiwan Environmental Protection Admin-istration (TEPA) data for seven monitoring stationsin Taipei and 12 stations in Kaohsiung (http://taqm.epa.gov.tw/taqm/en/HourlyData.aspx).
Meteorological data was taken fromWeather Under-ground: https://www.wunderground.com/history/ sitesin some cities needed to be stratified into variousadministrative areas, and although these are somewhatarbitrary, this has been done as follows: (i) Beijing; theinner city was defined as urban area i.e. inside the 2ndRing Road, with suburban being the area between 2ndand 5th Ring Road. Outskirts are beyond 5th Ring Road,with rural the furthest sites or outer suburbs (https://en.wikipedia.org/wiki/Beijing). (ii) Tianjin; the HepingDistrict is defined as urban while the peripheral admin-istrative divisions a denoted as suburban (https://en.wikipedia.org/wiki/Tianjin). (iii) Shenzhen; Luohu,Futian and NanShan are defined as urban areas.Guangming and Dapeng are the new districts and re-mote, so classified as rural areas, with other districts aredefined as suburban (see: https://en.wikipedia.org/wiki/Shenzhen).
The correlation between particulate concentra-tions and meteorological variables was determinedusing Wessa Free Statistics Software (https://www.wessa.net/), which was convenient as it gaveKendall τ and Spearman rs in addition to theparametric Pearson r. The short data sets fromindividual sites in cities were compared using the
Environ Monit Assess (2017) 189: 467 Page 3 of 14 467

Wilcoxon signed-ranks test. This was used most typi-cally to compare concentrations measured during thecelebrations [00:00–02:00] with those before and after-wards ([22:00–24:00] and [02:00–04:00]). This test wasadopted as an alternative to the paired t test whenassessing the difference between measurements fromthe monitoring stations across given cities, because theconcentrations seemed skewed. The results of this
signed-rank test are reported with the significance as atwo-tailed p value, the test statisticW and the number ofpairs n (i.e. sites). As the number of sites in the cities wassmall (i.e. 7–13), the observed value of W must bereferred to an exact sampling distribution (Mostelleret al. 1973). In this work we used the on-line calculatorsavailable at the VassarStats Website for Statistical Com-putation (http://www.vassarstats.net/).
Fig. 1 Meteorological chart of the region which includes thelocations of cities discussed in the text, with the pressure field isadopted from (http://www.hko.gov.hk/wxinfo/currwx/wxcht.htm). The insets show the temperature (T, open diamonds), wind
speed (u, dots) and relative humidity (RH, triangles) across arrivalof the New Year from 18:00–06:00. Note: Guangzhou is notshown because of space limitations, but it is similar to Shenzhen,although the winds are slacker
467 Page 4 of 14 Environ Monit Assess (2017) 189: 467

Results
In addition to showing the position of the cities con-sidered in this study, Fig. 1 also gives an indication ofthe overall weather conditions. It suggests a coldernorth, with a high-pressure area that probably led tostable conditions and the chance to build up pollutants.In the north of China, high pollutant concentrationscan result from the large amounts of fuel required forheating. In the warmer south dispersion along the coastmeans, air pollution tends to be lower in the winterseason. The annual particulate concentrations in Bei-jing, Tianjin, Xi’an are typically the highest. The citiesof the coastal south are usually lower, along with HongKong and Taiwan. Measurements of temperature, windspeed and relative humidity from each of the cities areshown in the small graphs that surround the meteoro-logical chart. Much as would be expected, these do notsuggest sharp changes with the transition to the NewYear.
Figure 2a shows the average pollutant concentra-tions for Beijing on New Year’s Eve and New Year’sDay of 2015. We can see that there is a dramaticchange in the concentration of particles just after mid-night. It is also associated with an increase in SO2 asobserved elsewhere (Yan 2011; Chatterjee et al. 2013)and hardly unexpected given the level of sulphur infireworks. However, there is no substantial change inCO which would be expected from traffic, in line withLi et al. (2006). Neither do we see a sharp rise in NO2,in the early morning, but there are some increasesthrough New Year’s Day, probably from traffic. Thechanges in particulate matter are so clear in the tem-poral plots, that the concentrations of PM10 andPM2.5 are used here as a marker of pollution derivedfrom fireworks, and we restrict our study to theserather as other markers such as percholorate and themetals thought distinctive they are not available for alarge number of sites. The differences in particulateconcentrations in Beijing between New Year’s Eve[18:00–24:00] and the morning of the New Year[00:00–06:00] are shown in the inset in Fig. 2. Theseare displayed as the median PM2.5 (darker shadedbars) and PM10 (lighter shaded bars), where the upperand lower quartiles are plotted as Berror bars^. TheWilcoxon test revealed significant differences at indi-vidual stations across the city before and after mid-night for both PM2.5 (median 107 μg m−3 [18:00–24:00] ; median 275 μg m−3 [00:00–06:00]
p2 = 0.0036, n = 11) and PM10 (median 120 μg m−3
[18:00–24:00]; median 310 μg m−3 [00:00–06:00](p2 = 0.005, n = 8). The HYSPLIT (Stein et al. 2015)back trajectory at this time suggests air from an area tothe north on the previous day. This includes the non-urbanised Yan Mountains and the grasslands of InnerMongolia beyond, which make long-range transportan unlikely source of the very high peaks in particulateconcentrations.
Figure 2b, c show the hourly particulate concentra-tions averaged across Beijing for the days around
Fig. 2 New Year air pollutant concentrations in Beijing. a Aver-age pollutant concentrations in Beijing around the period of Chi-nese New Year. Open squares denote PM10 and closed squaresPM2.5, while smaller dots diamonds and triangles denote CO, SO2
and NO2. Note: CO measurements have been divided by a hun-dred to bring them to a useful scale. Inset: comparison of themedian of New Year’s Eve (18:00–24:00) PM10 (lighter shadedbars) and PM2.5 concentrations (darker shaded bars) and thoseearly morning of the New Year (00:00–06:00) in Beijing. (b)Hourly PM2.5 concentrations averaged across Beijing for daysaround Chinese New Year for both 2015 (black line) and 2014(grey line). (c) Hourly PM10 concentrations averaged across Bei-jing for days around Chinese New Year for both 2015 (black line)and 2014 (grey line) Note: The peak on the third and fourth dayafter New Year is associated with a dust storm referred to in thetext
Environ Monit Assess (2017) 189: 467 Page 5 of 14 467

Chinese New Year for both 2015 (black line) and 2014(grey line). The temporal changes in Beijing over theselonger periods before and after the Chinese New Yearreveal no further obvious sharp peaks. However, a duststorm occurred in late February 2015 (RV 2015) and isevident 3 days after NewYear, when a broad area of dustcrossed Beijing driven by a northwest airflow in Mon-golia. This led to more than 10 h of high PM10 concen-trations, which peaked around 714 μg m−3 (Cheng et al.2015).
It is important when comparing cities across Great-er China that we determined that any effects thatchanges in particulate load could be attributed tofireworks and not simply derived from different me-teorological conditions. The potential for high con-centrations observed on the arrival of the New Year tobe related to temperature, wind speed and relativehumidity in addition to urban population was deter-mined by correlating measurements of average PM2.5and PM10 concentrations 00:00–03:00 (four mea-surements) across a city with the meteorological pa-rameters over the same period. The intensity of pol-lution at New Year was additionally estimated bysubtracting the average of three measurements imme-diately before and after the New Year peak to get asense of potential additional particulate matter fromfireworks. It is these peaks in pollution that likelyderive from the additional contributions from NewYear fireworks that were correlated in the graphs
and correlation matrix shown in Fig. 3. This figureshows the Pearson correlation coefficient, but thenon-parametric Kendall τ and Spearman rs (notshown) were little different.
The graph of the relationship between the PM2.5against PM10 is the only one in Fig. 3 that is partic-ularly convincing; all the others being ratherscattered. Each dot in the plots represents a city. Thecorrelation matrix in the lower left of Fig. 3 suggeststhat there is a significant relationship between PM2.5against PM10 (r = 0.981 and p = 0.00). This is alsotrue for correlation between the directly observedPM2.5 and PM10. (not shown but r = 0.961 andp = 0.00). There is a slight though weaker negativecorrelation between added PM2.5 and PM10 andtemperature (PM2.5: r = −0.557, p = 0.06 andPM10: r = −0.540 p = 0.07). This seems likely toarise because pollution from fireworks is rather highin the two colder northern cities (Beijing and Tianjin),which have high peaks in particulate concentrationsin the early hours of Chinese New Year. Not surpris-ingly, wind speeds also seem negatively correlatedwith peaks in PM2.5 against PM10 (shown in Fig.3) and measured particulate matter concentrations(not shown); albeit none are statistically significant.Population shows a slight positive correlation withparticulate matter, but not at significance levels(> 90%). The generally low level of significanceapparent from the correlation matrix leaves us with
Fig. 3 Correlation matrix between the additional PM2.5 concen-tration, additional PM10 concentration, temperature (T), wind speed(u), relative humidity (RH) and urban population (Pop) measuredacross the period 00:00–03:00. The correlation coefficient andp values are given in the lower left hand part of the matrix, while
bivariate plots are shown in the upper right, with each large dotrepresenting a city. Here the units are PM2.5 and PM10 asmicrogarm per cubic meter, T as degree Celsius, wind speed inmeter per second, RH as % and population in millions. The histo-grams on the diagonal show the distribution of data for each variable
467 Page 6 of 14 Environ Monit Assess (2017) 189: 467
an impression that the New Year peaks in particulateconcentrations are not predominantly driven by me-teorological conditions. This adds to the evidencepresented in Fig. 1, which suggests no sharp changesin meteorological conditions at the beginning of theNew Year.
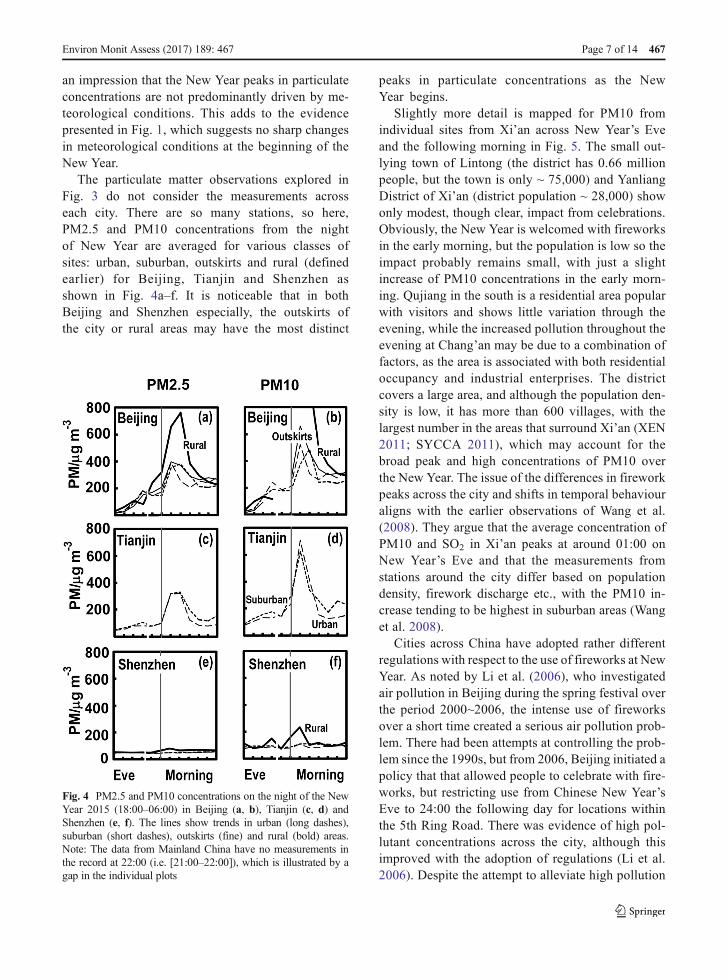
The particulate matter observations explored inFig. 3 do not consider the measurements acrosseach city. There are so many stations, so here,PM2.5 and PM10 concentrations from the nightof New Year are averaged for various classes ofsites: urban, suburban, outskirts and rural (definedearlier) for Beijing, Tianjin and Shenzhen asshown in Fig. 4a–f. It is noticeable that in bothBeijing and Shenzhen especially, the outskirts ofthe city or rural areas may have the most distinct
peaks in particulate concentrations as the NewYear begins.
Slightly more detail is mapped for PM10 fromindividual sites from Xi’an across New Year’s Eveand the following morning in Fig. 5. The small out-lying town of Lintong (the district has 0.66 millionpeople, but the town is only ~ 75,000) and YanliangDistrict of Xi’an (district population ~ 28,000) showonly modest, though clear, impact from celebrations.Obviously, the New Year is welcomed with fireworksin the early morning, but the population is low so theimpact probably remains small, with just a slightincrease of PM10 concentrations in the early morn-ing. Qujiang in the south is a residential area popularwith visitors and shows little variation through theevening, while the increased pollution throughout theevening at Chang’an may be due to a combination offactors, as the area is associated with both residentialoccupancy and industrial enterprises. The districtcovers a large area, and although the population den-sity is low, it has more than 600 villages, with thelargest number in the areas that surround Xi’an (XEN2011; SYCCA 2011), which may account for thebroad peak and high concentrations of PM10 overthe New Year. The issue of the differences in fireworkpeaks across the city and shifts in temporal behaviouraligns with the earlier observations of Wang et al.(2008). They argue that the average concentration ofPM10 and SO2 in Xi’an peaks at around 01:00 onNew Year’s Eve and that the measurements fromstations around the city differ based on populationdensity, firework discharge etc., with the PM10 in-crease tending to be highest in suburban areas (Wanget al. 2008).
Cities across China have adopted rather differentregulations with respect to the use of fireworks at NewYear. As noted by Li et al. (2006), who investigatedair pollution in Beijing during the spring festival overthe period 2000~2006, the intense use of fireworksover a short time created a serious air pollution prob-lem. There had been attempts at controlling the prob-lem since the 1990s, but from 2006, Beijing initiated apolicy that that allowed people to celebrate with fire-works, but restricting use from Chinese New Year’sEve to 24:00 the following day for locations withinthe 5th Ring Road. There was evidence of high pol-lutant concentrations across the city, although thisimproved with the adoption of regulations (Li et al.2006). Despite the attempt to alleviate high pollution
Fig. 4 PM2.5 and PM10 concentrations on the night of the NewYear 2015 (18:00–06:00) in Beijing (a, b), Tianjin (c, d) andShenzhen (e, f). The lines show trends in urban (long dashes),suburban (short dashes), outskirts (fine) and rural (bold) areas.Note: The data from Mainland China have no measurements inthe record at 22:00 (i.e. [21:00–22:00]), which is illustrated by agap in the individual plots
Environ Monit Assess (2017) 189: 467 Page 7 of 14 467

levels through time restrictions on the use of fire-works (Appendix Table 1), there is still much evi-dence of large concentrations of air pollutants, mostnotably particulate matter and sulphur dioxide acrossBeijing (as shown in Fig. 2).
Observations made across the hours immediatelybefore and after New Year 2015 in sites from Main-land China, Hong Kong and Taiwan are shown inFig. 6. The Wilcoxon signed-ranks test was used totest the difference at individual stations in givencities during the early morning peak [00:00–02:00]and the hours before and after ([22:00–24:00] and[02:00–05:00]), with results tabulated on the panes ofthe figure.
The profile of changing PM10 concentrations atindividual stations in Beijing for New Year’s Eveand the early morning of the New Year is shown inFig. 6a. It is clear that there is a widespread in-crease in the concentration of particulate matteracross the city in the early morning and a highsignificance revealed by the Wilcoxon test(p = 0.0036, as tabulated in Fig. 6a). As notedearlier, the changes are largest at stations remotefrom the city centre. Examining individual station
records suggests that Huairouzhen which lies be-yond the 6th Ring Road has concentrations thatappear to exceed 1000 μg m−3. Concentrations arealso high, in excess of 500 μg m−3, in two otherlocations: (i) Wanshouxigong in the BaizhifangResidential District in the southwest just inside the2nd Ring Road and (ii) Shunyixincheng in theShunyi District northeast of Beijing’s Capital Inter-national Airport. Thus, the very highest concentra-tions are often away from the centre of the city;early morning peaks are observed at all sites aroundthe city. Here, concentrations seem to be some250 μg m−3 above what might be expected wherethere were no contributions from fireworks in theconcentrations measured in the early hours of theNew Year (see the trend lines of Fig. 6a). Theattempt to regulate the times permissible for fire-works seems ineffective in keeping particulate con-centrations low. However, Beijing has started toinclude public displays at around midnight onNew Year’s Eve. High air concentrations duringthe celebrations of 2017 drew considerable com-ment, which may increase enthusiasm for such pub-lic displays.
Fig. 5 The PM10 concentrationsat individual stations in Xi’an onthe night of the New Year’s Eve(18:00–24:00) and the followingmorning (00:00–06:00) plotted asa map. The dark vertical linedenotes midnight and the numberdesignating of major roads areenclosed in rectangles
467 Page 8 of 14 Environ Monit Assess (2017) 189: 467

Chongqing (Fig. 6b) and Tianjin (Fig. 6c) have some-what similar policies to Beijing, restricting the time overwhich fireworks are permitted in the central parts of thecity (see Appendix Table 1). All sites show very pro-nounced peaks in PM10 concentrations in the earlymorning in Tianjin. Xi’an (Fig. 6d) has no fireworksban for Chinese New Year although typically fireworksshould not be used. As seen in Fig. 5, measurementsfrom of Xi’an show more variable profiles in PM10concentrations through the night, which may explainthe low statistical significance of these changes.Nevertheless, a peak in the PM10 concentrations isevident in the early morning for a number of sites, butthe concentrations are not especially high when com-pared to Beijing, Chongqing and Tianjin, but Xi’an is asmaller city. The changes in Shanghai (Fig. 6e) arerather small, with peaks suggesting the addition of only50–100 μg m−3 to early morning concentrations of
PM10, nevertheless, the early morning increase acrossthe city is significant (p = 0.005).
The cities of Chengdu and Shenzhen have bans incertain regions (Appendix Table 1). Chengdu (Fig. 6f)shows little evidence of a sharp morning peak in partic-ulate concentrations suggesting some success with theirregulation of pollution from fireworks. There was a gen-eral increase in pollution in this city on New Year’s Day(p = 0.02), but the early morning changes are small, onaverage only 15 μg m−3. Figure 6f makes a less convinc-ing case for a firework source in Chengdu compared withcities such as Beijing. In Shenzhen (Fig. 6g), it seems thatlong standing regulations are fairly effective suggestinglittle increase in PM10 concentrations, although in thecity, overall the peak in the early morning hours is sig-nificant (p = 0.0012). However, this arises from clearpeaks in particulate concentrations (Fig. 6g) associatedwith measurements made in: Kuiyong, Nanyou,
Fig. 6 Trends in PM10 concentrations at individual stations invarious urban areas on New Year’s Eve and the following morn-ing. This includes stations in cities that allow fireworks, althoughwith time restrictions in some cases: a Beijing, b Chongqing, cTianjin or d Xi’an, e Shanghai; those with historical restrictions incentral areas: f Chengdu, g Shenzhen and h Guangzhou or acomplete ban i Nanjing and those of j Hong Kong, k Taipei andl Kaohsiung. Notes: tick marks on the x-axis denote hours and the
small break and shift in the midnight line arises because the 22:00values are missing from records for Mainland China. The text oneach shows the two-tailed p value, the test statistic W and thenumber of sites n, which account for the difference at individualsites between measurements during the celebrations [00:00–02:00] and those before and afterwards ([22:00–24:00] and[02:00–04:00]).
Environ Monit Assess (2017) 189: 467 Page 9 of 14 467
Nan’au and perhaps less clearly Xixiang. These sites areall rather distant from the city centre, where controls arein force. Once these remote sites are removed, the signif-icance of Shenzhen’s early morning increase in PM10declines (i.e. p > 0.05). With the exception of theseremote sites, the impact of fireworks in Shenzhen appearsrelatively small compared with changes seen in Beijingand Tianjin. The main city of Guangdong Province,Guangzhou has permitted fireworks in suburban areas,although it has banned their use in central urban areassince 1992. Here, results suggest little clear contributionfrom fireworks, with early morning values or PM10being somewhat lower than other times (as shown bythe negative W statistic in Fig. 6g). Nanjing introducedstrict controls in 2015 and shows no evidence of a fire-work contribution to particulate matter (Fig. 6i) and asignificantly negative W statistic.
Outside the Chinese Mainland, Hong Kong(Fig. 6j) and the cities of Taiwan: Taipei (Fig.6k) and Kaohsiung (Fig. 6l), seem to reveallittle evidence of pollutants from fireworks.They perhaps hint at an effective reduction ofemissions. In Taiwan fireworks are allowed,although not necessarily used to a great extentor especially popular. There may be someincreases in early morning PM10 in Taipei andKaohsiung (p = 0.05, p = 0.04), but they remainsmall (Fig. 6k, l). Temple parades may still usethem although these are not primarily NewYear’s Eve activities. The use of fireworks isspread throughout the year, with just a fewtemples celebrating a midnight event at theNew Year (e.g. the God of War Temple in
Yanshui, Tainan City). A particular focus in Taiwanhas been the creation of a less polluting lantern festival,which is popular with tourists. The lanterns are oftenelectrical, thus reducing the potential for air pollution(see TB 2016).
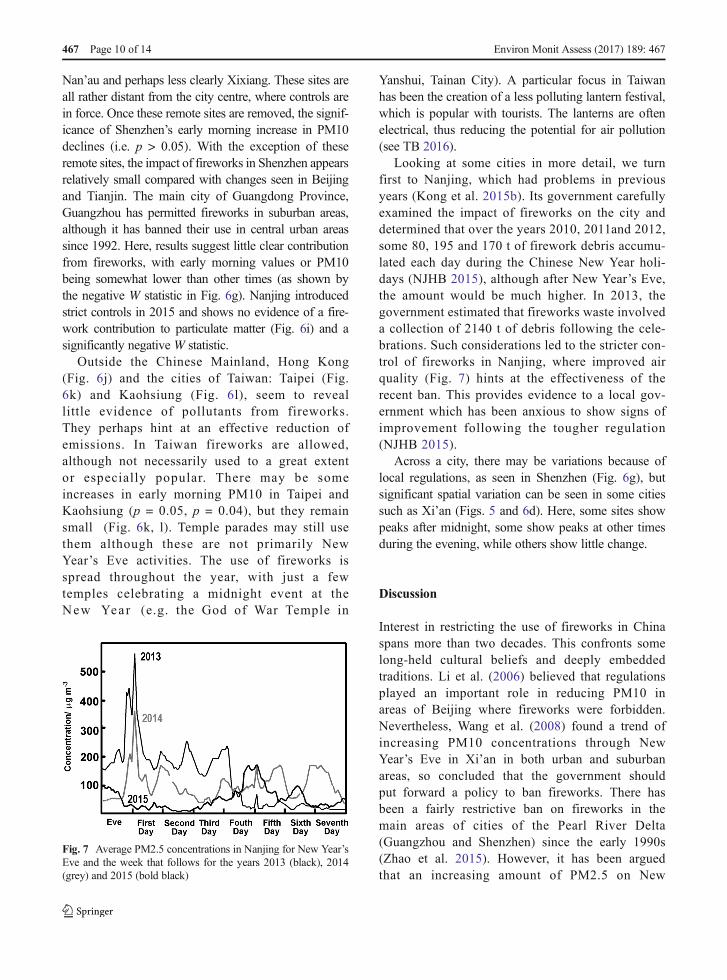
Looking at some cities in more detail, we turnfirst to Nanjing, which had problems in previousyears (Kong et al. 2015b). Its government carefullyexamined the impact of fireworks on the city anddetermined that over the years 2010, 2011and 2012,some 80, 195 and 170 t of firework debris accumu-lated each day during the Chinese New Year holi-days (NJHB 2015), although after New Year’s Eve,the amount would be much higher. In 2013, thegovernment estimated that fireworks waste involveda collection of 2140 t of debris following the cele-brations. Such considerations led to the stricter con-trol of fireworks in Nanjing, where improved airquality (Fig. 7) hints at the effectiveness of therecent ban. This provides evidence to a local gov-ernment which has been anxious to show signs ofimprovement following the tougher regulation(NJHB 2015).
Across a city, there may be variations because oflocal regulations, as seen in Shenzhen (Fig. 6g), butsignificant spatial variation can be seen in some citiessuch as Xi’an (Figs. 5 and 6d). Here, some sites showpeaks after midnight, some show peaks at other timesduring the evening, while others show little change.
Discussion
Interest in restricting the use of fireworks in Chinaspans more than two decades. This confronts somelong-held cultural beliefs and deeply embeddedtraditions. Li et al. (2006) believed that regulationsplayed an important role in reducing PM10 inareas of Beijing where fireworks were forbidden.Nevertheless, Wang et al. (2008) found a trend ofincreasing PM10 concentrations through NewYear’s Eve in Xi’an in both urban and suburbanareas, so concluded that the government shouldput forward a policy to ban fireworks. There hasbeen a fairly restrictive ban on fireworks in themain areas of cities of the Pearl River Delta(Guangzhou and Shenzhen) since the early 1990s(Zhao et al. 2015). However, it has been arguedthat an increasing amount of PM2.5 on New
Fig. 7 Average PM2.5 concentrations in Nanjing for New Year’sEve and the week that follows for the years 2013 (black), 2014(grey) and 2015 (bold black)
467 Page 10 of 14 Environ Monit Assess (2017) 189: 467

Year’s Eve can still be observed in suburban areasin these two cities.
Overall our results suggest that while in some citiesthe celebration of New Year brings a noticeable declinein air quality, but a number of other cities seem to havemade satisfying achievements in reducing the extent ofthe problem. The effectiveness of regulation might beexpected in Hong Kong and Taiwan, given their differ-ent approaches to governance. Nevertheless, some citieson the Mainland: Chengdu, Shenzhen and Guangzhou,and most recently Nanjing seem to have relatively goodair quality during the festivities. While a Nian culturestill survives, it appears that regulation may be possible.
The evidence of distinctive peaks in air pollutionfrom fireworks across individual cities can be variable,with the largest effects found at the outskirts, perhapssuggesting that regulations may be more relaxed at themargins. In cities where regulations are enforced, theevidence of fireworks activity in the PM10 concentra-tions seems to occur well away from the centre, such asin the more remote parts of Shenzhen, again evidence oflower concern well away from urban centres. Suchlocations might well benefit from considering the workof Mlakar et al. (2012) from Slovenia who make anargument for selecting areas for fireworks displays ac-cording to knowledge about air pollution dispersion.Although the focus here is on China, it suggests therelevance of regulation for other parts of the worldwhere fireworks are used at specific times such as USIndependence Day, Hindu Diwali (Perrino et al. 2011;Chatterjee et al. 2013) and Guy Fawkes celebrations ofEngland and some Commonwealth countries (Singhet al. 2015). The example from China may be lessrelevant to other places, such as Malta, where more than80 individual villages will use fireworks for local festi-vals, often on different days (Camilleri and Vella 2010).
Conclusion
The celebration of Chinese New Year is associatedwith loud noises, firecrackers, coloured lanterns and,in many cases, air pollution. The cities of Beijing,Chongqing, Tianjin and Shanghai, where fireworksare allowed albeit with time restrictions, show signif-icant (p < 0.05) peaks in the early hours of the NewYear and substantial increases in PM10 concentra-tions (> 25 μg m−3). Pollution, waste and safetyissues have seen regulatory pressures to restrict the
use of fireworks and change behaviour for a numberof years. Nanjing is particularly notable for its highair quality during the 2015 New Year, much im-proved over earlier years. To some extent, regulationshave been more successful at reducing an obviouspeak in particulate concentrations in the south ofChina. It may be because traditions are different, orthat traditions have changed. The differences mayalso reflect provincial differences in regulatory pro-cedures that could come apparent in a large country.
The desire to have celebrations that have a lowerimpact on air quality may well be achieved withoutentirely removing the celebratory nature of this im-portant event in the Chinese calendar. Taiwan hasbeen notable in promoting the event as more aboutlanterns than fireworks. Hong Kong has been consis-tent in adopting carefully controlled public displaysof fireworks and to restrict private use. They also toensure that those used are sourced to minimise pol-lution, not only in the air but also the deposition oftoxic materials to the environment. The Environmen-tal Protection Department analysis argues that BtheNational Day Fireworks Display and the New Year’sEve Pyrotechnic Show… last for a short durationinvolving high-altitude fireworks discharge abovethe sea.... This accounted for 0.1 per cent of HongKong's total emission of RSP in 2011^ (HKSAR2013). In the past, firework displays were more fre-quent over Hong Kong’s Victoria Harbour. Nowthere is a celebration of the city each evening with astunningly orchestrated display of lights on the majortall buildings of Hong Kong Island combined withbeams from moveable searchlights and lasers. Thus,there is almost no potential for enhanced particulateemissions. Environmental regulation routinely limitsthe freedom of choices available to individuals, butthe celebration of Chinese New Year may still bewidely enjoyed even when restrictions on the use offireworks are enforced.
Acknowledgements In a paper with such wide ranging cul-tural considerations, we needed advice from a number ofpeople who were most willing to share their thoughts, partic-ularly: Winnie Lo on Hong Kong, Joseph Lee on Taiwan andKatie Chang on celebrations in Xi’an. Nicky Lam, Keith Nganand Wen Zhou provided meteorological insight. The work herereceived support from the City University of Hong Kong(Project No. 9380071) and benefitted from the NERC grantto the University of East Anglia INHANCE APHH Chinaprogramme (No. NE/N00714X/1).
Environ Monit Assess (2017) 189: 467 Page 11 of 14 467

Appendix
Open Access This article is distributed under the terms of theCreative Commons Attribution 4.0 International License (http://creativecommons.org/licenses/by/4.0/), which permits unrestrict-ed use, distribution, and reproduction in any medium, providedyou give appropriate credit to the original author(s) and the source,provide a link to the Creative Commons license, and indicate ifchanges were made.
References
Bhatnagar, S., & Dadhich, S. (2015). Measurement of airborneparticulate matter concentration levels in the ambient atmo-sphere. Journal of Energy Research and EnvironmentalTechnology, 2, 12–13.
Brimblecombe, P. (1987). The big smoke. London: Routledge.Butenhoff, C. L., Khalil, M. A. K., Porter, W. C., Al-Sahafi, M. S.,
Almazroui,M., &Al-Khalaf, A. (2015). Evaluation of ozone,nitrogen dioxide, and carbon monoxide at nine sites in Saudi
Arabia during 2007. Journal of the Air &WasteManagementAssociation, 65(7), 871–886.
Camilleri, R., & Vella, A. J. (2010). Effect of fireworks on ambientair quality in Malta. Atmospheric Environment, 44(35),4521–4527.
Cao, L. (2014). The study on the impacts of setting off firecrackersto air quality during the spring festival in Wuxi city(Chinese). Pollution Control Technology, 27(3), 5–9.
Cerro, J. C., Cerda, V., & Pey, J. (2014). Trends of air pollution inthe Western Mediterranean Basin from a 13-year database: aresearch considering regional, suburban and urban environ-ments in Mallorca (Balearic Islands). AtmosphericEnvironment, 103, 138–146.
Chang, S. C., Lin, T. H., Young, C. Y., & Lee, C. T. (2011). Theimpact of ground-level fireworks (13 km long) display on theair quality during the traditional Yanshui Lantern Festival inTaiwan. Environmental Monitoring and Assessment, 172(1),463–479.
Chao, Y., Chen, R., & Young, C. (2014). Nian: when Chinesemythology affects air pollution. The Lancet, 383(9935),2125.
Table 1 Regulations regarding fireworks for cities discussed inthis study. Note: the populations in column 1 are as millions andare for the year 2015 except for Chengdu, Guangzhou, Shenzhen
and Hong Kong (2014) and Taipei and Kaohsiung (2016) and thevalues are for urban except Xi’an (sub-provincial city), Shanghai(municipality), Nanjing and Hong Kong (total)
City Regulation Reference
Beijing18.5M
Since 2006, the Beijing Government limited firework use, but allows themwithin the fifth ring road (on the Chinese New Year’s Eve until midnight.
http://news.sina.com.cn/s/2005-09-09/15516904684s.shtml
Chongqin18.38M
Government allows fireworks on the NewYear’s Eve until 01:00 the followingmorning.
http://cq.bendibao.com/jieri/2015115/51818.shtm
Tianjin12.78M
Tianjin fireworks safety management approach: people can use fireworks inmain areas on the New Year’s Eve until 02:00 the following morning.
http://m.9tour.cn/info/info_29122.html
Xi’an 8.7M No strict regulations that ban so they can be used from New Year’s Eve to thefifteen day of Chinese calendar.
http://xa.bendibao.com/news/201526/50241.shtm
Chengdu10.15M
In 2015, government issued new regulations banning the use of fireworks in allmain areas within three ring roads .
http://chuansong.me/n/1161145
Shanghai24.15M
In some areas fireworks are prohibited, but still allowed in part of central areas.. http://sh.people.com.cn/n/2015/0209/c134768-23847311.html
Shenzhen10.63M
Since 2014, Government issued a strict policy that bans people to burnfireworks in all main areas during CNY.
http://sz.ce.cn/sy/gd/201501/30/t20150130_2015202.shtml
Guangzhou11.26M
Since 1992, the government has banned the use of fireworks during springfestival in central urban areas, but are permitted in suburban areas.
http://opinion.cntv.cn/2014/01/12/ARTI1389484934462287.shtml
Nanjing8.23M
Since 2015, a strict policy bans the use of fireworks in most areas. http://nj.bendibao.com/jieri/2015211/51532.shtm
Hong Kong7.23M
Public displays of environmentally friendly fireworks well established http://www.info.gov.hk/gia/general/201302/20/P201302200272.htm
Taipei 8.50 Normally 08:00–22:00 but waived for New Year’s Eve and the first day of theNew Year.
http://bepo.ctitv.com.tw/2016/02/24151/
Kaohsiung2.54
Kaohsiung, Normally 06:00–23:00, but waived for New Year’s Eve and thefirst day of the New Year
http://www.appledaily.com.tw/appledaily/article/headline/20110831/33634693/
467 Page 12 of 14 Environ Monit Assess (2017) 189: 467

Chatterjee, A., Sarkar, C., Adak, A., Mukherjee, U., Ghosh, S. K.,& Raha, S. (2013). Ambient air quality during DiwaliFestival over Kolkata—a mega-city in India. Aerosol andAir Quality Research, 13, 1133–1144.
Chen, X., Liu, Z., & Wu, P. L. (2014). Analysis on Chinese urbanair quality Bspring festival effect^: Evidence from 31 keycities in China (Chinese). Statistics & Information Forum.,29, 57–62.
Cheng, N. L., Chen, T., Zhang, D. W., Li, Y. T., Sun, F., Wei, Q.,Liu, J. L., Liu, B. X., & Sun, R. W. (2015). Air qualitycharacteristics in Beijing during spring festival in 2015(Chinese). Environmental Sciences, 36, 3150–3158.
Drewnick, F., Hings, S. S., Curtius, J., Eerdekens, G., &Williams,J. (2006). Measurement of fine particulate and gas-phasespecies during the new Year's fireworks 2005 in Mainz,Germany. Atmospheric Environment, 40(23), 4316–4327.
Feng, J., Yu, H., Su, X., Liu, S., Li, Y., Pan, Y., & Sun, J.-H.(2016). Chemical composition and source apportionment ofPM2.5 during Chinese Spring Festival at Xinxiang, a heavilypolluted city in North China: fireworks and health risks.Atmospheric Research, 182, 176–188.
Gong, D. Y., Wang, W., Qian, Y., Bai, W., Guo, Y., & Mao, R.(2014). Observed holiday aerosol reduction and temperaturecooling over East Asia. Journal of Geophysical Research –Atmospheres, 119, 6306–6324.
Henschel, S., Tertre, A. L., Atkinson, R. W., Querol, X., Pandolfi,M., Zeka, A., Haluza, D., Analitis, A., Katsouyanni, K.,Bouland, C., Pascal, M., Medina, S., & Goodman, P. G.(2015). Trends of nitrogen oxides in ambient air in nineEuropean cities between 1999 and 2010. AtmosphericEnvironment, 117, 234–241.
HKSAR (2013). Impacts of fireworks on air quality TheGovernment of the Hong Kong Special AdministrativeRegion. http://www.info.gov.hk/gia/general/201302/20/P201302200272.htm. Accessed 18 Aug 2017.
Huang, K., Zhuang, G., Lin, Y., Wang, Q., Fu, J. S., Zhang, R., Li,J., & Deng, F.,. Q. (2012). Impact of anthropogenic emissionon air quality over a megacity -revealed from an intensiveatmospheric campaign during the Chinese Spring Festival.Atmospheric Chemistry and Physics, 12, 11631–11645.
Huryn, S. M., & Gough, W. A. (2014). Impact of urbanization onthe ozone weekday/weekend effect in Southern Ontario,Canada. Urban Climate, 8, 11–20.
Jimenez, P., Parra, R., Gasso, S., & Baldasano, J. M. (2005).Modeling the ozone weekend effect in very complex terrains:a case study in the Northeastern Iberian Peninsula.Atmospheric Environment, 39, 429–444.
Kong, S. F., Li, L., Li, X. X., Yin, Y., Chen, K., Liu, D. T., Yuan,L., Zhang, Y. J., Shan, Y. P., & Ji, Y. Q. (2015a). The impactsof firework burning at the Chinese Spring Festival on airquality: insights of tracers, source evolution and aging pro-cesses. Atmospheric Chemistry and Physics, 15(4), 2167–2184.
Kong, S., Li, X., Li, L., Yin, Y., Chen, K., Yuan, L., Zhang, Y.,Shan, Y., & Ji, Y. (2015b). Variation of polycyclic aromatichydrocarbons in atmospheric PM2.5 during winter haze pe-riod around 2014 at Nanjing: Insights of source changes, airmass direction and firework particle injection. Science of theTotal Environment, 520, 59–72.
Lei, Y., Zhang, X. L., Tang, Y. X., Fan, G. Z., & Zhou, D. W.(2015). Holiday effects on PM2.5 and other major pollutants
in Beijing (Chinese). Acta Scientiae Circumstantiae, 35(5),1520–1528.
Levy, I. (2013). A national day with near zero emissions and itseffect on primary and secondary pollutants. AtmosphericEnvironment, 77, 202–212.
Li, L. J., Li, J. X., Xin, L. Z., Li, H. J., &Wei, Q. (2006). Analysisof atmospheric air pollution of Beijing City in SpringFestival period (Chinese). China Environmental Science,26(5), 537–541.
Liu, B., Bi, X., Feng, Y., Dai, Q., Xiao, Z., Li, L., Wu, J., Yuan, J.,& Zhang, Y. (2016). Fine carbonaceous aerosol characteris-tics at a megacity during the Chinese Spring Festival as givenby OC/EC online measurements. Atmospheric Research,181, 20–28.
Mlakar, P., Božnar, M. Z., Grašič, B., & Popović, D. (2012).Fireworks air pollution in Slovenia. International Journalof Environment and Pollution, 50(1/2/3/4), 31–40.
Moreno, T., Querol, X., Alastuey, A., Amato, F., Pey, J., Pandolfi,M., Kuenzli, N., Bouso, L., Rivera, M., & Gibbons, W.(2010). Effect of fireworks events on urban background tracemetal aerosol concentrations: is the cocktail worth the show?Journal of Hazardous Materials, 183, 945–949.
Mosteller, F., Robert, E. K., & Rourke, R. E. K. (1973). Sturdystatistics: nonparametrics and order statistics. Reading:Addison-Wesley Educational Publishers Inc.
NJHB (2015). Why appeal to limit the use of firecrackers (inChinese). http://www.njhb.gov.cn/43188/jfyhbz/jfdt/201502/t20150210_3194637.html. Accessed 18 Aug 2017.
Perrino, C., Tiwari, S., Catrambone, M., Torre, S. D., Rantica, E.,& Canepari, S. (2011). Chemical characterization of atmo-spheric PM in Delhi, India, during different periods of theyear including Diwali festival. Atmospheric PollutionResearch, 2, 418–427.
Qin, Y., Tonnesen, G. S., & Wang, Z. (2004). Weekend/weekdaydifferences of ozone, NOx, CO, VOCs, PM10 and the lightscatter during ozone season in southern California.Atmospheric Environment, 38, 3069–3087.
Ravindra, K., Mor, S., & Kaushik, C. P. (2003). Short-term vari-ation in air quality associated with firework events: a casestudy. Journal of Environmental Monitoring, 5(2), 260–264.
Riga-Karandinos, A. N., & Saitanis, C. (2005). Comparative as-sessment of ambient air quality in two typical Mediterraneancoastal cities in Greece. Chemosphere, 59, 1125–1136.
RV (2015). Yellow dust from China blows into South Korea,Reuters Video February 23, 2015. http://www.reuters.com/video/2015/02/23/yellow-dust-from-china-blows-into-south?videoId=363275101. Accessed 18 Aug 2017.
Seidel, D. J., & Birnbaum, A. N. (2015). Effects of IndependenceDay fireworks on atmospheric concentrations of fine partic-ulate matter in the United States. Atmospheric Environment,115, 192–198.
Shen, Z., Cao, J., Arimoto, R., Han, Z., Zhang, R., Han, Y., Liu, S.,Okuda, T., Nakao, S., & Tanaka, S. (2009). Ionic composi-tion of TSP and PM 2.5 during dust storms and air pollutionepisodes at Xi’an, China. Atmospheric Environment, 43(18),2911–2918.
Sijimol, M. R., & Mohan, M. (2014). Environmental impacts ofperchlorate with special reference to fireworks—a review.Environmental Monitoring and Assessment, 186(11), 7203–7210.
Environ Monit Assess (2017) 189: 467 Page 13 of 14 467

Singh, A., Bloss, W. J., & Pope, F. D. (2015). Remember, remem-ber the 5th of November; gunpowder, particles and smog.Weather, 70(11), 320–324.
Stein, A. F., Draxler, R. R., Rolph, G. D., Stunder, B. J. B., Cohen,M. D., & Ngan, F. (2015). NOAA’s HYSPLIT atmospherictransport and dispersion modeling system. Bulletin of theAmerican Meteorological Society, 96, 2059–2077.
Sterba, J. H., Steinhauser, G., & Grass, F. (2013). Illicit utilizationof arsenic compounds in pyrotechnics? An analysis of thesuspended particle emission during Vienna’s New Year fire-works. Journal of Radioanalytical and Nuclear Chemistry,296, 237–243.
SYCCA (2011). Statistical yearbook of China’s CivilAdministration (中国民政统计年鉴) (in Chinese), ChinaStatistical Press, Beijing.
Tan, P.-H., Chou, C., Liang, J.-Y., Chou, C. C.-K., & Shiu, C. J.(2009). Air pollution Bholiday effect^ resulting from theChinese New Year. Atmospheric Environment, 43, 2114–2124.
Tang, W. Y., Zhao, C. S., Geng, F. H., Peng, L., Zhou, G. Q., Gao,W., Xu, J. M., & Tie, X. X. (2008). Study of ozone Bweekendeffect^ in Shanghai. Science in China Series D: EarthSciences, 51(9), 1354–1360.
TB (2016). Taiwan Lantern Festival Heart of Asia, TourismBureau, Republic of China (Taiwan) https://www.eventaiwan.tw/cal_en/cal_19955. Accessed 18 Aug 2017.
Tsai, H.-H., Chien, L.-H., Yuan, C.-S., Lin, Y.-C., Jen, Y.-H., & Ie,I.-R. (2012). Influences of fireworks on chemical character-istics of atmospheric fine and coarse particles duringTaiwan’s Lantern Festival. Atmospheric Environment, 62,256–264.
Tsai, Y. I., Sopajaree, K., Kuo, S.-C., & Yu, S.-P. (2015). PotentialPM2.5 impacts of festival-related burning and other inputs onair quality in an urban area of southern Taiwan. Science of theTotal Environment, 527-528, 65–79.
Wang, Y., Zhuang, G., Xu, C., & An, Z. (2007). The air pollutioncaused by the burning of fireworks during the lantern festivalin Beijing. Atmospheric Environment, 41(2), 417–431.
Wang, F. Q., Cai, X. L., & Zhou, A. S. (2008). Effect of firecrackersetting-off on the PM10 and SO2 and NO2 in Xian(Chinese). Journal of Safety and Environment, 8(1), 82–86.
Wang, Z., Li, Y., Chen, T., Zhang, D., Sun, F., Wei, Q., Dong, X.,Sun, R., Huan, N., & Pan, L. (2015). Ground-level ozone inurban Beijing over a 1-year period: temporal variations andrelationship to atmospheric oxidation. AtmosphericResearch, 164-165, 110–117.
Wong, C. S. 1967. A cycle of Chinese festivities. Singapore:Malaysia Publishing House Singapore.
XEN (2011). Xi'an Evening News (西安晚报) 25 May 2011 (inChinese), p. 3.
Yan, M. (2011). Effect of firecrackers during spring festival on airin Nanning City (Chinese). Sichuan Environment., 30(6), 53–56.
Yang, L., Gao, X., Wang, X., Nie, W., Wang, J., Gao, R., Xu, P.,Shou, Y., Zhang, Q., & Wang, W. (2014). Impacts of fire-cracker burning on aerosol chemical characteristics and hu-man health risk levels during the Chinese New Year celebra-tion in Jinan, China. Science of the Total Environment, 476,57–64.
Ye, C., Chen, R., &Chen,M. (2016). The impacts of ChineseNianculture on air pollution. Journal of Cleaner Production 112,1740–1745.
Zhang, M., Wang, X., Chen, J., Cheng, T., Wang, T., Yang, X.,Gong, Y., Geng, F., & Chen, C. (2010). Physical characteri-zation of aerosol particles during the Chinese New Year’sfirework events. Atmospheric Environment, 44(39), 5191–5198.
Zhao, S., Yu, Y., Yin, D., Liu, N., & He, J. (2014). Ambientparticulate pollution during Chinese Spring Festival in urbanLanzhou, Northwestern China. Atmospheric PollutionResearch, 5(2), 335–343.
Zhao, W., Fan, S., Xie, W. Z., & Sun, J. R. (2015). Influence ofburning fireworks on air quality during the Spring Festival inthe Pearl River Delta (Chinese). Environmental Sciences,36(12), 4358–4365.
Zhou, B.-H., Zhang, C.-Z., & Wang, G.-H. (2013). Study onpollution characteristics of carbonaceous aerosols in Xi'ancity during the spring festival. Huanjing Kexue/Environmental Science, 34(2), 448–454.
467 Page 14 of 14 Environ Monit Assess (2017) 189: 467