model forecasting report
TRANSCRIPT

North Hampshire Transport Model 2019 Model Forecasting Report
Hampshire County Council
24 June 2021
Model Forecasting Report | 1.0 | 24 June 2021 Atkins | NHTM19 Forecasting Report_24June2021 Page 2 of 115
Notice
This document and its contents have been prepared and are intended solely as information for Hampshire County Council and use in relation to Model Forecasting.
Atkins Limited assumes no responsibility to any other party in respect of or arising out of or in connection with this document and/or its contents.
This document has 115 pages including the cover.
Document history Document title: Model Forecasting Report
Document reference: Model Forecasting Report
Revision Purpose description Originated Checked Reviewed Authorised Date
Rev v1.3 First Draft submission
RM MF BV RM TG, AA, CS
AEA 03.11.2020
Rev 2.0 Updated following HCC Comments
MF AEA TJG AEA 07.06.2021
Rev 3.0 Updated following HCC Comments
RM SDG AEA 24.06.2021
Client signoff
Client Hampshire County Council
Project North Hampshire Transport Model 2019
Job number 5199550
Client signature/date

Model Forecasting Report | 1.0 | 24 June 2021 Atkins | NHTM19 Forecasting Report_24June2021 Page 3 of 115
Contents
Chapter Page
1. Introduction 8
Report Structure 8
2. Forecasting Approach 9
NHTM19 Base Model Overview 9 Forecasting Scenario 14 Forecasting Approach 14
3. DM Scenario Input Assumptions 16
Introduction 16 Development Sites 16 Highway Schemes Included in the Forecast Network 17 Public Transport Schemes Included in Forecast Network 19 Walk and cycle 20
4. Forecast Network Coding 21
Values of Time and Vehicle Operating Costs 21 Public Transport Fares and Parking Charges 21 Network Coding 22 Updating Bus Run Times 23
5. Future Travel Demand Assumptions 24
Land Use and Trip End Assumptions 24 Goods Vehicles and Car External-External Trips 28
6. Forecast Travel Demand 31
Introduction 31 Trip Matrices 31 Mode Shares 31 Trip Lengths 37 Park & Ride 37 Impact of Public Transport Fares 37
7. Traffic Forecasts 39
Introduction 39 Highway Assignment 39 Public Transport Assignment Outputs 72 Rail Park & Ride 80 VDM convergence 80
8. Summary 81
Summary of the Local Plan Scenario 81 Forecast Travel Demand 81 Assignment Results 82 Going Forward 83
Appendices 84
Appendix A. All Developments Sites 85

Model Forecasting Report | 1.0 | 24 June 2021 Atkins | NHTM19 Forecasting Report_24June2021 Page 4 of 115
A.1. Basingstoke & Deane: Do Minimum Development Sites 85
Appendix B. Highway scheme layouts 89
B.1. Thornycroft Roundabout 89 B.2. Brighton Hill Roundabout & Camrose Link 90 B.3. M3 J9 to J14 91 B.4. N Manydown - West Ham Roundabout 92 B.5. N Manydown - Buckskin Roundabout 93 B.6. N Manydown - Old Kempshott Labe 94 B.7. N Manydown - Roman Way Roundabout 95
Appendix C. Coding details of each development site 96
C.1. Do Minimum Development Site Coding 96
Appendix D. Land Use Assumption Comparison with NTEM 7.2 97
D.1. Introduction 97 D.2. Households Comparison 97 D.3. Jobs Comparison 98 D.4. Workers vs Jobs 98
Appendix E. Delay per kilometre 99
E.1. AM 2019 Base Year 99 E.2. AM 2040 Do Minimum 99 E.3. IP 2019 Base Year 100 E.4. IP 2040 Do Minimum 100 E.5. PM 2019 Base Year 101 E.6. PM 2040 Do Minimum 101
Appendix F. Flow differences 102
F.1. AM – 2040 DM vs 2019 Base Year AODM 102 F.2. IP – 2040 DM vs 2019 Base Year AODM 102 F.3. PM – 2040 DM vs 2019 Base Year AODM 103
Appendix G. Flow bundles for all development sites 104
G.1. 2040 Do Minimum Development Site Flow Bundles 104
Appendix H. Link V/C ratios in the AoDM 105
H.1. AM 2019 Base Year 105 H.2. AM 2040 Do Minimum 105 H.3. IP 2019 Base Year 106 H.4. IP 2040 Do Minimum 106 H.5. PM 2019 Base Year 107 H.6. PM 2040 Do Minimum 107
Appendix I. Turn V/C ratios in the AoDM 108
I.1. AM 2019 Base Year 108 I.2. AM 2040 Do Minimum 108 I.3. IP 2019 Base Year 109 I.4. IP 2040 Do Minimum 109 I.5. PM 2019 Base Year 110 I.6. PM 2040 Do Minimum 110
Appendix J. Link delays in AoDM 111
J.1. AM 2040 Do Minimum vs. 2019 Base Year 111 J.2. IP 2040 Do Minimum vs. 2019 Base Year 111

Model Forecasting Report | 1.0 | 24 June 2021 Atkins | NHTM19 Forecasting Report_24June2021 Page 5 of 115
J.3. PM 2040 Do Minimum vs. 2019 Base Year 112
Appendix K. Change in link speed in AoDM 113
K.1. AM 2040 Do Minimum vs. 2019 Base Year 113 K.2. IP 2040 Do Minimum vs. 2019 Base Year 113 K.3. PM 2040 Do Minimum vs. 2019 Base Year 114
Tables Table 2-1 – Geographical coverage and model functionality by area type 9
Table 2-2 – NHTM19 Trip Purposes 13
Table 2-3 - Segmentation (for each car availability status) 13
Table 2-4 - Number of demand strata for each trip purpose 13
Table 3-1 – Do Minimum Sites with >500 dwellings or jobs, with Windfall Sites 16
Table 3-2 – Committed highway schemes development log 17
Table 3-3 - Highway schemes identified in Section 278 18
Table 3-4 – Public Transport schemes identified from transport assessments 19
Table 4-1 - VoT / VOC values - AM Peak 2040 21
Table 4-2 - VoT / VOC values - Inter Peak 2040 21
Table 4-3 - VoT / VOC values - PM Peak 2040 21
Table 4-4 – Rail Fare Index (Constant Prices, GB) 22
Table 4-5 – Bus Fare Index (Constant Prices, GB) 22
Table 4-6 – Bus runtime factor to convert HAM link time to PTAM bus run time 23
Table 5-1 - Development totals provided by BDBC 24
Table 5-2 – Population vs Jobs Growth in B&D based on provided Developments and NTEM Trends 24
Table 5-3 – NTEM / Census JTW Baseline Assumptions vs NHTM Internal Area Scenario Assumptions 25
Table 5-4 – Base Year vs Scenario Productions by Purpose 25
Table 5-5 - DM: New School Development in North Manydown 27
Table 5-6 - Districts developed for applying DfT RTF growth rates 28
Table 5-7 - Classification of trips between districts used for applying DfT RTF growth rates 29
Table 5-8 - DfT RTF Derived Growth Rates (2019-2040) by Road Type by Vehicle Type 30
Table 6-1 – BY vs DM: Daily P/A Trips by Purpose by Mode 31
Table 6-2 – DM: Mode Share by Purpose, Comparison to Base Year 32
Table 6-3 – DM: 24-hour Production Mode Shares by Sector, Comparison to Base Year, All Purposes 33
Table 6-4 – DM: 24-hour Attraction Mode Shares by Sector, Comparison to Base Year, All Purposes 34
Table 6-5 – DM vs BY: Average Trip Length by Purpose by Mode 37
Table 6-6 - DM vs BY: Rail P&R Patronage by Purpose 37
Table 6-7 – PT Fare Sensitivity Test: Mode Shares by Purpose 38
Table 6-8 – DM to Base Year: Mode Share Difference by Purpose 38
Table 7-1 – Matrix Totals: AM Peak hour (08:00 to 09:00) 39
Table 7-2 – Matrix Totals: Inter-peak average hour (10:00 to 16:00) 39
Table 7-3 – Matrix Totals: PM Peak hour (17:00 to 18:00) 40
Table 7-4 – Sector based Car matrix totals 40
Table 7-5 - Overall network statistics 41

Model Forecasting Report | 1.0 | 24 June 2021 Atkins | NHTM19 Forecasting Report_24June2021 Page 6 of 115
Table 7-6 - AM Peak - Network Statistics 41
Table 7-7 - Inter Peak - Network Statistics 42
Table 7-8 - PM Peak - Network Statistics 42
Table 7-9 – Delay per vehicle kilometre (seconds) 44
Table 7-10 – Length of Road with VC ratio >85% (kilometres) 45
Table 7-11 - AM 2040 Do Minimum - Screenline flow differences 47
Table 7-12 – Inter-peak 2040 Do Minimum - Screenline flow differences 47
Table 7-13 – PM Peak 2040 Do Minimum - Screenline flow differences 48
Table 7-14 – 2040 Do Minimum compared to 2019 Base Year- Key link traffic flows 49
Table 7-15 - Change in traffic flows between the 2019 Base Year and 2040 Do Minimum 52
Table 7-16 – Development site flow bundles 53
Table 7-17 – Link Speeds (kph) by Road Type and Area 65
Table 7-18 - Journey Times on Key Routes - AM Peak 68
Table 7-19 - Journey Times on Key Routes – Inter-peak 69
Table 7-20 - Journey Times on Key Routes – PM Peak 70
Table 7-21 - Link Convergence for 2040 Do Minimum model 71
Table 7-22 – Link Flow Convergence for 2040 Do Minimum model 72
Table 7-23 – Matrix Totals: AM Peak hour (08:00 to 09:00) 72
Table 7-24 – Matrix Totals: Inter-peak average hour (10:00 to 16:00) 73
Table 7-25 – Matrix Totals: PM Peak hour (17:00 to 18:00) 73
Table 7-26 – Sector based PuT matrix totals 73
Table 7-27 – Outbound public transport development trips 74
Table 7-28 – Public Transport Network Statistics 74
Table 7-29 – Rail Station Entries 75
Table 7-30 – Rail Station Exits 75
Table 7-31 – Bus cordon flows 78
Table 7-32 – Bus terminal boardings 78
Table 7-33 – P&R Patronage 80
Table 7-34 – DM: Change in Trips Penultimate and Final Iteration of VDM, by Purpose and Mode 80
Table D-1 - NTEM vs Do Minimum: Sectored 2019-2040 Growth for Households, Population, Workers 98
Table D-2 - NTEM vs Do Minimum: Sectored 2019-2040 Growth for Jobs 98
Figures Figure 2-1 - NHTM19 Model Areas 10
Figure 2-2 - NHTM19 Zones Basingstoke 11
Figure 2-3 - NHTM19 Zones AoDM 11
Figure 2-4 - NHTM19 Zones Rest of UK 12
Figure 2 -5 – Overall Model Forecasting Operation 14
Figure 2-6 - Choice Model Hierarchy 15
Figure 3-1 - Development sites: Do Minimum housing and employment sites provided by BDBC17
Figure 3-2 – Public Transport Forecast Schemes 19
Figure 5-1 - DM vs BY: Change in Total Productions, with DM Housing Developments 26
Figure 5-2 - DM vs BY: Change in Total Output Trip Attractions 27

Model Forecasting Report | 1.0 | 24 June 2021 Atkins | NHTM19 Forecasting Report_24June2021 Page 7 of 115
Figure 6-1 - DM vs BY: Change in % Car Mode Share, 24-hour Productions, All Purposes 35
Figure 6-2 - DM vs BY: Change in % PT Mode Share, 24-hour Productions, All Purposes 36
Figure 6-3 - DM vs BY: Change in % Active (Cycle & Walk) Mode Share, 24-hour Productions, All Purposes 36
Figure 7-1 - NHTM Link Road Type 43
Figure 7-2 - Screenlines and Cordons 46
Figure 7-3 - AM - 2040 Do Minimum compared with 2019 Base Year 50
Figure 7-4 - IP - 2040 Do Minimum compared to 2019 Base Year 50
Figure 7-5 - PM - 2040 Do Minimum compared to 2019 Base Year 51
Figure 7-6 – 2040 Do Minimum development flow and site locations 52
Figure 7-7 - Flow Bundle 2040 Do Minimum North Manydown AM Origin trips 53
Figure 7-8 - Flow Bundle 2040 Do Minimum North Manydown AM Destination trips 54
Figure 7-9 - AM 2019 Base Year Links V/C Ratios 55
Figure 7-10 - AM 2040 Do Minimum Links V/C Ratios 55
Figure 7-11 - IP 2019 Base Year Links V/C Ratios 56
Figure 7-12 - IP 2040 Do Minimum Links V/C Ratios 56
Figure 7-13 - PM 2019 Base Year Links V/C Ratios 57
Figure 7-14 - PM 2040 Do Minimum Links V/C Ratios 57
Figure 7-15 - AM 2019 Base Year Turn V/C Ratios 58
Figure 7-16 - AM 2040 Do Minimum Turn V/C Ratios 59
Figure 7-17 - IP 2019 Base Year Turn V/C Ratios 59
Figure 7-18 - IP 2040 Do Minimum Turn V/C Ratios 60
Figure 7-19 - PM 2019 Base Year Turn V/C Ratios 60
Figure 7-20 - PM 2040 Do Minimum Turn V/C Ratios 61
Figure 7-21 - AM - 2040 Do Minimum Link Delay compared to 2019 Base Year 62
Figure 7-22 - IP - 2040 Do Minimum Link Delay compared to 2019 Base Year 63
Figure 7-23 - PM - 2040 Do Minimum Link Delay compared to 2019 Base Year 64
Figure 7-24 – Link Speed – AM 2040 Do Minimum compared to 2019 Base Year 66
Figure 7-25 - Link Speed – IP 2040 Do Minimum compared to 2019 Base Year 66
Figure 7-26 - Link Speed – PM 2040 Do Minimum compared to 2019 Base Year 67
Figure 7-27 – Rail AM - 2040 DM vs 2019 Base Year 77
Figure 7-28 – Rail PM - 2040 DM vs 2019 Base Year 77
Figure 7-29 – Bus AM - 2040 DM vs 2019 Base Year 79
Figure 7-30 – Bus PM - 2040 DM vs 2019 Base Year 79

Model Forecasting Report | 1.0 | 24 June 2021 Atkins | NHTM19 Forecasting Report_24June2021 Page 8 of 115
1. Introduction The North Hampshire Transport Model (NHTM) was originally developed in 2013 and HCC recognised that it is approaching a point where an update is required in order to ensure it continues to meet relevant standards and best practice.
With this in mind, Hampshire County Council (HCC) commissioned Atkins, as its Strategic Partner, to undertake the upgrade and development of a multi-modal transport model using the latest version of the Visum software suite. The model was developed in 2019 and covers Andover in the west and Fleet in the east, with Basingstoke at the centre. The model, now called NHTM19 includes Highway Assignment Model (HAM), Public Transport Assignment Model (PTAM) along with a Variable Demand Model (VDM) component. The Local Model Validation Report (LMVR) was issued to HCC on 6th July 2020.
This Forecasting Report details the development of 2040 forecast year model.
Report Structure The remainder of this report is structured as follows:
Chapter 2 – provides an overview of the forecasting approach;
Chapter 3 – details the model inputs in terms of demand and supply;
Chapter 4 – discusses the development of the future year networks;
Chapter 5 – details the development of the future year trip matrices;
Chapter 6 – describes VDM overall forecasts;
Chapter 7 and 8– present an overview of the key highway and public transport impacts; and
Chapter 8 – concludes with a summary and the way forward.

Model Forecasting Report | 1.0 | 24 June 2021 Atkins | NHTM19 Forecasting Report_24June2021 Page 9 of 115
2. Forecasting Approach
This chapter provides an overview of the process adopted to develop the 2040 forecasts, including the modelling of future highway and public transport schemes, developments and constraint to National Trip End Model (NTEM) dataset version 7.2 trip end growth for areas outside the Basingstoke and Dean District Council (BDBC) area. First, headline of the NHTM19 are described.
NHTM19 Base Model Overview The NHTM19 base model is formed of the below model areas with different functionality -
Internal: Area of detailed modelling (AoDM);
External: Area of Less Detailed Modelling (AoLDM); and
Wider External Area.
Table 2-1 below gives details of the model functionality by area type, and Figure 2-1 shows the extent of each area.
Table 2-1 – Geographical coverage and model functionality by area type
Area type Areas Covered HAM PTAM Demand Model
Internal: Area of detailed modelling (AoDM)
Basingstoke & Deane, plus Andover, Fleet and Hook.
This is the area over which significant impacts of interventions are certain and the modelling detail in this area would be characterised by: representation of all trip movements; small zones; very detailed networks; and junction modelling using Intersection Capacity Analysis (ICA);
PT network representing all rail and bus services routeing through the areas.
All trips generated in this area are represented in the model, with full choice of mode and destination, including external areas.
External: Area of Less Detailed Modelling (AoLDM)
In Full: West Berkshire; Reading; Rushmoor.
In Part: South Oxfordshire; Windsor & Maidenhead; Bracknell Forest; Surrey Heath; Guildford; Waverley; East Hampshire; Winchester; Test Valley; Wiltshire.
Area over which the impacts of interventions are considered to be quite likely, but relatively weak in magnitude and would be characterised by: representation of all trip movements; somewhat larger zones and less network detail than for the Area of Detailed Modelling; and Volume Delay Function (VDF);
All rail schedules passing through AoLDM and bus schedules where zone plan and network structure allows to code the routes
For the external area, only trips with destinations in the internal area are represented. For these, choice of travel mode and destination WITHIN the internal area are represented.
Other trips are ‘external to external’ and not considered by the demand model. Wider
External Area
Rest of Country Area where impacts of interventions would be so small as to be reasonably assumed to be negligible and would be
Full length of rail schedule represented in the external areas. Bus

Model Forecasting Report | 1.0 | 24 June 2021 Atkins | NHTM19 Forecasting Report_24June2021 Page 10 of 115
Area type Areas Covered HAM PTAM Demand Model
characterised by: a buffer network representing a large proportion of the rest of Great Britain, a partial representation of demand (trips to, from and across the Fully Modelled Area); large zones; skeletal networks and simple speed/flow relationships or fixed speed modelling.
schedules are represented only in south of AoLDM for Southampton and Portsmouth
Figure 2-1 below shows the extent of each area. The AoDM is shaded Blue and Green, and the AoLDM is shaded in Orange
Figure 2-1 - NHTM19 Model Areas
NHTM19 Zoning system
The NHTM19 adopted the existing NHTM zone system with additional disaggregation for zones within Reading to increase the matrix granularity in the northern part of the AoLDM. The zone system follows the principles of zone boundaries, in line with TAG Unit M3.1 (Highway Assignment Modelling), such that zones are smallest in the AoDM and become progressively larger in the AoLDM and External Area.
Zone boundaries in the AoDM are typically based on Output Area (OA) or Lower Super Output Area (LSOA) definitions, with similar Land Use and adherence to natural boundaries such as rivers and railways. In the AoLDM, zone boundaries are consistent with Middle Super Output Areas (MSOAs) with further disaggregation where necessary. The External Zones are largest and increase in size as distance from the Fully Modelled Areas increases.

Model Forecasting Report | 1.0 | 24 June 2021 Atkins | NHTM19 Forecasting Report_24June2021 Page 11 of 115
The NHTM19 zoning system is consistent across the HAM, PTAM and VDM elements of the model. The zoning system has a total of 907 zones divided into the model. Within the AoDM there are five individual zones for train station car parks utilised in the Rail Park and Ride module.
Figure 2-2 - NHTM19 Zones Basingstoke
Figure 2-3 - NHTM19 Zones AoDM

Model Forecasting Report | 1.0 | 24 June 2021 Atkins | NHTM19 Forecasting Report_24June2021 Page 12 of 115
Figure 2-4 - NHTM19 Zones Rest of UK
Model time periods
The NHTM19 will represent an average weekday in the neutral month of May 2019. The VDM operates at the daily level but the highway and public transport assignment models will be for the following time periods:
AM Peak hour 08:00 to 09:00 – representing the busiest hour of the AM peak period across the study area;
Inter-peak 10:00 to 16:00 – an average hour representation across 6 hours of the day, and;
PM Peak hour 17:00 to 18:00 – representing the busiest hour of the PM Peak period across the study area.
Further details about the justification for the above time periods is provided in the temporal analysis of count data provided in the Data Collection Report (DCR) for NHTM19.
Demand segmentation
The HAM represents highway demand with five user classes:
UC1 – Car Employer’s Business (EB work); UC2 – Car Commute; UC3 – Car Other; UC4 – Light goods vehicles; and UC5 – Heavy goods vehicles.

Model Forecasting Report | 1.0 | 24 June 2021 Atkins | NHTM19 Forecasting Report_24June2021 Page 13 of 115
The PTAM represents public transport demand with four user classes:
Commute; Business; Other; and Education. The VDM has extensive segmentation of demand, seven trip purposes as follows:
Table 2-2 – NHTM19 Trip Purposes
No Purpose Code Highway AUC PT AUC
1 HB Work HBW CC PTO
2 HB Employers Business HBEB CB PTB
3 HB Education HBEd CO* PTE*
4 HB Shopping & Personal Business HBShopPB CO PTO
5 HB Recreation / Social & Visiting friends & relatives HBRecVFR CO PTO
6 NHB Employers Business NHBEB CB PTB
7 NHB Other NHBO CO PTO
* HB Education is treated separately in trip matrix building phase; see chapter 6 for further detail.
The population is divided into the following segments
Table 2-3 - Segmentation (for each car availability status)
HBW HBEB HBEd HBShopPB HBRecVFR NHBEB NHBO
Children X X X X
FullTime_16-74 X X X X X X
PartTime_16-74 X X X X X X
Student_16-74 X X X X X X X
Other_16-74 X X X X X X X
75+ X X X
This results in 99 demand strata combining demand segments and purposes
Table 2-4 - Number of demand strata for each trip purpose
Trip Purpose Demand Strata
HBW 12
HBEB 12
HBEd 9
HBShopPB 18
HBRecVFR 18
NHBEB 12
NHBO 18
Total 99
Model Forecasting Report | 1.0 | 24 June 2021 Atkins | NHTM19 Forecasting Report_24June2021 Page 14 of 115
Forecasting Scenario A 2040 forecast model for AM Peak hour, Inter-Peak and PM Peak hour has been produced to test the adopted 2029 Local Plan, as detailed below, and used as the basis for future testing of proposals for developments and highway and public transport interventions.
The 2040 Do Minimum (DM) - includes land use in the adopted Local Plan (LP) for 2011 – 2029 plus any committed developments with planning permissions and schemes (including North Manydown) within the existing adopted LP with all the necessary mitigation. This also includes committed highway and public transport scheme provided by HCC and Highways England as well as any necessary connections between the developments and the network.
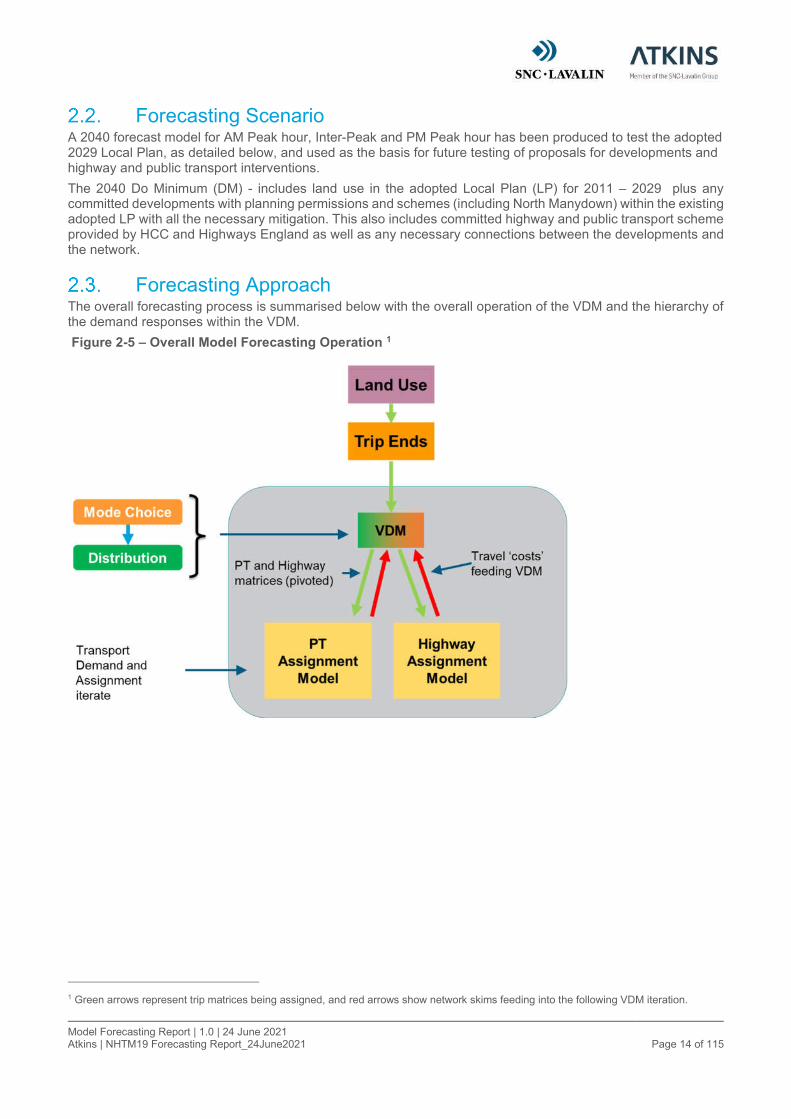
Forecasting Approach The overall forecasting process is summarised below with the overall operation of the VDM and the hierarchy of the demand responses within the VDM.
Figure 2-5 – Overall Model Forecasting Operation 1
1 Green arrows represent trip matrices being assigned, and red arrows show network skims feeding into the following VDM iteration.

Model Forecasting Report | 1.0 | 24 June 2021 Atkins | NHTM19 Forecasting Report_24June2021 Page 15 of 115
Figure 2-6 - Choice Model Hierarchy
Full details of the VDM are given in chapter 5 of the Model Development Report, issued 6th July 2020
Total Demand
Car MainMode
�� …
Car SubMode
Bus P&R
��
…
��
��
PT MainMode
�� …
PT SubMode
Rail P&R
��
…
��
��
Cycle
��
…
��
Walk
��
…
��

Model Forecasting Report | 1.0 | 24 June 2021 Atkins | NHTM19 Forecasting Report_24June2021 Page 16 of 115
3. DM Scenario Input Assumptions
Introduction The Do Minimum scenario is for a forecast year 2040, and this section details the assumptions used to develop the DM scenario.
Development Sites A list of future housing and employment development sites were provided by Basingstoke & Deane Borough Council (BDBC) for the Basingstoke & Deane district. These were agreed with Hampshire County Council (HCC).
For dwellings, site-specific information only was provided for the Do Minimum scenario. For jobs, a combination of site-specific and windfall information was given. Table 3-1 lists the sites where there were greater than 500 dwellings or 500 jobs, along with the relevant windfall allocations. A full list of included developments is shown in Appendix A.
The windfall dwellings and jobs were spread across all Basingstoke and Deane zones as borough-wide windfalls, in proportion with the base level of dwellings and jobs in the NTEM dataset.
Table 3-1 – Do Minimum Sites with >500 dwellings or jobs, with Windfall Sites
ID SubID Site Description Dwellings 2019-2040
Jobs 2019-2040
R3 R3.1 Basingstoke Golf Club, Winchester Road, Kempshott Hill
1,000 -
R11 R11.1 Hounsome Fields, Basingstoke 750 -
R21 R21.3 - R21.6 North Manydown, Basingstoke 3,400 -
E2 E2.1 Basing View - 1,167
E27 E27.1 REDWOOD CROCKFORD LANE - 504
E93 E93.1 M3 J7 Storage and Distribution Centre - 734
E94 E94.1 Windfall - DM general additional jobs - 1,013
Maps showing the distribution of Do Minimum sites is shown below in Figure 3-1.

Model Forecasting Report | 1.0 | 24 June 2021 Atkins | NHTM19 Forecasting Report_24June2021 Page 17 of 115
Figure 3-1 - Development sites: Do Minimum housing and employment sites provided by BDBC
Highway Schemes Included in the Forecast Network In addition to the development sites, the committed highway schemes below were agreed with HCC and BDBC
to be included in the Do Minimum scenario. The details of the highway schemes such as design layouts and signal timings (where applicable) were provided by HCC. Drawings for the highway schemes are included in
Appendix B.
Table 3-2 below summarises the committed highway schemes coded in the forecast network.
Table 3-2 – Committed highway schemes development log
Internal ID Scheme Details Opening year
S1.1 A340 Thornycroft
Roundabout
Carriageway widening works on the existing approach roads;
Carriageway widening works on the roundabout;
Installation of traffic signals on the roundabout and approach roads;
Installation of controlled pedestrian/cycle crossing on Churchill Way West.
January 2021
S2.1 Brighton Hill Roundabout Full signalisation of all roundabout approaches;
Closure of Western Way to southbound traffic, with the provision of an alternative route through the Camrose ground (subject to planning approval);
Improved pedestrian and cycling facilities.
2023
Model Forecasting Report | 1.0 | 24 June 2021 Atkins | NHTM19 Forecasting Report_24June2021 Page 18 of 115
Internal ID Scheme Details Opening year
S2.2 Camrose Link Road
(Brighton Hill
Improvement Scheme)
The scheme will form the first phase of improvements to the Brighton Hill roundabout which include the construction of the Camrose Link Road and enabling works at the Brighton Hill roundabout.
July 2021
S3.1 A33/A339 Ringway
junction improvements
Construct an additional queuing lane on the A33 approach to the junction;
Additional lane on the northern section of the gyratory;
Updating the existing traffic signals.
December 2018 (include in Base model)
S4.1 A33 Crockford
Roundabout Improvement
scheme
Full signalisation of roundabout and widening of some approach arms.
December 2018 (included in Base model)
S5.1 A33 Binfields Roundabout
Improvement scheme
Full signalisation of roundabout and widening of some approach arms
December 2018 (included in Base model)
S6.1 A33/Thornhill Way
junction improvements
The works involved widening Thornhill Way to provide an additional right-turn lane, junction resurfacing and the renewal of the traffic signals.
June 2019 (included in Base model)
S9.1 M3 J9 to J14 Smart
Motorways
Increase from three lane to four lane running throughout.
2023
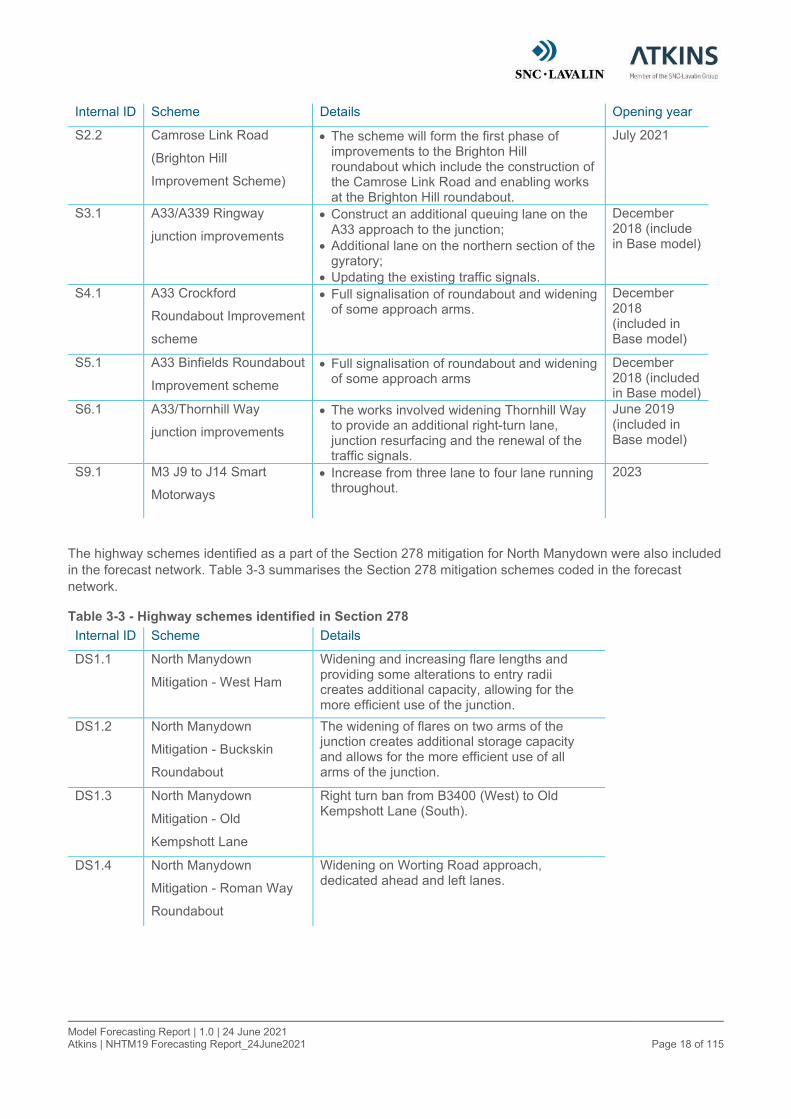
The highway schemes identified as a part of the Section 278 mitigation for North Manydown were also included in the forecast network. Table 3-3 summarises the Section 278 mitigation schemes coded in the forecast
network.
Table 3-3 - Highway schemes identified in Section 278
Internal ID Scheme Details
DS1.1 North Manydown
Mitigation - West Ham
Widening and increasing flare lengths and providing some alterations to entry radii creates additional capacity, allowing for the more efficient use of the junction.
DS1.2 North Manydown
Mitigation - Buckskin
Roundabout
The widening of flares on two arms of the junction creates additional storage capacity and allows for the more efficient use of all arms of the junction.
DS1.3 North Manydown
Mitigation - Old
Kempshott Lane
Right turn ban from B3400 (West) to Old Kempshott Lane (South).
DS1.4 North Manydown
Mitigation - Roman Way
Roundabout
Widening on Worting Road approach, dedicated ahead and left lanes.

Model Forecasting Report | 1.0 | 24 June 2021 Atkins | NHTM19 Forecasting Report_24June2021 Page 19 of 115
Public Transport Schemes Included in Forecast Network The committed public transport measures identified from transport assessment documents of planning applications are included in the forecast and are tabulated in Table 3-4. Routes added are represented by the solid line and modified routes are represented by the dotted lines in Figure 3-2. No additional committed public transport schemes are identified following the discussions with HCC.
Table 3-4 – Public Transport schemes identified from transport assessments
Development Scheme Details
North Manydown Eastern Loop New circular bus route to Basingstoke town centre every 20 minutes
North Manydown Southern Loop New circular bus route to Basingstoke town centre every 20 minutes
Golf Course /
Hounsome Fields
Basingstoke – New bus
route
New bus route to Basingstoke town centre every 60 minutes following the route course of existing bus route 1 long Winchester Road
Hounsome Fields Basingstoke – Route12 Extension of existing route 12
Hounsome Fields Basingstoke – Route8 Extension of existing route 8
Figure 3-2 – Public Transport Forecast Schemes

Model Forecasting Report | 1.0 | 24 June 2021 Atkins | NHTM19 Forecasting Report_24June2021 Page 20 of 115
Walk and cycle The VDM component generates future year walk and cycle matrices, as part of the ‘main mode’ choice, that demonstrate the policy impact for those two modes. However, the matrices are not assigned to a walk or cycle network. Instead the model determines the mode share between car, public transport, walk and cycle for 24-hour daily trips. The choice to use walk or cycle is determined by the journey time in the active modes relative to the other modes. The walk and cycle journey times are calculated using the car distances between origins and destinations and a typical walk and cycle speed.
Walk and cycle distances are taken directly from the highway distance skims. The following fixed speeds are used to calculate journey times:
Walking speed: 4km/hr; and
Cycling speed: 12km/hr.
Due to the size of the model, walking and cycling will not be relevant for many of the zone pairs. A total cut-off distance is therefore applied to avoid any O/D calculations being carried out where the straight-line distance is greater than the cut-off. These distance cut-offs are informed by previous studies of a similar nature and are implemented as follows:
Walk – max crow-fly distance 15 kilometres; and
Cycle – max crow-fly distance 40 kilometres.
The NHTM19 can be used to test the impact on mode share of improved walk and cycle links. Where information is available about future improvements to walk and cycle, such as new cycle corridors or improved cycle infrastructure, that would reduce walk and cycle distances relative to highway distances or improve facilities, the model can be updated. These changes are implemented in the model through adjusting the highway distances for O/D pairs that would be served by the improvement. The reduced distance would be applied specifically to O/D pairs within a reasonable catchment of the infrastructure improvement and would serve to make walk or cycle more attractive in the ‘main mode’ choice model. Additionally, zonal alternative specific constants can be applied to show that the walk or cycle modes would become more attractive – if facilities were improved along an existing corridor. This process is somewhat experimental and would require iterations to derive a suitable set of parameters.
The NHTM19 Do Minimum network does not include any additional cycle or walking schemes.

Model Forecasting Report | 1.0 | 24 June 2021 Atkins | NHTM19 Forecasting Report_24June2021 Page 21 of 115
4. Forecast Network Coding
Values of Time and Vehicle Operating Costs The forecast model generalised costs are based on the on the values of time and operating costs from TAG Databook (v1.13.1) July 2020. Table 4-1 to Table 4-3 show the value of time (pence per second) and vehicle operating costs (pence per metre) for the five HAM user classes for AM, Inter Peak and PM peaks respectively, for 2040. The values of time for HGVs have been factored by 2.5 to account for the importance of time for HGV routeing, in line with TAG Unit M3.1 guidance. All values are in 2019 prices (the price base for the model).
Table 4-1 - VoT / VOC values - AM Peak 2040
Morning Peak (0700:10:00) VoT per vehicle
(pence per second)
VOC per vehicle 2
(pence per metre)
1 Car Commute 0.5737 0.0058
2 Car Work 0.8555 0.0115
3 Car Other 0.3958 0.0058
4 LGV 0.6200 0.0154
5 HGV 1.5436 0.0476
Table 4-2 - VoT / VOC values - Inter Peak 2040
Inter Peak (10:00:16:00) VoT per vehicle
(pence per second)
VOC per vehicle
(pence per metre)
1 Car Commute 0.5830 0.0058
2 Car Work 0.8766 0.0115
3 Car Other 0.4216 0.0058
4 LGV 0.6200 0.0154
5 HGV 1.5436 0.0476
Table 4-3 - VoT / VOC values - PM Peak 2040
Evening Peak (16:00:19:00) VoT per vehicle
(pence per second)
VOC per vehicle
(pence per metre)
1 Car Commute 0.5757 0.0058
2 Car Work 0.8678 0.0115
3 Car Other 0.4145 0.0058
4 LGV 0.6200 0.0154
5 HGV 1.5436 0.0476
Public Transport Fares and Parking Charges TAG Unit M4 recognises the uncertainty of future charging policy, mainly if fares are left to the discretion of the operator and sets out below guidelines-
It may be expected that a constant operating surplus (for public sector services) or margin (for private sector services) will be maintained, and fares will vary taking into account the impact of passenger numbers and vehicle operating costs
2 To estimate VOC, average network speeds were taken from an early version of the HAM.

Model Forecasting Report | 1.0 | 24 June 2021 Atkins | NHTM19 Forecasting Report_24June2021 Page 22 of 115
If it is likely that the charge is held constant in nominal terms until the forecast year, the charge will then be decreasing in real terms because of the impacts of inflation.
If none of the above cases apply, it may be best to assume the charge remains constant in real terms.
The changes in public transport fares over time for NHTM were estimated by reviewing historical fare data for bus and rail separately as detailed below.
Rail Fare
TAG Unit A5.3 paragraph 2.3.6 states:
“Demand and revenue forecasts should be based on current fares policy (usually a nominal increase of RPI+X%). Nominal fare increases should be converted to real terms using the GDP deflator. TAG Data Book Table A5.3.1 provides the relevant GDP deflator and RPI series”.
Projected rail fare increase over RPI in nominal terms is converted to real terms using the GDP deflator and the summary of fare index in real terms is shown in Table 4-4. The analysis showed that the rail fare increases by 25% over 21 years from 2019 to 2040 which is an annual average increase of approximately 1.1%.
Table 4-4 – Rail Fare Index (Constant Prices, GB)
Financial Year Rail Fare Index (Constant Prices)
2019/20 100
2025/26 110
2030/31 115
2035/36 120
2040/41 125
Bus Fare
The changes in the bus fares over time in nominal terms were derived using historical fare data taken from DfT’s local bus fare index table BUS0405a3. The analysis showed that the bus fares in nominal terms increased by about 51% which is an annual average increase of about 4.2% from 2010 to 2020. This trend in nominal terms is extrapolated for the forecast year 2040 and is adjusted using GDP deflator to convert to real terms. Bus fare index in real terms is summarised in Table 4-5 which shows an average annual increase of 2% from 2019 to 2040.
Table 4-5 – Bus Fare Index (Constant Prices, GB)
Financial Year Rail Fare Index (Constant Prices)
2019/20 100
2025/26 116
2030/31 127
2035/36 140
2040/41 153
Parking charges
As no other information was available, parking charges were assumed to remain constant in real terms.
Network Coding The forecast network has been developed for the 2040 Do Minimum scenario Highway Assignment Model
(HAM) and Public Transport Assignment Model (PTAM). The following approach was undertaken to review each development site for network preparation and code them in Visum to create the model network.
3 Bus Statistics (https://www.gov.uk/government/organisations/department-for-transport/series/bus-statistics)

Model Forecasting Report | 1.0 | 24 June 2021 Atkins | NHTM19 Forecasting Report_24June2021 Page 23 of 115
Review of development log - pertinent information to inform the coding assumption including development size, planning reference, access point, GIS matched zone, S106 and S278 mitigation was extracted;
Location of the development - involved going back to the BDBC Planning Portal to find the location map to confirm which zone the development sits within;
Determine development size - where a development was larger than 100 dwellings or 50 jobs the development was typically coded into a development specific zone, judgement was made to limit the number of new zones created to avoid protracted model run times as more zones are added;
Access point/internal road layout of the development site - the access point for developments and the nature of connection with the existing network i.e. priority, signalised, roundabout junction was noted through interrogation of planning portal documents, available layout drawings were obtained to aide coding;
For public transport schemes, information such as access/egress arrangements, bus stop locations, spatial and temporal sequence of the bus route and frequency are identified;
Mitigation - mitigation identified in Section 106 and 278 documents for developments were reviewed. The BDBC Planning Portal was reviewed to check for any detailed information relating to highway scheme interventions and public transport improvements;
Coding in Visum - existing coding in the NHTM19 base model was reviewed to determine the changes needed to include the development site followed by the actual coding to include development changes. Approved S278 mitigations identified were also coded in Visum.
During the coding of each development site, checks were undertaken to ensure newly placed zones were fully connected to the network. Shortest path searches from the zone to the existing highway network, and vice versa, were undertaken to check that trips could load correctly onto the network. Before the network assignment a global network check was performed which reviewed the network for the following:
Route paths were possible between all model zones
The junction coding was correct for junction modelled with Intersection capacity Analysis (ICA)
Turns made sense given their geometry.
Where errors were flagged the network was corrected and the checks performed again. During the development of the forecast model, several assignments were undertaken as the model inputs were refined and updated. This provided an opportunity to check the network coding and new infrastructure for problems after the assignment of traffic. These iterative assignments flagged junctions that had insufficient capacity or zone connectors which were queued such that development traffic couldn’t access the network. At signalised junctions, that demonstrated queuing, the signals were optimised to accommodate the forecast traffic flow.
The details of each development site were recorded in separate OneNote documents and are included in Appendix C. Details of forecast highway and PT schemes are given in section 3.3 and section 3.4 respectively.
Updating Bus Run Times For the bus run times to be compatible with the change in highway congestion in the forecast year, congested link time from HAM is passed onto the bus routes in PTAM. Rather than updating the bus runtimes by applying
a global factor, these are updated at link level to more accurately reflect the change in congestion levels in the forecast year. Additionally, to account for bus acceleration/deceleration and dwell time, a factor is derived using
the base year bus schedules and modelled base year highway link time as shown in Table 4-6. The uplift factor is lower for IP due to less congestion or buses not having to stop at all the locations or shorter dwell time to less bus passengers boarding and alighting.
Table 4-6 – Bus runtime factor to convert HAM link time to PTAM bus run time
Time Period Factor
AM 1.18
IP 1.12
PM 1.16
Model Forecasting Report | 1.0 | 24 June 2021 Atkins | NHTM19 Forecasting Report_24June2021 Page 24 of 115
5. Future Travel Demand Assumptions
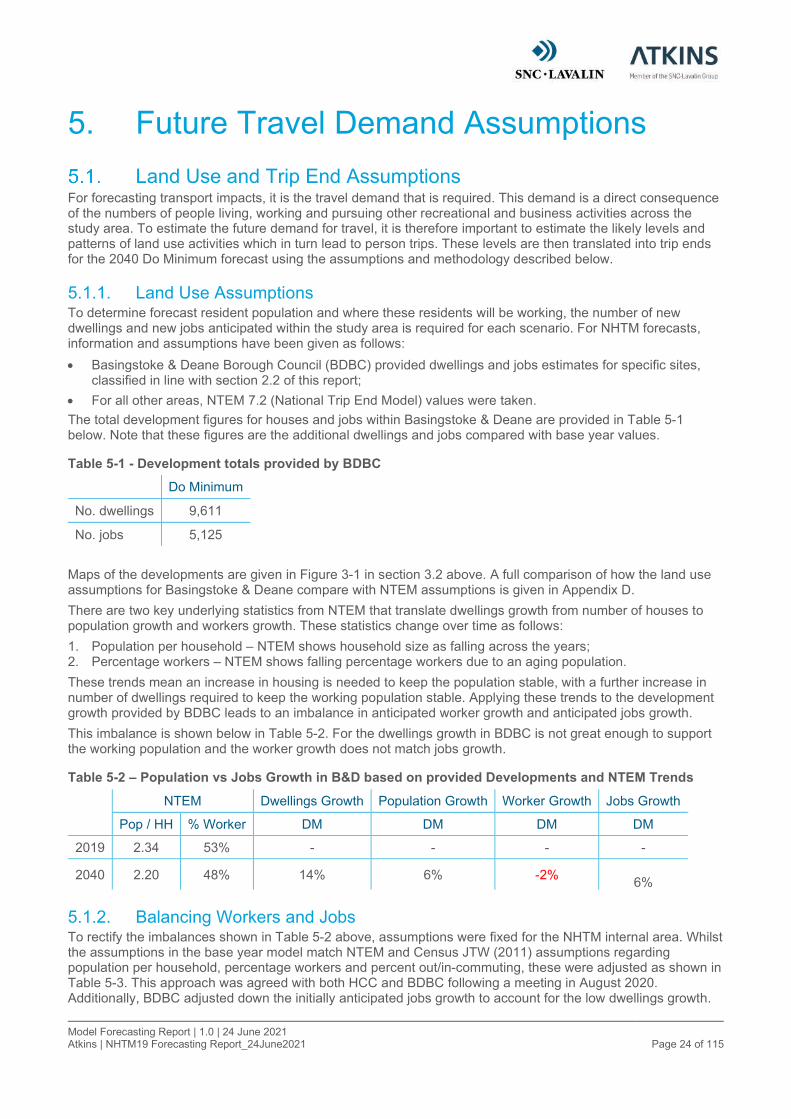
Land Use and Trip End Assumptions For forecasting transport impacts, it is the travel demand that is required. This demand is a direct consequence of the numbers of people living, working and pursuing other recreational and business activities across the study area. To estimate the future demand for travel, it is therefore important to estimate the likely levels and patterns of land use activities which in turn lead to person trips. These levels are then translated into trip ends for the 2040 Do Minimum forecast using the assumptions and methodology described below.
5.1.1. Land Use Assumptions To determine forecast resident population and where these residents will be working, the number of new dwellings and new jobs anticipated within the study area is required for each scenario. For NHTM forecasts, information and assumptions have been given as follows:
Basingstoke & Deane Borough Council (BDBC) provided dwellings and jobs estimates for specific sites, classified in line with section 2.2 of this report;
For all other areas, NTEM 7.2 (National Trip End Model) values were taken.
The total development figures for houses and jobs within Basingstoke & Deane are provided in Table 5-1 below. Note that these figures are the additional dwellings and jobs compared with base year values.
Table 5-1 - Development totals provided by BDBC
Do Minimum
No. dwellings 9,611
No. jobs 5,125
Maps of the developments are given in Figure 3-1 in section 3.2 above. A full comparison of how the land use assumptions for Basingstoke & Deane compare with NTEM assumptions is given in Appendix D.
There are two key underlying statistics from NTEM that translate dwellings growth from number of houses to population growth and workers growth. These statistics change over time as follows:
1. Population per household – NTEM shows household size as falling across the years; 2. Percentage workers – NTEM shows falling percentage workers due to an aging population.
These trends mean an increase in housing is needed to keep the population stable, with a further increase in number of dwellings required to keep the working population stable. Applying these trends to the development growth provided by BDBC leads to an imbalance in anticipated worker growth and anticipated jobs growth.
This imbalance is shown below in Table 5-2. For the dwellings growth in BDBC is not great enough to support the working population and the worker growth does not match jobs growth.
Table 5-2 – Population vs Jobs Growth in B&D based on provided Developments and NTEM Trends
NTEM Dwellings Growth Population Growth Worker Growth Jobs Growth
Pop / HH % Worker DM DM DM DM
2019 2.34 53% - - - -
2040 2.20 48% 14% 6% -2%
6%
5.1.2. Balancing Workers and Jobs To rectify the imbalances shown in Table 5-2 above, assumptions were fixed for the NHTM internal area. Whilst the assumptions in the base year model match NTEM and Census JTW (2011) assumptions regarding population per household, percentage workers and percent out/in-commuting, these were adjusted as shown in Table 5-3. This approach was agreed with both HCC and BDBC following a meeting in August 2020. Additionally, BDBC adjusted down the initially anticipated jobs growth to account for the low dwellings growth.

Model Forecasting Report | 1.0 | 24 June 2021 Atkins | NHTM19 Forecasting Report_24June2021 Page 25 of 115
Table 5-3 – NTEM / Census JTW Baseline Assumptions vs NHTM Internal Area Scenario Assumptions
Assumption NTEM / Census JTW NHTM
2019 2040 2040 DM
Population per HH 2.4 2.2 2.2
% Worker 51.6% 47.4% 48.5%
% Out-commuting 42.3% 42.3% 38.2%
% In-commuting 37.5% 37.5% 39.3%
To summarise the assumptions changes:
Population per household remains at the NTEM projected levels;
Percentage workers is increased compared with the NTEM projection;
Out-commuting (as a percentage of resident workers) is decreased from Census JTW (2011) levels;
In-commuting (as a percentage of internal jobs) is increased from Census JTW (2011) levels.
The NHTM scenario assumptions shown in Table 5-3 balance the modelled worker growth against modelled jobs growth. Appendix D provides a comparison of the overall growth in households, population, workers and jobs in NTEM compared with the Local Plan after the first two adjustments listed above have been applied.
5.1.3. Trip End Estimation, Productions The dwellings information and assumptions detailed in sections 5.1.1 and 5.1.2 above influence the growth of trips at trip production level. To calculate forecast DM productions the following process was used:
1. At zonal level, calculated resulting population growth based on the number of new dwellings (whether provided by BDBC or NTEM). Note for new development zones, district-level forecast household sizes were used to derive population from the number of anticipated dwellings.
2. For external zones, DM populations were proportioned using the same internal-external proportions applied during base year development.
3. The assumptions stated in section 5.1.2 above were applied to the DM populations. 4. Finally, trip rates derived from NTEM 7.2 were applied to the DM populations to calculate DM productions
for each NHTM purpose and demand strata (person type).
Table 5-4 shows the difference between the base year productions and the Do Minimum forecast scenario productions by purpose. For the non-discretionary purposes (HBW, HBEB, HBEd, NHBEB) growth is minimal between the base year and Do Minimum scenario, if not negative. This is due to a low number of dwellings and an aging population, leading to a lack of growth for the population segments that make work-related trips.
Table 5-4 – Base Year vs Scenario Productions by Purpose
Purpose Total Productions Abs. Diff % Diff
Base (2019) DM DM DM
HBW 121,653 122,237 585 0%
HBEB 16,384 16,175 -209 -1%
HBEd 44,656 43,525 -1,131 -3%
HBShopPB 143,239 155,587 12,348 9%
HBRecVFR 111,643 118,486 6,842 6%
NHBEB 18,553 18,538 -16 -0%
NHBO 108,156 112,813 4,657 4%
Total 564,283 587,360 23,077 4%

Model Forecasting Report | 1.0 | 24 June 2021 Atkins | NHTM19 Forecasting Report_24June2021 Page 26 of 115
Figure 5-1 shows the change in total productions at a zonal level, with the Do Minimum difference pivoting from the base year. Note for areas outside of B&D NTEM growth has been applied for household and therefore productions growth. Additionally, for some zones within B&D new dwellings are provided but the numbers are still not enough to lead to productions growth due to factors such as declining persons per dwelling through time.
Figure 5-1 - DM vs BY: Change in Total Productions, with DM Housing Developments
5.1.4. Trip End Estimation, Attractions The jobs information and assumptions detailed in section 5.1.1 and 5.1.2 above influence the weightings of attractions in the forecast DM scenario when compared with the base year. To calculate forecast attractions the following process was used:
1. At zonal level, the number of jobs was calculated by adding the figures provided by BDBC or NTEM to base year figures.
2. For external zones, scenario jobs were proportioned using the same internal-external proportions applied during base year development.
3. Trip attractions were derived from number of jobs as follows for each purpose:
HBW, HBEB, NHBEB – Base year zonal attractions were scaled using the growth between base year jobs and DM jobs. For development zones where base year attractions are zero, DM attractions were calculated by factoring the DM number of jobs by district-level proportion of jobs to attractions.
HBEd – Two primary schools and a secondary added for the North Manydown development as show in in
Table 5-5, but otherwise left unchanged (note that the total education places is implicitly scaled within PTV Visum to match the number of education trips produced by pupils).

Model Forecasting Report | 1.0 | 24 June 2021 Atkins | NHTM19 Forecasting Report_24June2021 Page 27 of 115
Table 5-5 - DM: New School Development in North Manydown
Education Stage No. Form Entries No. Years Model Zone
Primary 2 7 831
Primary 3 7 844
Secondary 12 5 844
HBShopPB - Base year zonal attractions were scaled using the growth between base year non-B class jobs and DM non-B class jobs. For development zones where base year attractions are zero, DM attractions were calculated by factoring the DM number of non-B class jobs by district-level proportion of non-B class jobs to attractions.
HBRecVFR – Base year zonal attractions were scaled using the population growth between base year and DM. For development zones where base year attractions are zero, DM attractions were calculated by factoring the DM population by district-level proportion of attractions to population.
NHBO – Base year zonal attractions were scaled using the total growth of population and jobs between base year and DM. For development zones where base year attractions are zero, DM attractions were calculated by factoring total DM jobs and population by district-level proportion of jobs plus population to attractions.
4. The assumptions stated in section 5.1.2 above were applied to the DM attractions to fix in/out-commuting proportions.
The total changes in attractions are seen in Figure 5-2 below, with the Do Minimum difference pivoting from the base year.
Figure 5-2 - DM vs BY: Change in Total Output Trip Attractions

Model Forecasting Report | 1.0 | 24 June 2021 Atkins | NHTM19 Forecasting Report_24June2021 Page 28 of 115
Goods Vehicles and Car External-External Trips Base year vehicle trip matrices were developed for LGVs, HGVs and Car external-external trips as described in the MDVR. These matrices were used in the base model calibration and validation. Note that NHTM does not predict change in demand for these trips, which must be input from external estimates. The model does determine routing for the vehicle trips and consider their influence on congestion.
Growth assumptions for these matrices are taken directly from the 2018 DfT English Road Traffic Forecasts (RTF) re-based to 2019 to fit with the model base year. The growth factors are derived as an average growth between South East and South West regions of England, with appropriate growth rates being extracted for each movement based on the vehicle type and dominant road type. Table 5-6 shows the sectors adopted and Table 5-7 shows the road classification assumed for each movement.
Table 5-6 - Districts developed for applying DfT RTF growth rates
Sector Code Sector Description Internal/External
CB Basingstoke Internal
EB Rest of B&D Internal
CH Hart LA (Internal) Internal
EH Hart LA (External) External
CT Test Valley LA (Internal) Internal
ET Test Valley LA (External) External
WC Winchester LA (Internal) Internal
RD Reading LA External
HS Rest of Hampshire External
LO London External
SE South East External
SW South West External
EX Other External External

Model Forecasting Report | 1.0 | 24 June 2021 Atkins | NHTM19 Forecasting Report_24June2021 Page 29 of 115
Table 5-7 - Classification of trips between districts used for applying DfT RTF growth rates
CB EB CH EH CT ET WC RD HS LO SE SW EX
CB Minor Road
EB Minor Road
Minor Road
CH Trunk A Minor Road
Minor Road
EH Motorway Minor Road
Minor Road
Minor Road
CT Trunk A Trunk A Trunk A Trunk A Minor Road
ET Trunk A Trunk A Trunk A Trunk A Minor Road
Minor Road
WC Trunk A Trunk A Motorway Motorway Trunk A Trunk A Trunk A
RD Trunk A Trunk A Minor Road
Minor Road
Trunk A Trunk A Trunk A Minor Road
HS Motorway Trunk A Motorway Motorway Trunk A Trunk A Trunk A Trunk A
LO Motorway Motorway Motorway Motorway Motorway Motorway Motorway Motorway Motorway
SE Motorway Motorway Motorway Motorway Motorway Motorway Motorway Motorway Motorway Motorway
SW Trunk A Trunk A Motorway Motorway Trunk A Trunk A Trunk A Motorway Motorway Motorway Motorway
EX Motorway Motorway Motorway Motorway Motorway Motorway Motorway Motorway Motorway Motorway Motorway Motorway

Model Forecasting Report | 1.0 | 24 June 2021 Atkins | NHTM19 Forecasting Report_24June2021 Page 30 of 115
Table 5-8 shows the growth rates derived by vehicle and road type from DfT road traffic forecasts.
Table 5-8 - DfT RTF Derived Growth Rates (2019-2040) by Road Type by Vehicle Type
Vehicle Type Minor Roads Trunk A Motorway
Car 1.180 1.232 1.277
LGV 1.316 1.258 1.270
HGV 0.990 1.068 1.084
A spreadsheet tool has been developed to prepare the files needed to apply these growth rates, which also allows flexibility to update or alter the assumptions.
Additionally, growth assumptions have been applied for goods vehicles from/to major development zones
(zones with >500 jobs). For this purpose, trip rates have been derived, as trips/number of jobs, from a donor zone using base year demand. The distribution of the donor zone is reflected for each development zone.

Model Forecasting Report | 1.0 | 24 June 2021 Atkins | NHTM19 Forecasting Report_24June2021 Page 31 of 115
6. Forecast Travel Demand
Introduction The assumptions and processes detailed in Section 5 result in trip ends for use in the VDM. When these are applied to the VDM, the output result is trip matrices split by purpose and mode. This section analyses these output matrices.
Trip Matrices Final forecast demand matrices at the 24-hour production / attraction level by mode and purpose are shown in Table 6-1.
The table shows that there is an increase in total trips from base year to the Do Minimum scenario. This increase in total trips is mainly attributed to the Car mode, with the Do Minimum seeing a drop in total trips for PT, Walk and Cycle modes when compared with the base year. The relative shift in shares of each mode are discussed in the next section.
Table 6-1 – BY vs DM: Daily P/A Trips by Purpose by Mode
Mode Shares
6.3.1. Mode Shares by Purpose The mode shares by purpose for the Do Minimum scenario is shown below in
Table 6-2. The table highlights an increase in Car mode share compared with the base year.
There are various reasons that the car mode share has risen whilst the PT and walk shares fall. These include:
The rise in in-commuting to fill jobs in the Basingstoke area, which is predominantly car based, due to the home locations of the workers.
The underlying trend in car availability predicted by NTEM and used in the land use inputs. People with full car availability are more likely to choose Car mode than those with no car availability, and as car availability is higher in 2040 this leads to Car mode becoming more popular.
Addition of several highway improvement schemes, but limited PT or active mode improvement schemes included in the Do Minimum scenario, combined with increasing public transport fares (see Chapter 4).
The rise in PT fares assumed based on historic trends, and the relative decrease in car operating costs due to fuel efficiency and electric vehicles. A sensitivity test related to this is shown in Section 6.6.

Model Forecasting Report | 1.0 | 24 June 2021 Atkins | NHTM19 Forecasting Report_24June2021 Page 32 of 115
Table 6-2 – DM: Mode Share by Purpose, Comparison to Base Year
6.3.2. Mode Shares by Sector The mode shares for production and attraction sectors for all purposes, with a focus on new developments, are shown in Table 6-3 and Table 6-4.
These show the Do Minimum Car mode share increases from the base year primarily in Basingstoke and the external areas for both productions and attractions. The shift from Walk mode is most evident in Basingstoke, whilst the shift from PT mode is most evident in the external sector. Do Minimum mode shares for the new development sectors show that most new developments are very car dependent. The new developments in the Do Minimum scenario with the highest levels of walking are those in existing urban centres, for example Basing View. Other new developments have lower shares, which may be partly due limited PT and no Cycle or Walk interventions having been specified for these.

Model Forecasting Report | 1.0 | 24 June 2021 Atkins | NHTM19 Forecasting Report_24June2021 Page 33 of 115
Table 6-3 – DM: 24-hour Production Mode Shares by Sector, Comparison to Base Year, All Purposes

Model Forecasting Report | 1.0 | 24 June 2021 Atkins | NHTM19 Forecasting Report_24June2021 Page 34 of 115
Table 6-4 – DM: 24-hour Attraction Mode Shares by Sector, Comparison to Base Year, All Purposes

Model Forecasting Report | 1.0 | 24 June 2021 Atkins | NHTM19 Forecasting Report_24June2021 Page 35 of 115
6.3.3. Mode Shares by Zone The maps shown in Figure 6-1 to Figure 6-3 give the zonal change in percentage mode share at the 24-hour production level for Car, PT and Active (Cycle plus Walk) modes between the Do Minimum scenario and the Base Year.
These highlight the overall increase in Car usage, as seen in the tables above, with areas such as Basingstoke town and the M3 junction 7 to the south-west showing a high increase in Car usage. Some zones near to the North Manydown development show an increase in percentage PT mode share; this is due to the new bus service associated with the North Manydown development. There are several zones to the north of Basingstoke that show an increase in percentage Active mode share which is due to a change in Car mode generalised times between the Base Year and the Do Minimum scenario due to increased congestion.
Figure 6-1 - DM vs BY: Change in % Car Mode Share, 24-hour Productions, All Purposes

Model Forecasting Report | 1.0 | 24 June 2021 Atkins | NHTM19 Forecasting Report_24June2021 Page 36 of 115
Figure 6-2 - DM vs BY: Change in % PT Mode Share, 24-hour Productions, All Purposes
Figure 6-3 - DM vs BY: Change in % Active (Cycle & Walk) Mode Share, 24-hour Productions, All Purposes

Model Forecasting Report | 1.0 | 24 June 2021 Atkins | NHTM19 Forecasting Report_24June2021 Page 37 of 115
Trip Lengths Trip lengths at the 24-hour production / attraction level are considered for each purpose and mode to identify whether trips are becoming longer or shorter between the base year and Do Minimum scenario. Comparisons of the Do Minimum scenario versus base year average trip length is shown in Table 6-5.
The comparison of Do Minimum versus base year shows Car mode trips are becoming longer for all purposes, whilst PT mode trips are becoming shorter. The main reason for this is a rise in in-commuting trips that use the Car mode, thereby increasing average trip length. Another underlying consideration is that Car picks up mode share from Walk so there is a rise in short-distance car trips too, but the volume is small compared with the long-distance trips shifted from PT to Car leading to an overall increase in Car trip length. Overall trip lengths across all modes, particularly for discretionary purposes and the HBEd purpose, are increasing from the base year to the Do Minimum scenario.
Table 6-5 – DM vs BY: Average Trip Length by Purpose by Mode
Park & Ride The change in Rail Park & Ride patronage between the Base Year and the Do Minimum is shown in Table 6-6.
This table shows that Rail Park & Ride patronage is increasing between the Base Year and the Do Minimum, for nearly all purposes. However, the percentage mode share that Rail P&R represents in both scenarios (Base Year and Do Minimum) is stable, thereby showing that the increase in Rail P&R patronage is due to an increase in overall productions between the scenarios rather than due to mode shift.
Table 6-6 - DM vs BY: Rail P&R Patronage by Purpose
Impact of Public Transport Fares As discussed in Section 4.2, the Do Minimum run has assumed a rise in PT fares in line with recent local trends, based on DfT TAG guidance and discussion with the client. To better understand the reasons impact of this, a sensitivity test was undertaken where the public transport fares were held constant in real terms, i.e. there is no increase in perceived cost for the fare element of the public transport generalised time. The land use and network assumptions used for this sensitivity test were taken from the Do Minimum scenario.
Analysing the outputs of this sensitivity test shows that the increase in the public transport fare element is the cause of a large amount of the public transport mode share shift. Table 6-7 highlights that by holding the fares steady in real terms there is nearly no increase or decrease in public transport mode share from the Base Year. There is still a shift from Walk to Car as can be seen in Table 6-8, highlighting that Car becomes a more

Model Forecasting Report | 1.0 | 24 June 2021 Atkins | NHTM19 Forecasting Report_24June2021 Page 38 of 115
attractive mode as car availability increases and the relative cost of Car decreases over time, but the public transport mode can compete when perceived fares remain fixed.
Table 6-7 – PT Fare Sensitivity Test: Mode Shares by Purpose
Table 6-8 – DM to Base Year: Mode Share Difference by Purpose

Model Forecasting Report | 1.0 | 24 June 2021 Atkins | NHTM19 Forecasting Report_24June2021 Page 39 of 115
7. Traffic Forecasts
Introduction This chapter details the results of the HAM and PTAM assessment of the Do Minimum scenario for the AM, Inter-peak and PM peak hours for the assessment year of 2040.
Highway Assignment The results from the HAM are presented in this section, the key areas analysed are as follows:
The assignment matrix totals (overall and sector to sector);
Impact on key network statistics;
Impact on traffic flows; and
Impact on delays.
7.2.1. Matrix totals Highway Assignment peak hour matrices are developed for the Do Minimum scenario from the VDM runs. Table 7-1 to Table 7-3 below show the matrix totals for the 2019 Base Year model and 2040 Do Minimum for AM peak, Inter-peak and PM peak periods respectively. The percentage change in matrix totals from 2019 base year to 2040 Do Minimum is also shown for comparison. The tables below include growth in all movements within in the matrix, i.e. development growth from individual sites within BDBC as well as external growth from NTEM and Road Traffic Forecasts 2018.
Table 7-1 – Matrix Totals: AM Peak hour (08:00 to 09:00)
Table 7-2 – Matrix Totals: Inter-peak average hour (10:00 to 16:00)
Car – Business 23,788 27,561 16%
Car – Commuting 89,157 103,195 16%
Car – Other 147,160 176,120 20%
LGV 25,247 32,950 31%
HGV 7,138 7,891 11%
Total 292,491 347,717 19%
2019 Base Year 2040 Do Minimum % Change Base Year
to 2040 Do Minimum
User Class
Car – Business 16,281 19,021 17%
Car – Commuting 19,999 23,166 16%
Car – Other 111,090 133,260 20%
LGV 21,696 28,480 31%
HGV 7,175 7,904 10%
Total 176,241 211,831 20%
2019 Base YearUser Class 2040 Do Minimum % Change Base Year
to 2040 Do Minimum

Model Forecasting Report | 1.0 | 24 June 2021 Atkins | NHTM19 Forecasting Report_24June2021 Page 40 of 115
Table 7-3 – Matrix Totals: PM Peak hour (17:00 to 18:00)
Table 7-1 to Table 7-3 show that the overall matrix totals in 2040 Do Minimum have increased by 19% for AM and PM Peak hours, while Inter peak hour has increased by 20% as compared to 2019 base year. The car matrices growth is between 16% and 20% in the Do Minimum. LGV growth, derived from Roads Traffic Forecasts 2018 increases between 31% and 32% in 2040 compared to Base Year. HGV traffic increases between 10% and 11% across the study area.
Considering traffic growth between the key Internal and External sectors of the NHTM (internal is defined at the AoDM and outlined in Figure 2.1 above) it is possible to see how the change in in-commuting and out-commuting patterns have impacted car demand in the peak hours. Table 7-4 presents, for each peak hour, the Base Year and 2040 Do Minimum Car based vehicular trip growth for trips between the Internal and External parts of the NHTM.
Table 7-4 – Sector based Car matrix totals
Table 7-4 shows that Car based trip growth within the Internal areas is between 8% and 10% between the 2019 Base Year and 2040 Do Minimum scenario. AM Peak trips from the Internal area to External area grow by 2%, which reflects the reduction in out commuting, a key assumption of the VDM. Conversely as a result of the input assumption the External to Internal Car trips grow by 10% in the AM Peak, reflecting an increase in in-commuting trips. In the PM Peak this impact is reversed with higher growth in the Internal to External trips compared to the External to Internal.
In the 2040 Do Minimum scenario Car trips between External areas grow between 21% and 22% from 2019, this indicates growth derived from NTEM forecasts and contributes to increased traffic flows on key corridors.
The reason behind the low growth in trips in the internal area in the Do Minimum is that the dwellings proposed are far lower than NTEM as seen from Appendix B. By contrast, growth outside BDBC is restrained to NTEM and hence compatible with the higher growth resulting from that dataset.
7.2.2. Overall Network Statistics Table 7-5 below shows the assignment summary statistics for the Fully Modelled Area (FMA) for 2019 Base Year and 2040 Do Minimum models in the AM Peak, Inter-peak and PM Peak periods. Of particular note is the average journey speed which indicates the overall level of performance of the highway network.
Car – Business 18,311 21,400 17%
Car – Commuting 83,920 97,269 16%
Car – Other 117,974 141,380 20%
LGV 20,803 27,440 32%
HGV 4,630 5,148 11%
Total 245,638 292,636 19%
User Class 2019 Base Year 2040 Do Minimum % Change Base Year
to 2040 Do Minimum
2019 Base
Year
Internal External Internal External Internal Internal External
Internal 26,203 19,156 Internal 18,088 9,006 27,353 16,732
External 15,625 199,122 External 8,448 111,829 External 17,675 158,445
Internal External Internal External Internal External
Internal 28,384 19,595 Internal 19,960 10,260 Internal 29,963 18,825
External 17,250 241,646 External 9,195 136,032 External 18,113 193,148
Internal External Internal External Internal External
Internal 8% 2% Internal 10% 14% Internal 10% 13%
External 10% 21% External 9% 22% External 2% 22%
PM
2040 Do
minimum
% Diff to Base
Year
AM Inter-peak

Model Forecasting Report | 1.0 | 24 June 2021 Atkins | NHTM19 Forecasting Report_24June2021 Page 41 of 115
Table 7-5 - Overall network statistics
Table 7-5 shows an increase in total assigned trips as well as travel time for each time period the 2040 Do Minimum. It is interesting to note that the increase in journey time is less than that for assigned trips, indicating that there is some capacity in the network. This could be the result of the lower growth in the internal model area which would usually get congested, whereas most of the growth in the external area can be taken up by the motorway network. There is also an 5% increase in average trip length. This reflects a slight reduction in car trips in the mid-level distance bands but an increase in shorter and longer distance bands is observed which causes average trip lengths to increase for the three time periods. This increase in trip length is not uncommon and is logical given that VOC reduces over time with increasing VOT making the cost element of the generalised journey time lower.
Error! Reference source not found. to Table 7-8 show the network summary statistics for 2019 Base Year and 2040 Do Minimum models in AM Peak, Inter-peak and PM Peak periods respectively. The network statistics are shown for the FMA , BDBC and the remaining AoDM. The percentage change in network statistics from 2019 Base Year to 2040 Do Minimum is also shown for comparison. The metrics are shown as a total and not as average per vehicle due to the difficulty of isolating the trip matrices allocated to each of the model areas with overlaps between internal and external trips to that area.
Table 7-6 - AM Peak - Network Statistics
FMA Statistic 2019 Base
Year
2040 Do
Minimum
% Diff Base Year to
2040 Do Minimum
Total Assigned Trips (vehs) 292491 347717 19%
Ave journey time (mm:ss) 25:31 28:34 12%
Ave journey distance (kms) 27.2 28.5 5%
Ave Journey Speed (kph) 63.9 59.9 -6%
Total Assigned Trips (vehs) 176241 211831 20%
Ave journey time (mm:ss) 27:15 28:44 5%
Ave journey distance (kms) 32.6 34.1 5%
Ave Journey Speed (kph) 71.7 71.1 -1%
Total Assigned Trips (vehs) 245638 292636 19%
Ave journey time (mm:ss) 27:45 31:11 12%
Ave journey distance (kms) 29.8 31.4 5%
Ave Journey Speed (kph) 64.5 60.4 -6%
AM
Peak
PM
Peak
Inter
Peak
Statistic 2019 Base
Year
2040 Do
Minimum
% Diff Base Year to
2040 Do Minimum
Total Travel Time (veh-hrs) 124,431 165,564 33%
Total Travel Distance (veh-kms) 7,947,722 9,911,247 25%
Average Journey Speed (kph) 63.9 59.9 -6%
Total Travel Time (veh-hrs) 8,858 10,997 24%
Travel Distance (veh-kms) 598,020 709,795 19%
Average Journey Speed (kph) 67.5 64.5 -4%
Total Travel Time (veh-hrs) 9,409 11,901 26%
Travel Distance (veh-kms) 591,510 718,466 21%
Average Journey Speed (kph) 62.9 60.4 -4%
FMA
AODM
BDBC

Model Forecasting Report | 1.0 | 24 June 2021 Atkins | NHTM19 Forecasting Report_24June2021 Page 42 of 115
Table 7-7 - Inter Peak - Network Statistics
Table 7-8 - PM Peak - Network Statistics
Error! Reference source not found. to Table 7-8 show that due to the addition of traffic, congestion is observed in the forecast year as total travel time and travel distance increase in 2040 Do Minimum scenario, while the average journey speed decreases for all time periods.
A key component in travel time is the change in delay. Delay accounts for roughly one third of total travel time so an increase in delay can result in a corresponding, but lower, increase in overall journey time. Error! Reference source not found. presents the change in delay measured as delay per vehicle kilometre in seconds, for the AoDM and BDBC broken down by road category, based on the Ordnance Survey MasterMap network classifications. Figure 7-1 presents the NHTM network classified by Road Type along with the AoDM and BDBC boundaries. Roads with the classification - Classified Unnumbered, are typically rural lanes in the AoDM or distributor roads in BDBC such as Kempshott Lane. Roads that are Unclassified are typically very minor rural roads in the AoDM or residential and town centre streets in Basingstoke.
Delays can increase for several reasons:
As a result of the volume delay function, whereby as traffic volumes increase delays increase, if the traffic flow on a link nears the theoretical capacity of the link the volume delay function will increase the delays incurred. This behaviour reflects additional friction and congestion as traffic volumes increase; or
As a result of the junction modelling, whereby delays increase due to additional opposing traffic flows at priority and roundabout junctions reducing the available gaps for minor flows or at signalised junctions where the available green time is insufficient for the vehicular demand. The blocking back model in Visum calculates the overcapacity traffic and the associated wait time spent in the queue as added delays.
Both behaviours are evident in the NHTM 2040 DM scenario.
Statistic 2019 Base
Year
2040 Do
Minimum
% Diff Base Year to
2040 Do Minimum
Total Travel Time (veh-hrs) 80,054 101,455 27%
Total Travel Distance (veh-kms) 5,743,806 7,215,543 26%
Average Journey Speed (kph) 71.7 71.1 -1%
Total Travel Time (veh-hrs) 5,293 6,606 25%
Travel Distance (veh-kms) 398,962 493,980 24%
Average Journey Speed (kph) 75.4 74.8 -1%
Total Travel Time (veh-hrs) 5,493 7,245 32%
Travel Distance (veh-kms) 402,038 515,051 28%
Average Journey Speed (kph) 73.2 71.1 -3%
FMA
AODM
BDBC
Statistic 2019 Base
Year
2040 Do
Minimum
% Diff Base Year to
2040 Do Minimum
Total Travel Time (veh-hrs) 113,608 152,105 34%
Total Travel Distance (veh-kms) 7,326,384 9,188,204 25%
Average Journey Speed (kph) 64.5 60.4 -6%
Total Travel Time (veh-hrs) 8,770 11,058 26%
Travel Distance (veh-kms) 599,780 722,398 20%
Average Journey Speed (kph) 68.4 65.3 -4%
Total Travel Time (veh-hrs) 9,259 12,210 32%
Travel Distance (veh-kms) 598,287 742,480 24%
Average Journey Speed (kph) 64.6 60.8 -6%
FMA
AODM
BDBC

Model Forecasting Report | 1.0 | 24 June 2021 Atkins | NHTM19 Forecasting Report_24June2021 Page 43 of 115
Figure 7-1 - NHTM Link Road Type

Model Forecasting Report | 1.0 | 24 June 2021 Atkins | NHTM19 Forecasting Report_24June2021 Page 44 of 115
Table 7-9 – Delay per vehicle kilometre (seconds)
Error! Reference source not found. indicates that additional delays occur across all road types in the AoDM and BDBC, although the most significant increase in delays are observed on Motorway links. This is mainly attributed to the growth in external to external traffic taking up available spare capacity and pushing those links closer to their theoretical capacity. Within the AoDM A and B Roads also see an increase in delay per vehicle kilometre for the same reasons, as a result of increased traffic using the key corridors such as the A303 and A34. Delays within BDBC and particularly the Unclassified roads (which are a proxy for residential and town centre street mostly) increase between 14% and 37% in the AM and PM Peaks respectively. Error! Reference source not found. will indicate that the increase in delays in Basingstoke are less down to links approaching capacity and more a result of junction modelling and blocking back.
Maps presenting the link delay per kilometre are provided in Appendix E for all time periods for 2019 Base Year and 2040 Do Minimum respectively. High delays per kilometre are shown in dark red.
It can be observed that the increase in delay per km correspond to the delay differences detailed in Section 7.2.7 and key areas with increases in delay include:
AM and PM 2019 Base Year –
o B3349 and Station Road near M3 Junction 5 and A33 (starting from Crockford Lane to all the way to Sherfield on Loddon) show delay per km ranging from 15 seconds to 1 minute.
Statistic Area Road category 2019 Base
Year
2040 Do
Minimum
% Diff Base Year to
2040 Do Minimum
Motorway 3.6 6.6 83%
A Road 9.9 13.2 33%
B Road 20.8 26.5 27%
Classified Unnumbered 11.1 12.6 13%
Unclassified 20.5 22.5 10%
Total 10.0 12.9 30%
Motorway 4.9 9.0 83%
A Road 13.3 15.7 19%
B Road 11.1 13.1 18%
Classified Unnumbered 11.2 12.3 11%
Unclassified 38.1 43.2 14%
Total 12.9 15.8 23%
Motorway 1.6 3.1 94%
A Road 5.2 6.5 25%
B Road 10.1 12.5 24%
Classified Unnumbered 7.8 8.5 8%
Unclassified 13.3 14.3 7%
Total 5.2 6.4 23%
Motorway 2.1 3.9 89%
A Road 6.6 9.2 39%
B Road 6.5 9.6 48%
Classified Unnumbered 8.4 9.5 14%
Unclassified 19.5 22.5 16%
Total 6.3 8.5 35%
Motorway 3.6 6.9 92%
A Road 9.9 13.1 32%
B Road 18.0 23.7 32%
Classified Unnumbered 11.1 13.0 16%
Unclassified 19.8 21.9 11%
Total 9.6 12.7 32%
Motorway 5.2 10.6 104%
A Road 13.4 16.0 20%
B Road 10.0 13.9 39%
Classified Unnumbered 11.3 12.0 6%
Unclassified 26.9 36.8 37%
Total 11.8 15.7 33%
AM Peak AoDM
Basingstoke & Deane
Inter Peak AoDM
Basingstoke & Deane
PM Peak AoDM
Basingstoke & Deane

Model Forecasting Report | 1.0 | 24 June 2021 Atkins | NHTM19 Forecasting Report_24June2021 Page 45 of 115
AM and PM Do Minimum –
o Delay per km on B3349 and Station Road near M3 Junction 5 and A33 (starting from Crockford Lane to all the way to Sherfield on Loddon) are exacerbated in the Do Minimum.
o Delays can also be observed on A30 Winchester Road and Kempshott Lane near Kempshott Roundabout.
o Victory Roundabout and Eastrop Roundabout in central Basingstoke also show delays ranging from 1 to 1.5 minute.
o M3 Junction 6 and A30 near Basingstoke Golf Course get exacerbated in the Do Minimum.
Table 7-10 shows the length of road, in the AoDM and BDBC by road category, where the volume to capacity ratio is greater than 85%. This demonstrates those links which are approaching capacity and where the volume delay function creates additional delays.
Table 7-10 – Length of Road with VC ratio >85% (kilometres)
Table 7-10 shows that in the AM and PM Peaks it is A Roads and Motorway in the AoDM and BDBC that see the greatest change in links with a volume to capacity ratio greater than 85%. Whereas the length of
Statistic Area Road category 2019 Base
Year
2040 Do
Minimum
% Diff Base Year to
2040 Do Minimum
Motorway - 11.1 New
A Road 3.3 9.7 195%
B Road 2.6 4.0 55%
Classified Unnumbered 1.2 1.3 10%
Unclassified 0.7 0.7 0%
Total 7.7 26.8 246%
Motorway 0.4 15.0 3433%
A Road 6.2 11.5 83%
B Road - 1.3 New
Classified Unnumbered 0.1 0.7 1277%
Unclassified 1.6 1.8 18%
Total 8.3 30.4 266%
Motorway - - -
A Road - - -
B Road - - -
Classified Unnumbered - - -
Unclassified - - -
Total - - -
Motorway - 0.3 New
A Road - - -
B Road - - -
Classified Unnumbered - - -
Unclassified - - -
Total - 0.3 New
Motorway - 10.9 New
A Road 3.1 11.3 262%
B Road 3.7 4.2 13%
Classified Unnumbered 1.0 1.1 6%
Unclassified 1.2 1.2 0%
Total 9.1 28.7 216%
Motorway 0.2 13.7 6238%
A Road 5.3 11.5 115%
B Road 0.0 0.7 New
Classified Unnumbered - 0.7 New
Unclassified 0.6 2.1 245%
Total 6.2 28.7 364%
AM Peak AoDM
Basingstoke & Deane
Basingstoke & Deane
AoDMPM Peak
Inter Peak AoDM
Basingstoke & Deane

Model Forecasting Report | 1.0 | 24 June 2021 Atkins | NHTM19 Forecasting Report_24June2021 Page 46 of 115
Unclassified road does not increase as much, indicating that delay increases are more likely a result of junction modelling, such as the A339 northbound on Hackwood Road approaching Ringway South.
7.2.3. Screenline Flows As part of the NHTM19 Base Year model development a series of screenlines and cordons were developed to compare model flows against observations. These screenlines and cordons, shown in Figure 7-2, provide a summary of traffic flows into and out of the key urban areas as well as key corridors for north to south and east to west movements. Traffic flow comparisons between the 2019 Base Year and the 2040 Do Minimum scenario are presented in Table 7-11, Table 7-12 and Table 7-13.
Figure 7-2 - Screenlines and Cordons

Model Forecasting Report | 1.0 | 24 June 2021 Atkins | NHTM19 Forecasting Report_24June2021 Page 47 of 115
Table 7-11 - AM 2040 Do Minimum - Screenline flow differences
Table 7-12 – Inter-peak 2040 Do Minimum - Screenline flow differences
Car LGV HGV All Car LGV HGV All Car LGV HGV All
In 16 16,340 1,875 454 18,669 17,393 2,437 578 20,408 6% 30% 27% 9%
Out 16 12,773 1,649 425 14,847 12,951 2,212 550 15,713 1% 34% 29% 6%
In 15 11,115 1,262 396 12,773 12,173 1,587 500 14,259 10% 26% 26% 12%
Out 15 8,914 1,248 389 10,551 8,935 1,643 498 11,076 0% 32% 28% 5%
In 14 8,675 1,330 559 10,564 9,952 1,706 619 12,277 15% 28% 11% 16%
Out 14 9,149 1,523 578 11,250 10,392 1,953 640 12,985 14% 28% 11% 15%
In 6 2,456 322 76 2,854 2,969 426 87 3,482 21% 32% 14% 22%
Out 6 1,932 268 71 2,271 2,313 355 83 2,751 20% 33% 17% 21%
In 11 3,340 479 85 3,904 3,717 632 104 4,453 11% 32% 22% 14%
Out 11 4,432 640 115 5,187 4,547 829 135 5,511 3% 30% 17% 6%
NB 43 19,992 2,904 1,349 24,245 22,832 3,782 1,558 28,171 14% 30% 15% 16%
SB 43 19,874 2,993 1,337 24,204 22,980 3,914 1,544 28,438 16% 31% 15% 17%
EB 25 12,014 1,775 788 14,577 13,882 2,443 924 17,248 16% 38% 17% 18%
WB 25 12,299 1,650 761 14,710 13,531 2,225 945 16,701 10% 35% 24% 14%
EB 13 10,381 1,735 732 12,848 11,588 2,196 787 14,570 12% 27% 7% 13%
WB 13 8,175 1,348 644 10,167 9,557 1,746 728 12,030 17% 29% 13% 18%
SB 5 3,772 636 558 4,966 4,362 789 623 5,774 16% 24% 12% 16%
NB 5 4,144 757 577 5,478 5,084 951 630 6,665 23% 26% 9% 22%
SB 9 3,942 715 368 5,025 4,781 904 413 6,098 21% 26% 12% 21%
NB 9 5,022 778 332 6,132 5,854 991 392 7,237 17% 27% 18% 18%
NB 7 1,630 226 50 1,906 1,947 310 63 2,320 19% 37% 26% 22%
SB 7 1,277 194 36 1,507 1,535 285 66 1,886 20% 47% 83% 25%
AM 2019 Base Year AM 2040 Do Minimum Do Minimum to Base Year
Flows (Vehicles) % Flow DifferenceCordon Direction No of
Links
North-South Rail
Screenline
Fleet, Aldershot,
Farnborough Screenline
East-West Rail
Screenline
Basingstoke Central
Cordon
Basingstoke Outer
Cordon
Andover Cordon
Hook Cordon
Fleet Cordon
Winchester Screenline
Newbury Screenline
Mortimer
Car LGV HGV All Car LGV HGV All Car LGV HGV All
In 16 8,783 1,580 482 10,845 9,907 2,247 574 12,728 13% 42% 19% 17%
Out 16 8,860 1,615 437 10,912 9,982 2,264 537 12,782 13% 40% 23% 17%
In 15 5,267 1,041 410 6,718 6,280 1,528 486 8,294 19% 47% 18% 23%
Out 15 5,370 1,042 380 6,792 6,396 1,422 471 8,290 19% 36% 24% 22%
In 14 5,540 1,107 615 7,262 6,713 1,432 669 8,813 21% 29% 9% 21%
Out 14 5,515 1,082 589 7,186 6,740 1,401 644 8,786 22% 30% 9% 22%
In 6 1,208 233 73 1,514 1,402 291 84 1,777 16% 25% 16% 17%
Out 6 1,229 245 68 1,542 1,449 305 78 1,831 18% 24% 15% 19%
In 11 2,282 432 85 2,799 2,354 547 95 2,996 3% 27% 11% 7%
Out 11 2,230 427 83 2,740 2,359 537 92 2,988 6% 26% 11% 9%
NB 43 12,809 2,537 1,428 16,774 15,482 3,372 1,646 20,500 21% 33% 15% 22%
SB 43 12,853 2,544 1,443 16,840 15,562 3,322 1,668 20,553 21% 31% 16% 22%
EB 25 7,699 1,505 788 9,992 9,334 2,069 940 12,343 21% 37% 19% 24%
WB 25 7,742 1,503 855 10,100 9,289 2,113 975 12,376 20% 41% 14% 23%
EB 13 5,685 1,230 682 7,597 6,920 1,582 756 9,258 22% 29% 11% 22%
WB 13 5,726 1,249 748 7,723 6,802 1,602 839 9,243 19% 28% 12% 20%
SB 5 2,844 602 618 4,064 3,655 784 679 5,118 29% 30% 10% 26%
NB 5 2,817 602 590 4,009 3,529 781 655 4,966 25% 30% 11% 24%
SB 9 3,031 630 350 4,011 3,688 841 428 4,956 22% 33% 22% 24%
NB 9 3,174 665 423 4,262 3,941 864 485 5,289 24% 30% 15% 24%
NB 7 762 167 36 965 853 214 45 1,112 12% 28% 25% 15%
SB 7 734 166 36 936 831 209 41 1,081 13% 26% 13% 15%
IP 2019 Base Year IP 2040 Do Minimum Do Minimum to Base Year
Flows (Vehicles) % Flow Difference
Basingstoke Outer
Cordon
Andover Cordon
Hook Cordon
Fleet Cordon
Cordon Direction
Mortimer
Basingstoke Central
Cordon
East-West Rail
Screenline
North-South Rail
Screenline
Fleet, Aldershot,
Farnborough Screenline
Winchester Screenline
Newbury Screenline
No of
Links

Model Forecasting Report | 1.0 | 24 June 2021 Atkins | NHTM19 Forecasting Report_24June2021 Page 48 of 115
Table 7-13 – PM Peak 2040 Do Minimum - Screenline flow differences
During the AM Peak 2040 Do Minimum scenario, growth in inbound Car trips to Basingstoke is between 6% and 10%, whereas outbound trips remain relatively unchanged from 2019 Base Year. This reflects the change in trip making in the VDM and sector-to-sector growth with higher growth in the in-commuting and lower growth in the out-commuting (see Table 7-4). Andover sees growth of 15% inbound and 14% outbound, driven essentially by the profile of NTEM growth. The NTEM trends in Fleet and Hook suggest that travel demand will fall between 2019 and 2040, whereas the HAM cordon comparisons show an increase of between 3% and 21%. This disparity is due to increasing Car mode share, socio economic changes and higher car ownership, furthermore traffic is reassigned in the Hook area particularly as traffic switches from the A33 to B3349.
AM Peak HGV and LGV growth is in line with the NRTF18 trends, HGV growth is higher in Basingstoke compared to other regions, due to the additional commercial vehicles relating to the M3 Junction 7 distribution center and Basing View.
During the Inter-peak Car traffic flow growth between the 2019 Base Year and 2040 Do Minimum typically increase between 13% and 19% inbound and outbound of Basingstoke. The growth in inbound and outbound traffic flows is balanced which reflects the pattern in the VDM for more even discretionary travel between internal and external model sectors. Fleet sees a modest increase in traffic flows of between 3% and 6% which reflects the NTEM trends plus less reassignment compared to the AM Peak. The remaining cordons all demonstrate growth between 16% and 21%.
The PM peak Do Minimum Basingstoke cordon Car flows increase between 11% and 15%. The sector-to-sector growth from the VDM indicated more internal to external trips in the PM Peak, resulting in slightly higher outbound flows. Traffic growth in other cordons and screenlines is between 12% and 21%. Like the AM Peak LGV and HGV growth through the Basingstoke cordon is higher than others due to the additional commercial traffic to and from the employment sites.
7.2.4. Flow Differences The 2040 Do Minimum assignments have been compared with the 2019 Base Year to demonstrate how traffic flows are expected to change in future years also due to the network and land use changes expected.
Table 7-14 shows the change in traffic flows by time period, between the 2019 Base Year and 2040 Do minimum, on some key links across the model along with the percentage difference on each link.
Car LGV HGV All Car LGV HGV All Car LGV HGV All
In 16 13,777 1,228 187 15,192 15,280 1,852 263 17,395 11% 51% 41% 15%
Out 16 15,769 1,280 162 17,211 17,598 1,863 245 19,706 12% 46% 51% 14%
In 15 10,064 898 173 11,135 11,160 1,413 240 12,813 11% 57% 39% 15%
Out 15 10,471 727 146 11,344 12,024 1,001 221 13,245 15% 38% 51% 17%
In 14 9,628 993 322 10,943 11,214 1,260 348 12,822 16% 27% 8% 17%
Out 14 9,359 994 334 10,687 10,962 1,261 362 12,585 17% 27% 9% 18%
In 6 2,290 221 32 2,543 2,666 279 34 2,979 16% 26% 7% 17%
Out 6 2,499 229 21 2,749 3,056 292 25 3,373 22% 27% 20% 23%
In 11 4,748 463 52 5,263 4,865 597 59 5,521 2% 29% 13% 5%
Out 11 3,324 317 35 3,676 3,718 408 44 4,171 12% 29% 26% 13%
NB 43 20,593 2,205 808 23,606 24,136 2,999 924 28,059 17% 36% 14% 19%
SB 43 21,053 2,246 845 24,144 24,804 2,938 1,030 28,772 18% 31% 22% 19%
EB 25 12,264 1,236 407 13,907 14,450 1,688 521 16,659 18% 37% 28% 20%
WB 25 12,546 1,213 427 14,186 14,262 1,771 504 16,537 14% 46% 18% 17%
EB 13 9,549 1,057 378 10,984 11,576 1,385 434 13,395 21% 31% 15% 22%
WB 13 10,876 1,185 485 12,546 12,277 1,526 577 14,381 13% 29% 19% 15%
SB 5 4,503 538 305 5,346 5,617 692 346 6,655 25% 29% 13% 24%
NB 5 3,958 486 329 4,773 4,671 619 360 5,650 18% 27% 10% 18%
SB 9 5,537 590 202 6,329 6,562 821 248 7,632 19% 39% 23% 21%
NB 9 4,763 499 262 5,524 5,521 640 299 6,460 16% 28% 14% 17%
NB 7 1,615 162 20 1,797 1,905 216 29 2,150 18% 33% 46% 20%
SB 7 1,460 145 17 1,622 1,633 206 25 1,865 12% 42% 48% 15%
Do Minimum to Base Year
Flows (Vehicles) % Flow DifferenceCordon Direction No of
Links PM 2019 Base Year PM 2040 Do Minimum
Mortimer
Andover Cordon
Hook Cordon
Fleet Cordon
East-West Rail
Screenline
North-South Rail
Screenline
Fleet, Aldershot,
Farnborough Screenline
Winchester Screenline
Newbury Screenline
Basingstoke Central
Cordon
Basingstoke Outer
Cordon

Model Forecasting Report | 1.0 | 24 June 2021 Atkins | NHTM19 Forecasting Report_24June2021 Page 49 of 115
Table 7-14 – 2040 Do Minimum compared to 2019 Base Year- Key link traffic flows
Comparing the traffic flows between 2019 Base Year and 2040 Do Minimum show the most significant traffic flow increases occur on the key corridors such as M3, A34 and A303, in all model periods. This is attributed in part to development traffic but also the increase in external to external traffic, driven by NTEM growth. Traffic flow on the A33 falls marginally in the AM Peak and remains unchanged in the PM Peak. This is a result of capacity constraints on the A33 between Chineham and Riseley, this section is nearing capacity causing delays to increase and traffic to reassign to alternative routes such as the B3349 towards Hook and the M3. It is noted that the rerouting to the B3349 does cause issues and additional queuing at the B3349 junction with the A33.
The A339 flows increase eastbound towards Basingstoke in the AM and Inter-peak as additional traffic travels from the A34 and Newbury towards Basingstoke. In the westbound direction between the Ringway and Roman Road, there is a fall in flows due to the closure of Roman Road at the existing A339 roundabout. Some traffic will use the new spine road through the North Manydown site but there is an increase in flow on Ashwood Way, Wellington Terrace and Elmwood Way as vehicles seek alternative routes to Roman Road and the Winklebury area.
Traffic flows increase on the Ringway on all segments except for the southern section, where traffic flows reduce in the Do Minimum scenario compared to Base Year in both directions in the AM Peak and westbound in the Inter-peak and PM Peak. The reductions are due to route choice, between A30 Winchester Road and A33, where traffic has a clear choice between Ringway West and North, Ringway South and East or to a lesser extent Ringway West and Churchill Way. Delays at Black Dam roundabout can cause traffic to switch from Ringway South to Ringway North. This is more likely in the Do Minimum scenario due to the improvements at Thornycroft Roundabout where signalisation has helped reduce delays north and south in the AM Peak.
The section below details the flow difference plots focussed on the BDBC area. Flow difference plots for the AoDM are shown in Appendix F. The increase in traffic flow (vehicles) is shown in red, whilst decrease in traffic is shown in blue.
AM Peak Flow Differences Plots
Figure 7-3 show the traffic flow differences in AM peak between 2040 Do Minimum and the 2019 Base Year,
EB 4,640 6,169 33% 2,634 3,755 43% 3,258 4,801 47%
WB 2,986 4,004 34% 3,008 4,106 36% 4,405 5,691 29%
NB 1,061 1,011 -5% 690 800 16% 1,135 1,133 0%
SB 1,112 1,106 -1% 706 742 5% 1,089 1,103 1%
NB 1,735 2,259 30% 1,480 2,004 35% 1,493 1,935 30%
SB 1,720 2,251 31% 1,545 2,108 36% 2,013 2,650 32%
EB 835 989 18% 443 574 30% 899 1,103 23%
WB 894 939 5% 440 517 18% 830 1,030 24%
EB 2,056 2,259 10% 884 1,084 23% 1,401 1,760 26%
WB 1,198 964 -20% 940 836 -11% 1,762 2,113 20%
NB 867 1,110 28% 590 794 35% 1,140 1,103 -3%
SB 1,015 1,051 3% 589 713 21% 958 1,174 23%
EB 528 684 30% 274 388 41% 465 582 25%
WB 513 602 17% 350 423 21% 531 609 15%
EB 2,309 3,084 34% 1,257 1,862 48% 1,851 2,682 45%
WB 1,556 2,079 34% 1,336 1,903 42% 2,170 2,801 29%
EB 2,320 2,806 21% 1,368 1,796 31% 1,699 2,144 26%
WB 1,961 2,096 7% 1,301 1,655 27% 2,400 3,114 30%
NB 3,463 3,566 3% 1,806 2,446 35% 3,077 3,778 23%
SB 3,014 3,481 15% 2,046 2,596 27% 2,805 3,224 15%
EB 1,026 942 -8% 509 644 26% 629 728 16%
WB 450 395 -12% 433 384 -11% 709 644 -9%
NB 1,130 1,420 26% 898 803 -11% 926 763 -18%
SB 972 1,173 21% 1,000 1,008 1% 1,400 1,575 12%
EB 1,164 1,620 39% 636 751 18% 679 863 27%
WB 922 809 -12% 904 853 -6% 1,067 1,353 27%
Road Name Between… And… Direction Total vehicles
AM IP PM
2019 Base
Year
2040 Do
Minimum
% Diff BY
to DM
2019 Base
Year
2040 Do
Minimum
% Diff BY
to DM
2019 Base
Year
2040 Do
Minimum
% Diff BY
to DM
M3 Junction 7 Junction 6
A33 Taylor's Farm
Roundabout
Sherfield Green
A34 A303 Tufton
Hatch Warren
Roundabout
A30 (east) Greywell Road Ashmoor Lane
A303 Overton Junction M3 Junction 7
Ringway North Aldermaston Rd
Roundabout
A33 Roundabout
A339 Hook Lane Basingstoke Road
A339 Roman Road Ringway
A30 (west) Beggar Wood
Lane
Churchill Way
West
Thornycroft
Roundabout
Sinclair Drive
Ringway East Churchill Way
East
Gresley Road
flyover
Ringway South Winchester Rd
Roundabout
Hackwood
Roundabout
Ringway West Worting Road
flyover
Thornycroft
Roundabout

Model Forecasting Report | 1.0 | 24 June 2021 Atkins | NHTM19 Forecasting Report_24June2021 Page 50 of 115
Figure 7-3 - AM - 2040 Do Minimum compared with 2019 Base Year
Inter Peak Flow Differences Plots
Figure 7-4 shows the traffic flow difference in Inter-peak between 2040 Do Minimum and the 2019 Base Year.
Figure 7-4 - IP - 2040 Do Minimum compared to 2019 Base Year

Model Forecasting Report | 1.0 | 24 June 2021 Atkins | NHTM19 Forecasting Report_24June2021 Page 51 of 115
PM Peak Flow Differences Plots
Figure 7-5 shows the traffic flow differences in PM peak between 2040 Do Minimum and the 2019 Base Year.
Figure 7-5 - PM - 2040 Do Minimum compared to 2019 Base Year
Figure 7-3 to Figure 7-5 show that an overall traffic increase is seen on most of the network links, with the highest increases in traffic flow observed on the M3, A340 Ringway West, A339 Ringway North and East.
Increase in traffic in 2040 can be observed on A30 Winchester Road towards the M3 Junction 7 due to addition of committed developments such as Basingstoke Golf Course, Kennel Farm, Hounsome Fields and North Manydown in the forecast year. Reductions can be observed on Roman Way where the continuing route to A339 is closed as part of the North Manydown development mitigation, and no significant change is seen on the A33 despite the addition of committed developments in East of Basingstoke and Chineham. The flow difference plots also show that with A33 approaching capacity in all scenarios, there is limited capacity for additional traffic, which is causing some of the existing traffic to reroute to B3349 towards Hook.
Figure 7-6 shows development traffic for the Do Minimum sites, the traffic flows are labelled by each link, it clearly highlights trips from North Manydown, Chineham, East of Basingstoke and developments adjacent to the A30 Winchester Road. Traffic seems to be routing predominantly through the Ringway, A30 Winchester Road and the M3, with access to North Manydown via the A339 or B3400. It is encouraging to observe that the development traffic prefers to use these key corridors.
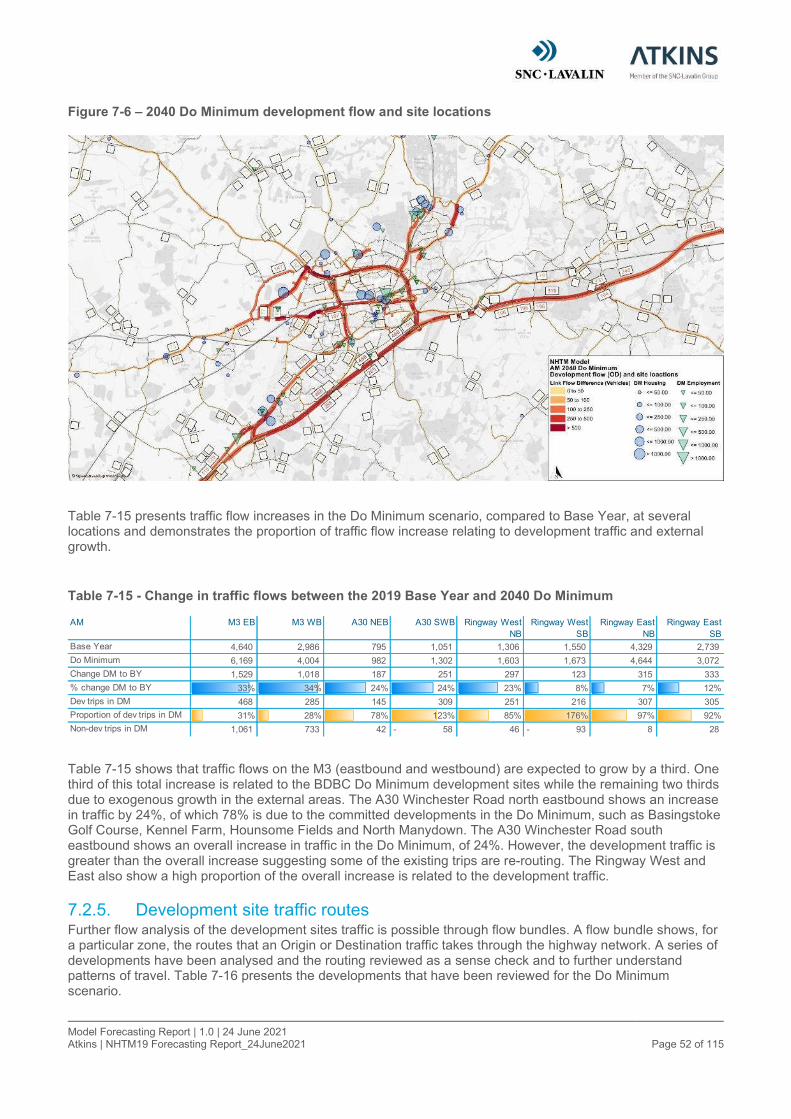
Model Forecasting Report | 1.0 | 24 June 2021 Atkins | NHTM19 Forecasting Report_24June2021 Page 52 of 115
Figure 7-6 – 2040 Do Minimum development flow and site locations
Table 7-15 presents traffic flow increases in the Do Minimum scenario, compared to Base Year, at several locations and demonstrates the proportion of traffic flow increase relating to development traffic and external growth.
Table 7-15 - Change in traffic flows between the 2019 Base Year and 2040 Do Minimum
Table 7-15 shows that traffic flows on the M3 (eastbound and westbound) are expected to grow by a third. One third of this total increase is related to the BDBC Do Minimum development sites while the remaining two thirds due to exogenous growth in the external areas. The A30 Winchester Road north eastbound shows an increase in traffic by 24%, of which 78% is due to the committed developments in the Do Minimum, such as Basingstoke Golf Course, Kennel Farm, Hounsome Fields and North Manydown. The A30 Winchester Road south eastbound shows an overall increase in traffic in the Do Minimum, of 24%. However, the development traffic is greater than the overall increase suggesting some of the existing trips are re-routing. The Ringway West and East also show a high proportion of the overall increase is related to the development traffic.
7.2.5. Development site traffic routes Further flow analysis of the development sites traffic is possible through flow bundles. A flow bundle shows, for a particular zone, the routes that an Origin or Destination traffic takes through the highway network. A series of developments have been analysed and the routing reviewed as a sense check and to further understand patterns of travel. Table 7-16 presents the developments that have been reviewed for the Do Minimum scenario.
AM M3 EB M3 WB A30 NEB A30 SWB Ringway West
NB
Ringway West
SB
Ringway East
NB
Ringway East
SB
Base Year 4,640 2,986 795 1,051 1,306 1,550 4,329 2,739
Do Minimum 6,169 4,004 982 1,302 1,603 1,673 4,644 3,072
Change DM to BY 1,529 1,018 187 251 297 123 315 333
% change DM to BY 33% 34% 24% 24% 23% 8% 7% 12%
Dev trips in DM 468 285 145 309 251 216 307 305
Proportion of dev trips in DM 31% 28% 78% 123% 85% 176% 97% 92%
Non-dev trips in DM 1,061 733 42 58- 46 93- 8 28

Model Forecasting Report | 1.0 | 24 June 2021 Atkins | NHTM19 Forecasting Report_24June2021 Page 53 of 115
Table 7-16 – Development site flow bundles
Do Minimum sites
Internal ID Description
R22 North Manydown
R3 Basingstoke Golf Course
R11 Hounsome Fields
E93 M3 Junction 7 Distribution Centre
R23 North of Popley / Merton Rise
R2 & E2 Basing View
R8 East of Basingstoke
Figure 7-7 presents the AM Peak Origin flow bundle for the North Manydown development, for traffic that originates in this development the red line highlights their routes through the network to their various destinations. If LGV and HGV traffic were generated by the development their routes would be shown by Blue and Yellow lines respectively. It shows that trips from North Manydown are distributed through the network with a large proportion of the trips heading towards Basingstoke Town Centre. Figure 7-8 shows the AM Peak destination routes to the same development. The figure shows that overall, the destination trips are lower in the AM, as expected for a predominantly residential development and their routes choices like the origin trips.
Figure 7-7 - Flow Bundle 2040 Do Minimum North Manydown AM Origin trips

Model Forecasting Report | 1.0 | 24 June 2021 Atkins | NHTM19 Forecasting Report_24June2021 Page 54 of 115
Figure 7-8 - Flow Bundle 2040 Do Minimum North Manydown AM Destination trips
Flow bundles for the remaining development sites listed are presented in Appendix G. A review of the development flow bundles found all routes to be reasonable.
7.2.6. Volume/Capacity Ratios Figure 7-9 to Figure 7-14 show the volume to capacity (V/C) ratios by link for all time periods which represents the actual volume of traffic flow as a percentage of the theoretical capacity of the link. Links with low V/C i.e. less than 60% have been filtered and not shown in the figures below as they are of lesser importance, not causing a congestion problem. A V/C of over 85% is considered to be becoming heavily congested and approaching capacity. Figures which present V/C ratios for links in the AoDM are presented in Appendix H.
AM Links Volume/Capacity Ratios
Figure 7-9 and Figure 7-10Error! Reference source not found. compare the link V/Cs for AM peak in 2019 Base Year and 2040 Do Minimum respectively. The links approaching capacity are shown in dark orange, while the links at capacity are shown in red.
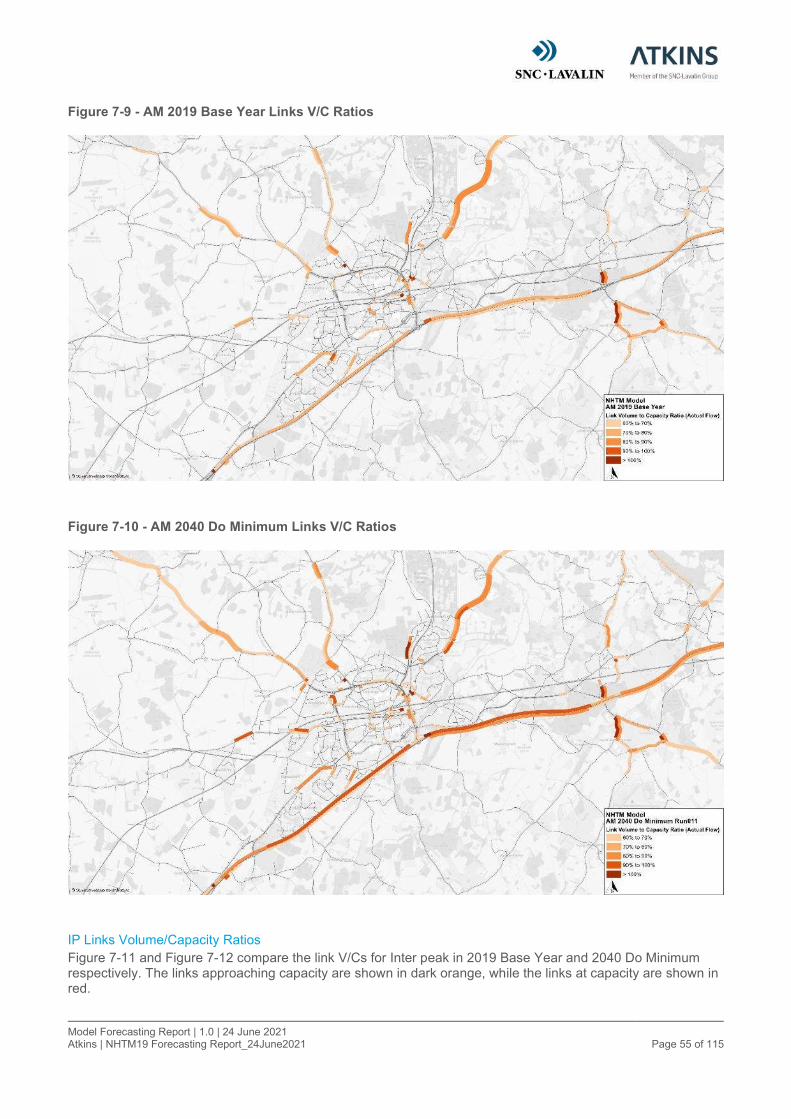
Model Forecasting Report | 1.0 | 24 June 2021 Atkins | NHTM19 Forecasting Report_24June2021 Page 55 of 115
Figure 7-9 - AM 2019 Base Year Links V/C Ratios
Figure 7-10 - AM 2040 Do Minimum Links V/C Ratios
IP Links Volume/Capacity Ratios
Figure 7-11 and Figure 7-12 compare the link V/Cs for Inter peak in 2019 Base Year and 2040 Do Minimum respectively. The links approaching capacity are shown in dark orange, while the links at capacity are shown in red.

Model Forecasting Report | 1.0 | 24 June 2021 Atkins | NHTM19 Forecasting Report_24June2021 Page 56 of 115
Figure 7-11 - IP 2019 Base Year Links V/C Ratios
Figure 7-12 - IP 2040 Do Minimum Links V/C Ratios
PM Links Volume/Capacity Ratios
Figure 7-13 and Figure 7-14 compare the link V/Cs for PM peak in 2019 Base Year and 2040 Do Minimum respectively. The links approaching capacity are shown in dark orange, while the links at capacity are shown in red.

Model Forecasting Report | 1.0 | 24 June 2021 Atkins | NHTM19 Forecasting Report_24June2021 Page 57 of 115
Figure 7-13 - PM 2019 Base Year Links V/C Ratios
Figure 7-14 - PM 2040 Do Minimum Links V/C Ratios
The 2019 Base Year figures are shown for reference and indicate that the majority of network links are operating within capacity. However, some major corridors in the AM and PM Peaks, such as the M3, A33, A339, A340 and A30, exhibit V/C rations between 60% and 80%. The A33 can be seen to have a V/C ratio in excess of 80% in both the AM and PM Peak, between Chineham and Riseley, congestion is also seen at the B3349 junction with the A33. V/C ratios are high on roads to the south of Hook, through Odiham and North Warnborough, this is traffic seeking routes to the M3. The A30 Winchester Road and Brighton Way approaches

Model Forecasting Report | 1.0 | 24 June 2021 Atkins | NHTM19 Forecasting Report_24June2021 Page 58 of 115
to Brighton Hill Roundabout have V/C rations between 60% and 70%. Crockford Lane shows conditions are approaching capacity with V/C between 70% and 80% through the business park. The Inter-peak demonstrates very few links are approaching capacity.
Comparing the 2040 Do Minimum scenario to the 2019 Base Year the M3 eastbound in the AM Peak and westbound in the PM Peak between Junction 7 and 5 show V/C ratios exceeding 90%. This is consistent with the increase in length of Motorway links with V/C >85% in Table 7-10 above, due in part to development sites but more so from external to external growth. Some sections of the A33 corridor worsen as the development trips add traffic to an already constrained corridor. The A339 sees some sections in the AM Peak increase with V/Cs between 60% and 70% whereas in the PM Peak, sections experience V/C in excess of 90%. The B3400 V/C ratio increases in the AM Peak due to the additional North Manydown traffic. In the PM Peak Worting Road approach to the Ringway West flyover sees V/C ratios increase due to additional development trips from the Town Centre. Approaching Brighton Hill Roundabout, the AM Peak shows an improvement on Brighton Way whereas A30 Winchester Road gets marginally worse, given that signals have been introduced, signal optimisation and SCOOT control should benefit these approaches. Traffic along Crockford Lane has increased due to additional developments in the business park and north of Chineham, this increases the V/C ratio northbound on Crockford Lane. During the Inter-peak many links remain comfortably within capacity, although the M3 has V/C ratios between 60% and 70%.
AM Turns Volume/Capacity Ratios
To understand how junctions are performing in the BDBC area, the turning movement V/C ratio at junctions is shown in Figure 7-15 to Figure 7-20. These values represent the volume of traffic flow making a turn as a percentage of the capacity for that turn. Turns with V/C less than 85% have been filtered and not shown in the figures below. A V/C between 85% and 100% can be considered to be approaching capacity. Figures showing turn V/C for the AoDM area are presented in Appendix I.
Figure 7-15 to Figure 7-20 show how the 2019 Base Year and 2040 Do Minimum compare in terms of turning V/C ratio.
Figure 7-15 to Figure 7-16 show the turn V/Cs for AM peak in 2019 Base Year and 2040 Do Minimum respectively. The turns approaching capacity are shown in dark orange, while the turns at capacity are shown in red.
Figure 7-15 - AM 2019 Base Year Turn V/C Ratios
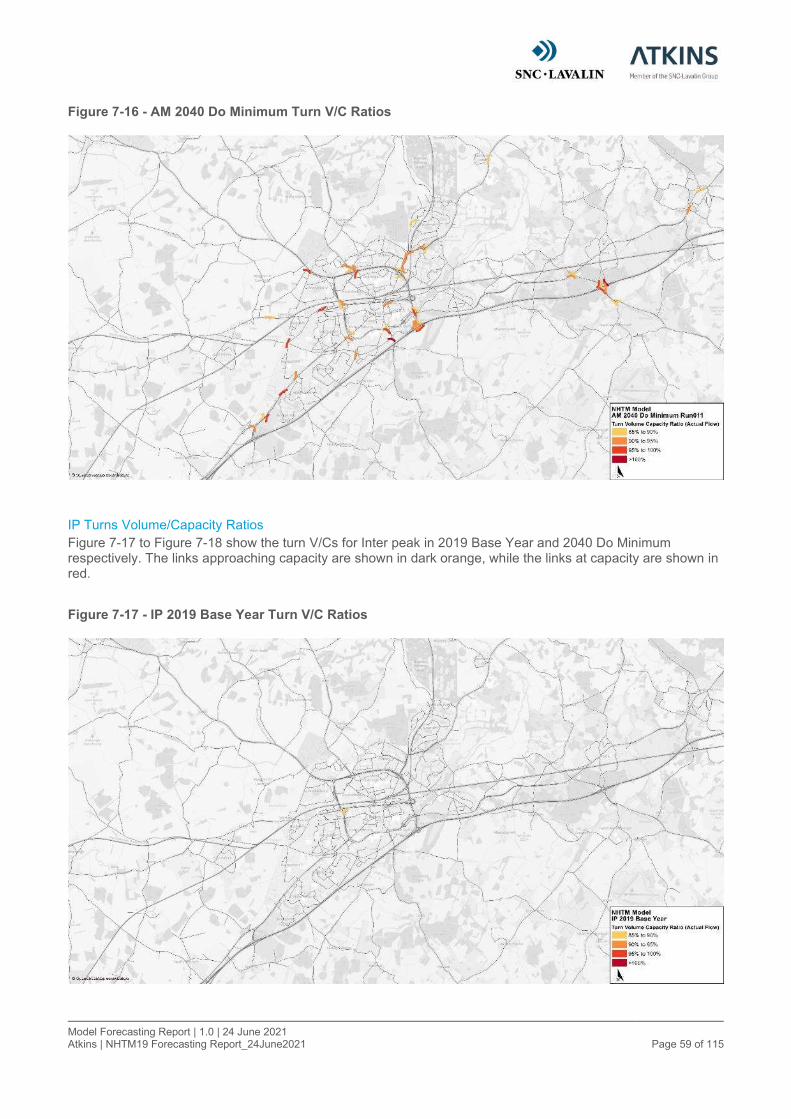
Model Forecasting Report | 1.0 | 24 June 2021 Atkins | NHTM19 Forecasting Report_24June2021 Page 59 of 115
Figure 7-16 - AM 2040 Do Minimum Turn V/C Ratios
IP Turns Volume/Capacity Ratios
Figure 7-17 to Figure 7-18 show the turn V/Cs for Inter peak in 2019 Base Year and 2040 Do Minimum respectively. The links approaching capacity are shown in dark orange, while the links at capacity are shown in red.
Figure 7-17 - IP 2019 Base Year Turn V/C Ratios

Model Forecasting Report | 1.0 | 24 June 2021 Atkins | NHTM19 Forecasting Report_24June2021 Page 60 of 115
Figure 7-18 - IP 2040 Do Minimum Turn V/C Ratios
PM Turns Volume/Capacity Ratios
Figure 7-19 to Figure 7-20 show the turn V/Cs for PM peak in 2019 Base Year and 2040 Do Minimum respectively. The links approaching capacity are shown in dark orange, while the links at capacity are shown in red.
Figure 7-19 - PM 2019 Base Year Turn V/C Ratios

Model Forecasting Report | 1.0 | 24 June 2021 Atkins | NHTM19 Forecasting Report_24June2021 Page 61 of 115
Figure 7-20 - PM 2040 Do Minimum Turn V/C Ratios
The 2019 Base Year scenario indicates high V/C ratios for turns at the following locations, in the AM Peak:
Hackwood Road and Ringway South roundabout;
Thornycroft Roundabout;
Aldermaston Road Roundabout;
A33 Roundabout, Popley Way junction and Binfields Roundabout;
M3 Junction 6 westbound off slip;
M3 Junction 5 at the Hook junction;
And in the PM Peak additional congestion on the A30 Winchester Road.
Comparing the 2019 Base Year with the 2040 Do Minimum AM and PM Peak scenarios, there are additional turns where the V/C ratio is in excess of 85% along the A30 Winchester Road. Particularly at the A30 signalised junction, the new Golf Course roundabout, Hatch Warren roundabout and Kempshott roundabout where traffic volumes have increased due to the additional developments compared to Base Year. V/C ratios have improved at Thornycroft roundabout even though traffic volumes have increased, this demonstrates that the signalisation has improved the roundabouts capacity. V/C ratios have worsened at Aldermaston roundabout, although these signalised junctions could be optimised to cope with additional volumes. The A33 show similar levels of V/C ratio with slight worsening at the Crockford Lane junction as additional traffic from Chineham passes through the junction. The M3 Junction 5 and Junction 6 have a number of turns in excess of 85% V/C in the Do Minimum scenario suggesting that the signalised junctions at the gyratory are becoming congested. At junction 6 in particular, the westbound off slip and the gyratory turns are in excess of 90% which suggests they have limited scope for additional flows. The Inter-peak shows slight deterioration in V/C ratios at Eastdrop roundabout, Aldermaston Roundabout, Hackwood Road roundabout and A30 Winchester Road with Ringway West junction.
7.2.7. Link Delay Figure 7-21 to Error! Reference source not found. show the change in link delays, calculated as the mean link delay plus turn delay per vehicle, (in minutes), for all time periods between 2040 Do Minimum and the 2019 Base Year. An increase in link mean modelled delay is shown in dark pink, while a decrease in delay is shown in green. The link mean modelled delay includes delays calculated by the volume delay function plus delays
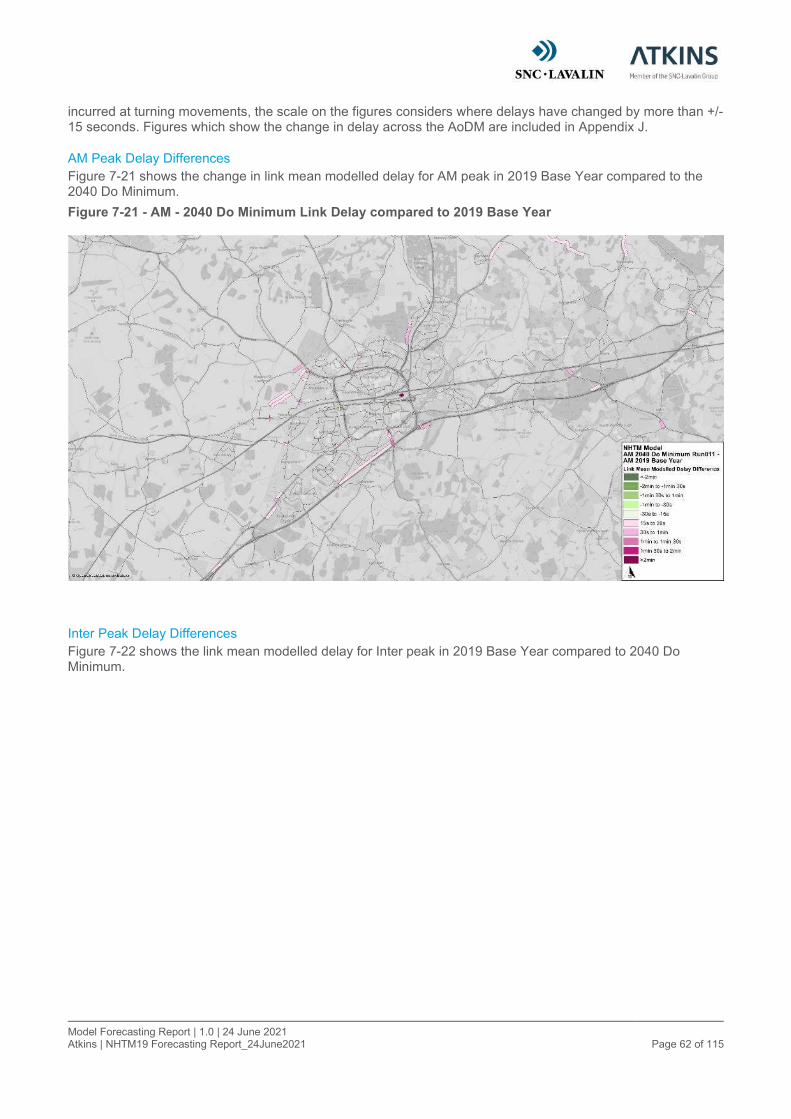
Model Forecasting Report | 1.0 | 24 June 2021 Atkins | NHTM19 Forecasting Report_24June2021 Page 62 of 115
incurred at turning movements, the scale on the figures considers where delays have changed by more than +/- 15 seconds. Figures which show the change in delay across the AoDM are included in Appendix J.
AM Peak Delay Differences
Figure 7-21 shows the change in link mean modelled delay for AM peak in 2019 Base Year compared to the 2040 Do Minimum.
Figure 7-21 - AM - 2040 Do Minimum Link Delay compared to 2019 Base Year
Inter Peak Delay Differences
Figure 7-22 shows the link mean modelled delay for Inter peak in 2019 Base Year compared to 2040 Do Minimum.

Model Forecasting Report | 1.0 | 24 June 2021 Atkins | NHTM19 Forecasting Report_24June2021 Page 63 of 115
Figure 7-22 - IP - 2040 Do Minimum Link Delay compared to 2019 Base Year
PM Peak Delay Differences
Figure 7-23 shows the link mean modelled delay for PM peak in 2019 Base Year compared to the 2040 Do Minimum.

Model Forecasting Report | 1.0 | 24 June 2021 Atkins | NHTM19 Forecasting Report_24June2021 Page 64 of 115
Figure 7-23 - PM - 2040 Do Minimum Link Delay compared to 2019 Base Year
It can be observed that the main increases in delay occur at the links and junctions which are at or approaching capacity identified in the previous sections.
Comparing the AM Peak 2040 Do Minimum with the 2019 Base Year, delays are predicted to increase on the A30 Wincester Road at Hatch Warren Roundabout and the new Golf Course roundabout, due to the additional traffic flow through the junctions. The M3 eastbound between junction 7 and junction 6 shows an increase in delay due to the increase in traffic flow approaching the theoretical capacity of the motorway. As shown in Table 7-15 development traffic contributes to about one third of the overall increase in traffic flow through this section. Delays increase northbound traffic on A339 Hackwood Road, this was shown to be a slow section during the Base Year development and as traffic flows increase, the available capacity reduces at roundabout junctions with Grove Road and Ringway South. Delays also increase at M3 junction 6 particularly the westbound M3 off slip and gyratory junction, the signals were optimised but flows for both movements are close to available capacity. Delays increase slightly on the approaches to Brighton Hill roundabout which is a result of introducing traffic signal control. The traffic signal control introduced at Thornycroft roundabout has helped to reduce delays on Ringway West.
Comparing the PM Peak between the 2019 Base Year and 2040 Do Minimum, delays are expected again along the A30 Winchester Road at the signalised junctions just north of M3 junction 7 and Brighton Hill roundabout. Thornycroft roundabout experiences further delays due to additional traffic flows – further optimisation of these signals could help reduce delay further. Again, the M3 junction 6 experiences additional delays on the westbound off slip due to the signals at the gyratory. Notable increases in delays are observed on Winchester Road south westbound towards the Ringway south junction. This is due to additional developments in the Town Centre area adding to traffic flow on the inner ring road and trips with destinations in the south west having limited route choice to exit the Town Centre.
There is little notable change in delays in the Inter-peak 2040 Do Minimum scenario compared to 2019 Base Year.
7.2.8. Traffic Speeds Traffic speeds provide an indication of network performance, typically where delays increase speeds will fall. Using the road type categories and study boundaries outlined in Figure 7-1 the average link speeds are shown in Table 7-17.
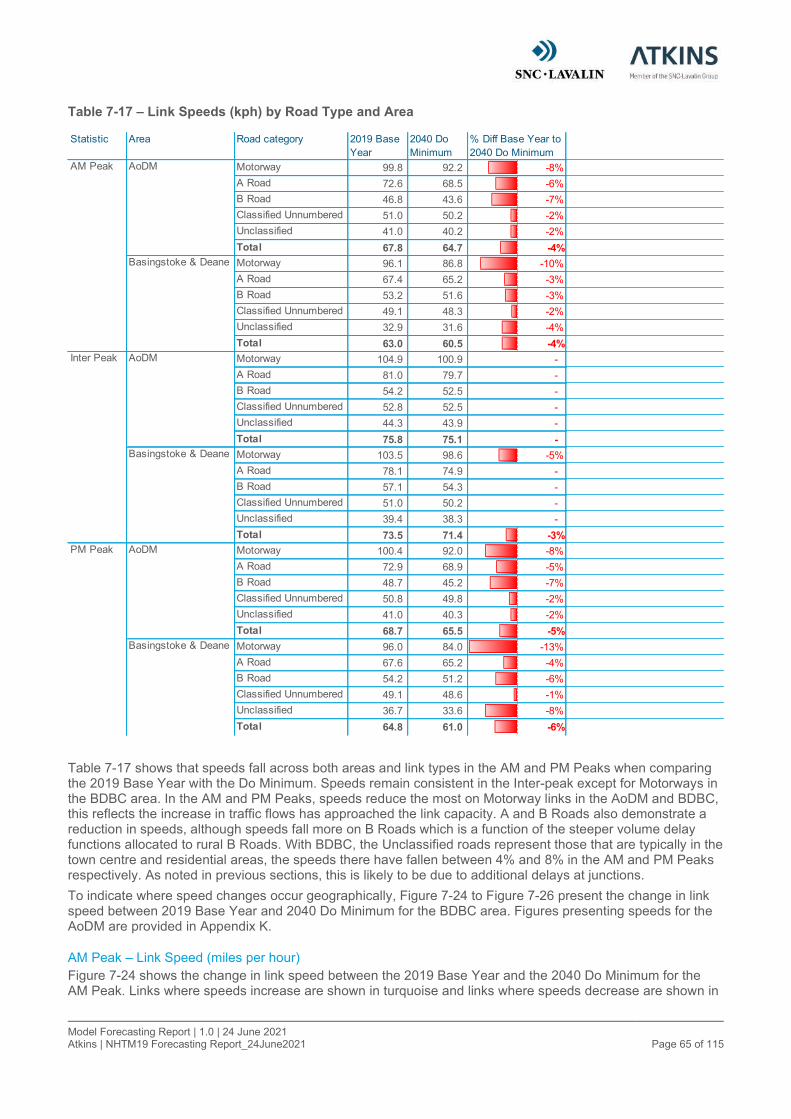
Model Forecasting Report | 1.0 | 24 June 2021 Atkins | NHTM19 Forecasting Report_24June2021 Page 65 of 115
Table 7-17 – Link Speeds (kph) by Road Type and Area
Table 7-17 shows that speeds fall across both areas and link types in the AM and PM Peaks when comparing the 2019 Base Year with the Do Minimum. Speeds remain consistent in the Inter-peak except for Motorways in the BDBC area. In the AM and PM Peaks, speeds reduce the most on Motorway links in the AoDM and BDBC, this reflects the increase in traffic flows has approached the link capacity. A and B Roads also demonstrate a reduction in speeds, although speeds fall more on B Roads which is a function of the steeper volume delay functions allocated to rural B Roads. With BDBC, the Unclassified roads represent those that are typically in the town centre and residential areas, the speeds there have fallen between 4% and 8% in the AM and PM Peaks respectively. As noted in previous sections, this is likely to be due to additional delays at junctions.
To indicate where speed changes occur geographically, Figure 7-24 to Figure 7-26 present the change in link speed between 2019 Base Year and 2040 Do Minimum for the BDBC area. Figures presenting speeds for the AoDM are provided in Appendix K.
AM Peak – Link Speed (miles per hour)
Figure 7-24 shows the change in link speed between the 2019 Base Year and the 2040 Do Minimum for the AM Peak. Links where speeds increase are shown in turquoise and links where speeds decrease are shown in
Statistic Area Road category 2019 Base
Year
2040 Do
Minimum
% Diff Base Year to
2040 Do Minimum
Motorway 99.8 92.2 -8%
A Road 72.6 68.5 -6%
B Road 46.8 43.6 -7%
Classified Unnumbered 51.0 50.2 -2%
Unclassified 41.0 40.2 -2%
Total 67.8 64.7 -4%
Motorway 96.1 86.8 -10%
A Road 67.4 65.2 -3%
B Road 53.2 51.6 -3%
Classified Unnumbered 49.1 48.3 -2%
Unclassified 32.9 31.6 -4%
Total 63.0 60.5 -4%
Motorway 104.9 100.9 -
A Road 81.0 79.7 -
B Road 54.2 52.5 -
Classified Unnumbered 52.8 52.5 -
Unclassified 44.3 43.9 -
Total 75.8 75.1 -
Motorway 103.5 98.6 -5%
A Road 78.1 74.9 -
B Road 57.1 54.3 -
Classified Unnumbered 51.0 50.2 -
Unclassified 39.4 38.3 -
Total 73.5 71.4 -3%
Motorway 100.4 92.0 -8%
A Road 72.9 68.9 -5%
B Road 48.7 45.2 -7%
Classified Unnumbered 50.8 49.8 -2%
Unclassified 41.0 40.3 -2%
Total 68.7 65.5 -5%
Motorway 96.0 84.0 -13%
A Road 67.6 65.2 -4%
B Road 54.2 51.2 -6%
Classified Unnumbered 49.1 48.6 -1%
Unclassified 36.7 33.6 -8%
Total 64.8 61.0 -6%
PM Peak AoDM
Basingstoke & Deane
AM Peak AoDM
Basingstoke & Deane
Inter Peak AoDM
Basingstoke & Deane

Model Forecasting Report | 1.0 | 24 June 2021 Atkins | NHTM19 Forecasting Report_24June2021 Page 66 of 115
beige. Due to the scaling of the coloured bars links with a very nominal change in speed have been shown with no colour change.
Figure 7-24 – Link Speed – AM 2040 Do Minimum compared to 2019 Base Year
Inter Peak – Link Speed (miles per hour)
Figure 7-25 shows the change in link speed between the 2019 Base Year and the 2040 Do Minimum for the Inter-peak.
Figure 7-25 - Link Speed – IP 2040 Do Minimum compared to 2019 Base Year

Model Forecasting Report | 1.0 | 24 June 2021 Atkins | NHTM19 Forecasting Report_24June2021 Page 67 of 115
PM Peak – Link Speed (miles per hour)
Figure 7-26 shows the change in link speed between the 2019 Base Year and the 2040 Do Minimum for the PM Peak.
Figure 7-26 - Link Speed – PM 2040 Do Minimum compared to 2019 Base Year
Comparing Do Minimum to the 2019 Base Year, the speed plots indicate that speeds fall on the M3 in both directions by between 5 and 10mph in the AM and PM Peaks. Speeds are also slow on the A30 Winchester Road towards the M3 as traffic flows increase, the speeds typically fall on the approaches to the junctions as increased flows limit the available capacity. In the AM Peak speeds also fall on A339 Hackwood Road northbound. Traffic speed improves on the approaches to Brighton Hill roundabout as a result of reduced flows through the roundabout due to the introduction of traffic signals which results in traffic rerouting. Speeds fall on the internal links of both Brighton Hill and Thornycroft roundabouts as the signals add to delays for vehicles on the gyratory. Speeds also improve on Roman Road in the AM and PM Peak due to the closure of the junction with A339, consequently traffic seeks alternative routes towards the A339. Speeds change very marginally in the Inter-peak.
7.2.9. Journey Times Table 7-18 to Table 7-20 show the modelled journey time for the 2019 Base Year and 2040 Do Minimum for journeys between key locations in the NHTM study area. Assignment routes between Basingstoke, Hook, Fleet, Andover, Reading and Newbury have been compared between the 2019 Base Year and 2040 Do Minimum. The journey times are based on the assignment result and network conditions in each scenario so the routes compared may differ slightly as routes become more congested and alternatives more attractive to drivers.

Model Forecasting Report | 1.0 | 24 June 2021 Atkins | NHTM19 Forecasting Report_24June2021 Page 68 of 115
Table 7-18 - Journey Times on Key Routes - AM Peak

Model Forecasting Report | 1.0 | 24 June 2021 Atkins | NHTM19 Forecasting Report_24June2021 Page 69 of 115
Table 7-19 - Journey Times on Key Routes – Inter-peak

Model Forecasting Report | 1.0 | 24 June 2021 Atkins | NHTM19 Forecasting Report_24June2021 Page 70 of 115
Table 7-20 - Journey Times on Key Routes – PM Peak
Comparing the 2019 Base Year to the 2040 Do Minimum as expected journey times increase for journeys between all the key locations in the study area, with an average increase of 9% across all time periods. Increases for some movements are higher, in the region of 15% to 26%, the primary reasons are outlined below:
In the AM and Inter-peak, the journey time between Basingstoke, Hook and Fleet to Newbury increases more significantly due to the new signalised roundabouts on the A339 for the North Manydown development
Also in the AM Peak Andover to Newbury increases this is due to the external growth impacting on routes into Newbury, where the model has larger zones and a sparse network, this causes the link flows to approach link capacity resulting in higher delays from the volume delay function
In all peaks journey times increase between Newbury and Reading, in both directions, this is primarily due to increased traffic flow through M4 junction 13 and the additional flows pushing delays up as a result of the volume delay function and link capacity

Model Forecasting Report | 1.0 | 24 June 2021 Atkins | NHTM19 Forecasting Report_24June2021 Page 71 of 115
In the PM Peak journey times increase between Basingstoke and Hook to Andover, this is a result of firstly delays at the M3 junction 6 gyratory impacting journey times outbound from Basingstoke. Both routes experience additional delay on the M3 to A303 diverge lane where flow approaches capacity
Also, in the PM Peak journey times from Reading to Hook and Fleet increase, this is due to additional delays on A33 Basingstoke Road approaching the M4 junction 11 and also additional delays approaching the A33 junction with the B3349 – a known issues throughout the scenarios tested.
7.2.10. Convergence The advice on highway model convergence is set out in TAG Unit M3.1 and is to have
Delta or %GAP which is less than 0.1%, or at least stable with convergence fully documented and all other criteria met;
Percentage of links with flow change (P1) < 1% for four consecutive iterations greater than 98%
Percentage of links with cost change (P2) < 1% for four consecutive iterations greater than 98%
The measures above are defined as follows:
Delta or the percentage GAP is the difference between the costs along the chosen routes and those along the minimum cost routes, summed across the whole network, and expressed as a percentage of the minimum costs.
P1 and P2 are the percentage of links with changes in flow and cost, respectively, less than 1% between successive iterations.
It should be noted that the guidance requires that the criteria for the gap and either P1 or P2 is met. However, to ensure that the best possible level of model convergence and stability is achieved, all three criteria have been targeted for the NHTM model.
The 2040 Do Minimum convergence results are presented in Table 7-21.
Table 7-21 - Link Convergence for 2040 Do Minimum model
Time Period
Assignment Iterations
% Flow % Cost % Gap
(P1) (P2)
AM Peak
13 92.7 98.9 0.031
14 92.6 98.8 0.024
15 92.9 98.8 0.022
16 93.6 98.9 0.017
Inter-peak
4 87.9 99.4 0.018
5 96.1 99.8 0.016
6 98.2 99.8 0.015
7 98.2 99.8 0.015
PM Peak
13 91.4 98.9 0.043
14 90.7 98.9 0.038
15 91.0 98.9 0.034
16 90.8 99.0 0.031
It can be observed that the % GAP and % Cost Change (P2) criteria has been met for the forecast scenario and all time periods. This demonstrates that the model has both a high level of convergence and stability in line with TAG guidance. The % Flow change (P1) criteria has not been completely met and the reason for that are:
TAG only requires the model to comply to either P1 or P2;
This was to reduce model run times; and
The maximum link flow difference between the final and penultimate iteration was only 58 vehicles.
Further analysis has been undertaken to investigate the % Flow change. Assignments for the AM and PM Peaks were carried out, and the assignment stopped before the final iteration i.e. the Do Minimum AM Peak
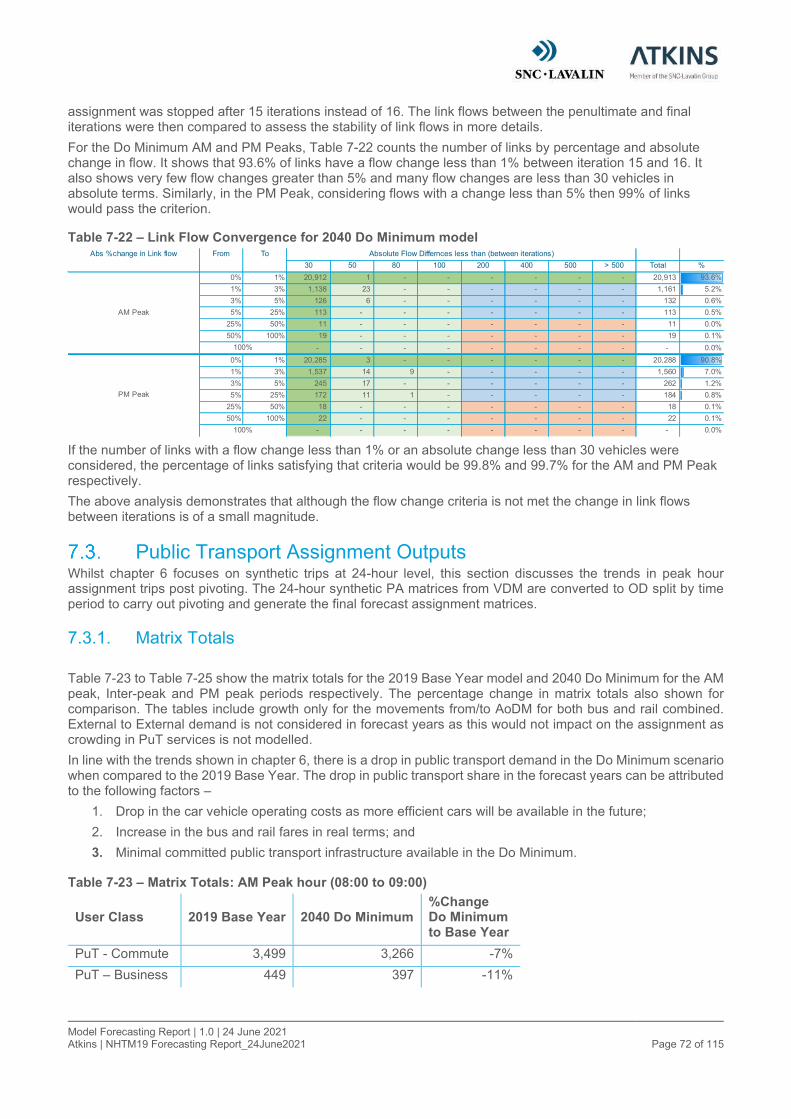
Model Forecasting Report | 1.0 | 24 June 2021 Atkins | NHTM19 Forecasting Report_24June2021 Page 72 of 115
assignment was stopped after 15 iterations instead of 16. The link flows between the penultimate and final iterations were then compared to assess the stability of link flows in more details.
For the Do Minimum AM and PM Peaks, Table 7-22 counts the number of links by percentage and absolute change in flow. It shows that 93.6% of links have a flow change less than 1% between iteration 15 and 16. It also shows very few flow changes greater than 5% and many flow changes are less than 30 vehicles in absolute terms. Similarly, in the PM Peak, considering flows with a change less than 5% then 99% of links would pass the criterion.
Table 7-22 – Link Flow Convergence for 2040 Do Minimum model
If the number of links with a flow change less than 1% or an absolute change less than 30 vehicles were considered, the percentage of links satisfying that criteria would be 99.8% and 99.7% for the AM and PM Peak respectively.
The above analysis demonstrates that although the flow change criteria is not met the change in link flows between iterations is of a small magnitude.
Public Transport Assignment Outputs Whilst chapter 6 focuses on synthetic trips at 24-hour level, this section discusses the trends in peak hour assignment trips post pivoting. The 24-hour synthetic PA matrices from VDM are converted to OD split by time period to carry out pivoting and generate the final forecast assignment matrices.
7.3.1. Matrix Totals
Table 7-23 to Table 7-25 show the matrix totals for the 2019 Base Year model and 2040 Do Minimum for the AM peak, Inter-peak and PM peak periods respectively. The percentage change in matrix totals also shown for comparison. The tables include growth only for the movements from/to AoDM for both bus and rail combined. External to External demand is not considered in forecast years as this would not impact on the assignment as crowding in PuT services is not modelled.
In line with the trends shown in chapter 6, there is a drop in public transport demand in the Do Minimum scenario when compared to the 2019 Base Year. The drop in public transport share in the forecast years can be attributed to the following factors –
1. Drop in the car vehicle operating costs as more efficient cars will be available in the future;
2. Increase in the bus and rail fares in real terms; and
3. Minimal committed public transport infrastructure available in the Do Minimum.
Table 7-23 – Matrix Totals: AM Peak hour (08:00 to 09:00)
User Class 2019 Base Year 2040 Do Minimum %Change Do Minimum to Base Year
PuT - Commute 3,499 3,266 -7%
PuT – Business 449 397 -11%
30 50 80 100 200 400 500 > 500 Total %
0% 1% 20,912 1 - - - - - - 20,913 93.6%
1% 3% 1,138 23 - - - - - - 1,161 5.2%
3% 5% 126 6 - - - - - - 132 0.6%
5% 25% 113 - - - - - - - 113 0.5%
25% 50% 11 - - - - - - - 11 0.0%
50% 100% 19 - - - - - - - 19 0.1%
- - - - - - - - - 0.0%
0% 1% 20,285 3 - - - - - - 20,288 90.8%
1% 3% 1,537 14 9 - - - - - 1,560 7.0%
3% 5% 245 17 - - - - - - 262 1.2%
5% 25% 172 11 1 - - - - - 184 0.8%
25% 50% 18 - - - - - - - 18 0.1%
50% 100% 22 - - - - - - - 22 0.1%
- - - - - - - - - 0.0%
PM Peak
100%
Abs %change in Link flow From To Absolute Flow Differnces less than (between iterations)
AM Peak
100%
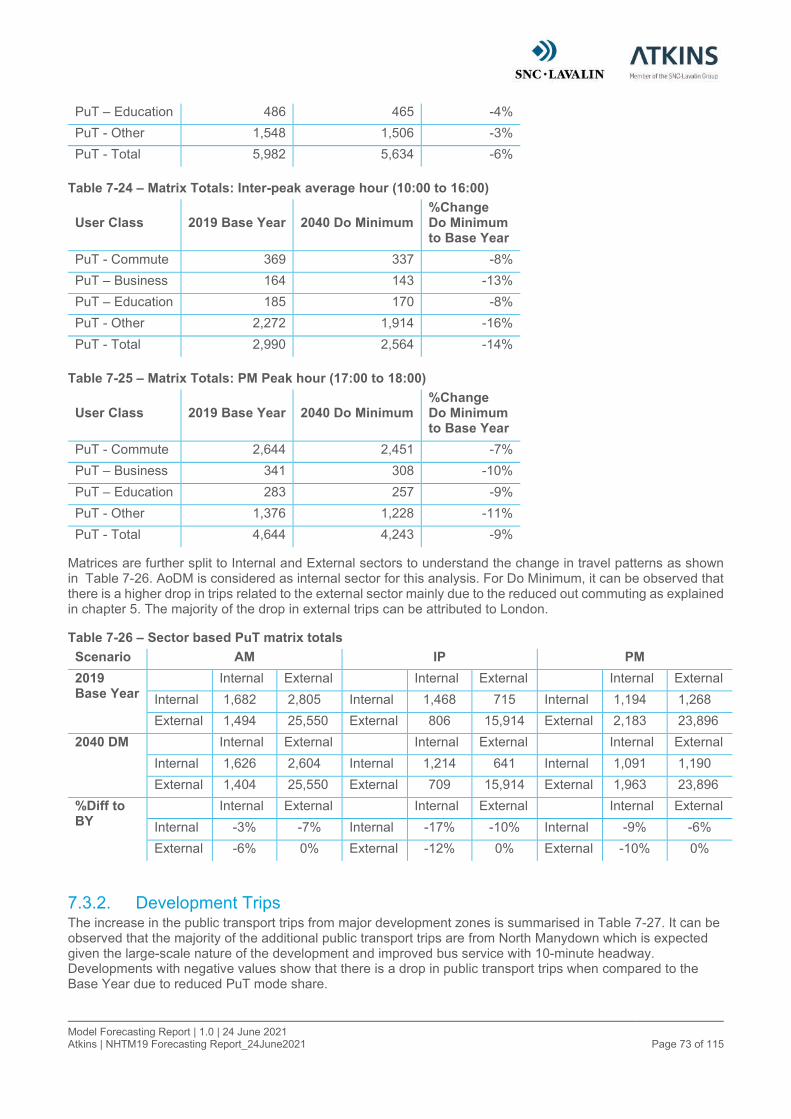
Model Forecasting Report | 1.0 | 24 June 2021 Atkins | NHTM19 Forecasting Report_24June2021 Page 73 of 115
PuT – Education 486 465 -4%
PuT - Other 1,548 1,506 -3%
PuT - Total 5,982 5,634 -6%
Table 7-24 – Matrix Totals: Inter-peak average hour (10:00 to 16:00)
User Class 2019 Base Year 2040 Do Minimum %Change Do Minimum to Base Year
PuT - Commute 369 337 -8%
PuT – Business 164 143 -13%
PuT – Education 185 170 -8%
PuT - Other 2,272 1,914 -16%
PuT - Total 2,990 2,564 -14%
Table 7-25 – Matrix Totals: PM Peak hour (17:00 to 18:00)
User Class 2019 Base Year 2040 Do Minimum %Change Do Minimum to Base Year
PuT - Commute 2,644 2,451 -7%
PuT – Business 341 308 -10%
PuT – Education 283 257 -9%
PuT - Other 1,376 1,228 -11%
PuT - Total 4,644 4,243 -9%
Matrices are further split to Internal and External sectors to understand the change in travel patterns as shown in Table 7-26. AoDM is considered as internal sector for this analysis. For Do Minimum, it can be observed that there is a higher drop in trips related to the external sector mainly due to the reduced out commuting as explained in chapter 5. The majority of the drop in external trips can be attributed to London.
Table 7-26 – Sector based PuT matrix totals
Scenario AM IP PM
2019 Base Year
Internal External Internal External Internal External
Internal 1,682 2,805 Internal 1,468 715 Internal 1,194 1,268
External 1,494 25,550 External 806 15,914 External 2,183 23,896
2040 DM Internal External Internal External Internal External
Internal 1,626 2,604 Internal 1,214 641 Internal 1,091 1,190
External 1,404 25,550 External 709 15,914 External 1,963 23,896
%Diff to BY
Internal External Internal External Internal External
Internal -3% -7% Internal -17% -10% Internal -9% -6%
External -6% 0% External -12% 0% External -10% 0%
7.3.2. Development Trips The increase in the public transport trips from major development zones is summarised in Table 7-27. It can be observed that the majority of the additional public transport trips are from North Manydown which is expected given the large-scale nature of the development and improved bus service with 10-minute headway. Developments with negative values show that there is a drop in public transport trips when compared to the Base Year due to reduced PuT mode share.

Model Forecasting Report | 1.0 | 24 June 2021 Atkins | NHTM19 Forecasting Report_24June2021 Page 74 of 115
Table 7-27 – Outbound public transport development trips
Development Do Minimum – Base Year
AM IP PM
Overton -9 -3 -2
North Manydown 56 17 9
Whitchurch -9 -7 -2
Golf-Hounsome-Kennel 17 6 2
North East Basingstoke 0 0 0
North of Popley/Merton 2 0 0
R2 E2 Basing View 10 5 20
North of Chineham 17 5 8
M3 J7 Distribution centre 1 1 3
Other Development Zones 16 11 19
Total 101 35 58
7.3.3. Overall Network Statistics Public Transport network statistics are extracted for ‘From/To AoDM’ trips for both bus and rail combined to compare the Base Year with the forecast scenario. Overall, the change in the indicators is marginal as shown in Table 7-28 for the Base Year and Do Minimum. As discussed in chapter 6, there has been a reduction in the out commuting trips (mainly to London) and so the average trip length and journey distance have slightly dropped in the forecast scenario when compared to the Base Year.
Table 7-28 – Public Transport Network Statistics
Network Statistic AM4 IP PM
BY DM BY DM BY DM
Mean Journey Time (Min) 51 48 44 42 52 50
Mean In-vehicle Time (Min) 34 32 28 26 34 33
Mean Transfer Wait Time (Min) 1.0 0.9 1.1 1.1 1.1 1.1
Mean Walk Time (Min) 2.3 2.0 3.0 2.7 2.7 2.6
Mean Perceived Journey Time (Min) 98 95 92 87 101 98
Mean Journey Dist (km) 46 45 37 36 50 48
Mean Journey Speed (km/h) 55 56 50 52 57 58
Transfer ratio5 1.3 1.3 1.3 1.29 1.31 1.31
7.3.4. Rail passenger demand
Rail Station Entries/Exits
Entries and Exits at rail stations within AoDM are summarised in Table 7-29 and Table 7-30 respectively. It can be observed that there is a drop in rail patronage for most stations in Do Minimum when compared to the Base Year model. As explained in section 7.3.1, the real terms increase in rail fares has participated in reducing rail demand.
Due to reduced out commuting, a clear drop in trips to London is observed in the AM peak from Basingstoke, Andover, Hook and Fleet. It is also noteworthy that the development trips that are destined to the external sectors using rail is quite insignificant.
4 Base Year and Do Minimum 5 This represents the average number of boarding required per trip
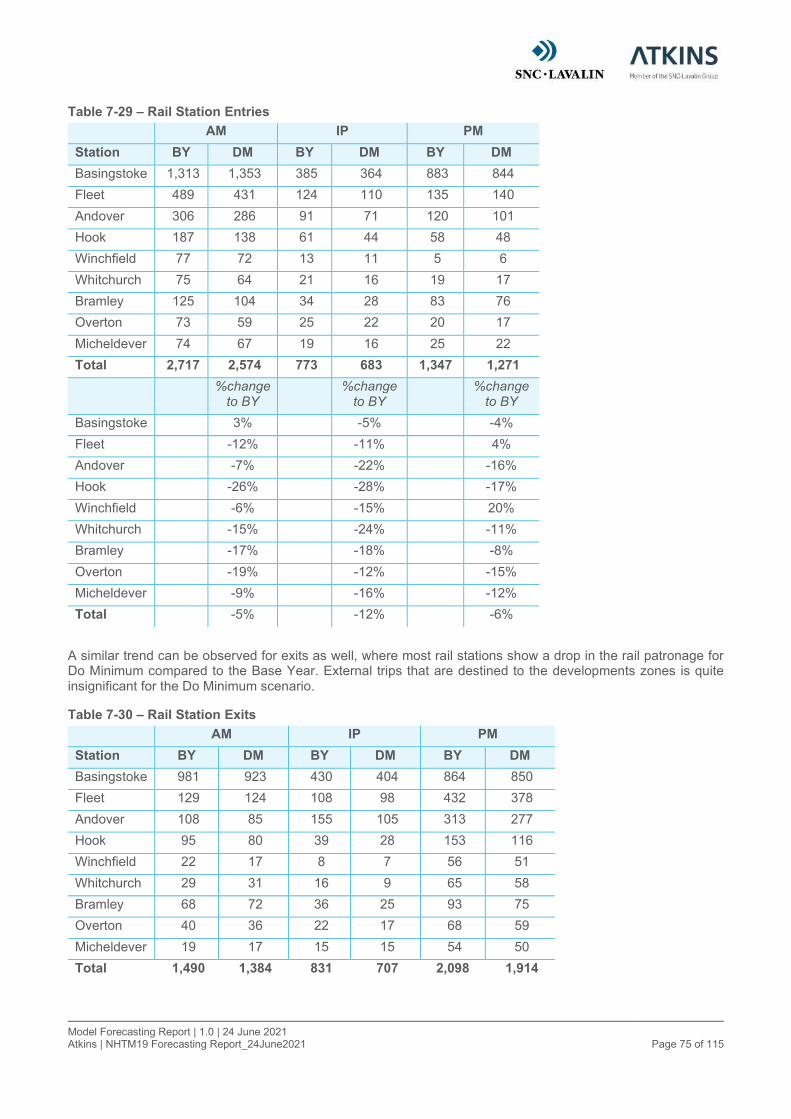
Model Forecasting Report | 1.0 | 24 June 2021 Atkins | NHTM19 Forecasting Report_24June2021 Page 75 of 115
Table 7-29 – Rail Station Entries
AM IP PM
Station BY DM BY DM BY DM
Basingstoke 1,313 1,353 385 364 883 844
Fleet 489 431 124 110 135 140
Andover 306 286 91 71 120 101
Hook 187 138 61 44 58 48
Winchfield 77 72 13 11 5 6
Whitchurch 75 64 21 16 19 17
Bramley 125 104 34 28 83 76
Overton 73 59 25 22 20 17
Micheldever 74 67 19 16 25 22
Total 2,717 2,574 773 683 1,347 1,271
%change to BY
%change to BY
%change to BY
Basingstoke 3% -5% -4%
Fleet -12% -11% 4%
Andover -7% -22% -16%
Hook -26% -28% -17%
Winchfield -6% -15% 20%
Whitchurch -15% -24% -11%
Bramley -17% -18% -8%
Overton -19% -12% -15%
Micheldever -9% -16% -12%
Total -5% -12% -6%
A similar trend can be observed for exits as well, where most rail stations show a drop in the rail patronage for Do Minimum compared to the Base Year. External trips that are destined to the developments zones is quite insignificant for the Do Minimum scenario.
Table 7-30 – Rail Station Exits
AM IP PM
Station BY DM BY DM BY DM
Basingstoke 981 923 430 404 864 850
Fleet 129 124 108 98 432 378
Andover 108 85 155 105 313 277
Hook 95 80 39 28 153 116
Winchfield 22 17 8 7 56 51
Whitchurch 29 31 16 9 65 58
Bramley 68 72 36 25 93 75
Overton 40 36 22 17 68 59
Micheldever 19 17 15 15 54 50
Total 1,490 1,384 831 707 2,098 1,914

Model Forecasting Report | 1.0 | 24 June 2021 Atkins | NHTM19 Forecasting Report_24June2021 Page 76 of 115
%change to BY
%change
to BY
%change to BY
Basingstoke -6% -6% -2%
Fleet -4% -9% -13%
Andover -21% -32% -12%
Hook -16% -28% -24%
Winchfield -23% -13% -9%
Whitchurch 7% -44% -11%
Bramley 6% -31% -19%
Overton -10% -23% -13%
Micheldever -11% 0% -7%
Total -7% -15% -9%

Model Forecasting Report | 1.0 | 24 June 2021 Atkins | NHTM19 Forecasting Report_24June2021 Page 77 of 115
Rail Flow Difference
Flow difference plots also show similar trends as seen in the station entries/exits. Figure 7-27 and Figure 7-28 show a drop in the line loading (shown green) for London mainline in both AM Peak and PM Peak for the 2040 Do Minimum scenario when compared to the Base Year demand.
Figure 7-27 – Rail AM - 2040 DM vs 2019 Base Year
Figure 7-28 – Rail PM - 2040 DM vs 2019 Base Year
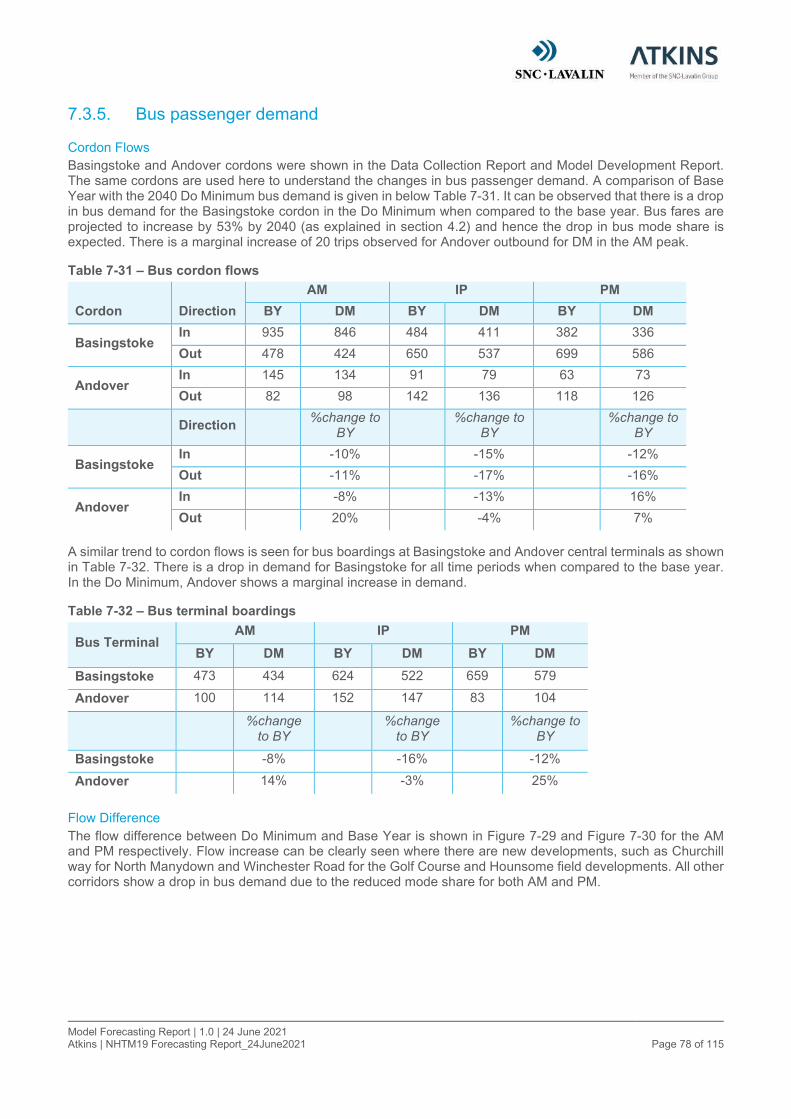
Model Forecasting Report | 1.0 | 24 June 2021 Atkins | NHTM19 Forecasting Report_24June2021 Page 78 of 115
7.3.5. Bus passenger demand
Cordon Flows
Basingstoke and Andover cordons were shown in the Data Collection Report and Model Development Report. The same cordons are used here to understand the changes in bus passenger demand. A comparison of Base Year with the 2040 Do Minimum bus demand is given in below Table 7-31. It can be observed that there is a drop in bus demand for the Basingstoke cordon in the Do Minimum when compared to the base year. Bus fares are projected to increase by 53% by 2040 (as explained in section 4.2) and hence the drop in bus mode share is expected. There is a marginal increase of 20 trips observed for Andover outbound for DM in the AM peak.
Table 7-31 – Bus cordon flows
Cordon Direction
AM IP PM
BY DM BY DM BY DM
Basingstoke In 935 846 484 411 382 336
Out 478 424 650 537 699 586
Andover In 145 134 91 79 63 73
Out 82 98 142 136 118 126
Direction
%change to BY
%change to
BY
%change to BY
Basingstoke In -10% -15% -12%
Out -11% -17% -16%
Andover In -8% -13% 16%
Out 20% -4% 7%
A similar trend to cordon flows is seen for bus boardings at Basingstoke and Andover central terminals as shown in Table 7-32. There is a drop in demand for Basingstoke for all time periods when compared to the base year. In the Do Minimum, Andover shows a marginal increase in demand.
Table 7-32 – Bus terminal boardings
Bus Terminal AM IP PM
BY DM BY DM BY DM
Basingstoke 473 434 624 522 659 579
Andover 100 114 152 147 83 104
%change to BY
%change
to BY
%change to BY
Basingstoke -8% -16% -12%
Andover 14% -3% 25%
Flow Difference
The flow difference between Do Minimum and Base Year is shown in Figure 7-29 and Figure 7-30 for the AM and PM respectively. Flow increase can be clearly seen where there are new developments, such as Churchill way for North Manydown and Winchester Road for the Golf Course and Hounsome field developments. All other corridors show a drop in bus demand due to the reduced mode share for both AM and PM.
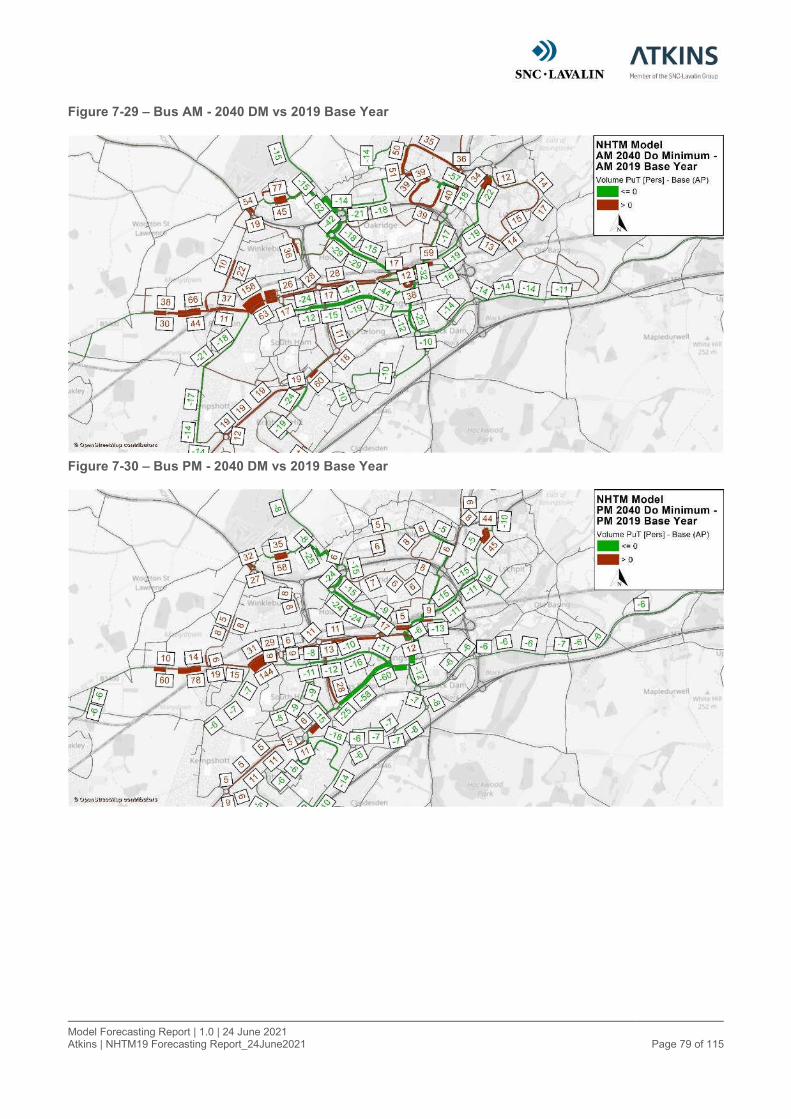
Model Forecasting Report | 1.0 | 24 June 2021 Atkins | NHTM19 Forecasting Report_24June2021 Page 79 of 115
Figure 7-29 – Bus AM - 2040 DM vs 2019 Base Year
Figure 7-30 – Bus PM - 2040 DM vs 2019 Base Year
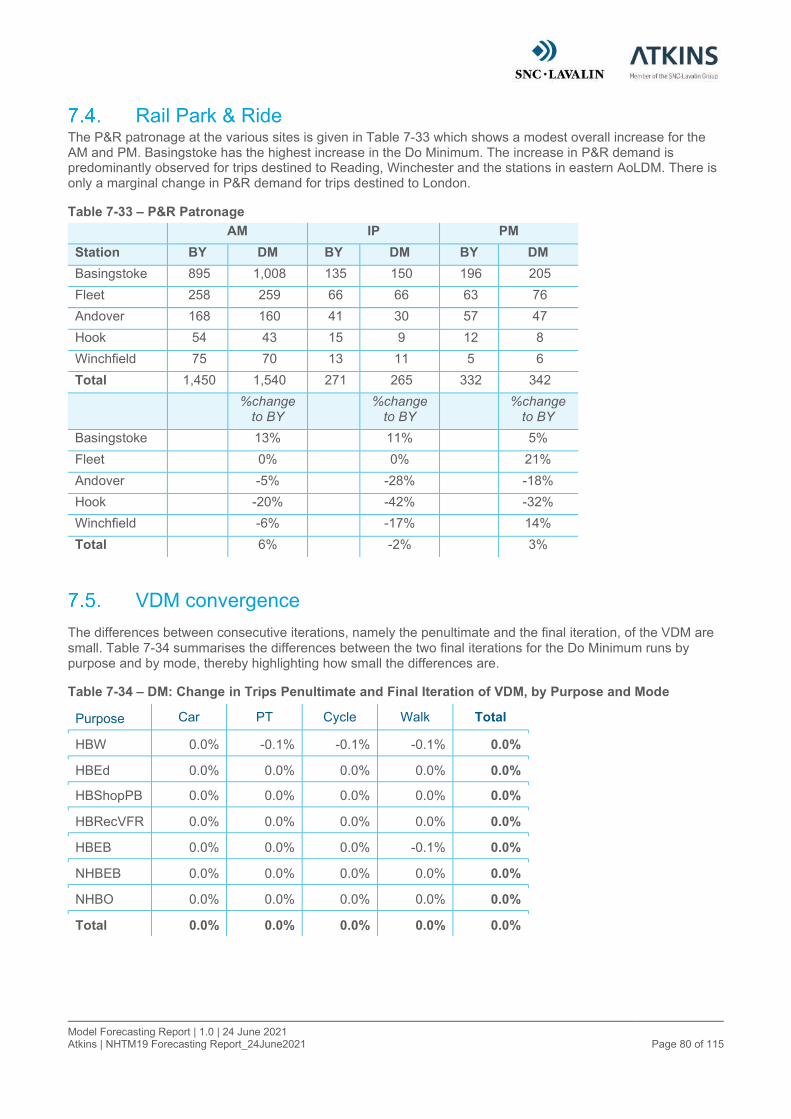
Model Forecasting Report | 1.0 | 24 June 2021 Atkins | NHTM19 Forecasting Report_24June2021 Page 80 of 115
Rail Park & Ride The P&R patronage at the various sites is given in Table 7-33 which shows a modest overall increase for the AM and PM. Basingstoke has the highest increase in the Do Minimum. The increase in P&R demand is predominantly observed for trips destined to Reading, Winchester and the stations in eastern AoLDM. There is only a marginal change in P&R demand for trips destined to London.
Table 7-33 – P&R Patronage
AM IP PM
Station BY DM BY DM BY DM
Basingstoke 895 1,008 135 150 196 205
Fleet 258 259 66 66 63 76
Andover 168 160 41 30 57 47
Hook 54 43 15 9 12 8
Winchfield 75 70 13 11 5 6
Total 1,450 1,540 271 265 332 342
%change to BY
%change
to BY
%change to BY
Basingstoke 13% 11% 5%
Fleet 0% 0% 21%
Andover -5% -28% -18%
Hook -20% -42% -32%
Winchfield -6% -17% 14%
Total 6% -2% 3%
VDM convergence
The differences between consecutive iterations, namely the penultimate and the final iteration, of the VDM are small. Table 7-34 summarises the differences between the two final iterations for the Do Minimum runs by purpose and by mode, thereby highlighting how small the differences are.
Table 7-34 – DM: Change in Trips Penultimate and Final Iteration of VDM, by Purpose and Mode
Purpose Car PT Cycle Walk Total
HBW 0.0% -0.1% -0.1% -0.1% 0.0%
HBEd 0.0% 0.0% 0.0% 0.0% 0.0%
HBShopPB 0.0% 0.0% 0.0% 0.0% 0.0%
HBRecVFR 0.0% 0.0% 0.0% 0.0% 0.0%
HBEB 0.0% 0.0% 0.0% -0.1% 0.0%
NHBEB 0.0% 0.0% 0.0% 0.0% 0.0%
NHBO 0.0% 0.0% 0.0% 0.0% 0.0%
Total 0.0% 0.0% 0.0% 0.0% 0.0%

Model Forecasting Report | 1.0 | 24 June 2021 Atkins | NHTM19 Forecasting Report_24June2021 Page 81 of 115
8. Summary
Summary of the Local Plan Scenario Using the NHTM19, forecasts were carried out for 2040 for a Do Minimum (DM). The DM includes any committed developments with planning permissions adopted in the Local Plan (2011-2029) and all committed schemes including those from Highways England, Network Rail and for North Manydown. The scenario involved the addition of 9,611 dwellings and 5,125 jobs to 2040. The growth in trip making within BDBC was in accordance with the land use in the Local Plan, but outside it was constrained to NTEM.
The benefits of converting NHTM from the dual platform of Saturn and Cube into a single Visum platform is quite significant in terms of seamless operation and ease of use. The linkage to GIS and base mapping graphics for both model demand, highway and public transport networks gives a more realistic and easily recognisable context for the user and for stakeholder. Moreover, the results can be easily analysed for specific users, such as isolating only development trips, or showing the routes taken by traffic related to each development by user class.
Forecast Travel Demand The forecast demand is derived from changes in the population given by anticipated number of dwellings to be built, with anticipated jobs growth identifying how attractions will change for each scenario. For Basingstoke & Deane (B&D), the figures for households and jobs growth were provided by Basingstoke & Deane Borough Council (BDBC) based predominantly on individual development sites. For the rest of the internal area, figures for households and jobs growth were taken from NTEM 7.2.
The household growth provided by BDBC was lower than NTEM estimates whilst the jobs growth was similar to NTEM for the Do Minimum scenario, leading to an imbalance between jobs growth and worker growth.
To resolve the imbalance, small adjustments were made to the following inputs:
1. The proportion of workers in the population was raised above NTEM estimates to provide more workers for the same population growth;
2. The proportion of workers out-commuting was lowered below historic Census 2011 values, so that more local resident workers are available to fill internal jobs; and,
3. The proportion of local jobs filled by in-commuting was raised above Census 2011 values so more internal jobs were filled by external workers.
This comparison and the adjustments made are discussed in more detail in Section 5.1 and Appendix D.
Based on the land use changes provided, the NHTM19 demand model shows a moderate mode shift to Car in the future, with public transport and Walk modes losing mode share. There are various reasons for this which are discussed in the report:
The rise in in-commuting to fill jobs in the Basingstoke area, which is predominantly car based, due to the home locations of the workers.
The underlying trend in car availability predicted by NTEM and used in the land use inputs. People with full car availability are more likely to choose Car mode than those with no car availability, and as car availability is higher in 2040 this leads to Car mode becoming more popular.
Addition of several highway improvement schemes, but limited PT or active mode improvement schemes included in each scenario, combined with increasing PT fares (see Chapter 4).
The rise in PT fares assumed based on historic trends, and the relative decrease in car operating costs due to fuel efficiency and electric vehicles A sensitivity test related to this is shown in Section 6.6.
While Rail P&R showed an increase in patronage, it did not show an increase in mode share – therefore, the increased patronage was a reflection of the increased productions in the Do Minimum scenario compared with the Base Year.
Many of the new developments have a high car mode share, though notably North Manydown and other developments on the edge or within Basingstoke benefit from a higher walk mode share. This is most likely

Model Forecasting Report | 1.0 | 24 June 2021 Atkins | NHTM19 Forecasting Report_24June2021 Page 82 of 115
related to their location, though might also be addressed via improved walking and cycling facilities at other sites.
Assignment Results
Highway assignment
Model assignments have adopted the forecast values of time and vehicle operating cost parameters in line with current TAG values. Committed highway schemes, expected for completion by 2040, have been included in the Do Minimum scenario. The development sites have been coded either as new development zones or added to existing zones depending on the quantum of new homes and jobs. Development sites in the Do Minimum scenario were coded and connected to the existing highway network as outlined in available Planning Application documentation.
Analysis of changes in overall demand between the 2019 Base Year and the 2040 Do Minimum demonstrate growth in total trips of between 19% and 21% in all three model hours. The overall growth is affected mostly by the increases in external traffic through the study area. Analysis shows growth in internal trips (to, from and within BDBC) in the Do Minimum to be between 7% and 11% whereas the external to external growth is ~21% which has an impact on flows and delays along the strategic routes, M3, A303 and A34.
The assignment network statistics results show average travel time and distance increases and average network speeds falling. Total travel time is estimated to increase by 26% to 32% within BDBC between 2019 Base Year and the 2040 Do Minimum scenario and total travel distance set to increase by 21% to 28%. These increases are attributed firstly to the additional traffic on the network from the development and background growth. Secondly travel time increases as a result of additional delays, either from links nearing capacity or junction delays. Within BDBC, the average delay per vehicle kilometre increases between 23% and 35%. Most of the delay increase is attributed to Motorway and A Roads where increased flows result in delays as links approach their theoretical capacity. In roads within Basingstoke delay increases can be attributed to additional congestion at junctions, where average delay increases between 14% and 37%.
In the 2040 Do Minimum, inbound Car traffic across the two Basingstoke screenlines during the AM Peak is higher than outbound flows, reflecting the travel patterns from the VDM i.e. increased in-commuting. Conversely, outbound Car flows in the AM Peak remain relatively unchanged. LGV and HGV flows exhibit the highest growth since they are derived from the National Road Traffic Forecasts 2018 and due to the addition of commercial traffic to the M3 junction 7 and Basing View development site. Inter-peak Car flows increase between 13% and 19% across the two Basingstoke cordons, with growth in inbound and outbound flows evenly balanced. The PM Peak Car flows increase by 11% inbound and between 12% and 15% outbound, again reflecting travel patterns from the VDM with higher flows from the internal to external movements in the PM Peak.
Traffic flows on key corridors increase in line with the development and growth assumptions. Key corridors such as the M3, A34 and A303 exhibit the most significant increases in flows between the 2019 Base Year and 2040 Do Minimum, due to the development traffic plus the more noticeably increase in external to external traffic. Analysis shows roughly one third of the increase in traffic in the AM Peak on the M3 is development related. Traffic flows remain relatively unchanged from the 2019 Base Year on the A33 in the Do Minimum scenario because flow is approaching capacity along the A33 corridor.
Public Transport
The Public Transport schemes identified from the planning applications are minimal. As noted above, the increase in the bus and rail fares in real terms have caused the public transport daily demand to drop in the forecast years. The annual average increase of value of time is about 1.7% whereas the fare is about 1.1% for rail and 2% for bus. Hence the bus becomes more unattractive in the future years when compared to rail. Car becomes more attractive in the future years due to lower operating costs with more fuel-efficient cars being available. Key conclusions drawn from the public transport assignments are as follows:
1. Daily public transport demand drops by about 10% for the Do Minimum when compared to the Base Year;
2. Reduced out commuting to London via rail due to more jobs available within Basingstoke in the forecast year;
3. Higher drop in the public transport demand for trips to the external areas is observed when compared to the internal trips for both the peaks whereas the drop is higher for internal trips in inter peak;

Model Forecasting Report | 1.0 | 24 June 2021 Atkins | NHTM19 Forecasting Report_24June2021 Page 83 of 115
4. For the Do Minimum scenario, most bus corridors show a drop in the demand except where the new development zones are proposed;
5. At daily level, there is a 2% drop in boardings observed for the Do Minimum when compared to Base year for Basingstoke rail station;
6. Overall, there is a 4% increase in Park & Ride daily demand for the Do Minimum when compared to Base year; and,
7. For Basingstoke rail station, there is a 11% increase in Park & Ride daily demand for the Do Minimum when compared to Base year.
Additionally, a sensitivity test where fares are kept constant in real terms is run to understand the impacts of the fare increase. This confirmed that when the fares are kept constant, public transport mode share close to the Base Year mode split can be achieved.
Going Forward We believe that the use of NHTM19 has provided essential insights into the possible future trends in travel demand and mode choice within North Hampshire, and the factors which are driving this. We hope that this is beneficial specifically to the Local Plan process, and also will support strategic planning, scheme development and development control going forward. This is inevitably the beginning of a process of collaboration in gaining the greatest utility possible from the model. With this in mind, we suggest that going forward HCC and BDBC consider making use of the model in the following ways:
Large development sites can be tested using NHTM19 so that the strategic impact can be assessed. This can simultaneously allow consideration of the impact on overall population, workers and jobs, whilst highlighting issues with accessibility in a consistent manner. Initial transport solutions including accessibility for active travel, PT and highway improvements can be scoped. A local spreadsheet or junction modelling approach cannot reflect the impact of the development on strategic rerouting, and changes in destination choice or mode choice. Such a limited analysis can usually overstate the impact of the development; and,
One of the key merits of using NHTM19 is to inform the decision-making process in testing several options during scheme development. This is in contrast to finalising the planning of a scheme and presenting it to NHTM19 for testing. Examples of this could be the testing of different options for the hospital site, or different alignments of the BRT, or various masterplan designs for the substantial South Manydown development.
Having fully developed the NHTM19 and completed the core tests, the model is ready to undertake testing of several schemes under development and alternative scenarios. Our suggestions are given below and we would be happy to discuss, though of course we are eager to discuss HCC and BCBC’s thoughts on priorities:
High priority schemes such as South Manydown with 11,000 residential units and 67 ha of employment, or the relocation of the 840 bed Basingstoke hospital and the Bus Rapid Transit in Basingstoke;
Corridor schemes such as the A33 and A339 or upgrade of the M3 Junction 7 and 8;
Transport Assessments for any considerable development;
A scenario representing the intermediate impact of Covid19 in behavioural and socio-economic terms;
A scenario where the land uses are constrained to NTEM within BDBC as well as outside it. This scenario will be needed for any major scheme business case that required funding; and
The impact of public transport fare increases had a material impact on mode split, whereas car parking and user charges were assumed to remained constant in real terms. It would be useful to test a scenario where car parking and user charges also increase in line with those for public transport.

Model Forecasting Report | 1.0 | 24 June 2021 Atkins | NHTM19 Forecasting Report_24June2021 Page 115 of 115
Dr Anan Allos Atkins Limited One Croydon 12-16 Addiscombe Road Croydon CR0 0XT
Tel: +44 (0)20 8663 5000
© Atkins Limited except where stated otherwise