may 2016 ceri commodity report — natural gas ignition engine.14 most vehicles utilize the...
TRANSCRIPT

Relevant • Independent • Objective
In Ontario, for example, the transportation sector is the single-largest emitter. As of 2013, the sector accounts for 35 percent, followed by industrial emissions at 28 percent and the building sector accounting for 19 percent.3 The transportation sector is also the single-largest emitter in Québec as well.4 In both jurisdictions, the largest slice of the transportation sector is road transportation using gasoline and diesel, with off-road, propane and natural gas, civil aviation, railways and navigation (marine) comprising relatively smaller shares. Not surprisingly, both Ontario and Québec are beginning to address the pollution-related issues of the transportation sector. In addition to both jurisdictions imposing a cap and trade system, similar to California, limiting GHG pollution from industry in the province, both are taking further initiatives to reduce GHG emissions in the transportation sector.5 Ontario’s latest step in fighting climate change is the soon-to-be-released Climate Change Action Plan, building on their new goal of reducing GHG emission 15 percent below 1990 levels by 2020, 37 percent below 1990 levels by 2030 and by 80 percent below 1990 levels by 2050.6 The plan is to transition Ontario households and businesses away from fossil fuels to adopting low- and no-carbon energy, impacting the way Ontarians commute, build and heat their homes. Among the key measures of the Climate Change Action Plan includes a target of 1.7 million electric or hybrid cars on the road by 2024, as well as a five percent cut in carbon emissions from gasoline and diesel.7 The Climate Change Action Plan also indicates that Ontario will spend up to C$100 million to expand the use of electric and natural gas as fuel for trucks, via additional fueling stations province-wide, developed from the input of the Ontario Trucking Association, Union Gas, Enbridge Gas and others.8 In addition, a new Green Commercial Vehicle Program to launch in 2017 will include up to C$170 million in incentives for adopting electric and natural gas commercial vehicles.9 These aforementioned programs are preceded by the “Drive Clean” motor vehicle emissions testing, enacted 20 years ago; Ontario requires that all vehicles seven years old and older must have their cars checked every two years so that emissions do
May 2016
CERI Commodity Report — Natural Gas
Natural Gas Vehicles (NGVs) in Canada Paul Kralovic Jurisdictions eager to address GHG emission issues are increasingly turning their attention to the transportation sector, challenging the sector’s overwhelming use of petroleum-based fuels, such as gasoline and diesel. In Canada, the largest emitter of GHG emissions is the oil and gas sector, followed closely by the transportation sector. Figure 1 illustrates GHG emissions in Canada, by economic sector between 1990 and 2014. With GHG emissions increasing 32 percent between 1990 and 2014 in the transportation sector, it is important to note that while the emissions of passenger vehicles, measured in megatonnes of CO2 equivalent, has decreased (from 51.8 in 1990 to 36.1 in 2014), the GHG emissions from passenger light trucks (from 22.3 in 1990 to 36.1 in 2014) and freight trucks (from 49.7 in 1990 to 54.7 in 2014) has increased.1 Light trucks include the rapidly growing sport utility vehicles (SUVs). Figure 1 Greenhouse Gas Emissions by Economic Sector, Canada, 1990 to 2014
Source: Environment and Climate Change Canada2
CERI Commodity Report – Natural Gas Editorial Committee: Paul Kralovic, Dinara Millington, Megan Murphy, Allan Fogwill About CERI The Canadian Energy Research Institute is an independent, not-for-profit research establishment created through a partnership of industry, academia, and government in 1975. Our mission is to provide relevant, independent, objective economic research in energy and related environmental issues. For more information about CERI, please visit our website at www.ceri.ca or contact us at [email protected].

Relevant • Independent • Objective
Page 2
not exceed government-set standards.10 The Government of Ontario also announced other measures in the February 2016 provincial budget aimed at controlling downstream emissions; motorists will be paying a new gasoline emissions tax in 2017 that will average approximately 4.3 cents/litre.11 For additional information, please refer to the April 2016 issue of CERI Commodity Report – Crude Oil. Québec, on the other hand, has the goal of electric or hybrid vehicles making up 25 percent of all light passenger vehicles, to help reduce GHG emissions by 47.5 percent below 1990 levels by 2030.12 In utilizing alternative fuels for vehicles, many eyes are focused on electric or hybrid cars, particularly with batteries and other forms of energy storage technology becoming cheaper and more reliable. This is led by the industries’ success story, Tesla Motors. But what about natural gas vehicles (NGVs)? While the petroleum-based fuels for vehicles is being challenged, not many are discussing natural gas as a transportation fuel. This article reviews natural gas as a transportation fuel as well as the implementation of NGVs in Canada. Natural Gas as a Transportation Fuel With many applications for end-users, including power generation, space and water heating, the popularity of natural gas is not a surprise. Its use as a transportation fuel is, however, limited. Natural gas use in the transportation sector accounts for only 1 percent; compared to industrial (34 percent), residential (16 percent) and electricity generation (13 percent).13 NGVs use either compressed natural gas (CNG) or liquefied natural gas (LNG), the two terms are not interchangeable. CNG is gas compressed to between 3,000 and 3,600 pounds per square inch (psi), and moves through a pressure regulator and into a spark-ignited or compression ignition engine.14 Most vehicles utilize the spark-ignited engines, working in a similar way to gasoline engines, in that the fuel-air mixture is compressed and ignited by a spark plug.15 Some heavy-duty vehicles utilize the compression ignition engine; these engines use small amounts of diesel fuel to facilitate ignition. As such, some of these engines are considered dual-fuel in that they can burn diesel or natural gas. LNG, on the other hand, is natural gas cooled to -162°C, reducing its volume by a factor of 600 while
turning it into a liquid. The latter is stored in double-walled steel tanks and vapourized before injection into the engine.16 Light- and medium-duty vehicles tend to utilize CNG while heavy-duty vehicles tend to utilize LNG, most likely due to the costs of the LNG storage tanks.17 Medium- and heavy-duty vehicles generally include line haul trucking, return-to-base trucks, transit and shuttle busses, as well as refuse trucks. Many of these are factory-built vehicles and do not include NGVs for specific mining applications, such as in the oil sands industry. Truck manufacturers, such as Kenworth, Peterbuilt and Freightliner specifically manufacture natural gas trucks.18 In addition, Ford and General Motors have added bi-fuel trucks to their inventory of vehicles. Light-duty vehicles, on the other hand, include taxis, courier services and passenger cars. While several manufacturers globally sell bi-fuel passenger cars, including Fiat, Opel/General Motors, Peugeot, Volkswagen, Toyota and Honda, these vehicles are difficult to purchase in North America. The Honda Civic GX was a factory-built NGV manufactured for the North American market but production ended in 2015.19 It is, however, possible to retro-fit gasoline and diesel engines to natural gas. After-market conversions cost approximately C$6,000, but vary depending on the number of storage cylinders.20 Most of the NGV conversions are considered bi-fuel, utilizing both gasoline and natural gas.21 There are several advantages to NGVs. First, with the advent of shale gas, there is an abundance of natural gas in North America, making the fuel affordable. Advances in horizontal drilling, 3-D seismic technology and hydraulic fracturing (fracking) have created a glut of natural gas on the continent. Second, due to high production levels, particularly in the Marcellus Shale, combined with the amount of natural gas in storage, the natural gas is cheap. As of May 2016, the average monthly spot price at Henry Hub is US$1.92 per MMBtu, its lowest point since March 2016 when the natural price ended up at US$1.73 per MMBtu.22 This is the lowest since December 1998.23 The average price of natural gas in filling stations in the Greater Toronto Area is between 10 and 15 percent less than gasoline.24 Third and perhaps the most important from the climate change perspective, it is the cleanest burning fossil fuel, largely due to the fact that natural gas consists primarily of methane, the lowest carbon content of any fossil fuel,

Relevant • Independent • Objective
Page 3
as well as possessing a higher energy content by mass.25 Diesel, on the other hand, for example, contains a long chain of hydrocarbons and a high level of carbon-content aromatics, as well as a lower energy content by mass than natural gas.26 As a result, natural gas combustion reduces carbon emissions by an estimated 20-25 percent compared to conventional fuels.27 NGVs lower emissions of other air contaminants, such as nitrogen and sulfur oxide. CNG produces a 21 percent reduction in GHG emissions on a well-to-wheels lifecycle basis compared to diesel, while LNG produces a 30 percent reduction relative to diesel.28 Argonne National Laboratory's GREET model, however, estimates the life cycle petroleum use and greenhouse gas (GHG) emissions of light-duty vehicles utilizing CNG and LNG, which emit approximately 6-11 percent lower levels of GHGs than gasoline throughout the fuel life cycle.29 These numbers are likely higher for medium- and heavy-duty vehicles. Due to increasingly stringent regulations for all vehicles, the gap between conventional fuel and NGVs is narrowing.30 Because natural gas burns so clean, maintenance costs are also lower for NGVs. Adoption for medium- to heavy-duty NGVs is limited in Canada. Several reasons may be responsible. Implementation There are approximately 22.4 million vehicles globally that utilize natural gas, including 150,000 in the US and 14,000 in Canada.31 The top 6 nations: Iran (4.1 million), China (4.0 million), Pakistan (3.7 million), Argentina (2.5 million), India (1.8 million) and Brazil (1.8 million).32 These nations either possess large natural gas reserves or their governments price CNG lower than gasoline. In Canada, NGVs were first introduced in 1985.33 Backed by federal and provincial assistance, the population of light-duty NGVs grew to 35,000 by the early 1990s; this number, however, declined to approximately 12,000 NGVs as of 2010, including 150 urban transit buses, 45 school buses, 9,450 light-duty cars and trucks and 2,400 forklifts.34 Reflecting the decline in NGVs, the number of refueling stations have declined from 134 in 1997 to 72 in 2010, with the bulk of stations in British Columbia and Ontario. While there has been a slight rebound in the past several years, there are currently 89 stations in Canada.35 This is compared to more than 1,300 NGV fueling stations in the US.36
Despite calls for government support, NGVs in Canada are limited in their implementation. The decline in the use of NGVs in Canada has led to a decrease in natural gas facilities, many of which do not cater to larger fleet vehicles. The majority of NGVs in Canada are fleet vehicles, including refuse trucks, taxi cabs and transit and shuttle buses. Privately-owned passenger vehicles account for a small percentage of use and suffer from a lack of supporting refueling infrastructure. NGVs are also competing with other alternative fuels that are considered ahead of natural gas, including electric cars. While the future of light-duty NGVs is more challenging, that may not entirely be the case, however, for medium- to heavy-duty vehicles. While the majority of NGVs globally are cars or two- and three-wheeled vehicles,37 the future of NGVs in Canada and the US seems to be in medium- to heavy-duty vehicles. Heavy diesel vehicles in Québec, for example, emit 28 percent of the GHGs in the transportation sector in the province, while only accounting for 2 percent of vehicles.38 Not surprisingly, the province is offering tax breaks for LNG trucks. Recall, it was only several years ago when Boucherville-based Robert Transport purchased 180 Peterbuilt LNG trucks from Westport HD.39 The fleet was to be utilized along the Ontario-Québec 401/Highway 20 corridor between Québec City and the GTA. Moving away from petroleum-based fuels to alternative fuels still has an appeal for jurisdictions to lessen the environmental impact of the transportation sector, particularly for fleet vehicles, while meeting increasingly stringent carbon goals. While electric vehicles are drawing more attention, natural gas use in the transportation sector will likely have an increased role in the future.

Relevant • Independent • Objective
Page 4
Endnotes 1Environment and Climate Change Canada, Greenhouse Gas Emissions by Economic Sector, https://www.ec.gc.ca/indicateurs-indicators/default.asp?lang=en&n=F60DB708-1 2ibid 3Ontario Government, Climate Change Strategy, https://www.ontario.ca/page/climate-change-strategy#section-4 4Gaz Metro Transport Solutions, Natural Gas for Heavy Haul Transportation, http://www.gazmetrost.com/images/GMST_ang.pdf 5Ontario Government, Newsroom, Cap and Trade System to Limit Greenhouse Gas Pollution in Ontario, April 13, 2015, https://news.ontario.ca/opo/en/2015/04/cap-and-trade-system-to-limit-greenhouse-gas-pollution-in-ontario.html 6Ontario Government, Climate Change Strategy, https://www.ontario.ca/page/climate-change-strategy#section-4 7The Globe and Mail website, Ontario to spend $7-billion on sweeping climate change plan, May 16, 2016, http://www.theglobeandmail.com/news/national/ontario-to-spend-7-billion-in-sweeping-climate-change-plan/article30029081/ 8Ontario Government, Climate Change Action Plan, https://www.ontario.ca/page/climate-change-action-plan 9Today’s Trucking website, Ontario to Invest in Green Trucks, Natural Gas Network, June 10, 2016, http://www.todaystrucking.com/ontario-to-invest-in-green-trucks-natural-gas-network 10CERI Commodity Report – Crude Oil, Downstream Emissions: Mitigation Efforts in Canada, Jon Rozhon, April 2016. 11ibid 12CBC News, Québec sets bold new greenhouse gas reduction targets, September 17, 2015, http://www.cbc.ca/news/canada/montreal/Québec-greenhouse-gas-reduction-1.3231951 13Canada’s Natural Gas, Supply-Demand, http://www.canadasnaturalgas.ca/supply-demand/ 14Alternative Fuels Data Center, Natural Gas Fuel Basics, http://www.afdc.energy.gov/fuels/natural_gas_basics.html 15Alternative Fuels Data Center, Natural Gas Vehicles, http://www.afdc.energy.gov/vehicles/natural_gas.html 16Alternative Fuels Data Center, Natural Gas Fuel Basics, http://www.afdc.energy.gov/fuels/natural_gas_basics.html 17ibid 18Northwest Territories, Energy Facts, Natural Gas: A Fuel for the Future, 2012, http://www.pws.gov.nt.ca/pdf/EnergyFactSheets/Natural%20Gas%20-%20A%20Fuel%20for%20the%20Future.pdf 19Green Car Report, Honda Civic Hybrid, Natural-Gas Models Eliminated After 2015, June 16, 2015, http://www.greencarreports.com/news/1098733_honda-civic-hybrid-natural-gas-models-eliminated-after-2015 20Natural Resources Canada, Natural Gas – Applications, http://www.nrcan.gc.ca/energy/alternative-fuels/fuel-facts/natural-gas/3527
21Enbridge website, Vehicle Conversions, http://www.ngvontario.com/Views/Vehicle-Conversions.aspx 22US Energy Information Administration, Natural Gas, Henry Hub Natural Gas Spot Price, Monthly, June 2016, http://www.eia.gov/dnav/ng/hist/rngwhhdM.htm 23ibid 24Enbridge website, Fast Facts about Natural Gas Vehicles, http://www.ngvontario.com/Media/ngv_facts124-20952.pdf (pp. 1) 25Natural Resources Canada, Natural Gas Use in the Canadian Transportation Sector: Deployment roadmap, December 2010, http://www.nrcan.gc.ca/sites/www.nrcan.gc.ca/files/oee/pdf/transportation/alternative-fuels/resources/pdf/roadmap.pdf (pp. 6) 26ibid 27Canadian Natural Gas Vehicle Alliance, Vehicles & Stations, http://www.cngva.org/en/home/vehicles-stations.aspx 28Natural Resources Canada, Natural Gas Use in the Canadian Transportation Sector: Deployment roadmap, December 2010, http://www.nrcan.gc.ca/sites/www.nrcan.gc.ca/files/oee/pdf/transportation/alternative-fuels/resources/pdf/roadmap.pdf (pp. 5) 29Alternative Fuels Data Center, Natural Gas Vehicle Emissions, http://www.afdc.energy.gov/vehicles/natural_gas_emissions.html 30ibid 31NGV Journal, Worldwide NGV Statistics, http://www.ngvjournal.com/worldwide-ngv-statistics/ 32ibid 33Alberta Transportation, Natural Gas Vehicles in Alberta, http://www.transportation.alberta.ca/Content/docType57/Production/NGVBrief.pdf (pp. 1) 34Markbek, Study of Opportunities for Natural Gas in the Transportation Sector, March 2010, submitted for Natural Resources Canada, http://www.xebecinc.com/pdf/Marbek-NGV-Final-Report-April-2010.pdf (pp. 9) 35NGV Journal, Worldwide NGV Statistics, http://www.ngvjournal.com/worldwide-ngv-statistics/ 36ibid 37Markbek, Study of Opportunities for Natural Gas in the Transportation Sector, March 2010, submitted for Natural Resources Canada, http://www.xebecinc.com/pdf/Marbek-NGV-Final-Report-April-2010.pdf (pp. 8) 38Gaz Metro Transport Solutions, Natural Gas for Heavy Haul Transportation, http://www.gazmetrost.com/images/GMST_ang.pdf 39Westport website, Westport Announces Robert Transport Order for 180 Peterbilt LNG Trucks Powered by Westport HD Systems, October 28, 2010, http://www.westport.com/news/2010/robert-transport-orders-180-peterbilt-lng-trucks-powered-by-westport-hd-systems

Relevant • Independent • Objective
Page 5
SOU
RC
E: C
ERI,
Pla
tts
Gas
Dai
ly P
rice
Gu
ide.
SO
UR
CE:
CER
I, P
latt
s G
as D
aily
Pri
ce G
uid
e.
SOU
RC
E: C
ERI,
Pla
tts
Gas
Dai
ly P
rice
Gu
ide.
SO
UR
CE:
CER
I, P
latt
s G
as D
aily
Pri
ce G
uid
e.
-202468
10
12
14 Jan
-05
Ju
l-06
Jan
-08
Ju
l-09
Jan
-11
Ju
l-12
Jan
-14
Ju
l-15
Dif
fere
nti
al
Hen
ry H
ub
AE
CO
-C
He
nry H
ub
/A
EC
O-C
Be
gin
nin
g o
f N
ex
t M
on
th
S
po
t P
ric
e (U
S$
/M
MB
tu
)
-7-5-3-113579
11
13
15 Jan
-05
Ju
l-06
Jan
-08
Ju
l-09
Jan
-11
Ju
l-12
Jan
-14
Ju
l-15
Dif
fere
nti
al
Hen
ry H
ub
Ch
icag
o
He
nry H
ub
/C
hic
ag
o
Be
gin
nin
g o
f N
ex
t M
on
th
S
po
t P
ric
e (U
S$
/M
MB
tu
)
-113579
11
13
15 Jan
-05
Ju
l-06
Jan
-08
Ju
l-09
Jan
-11
Ju
l-12
Jan
-14
Ju
l-15
Dif
fere
nti
al
Hen
ry H
ub
Ro
ckie
s
He
nry H
ub
/R
oc
kie
s
Be
gin
nin
g o
f N
ex
t M
on
th
S
po
t P
ric
e (U
S$
/M
MB
tu
)
-113579
11
13
15 Jan
-05
Ju
l-06
Jan
-08
Ju
l-09
Jan
-11
Ju
l-12
Jan
-14
Ju
l-15
Chart
Title
Dif
fere
nti
al
Hen
ry H
ub
So
uth
ern
Califo
rnia
He
nry H
ub
/S
ou
th
ern
C
alifo
rn
ia
Beginning of N
ext M
onth S
pot P
rice (U
S$/M
MB
tu)

CERI Commodity Report - Natural Gas
Page 6
SOU
RC
E: C
anad
ian
Gas
Ass
oci
atio
n.
SOU
RC
E: C
ERI,
Can
adia
n G
as A
sso
ciati
on
, Sta
tisti
cs C
anad
a.
SOU
RC
E: N
OA
A.
SOU
RC
E: C
ERI,
NO
AA
, EIA
.
0
100
200
30
0
400
500
60
0
700
800
JF
MA
MJ
JA
SO
ND
5-Y
ear
Avg
.2015
2016
Ca
na
dia
n H
ea
tin
g D
eg
re
e D
ays
01234567
0
200
40
0
600
80
0
1,0
00
1,2
00 J
an
-09
Jan
-10
Jan
-11
Jan
-12
Jan
-13
Jan
-14
Jan
-15
Jan
-16
Deg
ree D
ays
Co
nsu
mp
tio
n
Ca
na
dia
n H
eatin
g D
eg
re
e D
ays vs R
esid
en
tia
l a
nd
Co
mm
erc
ia
l C
on
su
mptio
n
Deg
ree D
ays
BC
FP
D
0
100
200
300
400
500
600
700
800
900
JF
MA
MJ
JA
SO
ND
5-Y
ear
Avg
.2015
2016
US
H
ea
tin
g D
eg
re
e D
ays
010
20
30
40
50
60
0
20
0
400
600
800
1,0
00
1,2
00 J
an
-09
Jan
-10
Jan
-11
Jan
-12
Jan
-13
Jan
-14
Jan
-15
Jan
-16
Deg
ree D
ays
Co
nsu
mp
tio
n
US
H
ea
tin
g D
eg
re
e D
ays vs
Re
sid
en
tia
l a
nd
C
om
me
rc
ia
l C
on
su
mp
tio
n
Deg
ree D
ays
BC
FP
D
Relevant • Independent • Objective
Page 7
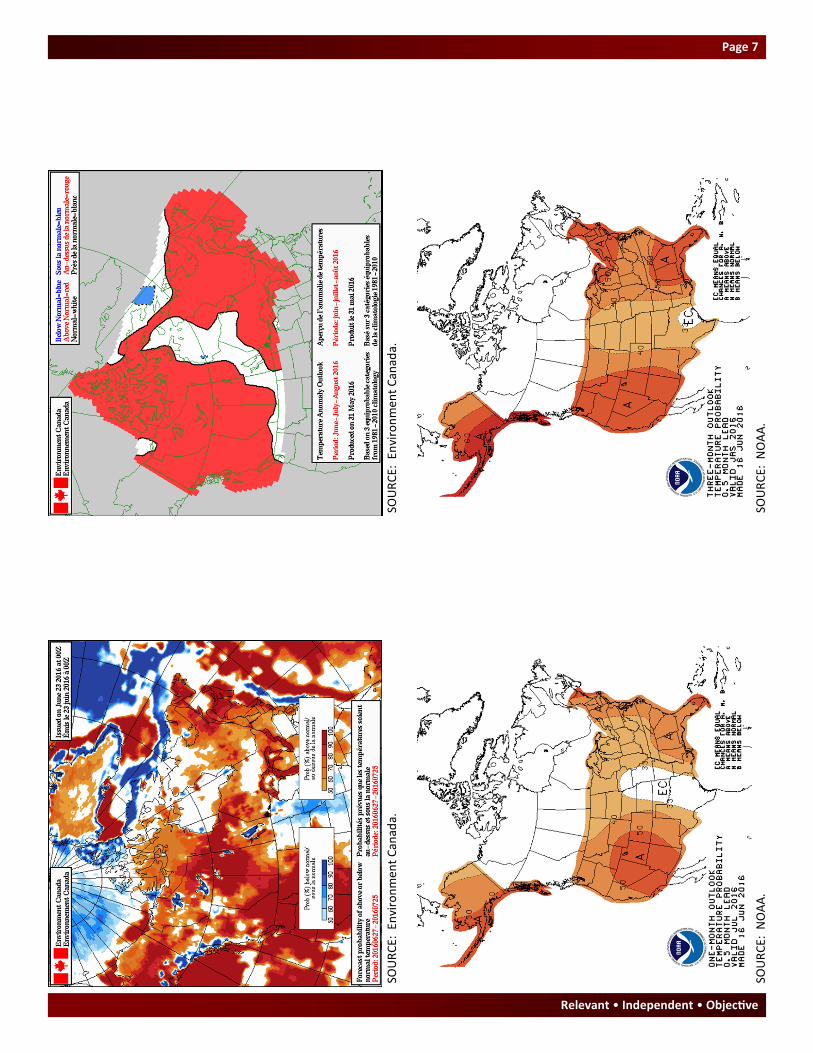
SOU
RC
E: E
nvi
ron
men
t C
anad
a.
SOU
RC
E: E
nvi
ron
men
t C
anad
a.
SOU
RC
E: N
OA
A.
SOU
RC
E: N
OA
A.

CERI Commodity Report - Natural Gas
Page 8
SOU
RC
E: N
OA
A.
SOU
RC
E: E
nvi
ron
men
t C
anad
a.
SOU
RC
E: N
OA
A.

Relevant • Independent • Objective
Page 9
NO
TE:
As
of
Jan
uar
y 2
01
6, S
tats
Can
ch
ange
d t
he
con
ten
t an
d m
eth
od
olo
gy o
f C
anad
ian
nat
ura
l ga
s co
nsu
mp
tio
n.
Use
rs s
ho
uld
use
cau
tio
n c
om
par
ing
curr
ent
dat
a w
ith
his
tori
cal d
ata
SO
UR
CE:
Sta
tisti
cs C
anad
a.
SOU
RC
E: S
tati
stics
Can
ada,
NEB
.
SOU
RC
E: E
IA.
SOU
RC
E: E
IA.
02468
10
12
14
16 J
an
-09
Jan
-10
Jan
-11
Jan
-12
Jan
-13
Jan
-14
Jan
-15
Jan
-16
Ind
ustr
ial &
Po
wer
Co
mm
erc
ial
Resid
en
tial
Ca
na
dia
n C
on
su
mp
tio
n
By S
ector (B
cfp
d)
02468
10
12
14
16
18
20 J
an
-09
Ja
n-1
0J
an
-11
Ja
n-1
2J
an
-13
Ja
n-1
4J
an
-15
Ja
n-1
6
BC
, Y
uko
n, N
WT
AB
SK
E. C
oast
Ca
na
dia
n M
arke
ta
ble
P
ro
du
ctio
n
By P
ro
vin
ce/R
eg
ion (B
cfp
d)
0
20
40
60
80
100
120
140 J
an
-09
Jan
-10
Jan
-11
Jan
-12
Jan
-13
Jan
-14
Jan
-15
Jan
-16
Ind
ustr
ial
Ele
ctr
ic P
ow
er
Co
mm
erc
ial
Resid
en
tial
US
C
on
su
mp
tio
n
By S
ec
tor (B
cfp
d)
0
10
20
30
40
50
60
70
80
90 J
an
-09
Ja
n-1
0J
an
-11
Ja
n-1
2J
an
-13
Ja
n-1
4J
an
-15
Ja
n-1
6
US
To
tal
Lo
uis
ian
aG
OM
Fed
era
l W
ate
rsT
exas
US
M
ark
eta
ble
P
ro
du
ctio
n (B
cfp
d)
CERI Commodity Report - Natural Gas
Page 10
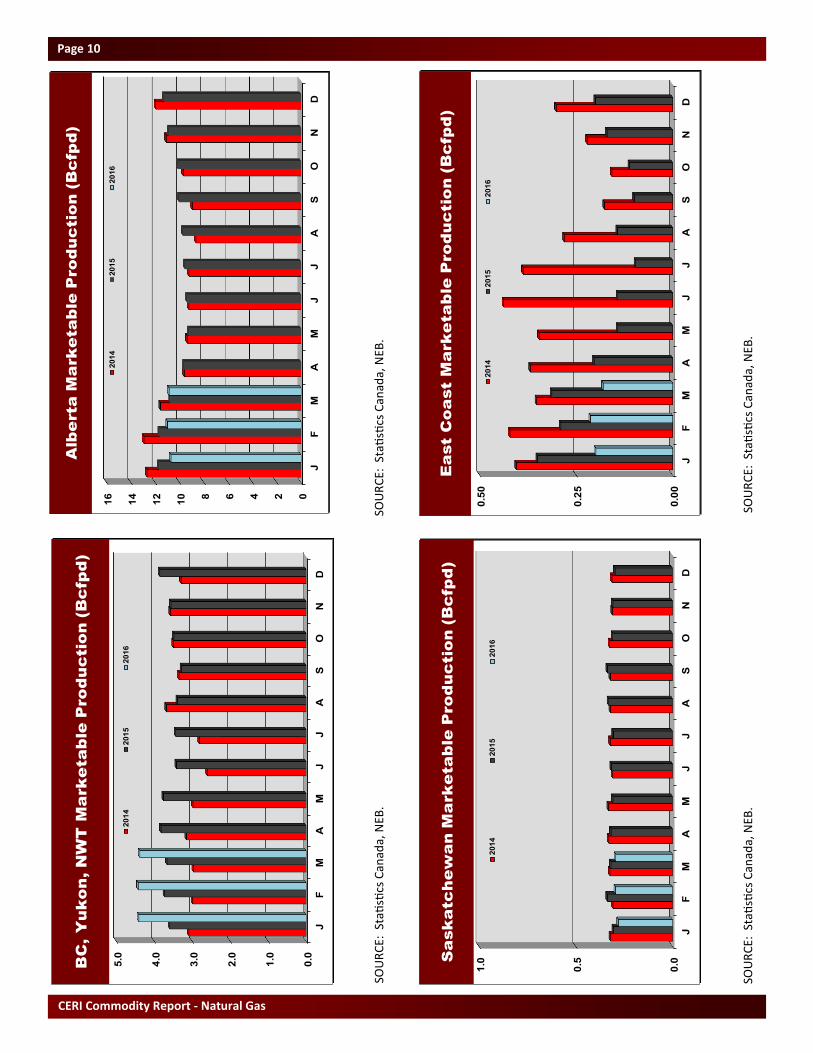
SOU
RC
E: S
tati
stics
Can
ada,
NEB
. SO
UR
CE:
Sta
tisti
cs C
anad
a, N
EB.
SOU
RC
E: S
tati
stics
Can
ada,
NEB
. SO
UR
CE:
Sta
tisti
cs C
anad
a, N
EB.
0.0
1.0
2.0
3.0
4.0
5.0
JF
MA
MJ
JA
SO
ND
2014
2015
2016
BC
, Y
uk
on
, N
WT
M
ark
eta
ble
P
ro
du
ctio
n (B
cfp
d)
02468
10
12
14
16
JF
MA
MJ
JA
SO
ND
2014
2015
2016
Alb
erta
M
ark
eta
ble
P
ro
du
ctio
n (B
cfp
d)
0.0
0.5
1.0
JF
MA
MJ
JA
SO
ND
2014
2015
2016
Sa
sk
atc
he
wa
n M
ark
eta
ble
P
ro
du
ctio
n (B
cfp
d)
0.0
0
0.2
5
0.5
0
JF
MA
MJ
JA
SO
ND
2014
2015
2016
Ea
st C
oa
st M
ark
eta
ble
P
ro
du
ctio
n (B
cfp
d)

Relevant • Independent • Objective
Page 11
SOU
RC
E: C
ERI,
TC
PL,
Wes
tco
ast
Ener
gy.
No
te:
Alli
ance
del
iver
ies
wer
e n
ot
avai
lab
le b
etw
een
Dec
. 1/1
5 a
nd
Jan
. 16
/16
.
SOU
RC
E: C
ERI,
TC
PL,
Alli
ance
Pip
elin
e.
SOU
RC
E: N
EB.
SOU
RC
E: N
EB.
02468
10
12
14
16
JF
MA
MJ
JA
SO
ND
2014
2015
2016
Syste
m F
ie
ld
R
ec
eip
ts
Tra
nsC
an
ad
a +
W
estc
oa
st; M
on
th
ly A
ve
ra
ge
(B
cfp
d)
0123456
Ap
r-15
Ju
n-1
5A
ug
-15
Oct-
15
Dec-1
5F
eb
-16
Ap
r-16
Em
ers
on
Iro
qu
ois
Oth
ers
Nia
ga
ra
Ca
na
dia
n G
as E
xp
orts to
th
e U
S
By E
xp
ort P
oin
t -E
ast (B
cfp
d)
02468
10
12
14
16
Ma
y-1
5J
ul-
15
Se
p-1
5N
ov-1
5J
an
-16
Ma
r-1
6M
ay
-16
Em
pre
ss
McN
eill
AB
-BC
Allia
nce
Alb
erta
S
yste
m D
elive
rie
s (B
cfp
d)
0123456789
10
Ap
r-1
5J
un
-15
Au
g-1
5O
ct-
15
De
c-1
5F
eb
-16
Ap
r-1
6
Kin
gs
ga
teM
on
ch
yE
lmo
reH
un
tin
gd
on
Ca
na
dia
n G
as E
xp
orts to
th
e U
S
By E
xp
ort P
oin
t -W
est (B
cfp
d)

CERI Commodity Report - Natural Gas
Page 12
SOU
RC
E: N
EB.
SOU
RC
E: N
EB.
SOU
RC
E: N
EB, E
IA.
SOU
RC
E: N
EB.
02468
10
12
Ap
r-15
Ju
n-1
5A
ug
-15
Oct-
15
Dec-1
5F
eb
-16
Ap
r-16
We
st
Mid
we
st
Ea
st
US
Im
po
rts o
f C
an
ad
ia
n G
as
By U
S R
eg
io
n (B
cfp
d)
02468
10
12
Ap
r-1
5J
un
-15
Au
g-1
5O
ct-
15
De
c-1
5F
eb
-16
Ap
r-1
6
We
st
Mid
we
st
Ea
st
Ave
ra
ge
C
an
ad
ia
n E
xp
ort P
ric
e
By U
S R
eg
io
n (C
$/G
J)
02468
10
12
14 M
ar-
15
May-1
5Ju
l-15
Sep
-15
No
v-1
5Jan
-16
Mar-
16
Ca
na
da
Me
xic
o
To
ta
l U
S P
ip
elin
e G
as Im
po
rts (B
cfp
d)
01234
Ap
r-15
Ju
n-1
5A
ug
-15
Oct-
15
Dec-1
5F
eb
-16
Ap
r-16
Co
urt
rig
ht
Sa
rnia
St.
Cla
irO
the
r
Ca
na
dia
n G
as Im
po
rts
By Im
port P
oin
t (B
cfp
d)

Relevant • Independent • Objective
Page 13
SOU
RC
E: U
S. D
OE.
SOU
RC
E: U
S D
OE.
SOU
RC
E: U
S D
OE.
No
te:
Ther
e w
ere
no
LN
G im
po
rts
for
the
mo
nth
of
No
vem
ber
20
14
.
SOU
RC
E: U
S D
OE.
02468
10
12
14
16
Ap
r-14
Ju
l-14
Oct-
14
Jan
-15
Ap
r-15
Ju
l-15
Oct-
15
Jan
-16
Ap
r-16
Co
ve
Po
int
Elb
a I
sla
nd
Ev
ere
ttN
E G
ate
wa
yN
ep
tun
e
Ea
ste
rn
U
S L
NG
Im
po
rts B
y F
ac
ility (B
cf)
02468
Ap
r-14
Ju
l-14
Oct-
14
Jan
-15
Ap
r-15
Ju
l-15
Oct-
15
Jan
-16
Ap
r-16
Fre
ep
ort
La
ke
Ch
arl
es
Sa
bin
e P
as
sC
am
ero
nG
old
en
Pa
ss
Gu
lf L
NG
US
G
oM
L
NG
Im
po
rts B
y F
ac
ility (B
cf)
05
10
15
20
Ap
r-14
Ju
l-14
Oct-
14
Jan
-15
Ap
r-15
Ju
l-15
Oct-
15
Jan
-16
Ap
r-16
Oth
er
Nig
eri
aT
rin
ida
dN
orw
ay
Qa
tar
Ye
me
n
US
L
NG
Im
po
rts B
y O
rig
in
(B
cf)
02468
10
12
14
16
18
JF
MA
MJ
JA
SO
ND
20
14
20
15
20
16
Volum
e-W
eighted A
verage LN
G P
rice (U
S$/M
MB
tu)

CERI Commodity Report - Natural Gas
Page 14
SOU
RC
E: U
S D
OE,
NEB
.
SOU
RC
E: U
S D
OE.
SOU
RC
E: E
IA, U
S D
OE.
SO
UR
CE:
US
DO
E.
01234567
Ap
r-1
4J
ul-
14
Oc
t-1
4J
an
-15
Ap
r-1
5J
ul-
15
Oc
t-1
5J
an
-16
Ap
r-1
6
Tu
rke
yB
razil
Eg
yp
tIn
dia
US
L
NG
R
e-E
xp
orts
By D
estin
atio
n (B
cf)
02468
10
12
Ap
r-1
4J
ul-
14
Oc
t-1
4J
an
-15
Ap
r-1
5J
ul-
15
Oc
t-1
5J
an
-16
Ap
r-1
6
Jap
an
Taiw
an
Bra
zil
Ind
iaU
AE
Po
rtu
gal
Arg
en
tin
a
US
L
NG
E
xp
orts b
y D
estin
atio
n (B
cf)

Relevant • Independent • Objective
Page 15
SOU
RC
E: C
ERI,
CA
OD
C, B
aker
Hu
ghes
. SO
UR
CE:
CER
I, C
AO
DC
.
SOU
RC
E: C
ERI,
CA
OD
C.
0
500
1,0
00
1,5
00
2,0
00
2,5
00
3,0
00 Jan
-06
Jan
-07
Jan
-08
Jan
-09
Jan
-10
Jan
-11
Jan
-12
Jan
-13
Jan
-14
Jan
-15
Jan
-16
US
WC
SB
No
rth
A
me
ric
an
A
ctive
R
ig
s
0
100
200
300
40
0
500
60
0
700
80
0
900
1,0
00 Ja
n-0
6J
an
-07
Ja
n-0
8J
an
-09
Ja
n-1
0J
an
-11
Ja
n-1
2J
an
-13
Ja
n-1
4J
an
-15
Ja
n-1
6
Acti
ve
Rig
sT
ota
l R
ig D
rillin
g F
leet
Ca
na
dia
n R
ig
F
le
et U
tiliza
tio
n
We
ek
ly A
ve
ra
ge
A
ctive
R
ig
s
0
100
200
300
400
500
600
700 Jan
-09
Jan
-10
Jan
-11
Jan
-12
Jan
-13
Jan
-14
Jan
-15
Jan
-16
SK
AB
BC
WC
SB
A
ctive
R
ig
s b
y P
ro
vin
ce
We
ek
ly A
ve
ra
ge
-
100
200
300
400
500
600
700
800
15
913
17
21
25
29
33
37
41
45
49
5-Y
ear
Av
g.
2015
2016
We
ste
rn
C
an
ad
a A
ctive
R
ig
s
We
ek
ly A
ve
ra
ge
Week N
um
ber
SOU
RC
E: C
ERI,
CA
OD
C.

CERI Commodity Report - Natural Gas
Page 16
SOU
RC
E: C
ERI,
Bak
er H
ugh
es.
SO
UR
CE:
CER
I, B
aker
Hu
ghe
s.
SOU
RC
E: C
ERI,
Bak
er H
ugh
es.
0%
10%
20%
30
%
40%
50
%
60%
70
%
80%
90
%
100%
0
200
400
600
800
1,0
00
1,2
00
1,4
00
1,6
00
1,8
00
2,0
00
2,2
00
2,4
00 Jan
-06
Jan
-07
Jan
-08
Jan
-09
Jan
-10
Jan
-11
Jan
-12
Jan
-13
Jan
-14
Jan
-15
Jan
-16
Oil-d
irec
ted
Gas-d
irecte
dG
as-d
irecte
d %
US
T
ota
l O
il-
an
d G
as-d
ire
cte
d A
ctive
R
ig
s
0
500
1,0
00
1,5
00
2,0
00
2,5
00 Ja
n-0
6J
an
-07
Ja
n-0
8J
an
-09
Ja
n-1
0J
an
-11
Ja
n-1
2J
an
-13
Ja
n-1
4J
an
-15
Ja
n-1
6
To
tal
Oil
-dir
ec
ted
Go
M G
as-d
irecte
dO
nsh
ore
Ga
s-d
ire
cte
d
US
T
ota
l A
ctive
R
ig
s
0
20
40
60
80
100
120 J
an
-06
Jan
-07
Jan
-08
Jan
-09
Jan
-10
Jan
-11
Jan
-12
Jan
-13
Jan
-14
Jan
-15
Jan
-16
Oil
-dir
ec
ted
Gas
-dir
ec
ted
US
G
ulf o
f M
ex
ic
o A
ctive
R
ig
s

Relevant • Independent • Objective
Page 17
SOU
RC
E: C
ERI,
Pla
tt’s
Gas
Dai
ly.
SOU
RC
E: C
ERI,
Pla
tt’s
Gas
Dai
ly.
SOU
RC
E: C
ERI,
Pla
tt’s
Gas
Dai
ly.
SOU
RC
E: C
ERI,
Pla
tt’s
Gas
Dai
ly.
0
100
20
0
30
0
40
0
500
600
700
800
900
1,0
00
JF
MA
MJ
JA
SO
ND
5-Y
ear
Avg
.2015
2016
Ca
na
dia
n W
ork
in
g G
as S
to
ra
ge
(B
cf, M
on
th
-end)
0
100
200
300
400
500
600
700
800
900
Ma
y-1
5J
ul-
15
Se
p-1
5N
ov-1
5J
an
-16
Ma
r-1
6M
ay
-16
West
East
Ca
na
dia
n S
to
ra
ge
b
y R
eg
io
n (B
cf, M
on
th
-e
nd
)
0
50
0
1,0
00
1,5
00
2,0
00
2,5
00
3,0
00
3,5
00
4,0
00
4,5
00
5,0
00
JF
MA
MJ
JA
SO
ND
5-Y
ear
Avg
.2015
2016
US
L
ow
er-4
8 W
ork
in
g G
as S
to
ra
ge
(B
cf, M
on
th
-e
nd
)
0
500
1,0
00
1,5
00
2,0
00
2,5
00
3,0
00
3,5
00
4,0
00
4,5
00
Ma
y-1
5J
ul-
15
Se
p-1
5N
ov-1
5J
an
-16
Ma
r-1
6M
ay
-16
East
Mid
west
Mo
un
tain
Pacif
icS
ou
th C
en
tral
US
S
to
ra
ge
b
y R
eg
io
n (B
cf, M
on
th
-e
nd
)

CERI Commodity Report - Natural Gas
Page 18
SOU
RC
E: C
ERI,
Pla
tt’s
Gas
Dai
ly.
SOU
RC
E: C
ERI,
Pla
tt’s
Gas
Dai
ly.
SOU
RC
E: C
ERI,
Pla
tt’s
Gas
Dai
ly.
-140
-100
-60
-20
20
60
100
JF
MA
MJ
JA
SO
ND
WC
_IJ
_W
D
5-Y
ear
Avg
.2015
2016
We
ste
rn
C
an
ad
ia
n S
to
ra
ge
In
je
ctio
ns/W
ith
dra
wa
ls
(B
cf, M
on
th
-end)
-100
-80
-60
-40
-200
20
40
60
80
JF
MA
MJ
JA
SO
ND
5-Y
ear
Avg
.2015
2016
Ea
ste
rn
C
an
ad
ia
n S
to
ra
ge
In
je
ctio
ns/W
ith
dra
wa
ls
(B
cf, M
on
th
-end)
-200
-150
-100
-500
50
10
0
15
0
JF
MA
MJ
JA
SO
ND
5-Y
ear
Avg
.2015
2016
Ca
na
dia
n S
to
ra
ge
In
je
ctio
ns/W
ith
dra
wa
ls
(B
cf, M
on
th
-e
nd
)

Relevant • Independent • Objective
Page 19
SOU
RC
E: C
ERI,
EIA
. SO
UR
CE:
CER
I, E
IA.
SOU
RC
E: C
ERI,
EIA
.
-250
-200
-150
-100
-500
50
100
15
0
200
JF
MA
MJ
JA
SO
ND
5-Y
ear
Avg
.2015
2016
US
E
ast S
to
ra
ge
In
je
ctio
ns/W
ith
dra
wa
ls
(B
cf, M
on
th
-end)
-300
-200
-1000
10
0
20
0
30
0
JF
MA
MJ
JA
SO
ND
5-Y
ear
Avg
.2015
2016
US
M
id
we
st R
eg
io
n S
to
ra
ge
In
je
ctio
ns/W
ith
dra
wa
ls
-40
-30
-20
-100
10
20
30
JF
MA
MJ
JA
SO
ND
5-Y
ear
Avg
.2015
2016
US
M
ou
nta
in
R
eg
io
n S
to
ra
ge
In
je
ctio
ns/W
ith
dra
wa
ls
(B
cf, M
on
th
-end)
-80
-60
-40
-200
20
40
60
JF
MA
MJ
JA
SO
ND
5-Y
ear
Avg
.2015
2016
US
P
ac
ific
R
eg
io
n S
to
ra
ge
In
je
ctio
ns/W
ith
dra
wa
ls
(B
cf, M
on
th
-e
nd
)
SOU
RC
E: C
ERI,
EIA
.
CERI Commodity Report - Natural Gas
Page 20
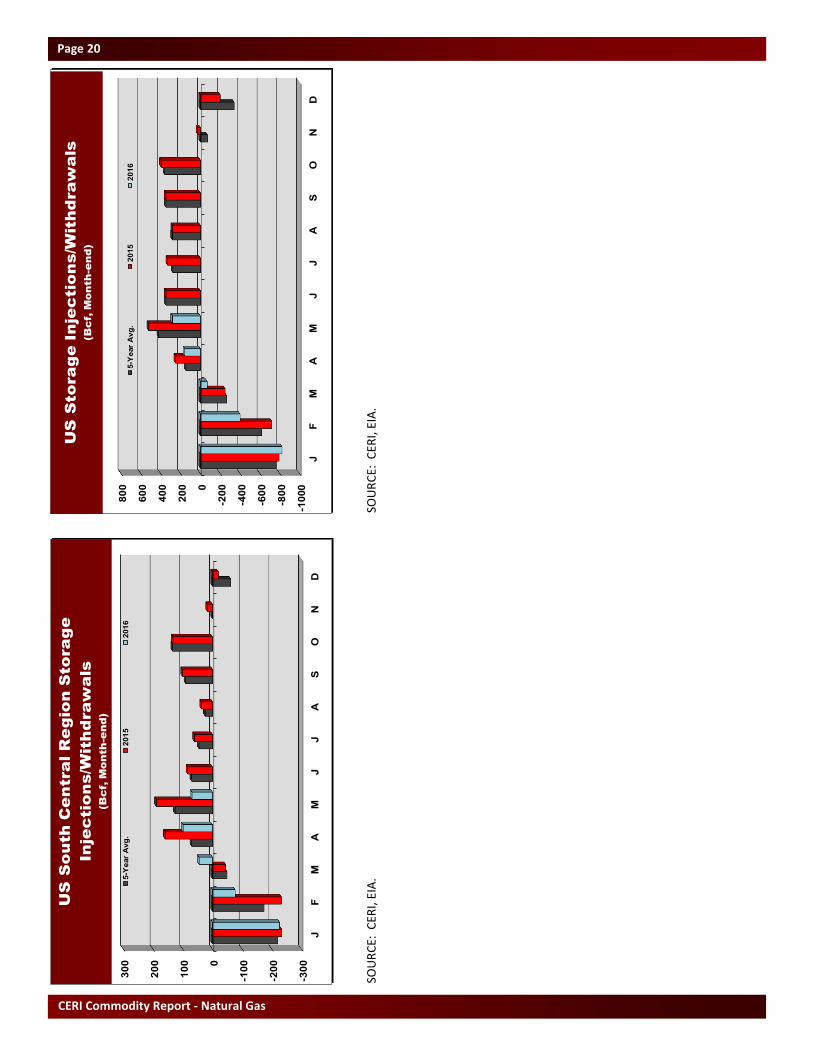
SOU
RC
E: C
ERI,
EIA
. SO
UR
CE:
CER
I, E
IA.
-300
-200
-1000
10
0
200
300
JF
MA
MJ
JA
SO
ND
5-Y
ear
Avg
.2015
2016
US
S
ou
th
C
en
tra
l R
eg
io
n S
to
ra
ge
In
je
ctio
ns/W
ith
dra
wa
ls
(B
cf, M
on
th
-e
nd
)
-1000
-800
-600
-400
-2000
200
400
600
800
JF
MA
MJ
JA
SO
ND
5-Y
ear
Avg
.2015
2016
US
S
to
ra
ge
In
je
ctio
ns/W
ith
dra
wa
ls
(B
cf, M
on
th
-e
nd
)