may - ceri
TRANSCRIPT

@ceri_canada Canadian Energy Research Institute
3512 - 33 Street NW, #150, Calgary, AB T2L 2A6350 Sparks Street, #805, Ottawa, ON K1R 7S8
403.282.1231 | www.ceri.ca | [email protected]
STUDY NO. 195 MAY 2021
CANADIAN NATURAL GAS
MARKET SUPPLY AND
DEMAND PATHWAYS OF
CHANGE

Canadian Natural Gas Market Supply and Demand Pathways of Change Authors: Hamid Rahmanifard, Toufigh Bararpour and Mounika Majeti With contributions from: Madie Zamzadeh and Nurul Hussein Recommended Citation (Author-date style): Rahmanifard, Hamid, Toufigh Bararpour and Mounika Majeta. 2021. “Canadian Natural Gas Market Supply and Demand Pathways of Change.” Study No. 195. Calgary, AB: Canadian Energy Research Institute. https://ceri.ca/assets/files/Study_195_Full_Report.pdf.
Recommended Citation (Numbered style): H. Rahmanifard, T. Bararpour and M. Majeti, “Canadian Natural Gas Market Supply and Demand Pathways of Change,” Canadian Energy Research Institute, Calgary, AB, Study No. 195, 2021. URL: https://ceri.ca/assets/files/Study_195_Full_Report.pdf.
Copyright © Canadian Energy Research Institute, 2021 Sections of this study may be reproduced in magazines and newspapers with acknowledgment to the Canadian Energy Research Institute
May 2021 Printed in Canada
Acknowledgements:
The authors of this report would like to extend their thanks and sincere gratitude to all CERI staff that provided insightful comments and essential data inputs required for the completion of this report, as well as those involved in the production, reviewing and editing of the material, including but not limited to Allan Fogwill, Dinara Millington, Ian Gates, David Layzell, Experience Ikechukwu Nduagu and Mohd Adnan Khan.
Responsibility for any errors, interpretations, or omissions lies solely with CERI.
ABOUT THE CANADIAN ENERGY RESEARCH INSTITUTE Founded in 1975, the Canadian Energy Research Institute (CERI) is an independent, registered charitable organization specializing in the analysis of energy economics and related environmental policy issues in the energy production, transportation, and consumption sectors. Our mission is to provide relevant, independent, and objective economic research of energy and environmental issues to benefit business, Government, academia, and the public. For more information about CERI, visit www.ceri.ca.
CANADIAN ENERGY RESEARCH INSTITUTE 150, 3512 – 33 Street NW, Calgary, Alberta T2L 2A6 Email: [email protected] Phone: 403-282-1231

May 2021
Canadian Natural Gas Market Supply and Demand Pathways of Change i
Table of Contents List of Figures ................................................................................................................................................ ii
List of Tables ................................................................................................................................................ iii
Acronyms and Abbreviations ....................................................................................................................... iv
Chapter 1 Executive Summary ..................................................................................................................... vi
Chapter 2 : Introduction ............................................................................................................................... 1
1.1 Retirement of Coal-Fired Power Plants .............................................................................................. 5
1.2 Petrochemical Facilities ...................................................................................................................... 6
1.3 LNG Plants ........................................................................................................................................... 8
1.4 Decarbonization of Canadian Energy Systems Using Hydrogen ....................................................... 10
1.4.1 Hydrogen Production ................................................................................................................ 11
1.4.2 Hydrogen Transportation and Distribution ............................................................................... 12
1.4.3 Potential Markets for Canadian Hydrogen................................................................................ 14
1.5 Report Structure ............................................................................................................................... 14
Chapter 3 : Additional Natural Gas Demand Estimation ............................................................................ 15
2.1 Retirement of Coal-Fired Power Plants ............................................................................................ 16
2.2 Petrochemical Plants ........................................................................................................................ 16
2.3 LNG Plants ......................................................................................................................................... 17
2.4 Decarbonization of Canadian Energy System Using Hydrogen ........................................................ 17
2.5 Additional Natural Gas Demand at National Level ........................................................................... 21
Chapter 4 : Economic Analysis .................................................................................................................... 24
3.1 Economic Impacts of Natural Gas Production .................................................................................. 24
3.2 Levelized Cost Estimation for Hydrogen Production ........................................................................ 30
3.1.1 Hydrogen Production Cost Analysis .......................................................................................... 32
3.1.2 Sensitivity Analysis .................................................................................................................... 33
Chapter 5 : Conclusions .............................................................................................................................. 36
Bibliography ................................................................................................................................................ 37
May 2021
ii Canadian Energy Research Institute
List of Figures Figure E.1 Additional Natural Gas Demand in Canada................................................................................ vii
Figure E.2 Hydrogen production cost contributions for four case studies; SMR (Current), SMR (Future), PEM (Current) and PEM (Future). ............................................ viii
Figure 1.1 The US dry shale gas production (2006-2020). ............................................................................ 2
Figure 1.2 Canada's natural gas exports and marketable production. ......................................................... 3
Figure 1.3 Canada’s natural gas export and import volumes to the US. ...................................................... 4
Figure 1.4 Coal production (left) and coal consumption for electricity generation (right) by province (2019). ......................................................................................... 6
Figure 1.5 Natural gas demand estimation for new LNG plants in Canada. ............................................... 10
Figure 1.6 A hydrogen supply and demand system. ................................................................................... 11
Figure 2.1 Conceptual illustration of the Evolving scenario. ...................................................................... 15
Figure 2.2 Additional natural gas demand for the retirement of coal power plants. ................................ 16
Figure 2.3 Additional natural gas demand for new LNG plants. ................................................................. 17
Figure 2.4 Additional natural gas demand for hydrogen production. ........................................................ 19
Figure 2.5 Avoided CO2 emission by replacing traditional fuels with hydrogen. ........................................ 20
Figure 2.6 Additional natural gas demand in Canada. ................................................................................ 23
Figure 3.1 Additional natural gas demand for IO analysis, 2021-2030. ...................................................... 26
Figure 3.2 AECO-C natural gas price forecast. ............................................................................................ 27
Figure 3.3: Annual GDP impacts of additional natural gas demand, 2021-2030. ....................................... 28
Figure 3.4: Annual net tax impacts of additional natural gas demand, 2021-2030. .................................. 29
Figure 3.5: The impacts of additional natural gas demand on employment (Jobs) and labour income, 2021-2030. ................................................................ 30
Figure 3.6 Hydrogen production cost contributions for four case studies; SMR (Current), SMR (Future), PEM (Current) and PEM (Future). ............................................. 32
Figure 3.7 The results of sensitivity analysis for Current (a) and Future (b) centralized SMR cases. ......... 34
Figure 3.8 The sensitivity analysis results for Current (a) and Future (b) distributed PEM cases. ............. 35

May 2021
Canadian Natural Gas Market Supply and Demand Pathways of Change iii
List of Tables Table 1.1 Provincial petrochemical plant capacities and feedstock. ............................................................ 6
Table 1.2 New petrochemical projects across Canada. ................................................................................ 7
Table 1.3 LNG liquefaction projects across Canada. ..................................................................................... 8
Table 1.4 CER and CAPP’s scenarios for the Canadian LNG plants. .............................................................. 9
Table 2.1 Displacement shares of traditional fossil fuels with hydrogen in different sectors. .................. 18
Table 2.2 Assumptions to quantify the additional natural gas demand for hydrogen production. ........... 19
Table 2.3 Overseas potential markets for hydrogen. ................................................................................. 21
Table 3.1 Displacement shares of traditional fossil fuels with hydrogen in different sectors (annual basis). ............................................................................. 25
Table 3.2 Input parameters for hydrogen production technologies (SMR and PEM). ............................... 31
Table 3.3 Capital costs for different hydrogen production cases. .............................................................. 31
Table 3.4 Sensitivity analysis parameters for different hydrogen production cases. ................................. 33

May 2021
iv Canadian Energy Research Institute
Acronyms and Abbreviations AB Alberta
AECO Alberta energy company
ATR Autothermal reforming
BC British Columbia
bcfpd Billion cubic feet per day
CAD$ Canadian dollar
CAPP Canadian Association of petroleum producers
CCS Carbon capture and sequestration
CCUS Carbon capture, utilization and storage
CER Canada energy regulator
CERI Canadian energy research institute
CI Carbon intensity
CKPC Canada Kuwait Petrochemical Corp
CO2e Carbon dioxide equivalent used to convey the effect from various GHGs
ETS Exponential smoothing
FRED Federal reserve economic data
GDP Gross domestic product
GHG Greenhouse gas
GJ Gigajoules
HHV Higher heating value
I/O Input/Output
IEA International energy agency
IRR Internal rate of return
kbpd Thousand barrels per day
ktpa Kilotonnes per annum
LCOH Levelized cost of hydrogen
LNG Liquefied natural gas
LOHC Liquid organic hydrogen carriers

May 2021
Canadian Natural Gas Market Supply and Demand Pathways of Change v
MB Manitoba
Mt Megatonnes
Mtpa Megatonnes per annum
NB New Brunswick
NG Natural gas
NGL Natural gas liquids
NL Newfoundland and Labrador
NRCAN Natural Resources Canada
NS Nova Scotia
ON Ontario
PDH Propane dehydrogenation
PEC Photoelectrochemical cells
PEI Prince Edward Island
PEM Polymer electrolyte membrane
PJ Petajoule
PP Polypropylene
QC Quebec
SK Saskatchewan
SMR Steam methane reforming
SOEC Solid oxide electrolysis cells
STCH Solar thermochemical cycles
TRL Technology readiness level
US United States
YK Yukon

May 2021
vi Canadian Energy Research Institute
Executive Summary The US shale boom has made unprecedented impacts on the global energy market. In the past decades, the quantity of unconventional natural gas production has increased significantly in the US. As a result, Canada's natural gas exports have experienced a continuous decline in recent years. Hence, there have been debates on how to maintain growth in the Canadian natural gas industry. As the next few years will be pivotal in the industry's future, the key question is: Considering the vast gas resources in Canada, is it possible to unlock the full economic potential of Canadian natural gas by incorporating new opportunities into the market?
This study focuses on different strategies that can potentially enlarge Canada's natural gas market. In this regard, CERI identifies four areas that can contribute to the additional natural gas demand, including: the retirement of coal-fired power plants, new petrochemical facilities, new liquefied natural gas (LNG) plants, and decarbonization of energy systems with hydrogen that is made from natural gas with carbon capture and storage (CCS). The additional natural gas demand in these areas are quantified for the short-term (2030), mid-term (2040), and long-term (2050) future using the “Energy Futures Outlook 2020 database” (CER 2020a) based on an Evolving scenario. In this scenario, it is assumed that the Government of Canada legislates strict regulations towards addressing climate change, leading to less fossil fuel demand and greater adaptation of low carbon technologies.
Canada has committed to reaching net-zero emissions by 2050 and has already started several activities to achieve this goal. The retirement of coal-fired power plants is one of those activities that can significantly contribute to greenhouse gas (GHG) emission reduction. Natural gas can be an appropriate substitute for coal in the retirement period, as it possesses the lowest global warming potential at the combustion points among different types of fossil fuels. CERI's analysis has shown that replacing coal with natural gas will create about 1 bcfpd additional natural gas demand by 2050. Among Canadian provinces, the coal retirement strategy is expected to considerably increase the natural gas demand in AB, SK, and NS. These provinces are the top coal consumers for electricity generation purposes. New petrochemical plants are another area to generate additional demand for natural gas. CERI anticipates that two new plants (Dow Chemical Canada and Inter pipeline) will be constructed in AB by 2030, which require 0.4 bcfpd natural gas in total as the feedstock. LNG plants are the third area in Canada that require additional natural gas. CERI anticipates that new LNG plants need about 2.5 bcfpd additional gas by 2030, which will grow up to 4.9 bcfpd by 2050.
The decarbonization of energy systems with hydrogen is the fourth area that generates additional natural gas demand. CERI assumes that the conventional fossil fuels used in four sectors: domestic natural gas network (residential, commercial, and industrial), natural gas export network, gas-fired power plants, and transportation (diesel and gasoline), will be partially displaced by hydrogen. It is also assumed that hydrogen is produced using the steam methane reforming (SMR) process1 coupled with a CO2 capture unit with 90% efficiency. Besides, the replacement percentage gradually increases over time. For example, the replacement percentage of the domestic natural gas network will be about 5%, 10% and 20% in 2030,
1 CERI assumes that the SMR efficiency is about 72%. Thus, more natural gas is required to produce hydrogen.
May 2021
Canadian Natural Gas Market Supply and Demand Pathways of Change vii
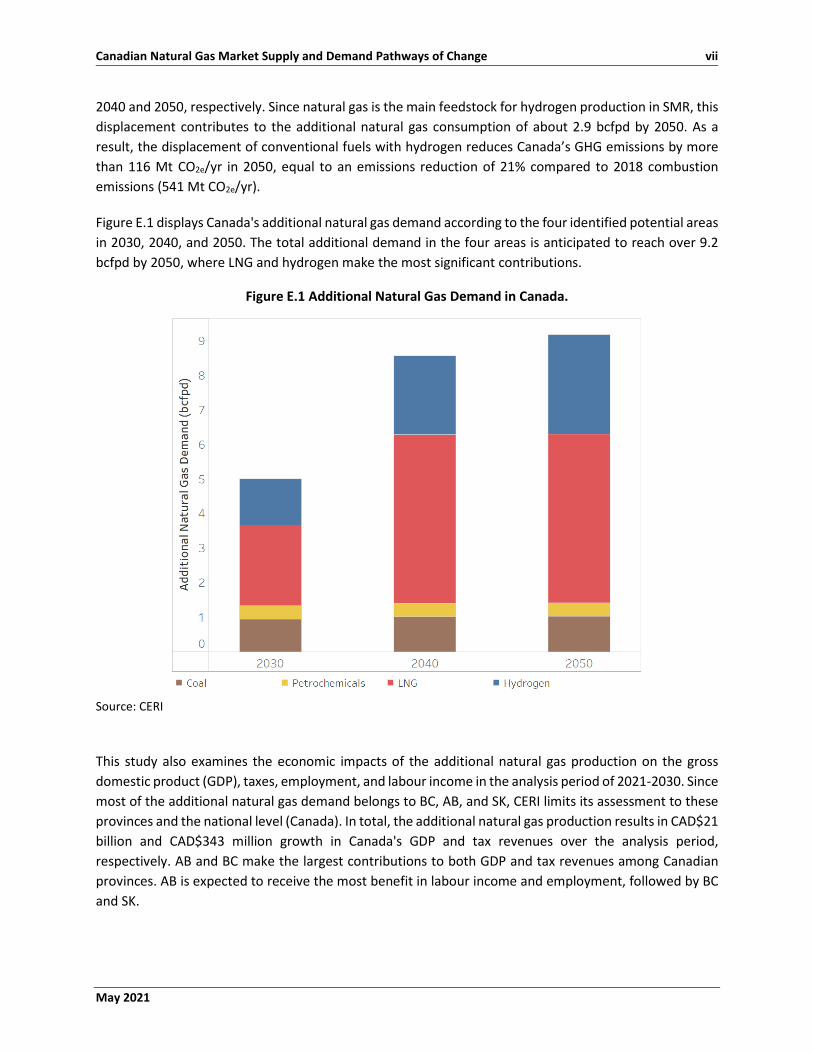
2040 and 2050, respectively. Since natural gas is the main feedstock for hydrogen production in SMR, this displacement contributes to the additional natural gas consumption of about 2.9 bcfpd by 2050. As a result, the displacement of conventional fuels with hydrogen reduces Canada’s GHG emissions by more than 116 Mt CO2e/yr in 2050, equal to an emissions reduction of 21% compared to 2018 combustion emissions (541 Mt CO2e/yr).
Figure E.1 displays Canada's additional natural gas demand according to the four identified potential areas in 2030, 2040, and 2050. The total additional demand in the four areas is anticipated to reach over 9.2 bcfpd by 2050, where LNG and hydrogen make the most significant contributions.
Figure E.1 Additional Natural Gas Demand in Canada.
Source: CERI
This study also examines the economic impacts of the additional natural gas production on the gross domestic product (GDP), taxes, employment, and labour income in the analysis period of 2021-2030. Since most of the additional natural gas demand belongs to BC, AB, and SK, CERI limits its assessment to these provinces and the national level (Canada). In total, the additional natural gas production results in CAD$21 billion and CAD$343 million growth in Canada's GDP and tax revenues over the analysis period, respectively. AB and BC make the largest contributions to both GDP and tax revenues among Canadian provinces. AB is expected to receive the most benefit in labour income and employment, followed by BC and SK.

May 2021
viii Canadian Energy Research Institute
Finally, the levelized cost of hydrogen (LCOH) production in Canada is estimated using the H2A 2019 v3.2018 models developed by NREL for two technologies: SMR and water electrolysis with polymer electrolyte membrane (PEM) (NREL 2021). Two base years are considered the start date of the SMR and PEM plants (i.e., 2019 and 2040). Therefore, CERI considers four case studies to calculate the LCOH, including SMR (2019), SMR (2040), PEM (2019) and PEM (2040). It is assumed that SMR is a centralized plant located in AB with a hydrogen production capacity of 379,387 kg/d. In comparison, PEM is a distributed plant located in AB with a production capacity of 1500 kg/d. CCS cost is also included in the LCOH of the SMR plant. Figure E.2 compares the LCOH of the four cases at an after-tax real internal rate of return (IRR) of 8%.
Figure E.2 Hydrogen production cost contributions for four case studies; SMR (Current), SMR (Future), PEM (Current) and PEM (Future).
Source: CERI Note: Other variable costs consist of different categories such as utility costs (i.e., electricity), royalties, solid waste disposal costs, waste treatment costs, etc.
As seen in Figure E.2, for the Current (2019) and Future (2040) projects, the LCOH changes from CAD$1.9/kg to CAD$2.8/kg for SMR, and CAD$5.3/kg to CAD$5.7/kg for PEM, respectively. Figure E.2 also shows that the feedstock and other variables (mostly utility costs) make the most significant impacts on the LCOH of SMR and PEM, respectively. To further investigate the impact of operating and economic

May 2021
Canadian Natural Gas Market Supply and Demand Pathways of Change ix
parameters on the LCOH, a single variable sensitivity analysis is also conducted for both technologies considering seven key parameters: the operating capacity factor, plant capacity, after-tax real IRR, feedstock consumption, utility consumption, total capital investment and total fixed operating cost. For SMR, the LCOH is highly sensitive to the feedstock consumption and the operating capacity factor, while for PEM, the utility consumption (mostly electricity) greatly affects the LCOH.

May 2021
Canadian Natural Gas Market Supply and Demand Pathways of Change 1
Chapter 1 : Introduction • The US shale revolution has reduced Canada's net natural gas export in recent years. • Four potential areas are identified that can contribute to additional natural gas demand in Canada
over the following decades. • The areas include the retirement of coal-fired power plants, new petrochemical facilities, new LNG
plants, and decarbonization of Canadian energy systems using hydrogen.
Natural gas is supposed to produce less pollution and GHGs compared to its counterparts, as it has smaller carbon footprints at the combustion point. However, there is an ongoing debate regarding its life cycle emissions, especially over the production, delivery, and storage processes. From this viewpoint, depending on the methane leakage rates, the emission intensity of natural gas might be equivalent to coal or oil (Powell 2019). Note that methane's heat-trapping potential is 34 and 86 times greater than carbon dioxide over 100-year and 20-year periods, respectively, which further challenges natural gas privilege compared to other fuels (Myhre and Shindell 2013). The high heat-trapping potential of methane increases the concerns regarding the long-term application of natural gas and lessens its qualification for use as a bridge fuel. However, natural gas can still be a suitable substitute for other harmful fuels (e.g., coal). Furthermore, the lifetime of methane in the atmosphere is shorter than carbon dioxide. Therefore, if the governments are planning to offset carbon footprints later in the century (e.g., by 2100), methane emission will not be a serious issue. Most of the methane emitted today will be inactive by that time (Hausfather 2016). In addition, the recent changes in the methane emission reduction regulations and improvements in the methane detection equipment have further alleviated the concerns.
Moreover, in Canada, methane leakage is below the threshold where life cycle emissions would be equivalent to coal. Therefore, the net environmental benefit of natural gas over coal is maintained when total losses from natural gas systems do not exceed 3% of the total production (CERI 2019b). The natural gas losses in Canada are estimated to be around 1.5% (CERI 2019b).
Natural gas is currently the strongest-growing fossil fuel in North America, and its market share is anticipated to keep expanding over the following decades. In the US, it took most of the coal’s market share and is the largest source of electricity generation in the country (Rapier 2018). With the US shale revolution and developments in natural gas production, North American natural gas markets have had unprecedented growth in production and supply to foreign markets, making the US a net gas exporter in 2017 (CERI 2013). Figure 1.1 shows the production increases in the US natural gas basins, including the prolific Marcellus Play.

May 2021
2 Canadian Energy Research Institute
Figure 1.1 The US dry shale gas production (2006-2020).
Source: (EIA 2021), Figure by CERI
Increased natural gas production in the US adversely affected Canadian gas exports. In recent years (2016-2020), natural gas exports to the US have been decreasing, as shown in Figure 1.2. Although Canada's gas production increased compared to the 2016 level (supported by domestic demand), the net exports dropped from 6.0 bcfpd in 2016 to 4.7 bcfpd in 2020.

May 2021
Canadian Natural Gas Market Supply and Demand Pathways of Change 3
Figure 1.2 Canada's natural gas exports and marketable production.
Source: (StatCan 2021; CER 2020a), Figure by CERI
The US EIA Energy Outlook 2020 forecasts that Canada's net exports will fall from existing levels to less than 2 bcfpd by 2050 (Figure 1.3). It is predicated on the assumption that the US will continue to replace Canadian gas with domestic sources and continue to export gas to markets in ON and QC. ON and QC have historically been large consumers of western Canadian natural gas. However, as the Marcellus in the US is closer to these provinces than the natural gas suppliers in western Canada, the US has become their main natural gas provider. As a result, the TC Energy Mainline's eastward throughput fell from 6 bcfpd in 2006 to 2.7 bcfpd in 2017 (CERI 2019a).

May 2021
4 Canadian Energy Research Institute
Figure 1.3 Canada’s natural gas export and import volumes to the US.
Source: (EIA 2020), Figure by CERI
Although North America is moving towards decarbonization and incorporating more renewable sources in the energy sector, it is anticipated that natural gas will continue to be an essential source of energy in the coming decades (Barth et al. 2020). The growth in population and economy generates more energy demand, to the point that renewables or nuclear will not be able to substitute for all future gas uses and gas-based products. At the same time, the adaptation of energy systems to renewables/nuclear and scaling the zero-emission equipment take some time. Therefore, even in regions with full decarbonization policies, natural gas will continue to remain an important energy source (Barth et al., 2020). Besides, in many industrial processes, replacing natural gas with zero-carbon fuels (e.g., biogas and hydrogen) or renewable electricity is technically challenging or even impossible, especially where natural gas is used as the primary feedstock (Barth et al. 2020).
On the other hand, fossil fuels provide a relatively inexpensive option for their end-users that further challenges their substitution with zero-emission sources. This necessitates gradual employment of clean energy (over a few decades), in parallel with progress attained in zero-emission technologies and cost-saving methodologies. Another sector that is expected to expand the gas market in future is LNG export. Although several LNG projects have been paused recently, CERI anticipates that the few upcoming LNG plants will require significant gas volumes. Note that in the coming years, North America is predicted to

May 2021
Canadian Natural Gas Market Supply and Demand Pathways of Change 5
place on top of LNG exporters in the world, creating more gas demand (Barth et al. 2020). Moreover, natural gas is currently the main feedstock to produce hydrogen (IEA 2019b); thus, it is not expected to see a substantial decline in the domestic natural gas demand even with strict decarbonization policies.
Shrinking Canadian export markets in the US, uncertainty around post-pandemic recovery, and decarbonization of end-use sectors (e.g., transport, industry, buildings, etc.) have raised questions about the future of the Canadian natural gas industry. In this study, CERI intends to identify the main areas that can expand the natural gas market in Canada and generate additional gas demand in the Canadian energy system by 2050. Furthermore, CERI quantifies the required gas volume in each area and assesses its impacts on GDP, tax revenues, labour income, and jobs at the provincial and national levels. The considered areas are categorized as follows and will be discussed in more detail in the report:
• Retirement of coal-fired power plants, • Petrochemical facilities, • LNG plants, • Decarbonization of Canadian energy systems using hydrogen.
Other key questions are also addressed in the report, including the Levelized cost of hydrogen (LCOH) production in Canada and the avoided CO2 emission by incorporating hydrogen in the Canadian energy system.
1.1 Retirement of Coal-Fired Power Plants In 2019, the Canadian coal production was about 57 Mt, where BC had the highest production volume with a share of 48%, followed by AB and SK (NRCAN 2021). About 47% of the Canadian coal was used for thermal applications (e.g., electricity generation), and the remaining for metallurgical purposes (e.g., coking or steelmaking) (NRCAN 2021). Most of the coal produced in BC was metallurgical coal and was not considered in our calculations for replacing with natural gas (Ministry of Energy 2021). AB and SK consumed the largest amount of coal in Canada for electricity generation purposes using coal-fired power plants, with 65% and 17% consumption shares, respectively (Figure 1.4). In Canada, coal-fired power plants generated 7.4% of the total electricity output, consuming 26 Mt of thermal coal in 2018, a 49% decrease from the 2008 level of 50.7 Mt (NRCAN 2021). Coal-based electrical power generation in Canada is planned to be phased out by 2030.

May 2021
6 Canadian Energy Research Institute
Figure 1.4 Coal production (left) and coal consumption for electricity generation (right) by province (2019).
Source: (NRCAN 2021), Figure by CERI Note: The total coal-fired electricity generating capacity in Canada was 8801 MW in 2019 (NRCAN 2021).
1.2 Petrochemical Facilities Canadian petrochemical industry’s output consists mostly of olefins and aromatics’ in three production regions: AB, ON, and QC (CERI 2015b). AB's petrochemical plants are mainly allocated for olefins (92%) production along with aromatics and methanol. ON's petrochemical capacity consists of 60% olefins and 40% aromatics, while QC's petrochemical industry is primarily based on aromatic production (CERI 2015b; 2016). Table 1.1 summarizes plant capacities with the total required feedstock for each province.
Table 1.1 Provincial petrochemical plant capacities and feedstock.
Province Plant Capacity (ktpa)
Feedstock C2, C3+ (kbpd)
Ethylene (ktpa)
Benzene (ktpa)
NG (Mcfpd)
p-xylene/PTA (ktpa)
AB 10,187 255 3,988 365 48,154 - ON 3,537 90 1118 339 - - QC 1,590 - - - - 695
Source: (CERI 2016; 2015b)

May 2021
Canadian Natural Gas Market Supply and Demand Pathways of Change 7
Besides the existing petrochemical plants, new projects have been considered to expand Canada's petrochemical industry, as listed in Table 1.2. The petrochemical projects for Inter Pipeline and Canada Kuwait Petrochemical Corp (CKPC) companies were approved under petrochemical diversification programs (round one) for methane and propane upgrading. The second round of the program was also announced targeting ethane upgrading (Alberta Government 2018).
Table 1.2 New petrochemical projects across Canada.
Company Province Product (ktpa) Feedstock
(kbpd) Comments
Dow Chemical Canada
AB Ethylene
(130) Ethane
(10)
Increasing its ethylene capacity by 130,000 metric tons/year (Boswell 2020; Canadian
Press 2020).
NOVA Chemicals ON Polyethylene -
Building a new polyethylene production facility and expanding the natural gas processing plant to provide feedstock
(Jaremko 2020).
Inter Pipeline AB Polypropylene
(525) Propane
(22)
Canada's first integrated propane dehydrogenation (PDH) and polypropylene
(PP) plant, converting AB’s propane into pellets for plastic products (Jaremko 2019;
Inter Pipeline 2021).
West Coast Olefins BC
Ethylene (1000) and
polyethylene (-)
Natural Gas (-)
The project includes an NGL Recovery Plant to recover ethane, propane, butane and natural gas condensate from Enbridge's
West Coast Pipeline, an Ethylene Plant, and a Polyethylene Plant. The company targets a final investment decision by the end of
2020 with a three-year construction period to bring the facilities into full commercial
operation (Parhar 2019).
Saudi organizations AB - - Opening a C$5-billion - C$10-billion
petrochemical plant in AB (Reuters 2020).
Nauticol Energy AB Methanol
(3000) Natural Gas (52)
Nauticol’s methanol facility will be located in Grande Prairie, AB. This $2-billion plant
will be one of the largest methanol facilities in the world (Nauticol Energy 2018).
Canada Kuwait Petrochemical Corp
(CKPC) AB
Polypropylene (550)
Propane (23)
A propane dehydrogenation (PDH) unit at the integrated PDH plant and polypropylene upgrading facility (Veazey 2020). In March
2020, the project was deferred, with officials citing the coronavirus pandemic
and declining global energy prices (Baumgarten 2020).
Source: CERI

May 2021
8 Canadian Energy Research Institute
1.3 LNG Plants Canadian LNG activities began in 2012 with the proposal of seventeen LNG export facilities as listed in Table 1.3 (NRCAN 2020a). Although dozens of projects have received their export licenses in Canada, many became either inactive or cancelled.
Table 1.3 LNG liquefaction projects across Canada.
Prov Plant Capacity Project
life (Years)
FID Status Operation year Status
NS
Goldboro LNG 10 Mtpa (1.4 Bcf/d) 20 2018, Active 2023 Proposed
Bear Head LNG 12 Mtpa (1.6 Bcf/d) 25 2018, Active 2019-2024 Proposed
H-Energy 15 Mtpa (2.1 Bcf/d) 25
N/A (expected shipments in 2023),
Active
2023 Proposed
QC Saguenay LNG 11 Mtpa (1.6
Bcf/d) 25 Expected in 2020, Active 2025 Proposed
Stolt LNGaz Inc. 0.5 Mtpa (0.7 Bcf/d) 25 - NA Cancelled
BC
Kitimat LNG 10 Mtpa (1.3 Bcf/d) 20 N/A, Active 2029 Proposed
LNG Canada 26 Mtpa (3.5 Bcf/d) 40 Y, Active 2025 Construction
Cedar LNG Project 6.4 Mtpa (0.8 Bcf/d) 25 N/A, Not
active 2025 Proposed
Orca LNG 24 Mtpa (3.2 Bcf/d) 25 N/A, Not
Active 2019 Cancelled
New Times Energy 12 Mtpa (1.6 Bcf/d) 25 Unclear 2019 Cancelled
Kitsault Energy Project
20 Mtpa (2.7 Bcf/d) 20 N/A, Not
active 2019 Cancelled
Stewart LNG Export Project
30 Mtpa (4.0 Bcf/d) 25 N/A, Not
active 2025 Cancelled
Triton LNG (On Hold)
2.3 Mtpa (0.3 Bcf/d) 25 NA NA Cancelled
Woodfibre LNG 2.1 Mtpa (0.3 Bcf/d) 25 Y, Active 2023 Proposed
WesPac LNG Marine Terminal
3 Mtpa (0.6 Bcf/d) 25 NA 2020 Proposed
Discovery LNG 20 Mtpa (2.6 Bcf/d) 25 N/A, not
active 2030 Cancelled
Steelhead LNG: Kwispaa LNG
30 Mtpa (4.3 Bcf/d) 25 N/A, Active NA Shelved
Source: (NRCAN 2020a; GEM 2020; NS DOE 2021; Goldboro LNG 2021; Énergie Saguenay 2021; Hoekstra 2020; Quan 2021; Jang 2015; Woodfibre LNG 2020; Discovery LNG 2021; CERI 2018b) Note: NRCan considered another LNG project (Watson Island) in BC with no additional information, which is not considered in this report (NRCAN 2020a)

May 2021
Canadian Natural Gas Market Supply and Demand Pathways of Change 9
Three public sources in the literature estimate the natural gas demand for new LNG plants in Canada that are supposed to be operational in the future:
• CERI: based on CERI's 2019 oil and gas production forecast (CERI 2019a), • CER: based on Canada's energy future outlook 2020 (CER 2020a), • CAPP: based on the Canadian natural gas demand and production forecast (CAPP 2020).
Note that CER and CAPP provide two scenarios for natural gas demand in new LNG plants, as explained in Table 1.4. Note that the estimates are based on very uncertain data and forecasts.
Table 1.4 CER and CAPP’s scenarios for the Canadian LNG plants.
Source Scenario Explanation
CER Evolving
Assumes less global fossil fuel consumption and greater adaptation of low carbon technologies (lower number of LNG plants).
Reference Assumes greater global fossil fuel consumption and less adaptation of low carbon technologies (higher number of LNG plants).
CAPP
Market Constrained LNG exports are limited to LNG Canada Phase 1 (production trains 1 and 2) and the smaller scale Woodfibre LNG project.
Market Opportunity Supports the environmental benefits of Canada’s LNG. Besides the projects mentioned in the Market Constrained scenario, four more LNG export trains are assumed to be built.
Source: (CER 2020b; CAPP 2020)
Figure 1.5 shows the natural gas demand for the potential LNG plants according to the three sources (CERI, CER, and CAPP). Note that CAPP and CERI forecast the demands until 2035 and 2039, respectively. It is assumed that the demand remains constant after these years until 2050, as shown in Figure 1.5. In this study, the Evolving scenario of CER has been used to estimate the additional natural gas demand for LNG plants.

May 2021
10 Canadian Energy Research Institute
Figure 1.5 Natural gas demand estimation for new LNG plants in Canada.
Source: (CER 2020a; CAPP 2020; CERI 2019a) Note: CAPP-Const (CAPP Constrained Market), CAPP-Oppt (CAPP Opportunity), CER-Evol (CER Evolving), CER-Ref (CER Reference)
1.4 Decarbonization of Canadian Energy Systems Using Hydrogen In 2018, Canada's GHG emissions were 729 Mt CO2e/yr, around 74% of which was associated with fossil fuel combustion (e.g., gasoline, diesel, natural gas, and jet fuel) (NIR 2020; Layzell, Young, et al. 2020). Thus, displacing the fossil-fuel energy carriers (e.g., gasoline, diesel, and natural gas) with low/zero-emission energy carriers plays a significant role in the transition to a net-zero emission future. For this purpose, three options have been recommended for the Canadian energy system (Davis et al. 2018; TSIROPOULOS et al. 2020; Layzell, Young, et al. 2020; Layzell, Lof, et al. 2020; IEA 2019b):
• Electrification of end-use demand using electricity generated with little or no GHG emissions; this option increases the electricity demand significantly (two to three-fold) over the next 30 years. Also, the direct electrification of some sectors, including heavy freight, space heating in cold

May 2021
Canadian Natural Gas Market Supply and Demand Pathways of Change 11
climates, planes, shipping, heavy industries (e.g., steelmaking), and off-road vehicles, is more difficult to achieve,
• Biofuels and bioenergy; considering the world's growing population and expanding economies, the biofuels capacity is limited,
• Hydrogen; this option can be used for clean energy systems due to hydrogen’s four main attributes:
o Hydrogen is light, storable, reactive, and has a high energy content per unit mass, o Hydrogen is currently produced at an industrial scale, albeit a far smaller scale than would
be required to impact energy markets significantly, o Hydrogen can be used without direct GHG emissions, o Hydrogen is produced from different low-carbon energy sources such as renewable
electricity, biomass, nuclear, fossil fuels combined with carbon capture, utilization, and storage (CCUS).
Therefore, as a possible future energy system in Canada, CERI expects hydrogen to displace some traditional fossil fuels in different sectors. Figure 1.6 shows a hydrogen supply and demand system, including hydrogen production, distribution, and the potential domestic and export markets.
Figure 1.6 A hydrogen supply and demand system.
Low Carbon Electricity (wind, solar, hydro, nuclear)
Electrolyzer
Water
Gasifier/Reformer
NG, Biomass, Oil, Coal
CCUS
H2
H2 Pipeline
Comp. H2
Liquid H2
Ammonia and LOHC
H2 Pipeline
NG Pipeline
Blending
NGEnd-Use Consumer
(Residential, Commercial, Industrial, Power Plants)
Fuel Station Transportation
Export Markets
Source: (Layzell, Lof, et al. 2020; Layzell, Young, et al. 2020), Figure by CERI Note: There is another possibility to produce hydrogen as a by-product (e.g., Chlor-alkali process)
1.4.1 Hydrogen Production Hydrogen can be produced from water, fossil fuels (natural gas, oil, and coal), or biomass using commercial technologies such as water electrolysis with proton exchange membrane/polymer electrolyte membrane (PEM), reforming, or gasification. Reforming is the most widespread method for hydrogen production. Three techniques can be identified based on the type of oxidant (IEA 2019b):

May 2021
12 Canadian Energy Research Institute
• Steam methane reforming (SMR) using natural gas and water as the oxidant, • Partial oxidation using heavy fuel oil or coal and air or oxygen as the oxidant, • A combination of both is called autothermal reforming (ATR).
In all cases, a synthesis gas (carbon monoxide and hydrogen) is formed, which is then converted to hydrogen and CO2 in a water-gas shift reaction. The produced hydrogen from natural gas is called either gray hydrogen (by-product CO2 is released into the atmosphere) or blue hydrogen when the reforming is coupled with CCS (Layzell, Young, et al. 2020). Further details about the reforming processes are provided in the literature (IEA 2019b; Ruth et al. 2020; Ramsden, Ruth, and Diakov 2013).
Water electrolysis is an electrochemical process that produces hydrogen by splitting water into oxygen and hydrogen (IEA 2019b). There are three main electrolyzer technologies, namely, alkaline electrolysis, PEM electrolysis, and solid oxide electrolysis cells (SOECs), where PEM electrolysis is better suited for intermittent power sources (solar and wind) (Ramsden, Ruth, and Diakov 2013; Layzell, Young, et al. 2020). Hydrogen produced from water electrolysis using zero/low carbon electricity is called green hydrogen as there is no CO2 emission associated with the hydrogen production process.
Although electrolysis is a commercial technology, it plays a minor role in total hydrogen production (around 0.1% of dedicated global hydrogen production), which is mostly in the Chlor-alkali industry as a by-product (IEA 2019b). Further details about the electrolysis processes are provided in the literature (IEA 2019b; Ruth et al. 2020; Ramsden, Ruth, and Diakov 2013).
There are other non-commercial processes, such as methane pyrolysis to hydrogen, photoelectrochemical cells (PEC), solar thermochemical cycles (STCH), carbon black, tri-reforming, and underground production of hydrogen from hydrocarbon resources (e.g., oil sands or coal), being actively developed by various technology vendors (Proton Technologies 2020; Layzell, Young, et al. 2020; Ramsden, Ruth, and Diakov 2013; Świrk, Grzybek, and Motak 2017).
Canada currently generates 8,200 t H2/day (3 Mtpa) using natural gas via the SMR process and releases the produced CO2 into the atmosphere (Layzell, Young, et al. 2020). The produced hydrogen plays a significant role in the Canadian energy systems as an industrial feedstock for different processes, including ammonia fertilizer and methanol production, bitumen conversion to synthetic crude oil, and oil refining to transportation fuels (IEA 2019b; Layzell, Young, et al. 2020).
1.4.2 Hydrogen Transportation and Distribution Transportation and distribution of gaseous hydrogen are inefficient and costly due to its low energy density. To overcome this issue, hydrogen is either compressed, liquefied, converted to ammonia, or incorporated into larger molecules, i.e., liquid organic hydrogen carriers (LOHCs) (IEA 2019a). For hydrogen's local distributions in the regions where there is sufficient demand, pipeline seems the most cost-effective long-term option. However, currently, trucks are mostly used for this purpose and are expected to remain the first choice over the next decades until pipelines come into service extensively. For long distances, shipping would be the most reasonable way to transport hydrogen either in the liquefied form or as ammonia and LOHCs (IEA 2019a). According to an International Energy Agency (IEA)

May 2021
Canadian Natural Gas Market Supply and Demand Pathways of Change 13
study, a pipeline is the cheapest option for distances shorter than 1500 km, whereas, for distances over 1500 km, shipping would be more cost-effective (IEA 2019a).
The existing natural gas pipeline infrastructure can be used to transport hydrogen. However, it requires significant modifications in network components, operation, and maintenance service due to the differences between hydrogen and natural gas properties. Some of the key differences are summarized as follows:
• Energy content: On a mass basis, hydrogen is two times more energy-dense than methane; however, on a volume basis, hydrogen is about one-third less energy-dense than methane. Thus, more hydrogen flow rate is required to deliver the same energy (e.g., heat) as methane to the end-users (Goldmeer 2019). For example, if hydrogen is blended with natural gas at 20% by volume, the pipelined gas flow rate should rise by around 15% to provide the same energy delivery (PG&E 2018).
• Safety issues: Hydrogen has smaller molecules than natural gas and can easily permeate seals and plastic pipes. It also accelerates crack growth in steel and expedites steel's embrittlement (GDM 2020). Besides, hydrogen has no odour and ignites rapidly in the presence of oxidants with a nearly invisible flame, necessitating advanced leak detection systems (GDM 2020).
• Flame speed: Hydrogen flame speed2 is about four times faster than natural gas’s, which will increase the upstream flame propagation in an unmodified combustor affecting its combustion and heat transfer efficacy (from the combustion zone into the premixing zone near the fuel nozzles) (Goldmeer 2019).
There is an option to blend hydrogen with natural gas and pass the mixture through the pipeline to lessen these issues. However, this option has several limitations as well. At the demand points, hydrogen should be either separated again or consumed directly in a mixture with natural gas. Even in the current stage of development, the separation of hydrogen from natural gas is a costly process. Also, the direct consumption of the mixture in the end-used applications requires major modifications or adaptations in the appliances (GDM 2020). On the other hand, additional considerations are required regarding the hydrogen concentration in the pipeline, as it should not go beyond a specific limit. Otherwise, it may cause the same detrimental effects on the pipeline as pure hydrogen causes (e.g., leakage and steel failure and crack).
The pipeline's maximum operating pressure and regional specification determine the hydrogen content's limit in the mixture (PG&E 2018). A National Research Council (NRC) recent study reported that with a 5% hydrogen content, no significant modifications are required in either the pipeline network or end-use appliances (GDM 2020). At this concentration, up to 76% of the current natural gas infrastructures in Western Canada could be used to carry the natural gas/hydrogen mixture (GDM 2020). In the first quarter of 2021, ATCO will blend hydrogen derived from domestically produced natural gas into a subsection of its Fort Saskatchewan natural gas distribution system at a concentration of 5% by volume (ATCO 2021). NRC also reported that in the regional transmission pipelines with no critical downstream infrastructure, even reaching up to 20% concentration is possible. For concentrations over 20%, further development of
2 The flame speed is the velocity at which the unburned gases propagate into the flame in a combustion reaction.

May 2021
14 Canadian Energy Research Institute
standards and additional considerations are required. For example, pipelines built in Canada before 1980 are not suitable to transport mixtures with over 20% blended hydrogen. Also, pipelines designed for sour natural gas are more appropriate to transport mixtures with high hydrogen content (GDM 2020).
1.4.3 Potential Markets for Canadian Hydrogen The potential hydrogen markets in a future net-zero emission energy system include:
• The natural gas network, including the space heating and heavy industry markets currently served by natural gas and coal,
• The transportation markets consisting of diesel (freight, trains, shipping), and gasoline markets (fleet vehicles),
• The natural gas export markets to the US, • The growing overseas hydrogen and ammonia markets.
1.5 Report Structure This study is divided into four chapters, with Chapter 1 setting the scene by illustrating the research questions and objectives of the study. Chapter 2 presents a scenario-based additional demand outlook for natural gas over the following decades. The economic analysis, including the economic impacts of the additional natural gas production and the LOCH for SMR and PEM plants, is presented in Chapter 3. Economic impacts include economy-wide impacts such as value-added gross domestic product (GDP), employment, taxes, and labour income. Finally, Chapter 4 summarizes the results.

May 2021
Canadian Natural Gas Market Supply and Demand Pathways of Change 15
Chapter 2 : Additional Natural Gas Demand Estimation
• The total additional natural gas demand in the four areas is anticipated to reach over 9.2 bcfpd by 2050.
• New LNG plants and decarbonization of energy systems with hydrogen make the largest contribution to the total additional gas demand.
• Among Canadian provinces, BC makes the most significant contribution to the additional gas demand in new LNG plants, whereas AB has the largest share in other areas.
• Displacement of conventional fuels with hydrogen is anticipated to reduce GHG emissions over 116 Mt/year by 2050.
This chapter studies the potential areas that generate additional natural gas demands in the Canadian energy systems. The identified areas are the retirement of coal power plants, new petrochemical plants, new LNG plants, and the decarbonization of Canadian energy systems with hydrogen. The additional natural gas demand in these areas is quantified for the short-term (2030), mid-term (2040), and long-term (2050) using the Energy Future Outlook 2020 database (CER 2020a) based on an Evolving scenario. The Evolving scenario assumes that Canada moves towards using low-carbon fuels and energy sources in the coming years. As a result, fossil fuel consumption will decline. According to this scenario, policies and agreements are strengthened towards addressing climate change (Figure 2.1).
Figure 2.1 Conceptual illustration of the Evolving scenario.
Source: Adapted from (CER 2020a)

May 2021
16 Canadian Energy Research Institute
2.1 Retirement of Coal-Fired Power Plants CERI assumes that the coal consumption for electricity generation will be replaced with natural gas to quantify the additional natural gas demand for coal-fired power plant retirement. For this quantification, CERI uses the energy consumption reported by CER for "Coal, Coke and Coke Oven Gas" under the "Electric Generation" category (CER 2020a). First, the displaced coal energy is estimated and then, using the natural gas higher heating value (HHV) of 40.57 (MJ/m3), the equivalent natural gas demand is quantified (NREL 2021). Figure 2.2 shows the additional natural gas demand for displacing coal power plants with natural gas plants.
As seen in Figure 2.2, the additional natural gas demand for coal displacement will reach about 1 bcfpd by 2050. The government of Canada plans to eliminate coal-fired electricity by 2030 in AB and SK. For the eastern provinces (NS and NB), the phase-out of coal power plants is expected to continue until 2050, though at a very small scale (less than 0.1 bcfpd).
Figure 2.2 Additional natural gas demand for the retirement of coal power plants.
Source: CERI
2.2 Petrochemical Plants As there is high uncertainty concerning the construction of the proposed petrochemical plants listed in Table 1.2, CERI considers only two new plants (Dow Chemical Canada and the Inter pipeline) in AB with the operation start-date of 2022 (Inter Pipeline 2021; Boswell 2020). The required feedstock for the new

May 2021
Canadian Natural Gas Market Supply and Demand Pathways of Change 17
plants is assumed to be supplied from natural gas via NGL plants. According to the literature (CERI 2015a), CERI estimates that 0.4 bcfpd additional natural gas is needed to produce the required feedstock for these plants. Therefore, the additional natural gas demand for new petrochemicals will be about 0.4 bcfpd in 2030, 2040 and 2050.
2.3 LNG Plants CER database is used to estimate the additional natural gas demand for the potential LNG plants (Figure 2.3) (CER 2020a). Based on the Evolving scenario, the additional demand is expected to reach about 4.9 bcfpd by 2050. Since most of the LNG plants will be constructed in BC (Table 1.3), CERI assumes that about 80% of the natural gas demands come from this province and the rest from AB.
Figure 2.3 Additional natural gas demand for new LNG plants.
Source: (CER 2020a), Figure by CERI Note: The additional natural gas demand is sourced by 20% from AB and 80% from BC.
2.4 Decarbonization of Canadian Energy System Using Hydrogen To quantify the required amount of hydrogen for energy system decarbonization and the consequent additional natural gas demand, CERI considers the following assumptions:

May 2021
18 Canadian Energy Research Institute
• Due to the maturity of SMR technology and its low LCOH, CERI assumes that all required hydrogen is blue hydrogen produced using this technology with 90% CCS efficiency (Layzell, Young, et al. 2020; IEA 2019b).
• The considered sectors in which hydrogen displaces the traditional fossil fuels are: o Domestic natural gas demands (residential, commercial, and industrial), o Export natural gas demands3, o The gas power plant for electricity generation, o Transportation (diesel and gasoline).
• Hydrogen is produced in a central plant (as a hub). It is then transported for different end-use applications; thus, there will not be a separate hydrogen production facility for each power plant.
• CERI used the Energy Future Outlook 2020 database (CER 2020a) to estimate the energy demand for the sectors mentioned above.
• The analysis was conducted for short-term (2030), mid-term (2040), and long-term (2050) with the following displacement shares of traditional fossil fuels:
Table 2.1 Displacement shares of traditional fossil fuels with hydrogen in different sectors.
Variable Sector / Fuel Type 2030 2040 2050
Domestic Natural Gas
Demands
Residential 5% 10% 20% Commercial 5% 10% 20%
Industrial 5% 10% 20%
Transportation Diesel 40% 60% 80%
Gasoline 10% 20% 30% Electricity
Generation Natural Gas 10% 60% 100%
Export Natural Gas Demands Natural Gas 5% 10% 20%
Source: (NRCAN 2020b; Layzell, Young, et al. 2020) Note: Turbines capable of combusting 100% hydrogen are expected to be commercialized by 2030 (NRCAN 2020b). Hence, CERI assumes that all natural gas power plants will be converted to H2 power plants by 2050.
• Other assumptions for quantifying hydrogen and additional natural gas demands are presented in Table 2.2.
• Assumptions to quantify the additional natural gas demand for hydrogen production.
3 The natural gas export volume is estimated by subtracting the natural gas production from the summation of total natural gas primary demand and the natural gas required for LNG plants (CER 2020a).

May 2021
Canadian Natural Gas Market Supply and Demand Pathways of Change 19
Table 2.2 Assumptions to quantify the additional natural gas demand for hydrogen production.
Description Values H2-HHV (MJ/kg) 142.2 NG-HHV (MJ/m3) 40.57 SMR Process Efficiency (PJ H2/PJ NG) 0.72 CO2 Emission from NG combustion (kg CO2 / GJ of NG) 56.3 CO2 Emission from Diesel combustion (kg CO2 / GJ of Diesel) 74.1 CO2 Emission from Gasoline combustion (kg CO2 / GJ of Gasoline) 72.8 CO2 Emission from H2 production (kg CO2 / kg of H2) 9 CCS Efficiency (%) 90% H2-FCE vs. Diesel-ICE Drivetrain Efficiency Ratio 0.86 H2-FCE vs. Gasoline-ICE Drivetrain Efficiency Ratio 0.56
Source: (Layzell, Young, et al. 2020; NREL 2020)
Figure 2.4 shows the additional natural gas demand to produce hydrogen that displaces the traditional fossil fuels. At the national level, the additional demand is estimated 2.9 bcfpd by 2050. Among the provinces, AB makes the highest contribution to the additional demand, followed by ON, BC, and SK (Figure 2.4).
Figure 2.4 Additional natural gas demand for hydrogen production.
Source: CERI Note: Exp. stands for the exported natural gas.

May 2021
20 Canadian Energy Research Institute
Figure 2.5 shows the avoided CO2 emission resulting from hydrogen consumption instead of traditional fuels (e.g., natural gas, diesel, and gasoline). The estimations show that using hydrogen for decarbonizing different parts of the energy sector leads to an emission reduction of 116 Mtpa by 2050. Also, considering the 2018 combustion emissions (541 Mt CO2e/yr), displacing the traditional fossil fuels with hydrogen results in an emission reduction of 21% in 2050.
Figure 2.5 Avoided CO2 emission by replacing traditional fuels with hydrogen.
Source: CERI Note#1: Exp. stands for the exported natural gas. Note#2: CERI does not consider the emission associated with natural gas extraction and the infrastructure.
With the increase of worldwide demand for hydrogen, Canada has a great opportunity to become an international supplier of low carbon Intensity (CI) hydrogen as a new carbon-free energy export commodity (NRCAN 2020b). Four key markets have been identified as potential export markets for Canada: the US, Japan, South Korea, and Germany. Table 2.3 presents the hydrogen market estimates based on the literature:

May 2021
Canadian Natural Gas Market Supply and Demand Pathways of Change 21
Table 2.3 Overseas potential markets for hydrogen.
Country Period Lower Range (Mtpa of H2)
Upper Range (Mtpa of H2)
The USA4 by 2050 20 40 Japan by 2050 5 35
South Korea by 2050 4 20 Germany by 2030 2.7 3.3
Source: (NRCAN 2020b; Ruth et al. 2020)
Note that the size of the hydrogen market in China is estimated to be within the range of 18-160 Mt of H2. However, considering the large coal reserves in China and extensive renewable and nuclear energy systems under development, this country may eventually become self-sufficient in hydrogen production (NRCAN 2020b).
2.5 Additional Natural Gas Demand at National Level As seen in Figure 2.6, the total additional demand is expected to reach 9.2 bcfpd by 2050. Among potential areas, the new LNG plants contribute to the total additional demand, followed by the energy system decarbonization with hydrogen.
4 Another report estimates 2050 U.S. hydrogen demand of 20 Mtpa in a “base” scenario and 63 Mtpa in an “ambitious” scenario, with the potential for an additional 11 Mtpa for synthetic jet fuel and ammonia for use as a shipping fuel (FCHEA 2021).

May 2021
22 Canadian Energy Research Institute
Figure2.6 shows the additional natural gas demand at the national level based on the future gas demand in the four potential areas, including the retirement of coal-powered plants, new petrochemical plants, new LNG plants, and energy system decarbonization using hydrogen. As seen in Figure 2.6, the total additional demand is expected to reach 9.2 bcfpd by 2050. Among potential areas, the new LNG plants contribute to the total additional demand, followed by the energy system decarbonization with hydrogen.

May 2021
Canadian Natural Gas Market Supply and Demand Pathways of Change 23
Figure2.6 Additional natural gas demand in Canada.
Source: CERI

May 2021
24 Canadian Energy Research Institute
Chapter 3 : Economic Analysis • The total impact of additional natural gas demand on the Canadian GDP and tax revenues are
estimated at CAD$21 billion and CAD$343 million within 2021-2030. • The LCOH for the centralized SMR plant is about two times lower than the distributed PEM plant. • The LCOH for SMR and PEM was significantly sensitive to the feedstock cost (natural gas) and utility
cost (electricity).
The additional natural gas demand in the abovementioned four areas is supposed to be supplied by Canada’s natural gas (mostly by western provinces); thus, it requires additional natural gas production. The first part of this chapter presents the economic impacts of the additional natural gas production at provincial and national levels from 2021 to 2030. The second part deals with a detailed analysis to estimate the LCOH for two leading technologies (SMR and PEM) in AB. A sensitivity analysis on different cost variables is also conducted to identify the most prominent parameters in hydrogen production cost.
3.1 Economic Impacts of Natural Gas Production Input/Output (I/O) analysis addresses how economic circumstances in one part of an economy can ripple through the rest. It deals with inter-industry relationships, notably using the output from one industrial process as an input into another. The first step is to estimate and forecast the value of total investment and revenues from the processes. The forecasted values and the multipliers are then used to estimate the changes in demand for a specific industry on other industries, measured in GDP, tax revenues, labour income, and employment. I/O model multipliers estimate the rate of change or ripple effects that a change in policy or the introduction of a set of expenditures could have on the overall economy (IMPLAN 2020). The ripple effects are usually captured by three different effects:
a) Direct effects – quantitative estimations that the policy or program (increases in public spending, consumption, infrastructure investments, etc.) has on a targeted industry, in the form of an increase in the final demand—for example, the number of jobs created in industry due to investment to increase production capacity.
b) Indirect effects – increases in demand for intermediate goods and services triggered by an increase in an economic activity where a policy or program was initially introduced. For example, the number of jobs created in the industries peripheral to an investment increase was introduced.
c) Induced effects – increases in consumer spending in the local economy by households or employees directly and indirectly linked to the economic activity where a program's policy occurs (This effect is not considered in this study).
CERI considers the direct and indirect effects within the provinces and Canada as the total simple effects. The indirect impacts for other provinces are the indirect impacts in this report.

May 2021
Canadian Natural Gas Market Supply and Demand Pathways of Change 25
Considering the most recent Supply and Use tables (Statistics Canada 2021) and estimating the total additional gas demand between 2021 and 2030, CERI determines an approximate impact on the macroeconomic variables with the introduction of revenues (or 'shocks'). In this case, CERI only considers the operating revenue to generate outputs and employs a 10-year horizon (2021-2030) to limit the challenges of changing economic relationships between sectors. Impacts are calculated for Canada, broken down by province and presented as GDP, taxes, labour income, and employment in total simple effects and indirect impacts.
Note that to quantify the additional natural gas demand for hydrogen production on an annual basis (within 2021-2030), CERI uses the displacement shares presented in Table 3.1.
Table 3.1 Displacement shares of traditional fossil fuels with hydrogen in different sectors (annual basis).
Variable Sector 2021 2022 2023 2024 2025 2026 2027 2028 2029 2030
Natural Gas
Residential 0% 0% 1% 1% 2% 2% 3% 3% 4% 5% Commercial 0% 0% 1% 1% 2% 2% 3% 3% 4% 5% Industrial 0% 0% 1% 1% 2% 2% 3% 3% 4% 5% Electricity Generation 1% 2% 3% 4% 5% 6% 7% 8% 9% 10%
Export 0% 0% 1% 1% 2% 2% 3% 3% 4% 5% Diesel Transportation 5% 10% 15% 20% 20% 30% 30% 35% 40% 40% Gasoline Transportation 1% 2% 3% 4% 5% 6% 7% 8% 9% 10%
Source: (NRCAN 2020b; Layzell, Young, et al. 2020)
Since more than 80% of the additional natural gas demand originates from the western Canadian provinces (BC, AB, and SK), CERI's assessment at the provincial level is limited to these three provinces. Also, the economic impacts are assessed at the national level. As the Evolving scenario is the base case in the Energy Future Outlook (CER 2020a), CERI conducts the economic impact assessments only for this scenario.
Figure 3.1 shows the additional natural gas demand for the analysis period (2021-2030). To estimate the revenues obtained by the additional gas production, CERI uses the AECO-C price forecast estimated by Sproule company (Sproule 2021), illustrated in Figure 3.2. Also, CERI considers 0.29 $CDN/Mcf (real 2020 dollar) for the domestic and export tolls.

May 2021
26 Canadian Energy Research Institute
Figure 3.1 Additional natural gas demand for IO analysis, 2021-2030.
Source: CERI

May 2021
Canadian Natural Gas Market Supply and Demand Pathways of Change 27
Figure 3.2 AECO-C natural gas price forecast.
Source: (Sproule 2021), Figure by CERI Note: All monetary values are in real 2017 Canadian dollars.
Figure 3.3 presents the annual GDP impacts associated with additional natural gas production in BC, AB, SK, and Canada for 2021 to 20305. The economic impacts include total simple effects (direct and indirect) within Canada and the provinces and indirect impacts for other provinces. The total Canadian GDP impact is estimated to be about CAD$21 billion for the whole period (2021-2030), based on 2017 Canadian dollars. Canada's annual GDP impact will be CAD$113.3 million in 2021, increasing to almost CAD$3.6 billion in 2030, with BC and AB as the main contributors.
5 For the IO model, CERI considers Gross domestic product (GDP) at market prices for GDP, Taxes on products for Taxes using the Statcan SUTs.

May 2021
28 Canadian Energy Research Institute
Figure 3.3: Annual GDP impacts of additional natural gas demand, 2021-2030.
Source: CERI
Total tax revenue (taxes on products) generated by additional gas production is shown in Figure 3.4 for BC, AB, SK, and Canada from 2021 to 2030. Tax revenues' impacts are categorized into total simple effects (direct and indirect) within the provinces and Canada and indirect impacts for other provinces. The total net tax will be about CAD$343 million over the 2021-2030 period. The annual net tax impact will be approximately CAD$1.8 million in 2021, increasing to almost CAD$58.3 million in 2030. As shown in Figure 3.4, AB and BC will have the biggest shares of tax revenues.

May 2021
Canadian Natural Gas Market Supply and Demand Pathways of Change 29
Figure 3.4: Annual net tax impacts of additional natural gas demand, 2021-2030.
Source: CERI
Figure 3.5 demonstrates the impact of additional natural gas production within 2021-2030 on the labour income and total jobs (full-time employment) in Canada. The economic impacts are categorized into total simple effects (direct and indirect) within the provinces and Canada and indirect impacts for other provinces. As seen in the figure, the highest labour income and jobs (more than 80%) will be created in AB and BC. As expected, the total simple effects within each province make more contribution to the labour income and jobs compared to indirect impacts.

May 2021
30 Canadian Energy Research Institute
Figure 3.5: The impacts of additional natural gas demand on employment (Jobs) and labour income, 2021-2030.
Source: CERI
3.2 Levelized Cost Estimation for Hydrogen Production In this section, CERI estimates LCOH for four case studies, comprising two technology types, SMR and PEM electrolysis, and two technology years, Current (2019) and Future (2040), using H2A 2019 v3.2018 models developed by NREL (NREL 2021). This model is a discounted cash-flow model that provides all process design assumptions and a consistent cost analysis methodology for hydrogen production at centralized and distributed facilities. The technology year is the year in which the system's design and performance are confirmed in the laboratory at a high confidence level. Thus, the system can advance into a full-scale plant (Peterson, Vickers, and DeSantis 2020). The Current cases reflect the demonstrated 2019 technology, while the Future cases use advanced systems with market entry assumed in 2040, where reductions in capital cost and energy usage are expected as compared to the Current cases.
The main parameters used to develop the four case studies are presented in Table 3.2 and the following Source: (NREL 2021; CERI 2018a; Bank of Canada 2021b; 2021a)

May 2021
Canadian Natural Gas Market Supply and Demand Pathways of Change 31
Table 3.3 shows the capital costs of SMR and PEM technologies for Current and Future plants (for all other input parameters not cited in the table, the standard H2A 2019 v3.2018 default values are assumed) (NREL 2021)).
Table 3.2 Input parameters for hydrogen production technologies (SMR and PEM).
Description SMR PEM Level of Assessment Centralized Distributed Province of Investigation AB AB Operating Capacity Factor (%) 90% 86% Plant Design Capacity (kg of H2/day) 379,387 1,500
Start-up Year Current 2018 2018 Future 2040 2040
Plant Life (years) 40 20 Provincial Taxes (%) 10% 10% Federal Taxes (%) 15% 15% Total Tax Rate (%) 25% 25% After-tax Real IRR (%) 8% 8% Interest rate on debt (2019) (%) 3.95% 3.95% Inflation rate (2019) (%) 1.95% 1.95% Carbon Capture Efficiency (%) 90% - CO2 capture credit (CAD/ ton CO2 captured) for EOR $20 -
Source: (NREL 2021; CERI 2018a; Bank of Canada 2021b; 2021a)
Table 3.3 Capital costs for different hydrogen production cases.
Tech Description Current Future SM
R Process Plant -Reformer (US$ 2005) $49,969,788 $39,975,830 Balance of Plant and Offsites (US$ 2005) $19,964,651 $15,971,721 Process CO2 Removal (US$ 2005) $6,072,440 $4,857,952 Stack CO2 Removal (US$ 2005) $5,339,713 $4,271,770
PEM
Total System Cost (US$ 2016/kW) $599 $379 Stack System Cost (US$ 2016/kW) $342 $143 Mechanical BOP (US$ 2016/kW) $136 $140 Electrical BOP (US$ 2016/kW) $121 $97 Total Active Area With degradation (m2) 94 66 Stack oversize due to degradation (%) 13% 18.3%
Source: (NREL 2021)
To calculate LCOH, CERI uses the end-use prices for the industrial natural gas and electricity provided by Canada’s Energy Future 2020 (CER 2020a). CER forecasts energy prices until 2050. After 2050, the prices are assumed to remain constant.
Since there are some upstream GHG emissions for the gas production and a 90% carbon capture efficiency is assumed for SMR technology, the carbon tax is included in CERI's economic analysis. According to the

May 2021
32 Canadian Energy Research Institute
federal carbon price structure, the carbon tax will be CAD$40/t-CO2 in 2021 and CAD$50/t-CO2 in 2022. After that, the carbon tax rises by CAD$15/t-CO2 annually, reaching CAD$170/t-CO2 in 2030 (Harvie et al. 2020). CERI assumes a constant carbon tax of CAD$170/t-CO2 after 2030 until the end of the projects’ lifetime. Also, the Canada/US foreign exchange rate from the Federal Reserve Bank of St. Louis is considered for the historical exchange rates (2004 to 2020). For 2021 and the years after, CERI assumes a constant value of 1.25 as the Canada/US exchange rate (FRED 2021; CERI 2020).
3.1.1 Hydrogen Production Cost Analysis The hydrogen production cost breakdown for the four cases is shown in Figure 3.6. The LCOH varies from CAD$1.9/kg and CAD$2.8/kg to CAD$5.3/kg and 5.7 CAD$/kg based on SMR and PEM technologies, respectively. The LCOH for the centralized SMR plant is about two times lower than the distributed PEM plant, mainly due to the higher hydrogen production capacity in the SMR plant, the more maturity of SMR technology, and the difference in the energy price (natural gas versus electricity). Note that natural gas and electricity prices are highly influential factors in determining LCOH for SMR and PEM, respectively.
Figure 3.6 Hydrogen production cost contributions for four case studies; SMR (Current), SMR (Future), PEM (Current) and PEM (Future).
Source: CERI Note: Other variable costs consist of different categories such as utility costs (i.e., electricity), royalties, solid waste disposal costs, waste treatment costs, etc.

May 2021
Canadian Natural Gas Market Supply and Demand Pathways of Change 33
The primary cost driver for hydrogen production is the feedstock (natural gas) and other variables (electricity) costs for SMR and PEM technologies. For SMR technology, the share of feedstock cost increases from 46% to 63% over time, which is attributed to the increase of natural gas price during the project's lifetime. Similarly, for PEM, despite the increase in the electrical system efficiency (electricity usage decreases from 55.8 to 51.4 kWh/kg H2 for Current and Future plants, respectively), the electricity price rises over the plant’s lifetime. Hence, the overall electricity cost contribution to the LCOH increases as well.
3.1.2 Sensitivity Analysis Table 3.4 details the parameters and their variation range used in the model sensitivity analysis module. The upper and lower limits of each parameter varied within ±5%.
Table 3.4 Sensitivity analysis parameters for different hydrogen production cases.
Parameter
SMR PEM Price-
decreasing value
Price-increasing
value
Price-decreasing
value
Price-increasing
value
Current
Operating Capacity Factor (%) 95% 86% 90% 82% Plant design capacity (kg of H2/day) 398,356 360,418 1,610 1,780 After-tax real IRR 7.6% 8.4% 7.6% 8.4% Feedstock Consumption (% of baseline) 95% 105% 95% 105% Utilities Consumption (% of baseline) 95% 105% 95% 105% Total capital investment (CAD 2019) 601,635,201 664,965,222 4,129,623 4,564,320 Total fixed operating cost (CAD 2019/year) 18,451,535 20,393,801 238,698 263,824
Future
Operating Capacity Factor (%) 95% 86% 90% 82% Plant design capacity (kg of H2/day) 398,356 360,418 1,686 1,863 After-tax real IRR 7.6% 8.4% 7.6% 8.4% Feedstock Consumption (% of baseline) 95% 105% 95% 105% Utilities Consumption (% of baseline) 95% 105% 95% 105% Total capital investment (CAD 2019) 531,659,649 587,623,823 2,493,275 2,755,724 Total fixed operating cost (CAD 2019/year) 16,731,853 18,493,101 144,844 160,09
Source: (NREL 2021) Note: the operating capacity factor for PEM technology is assumed to be the plant usage factor in the model.
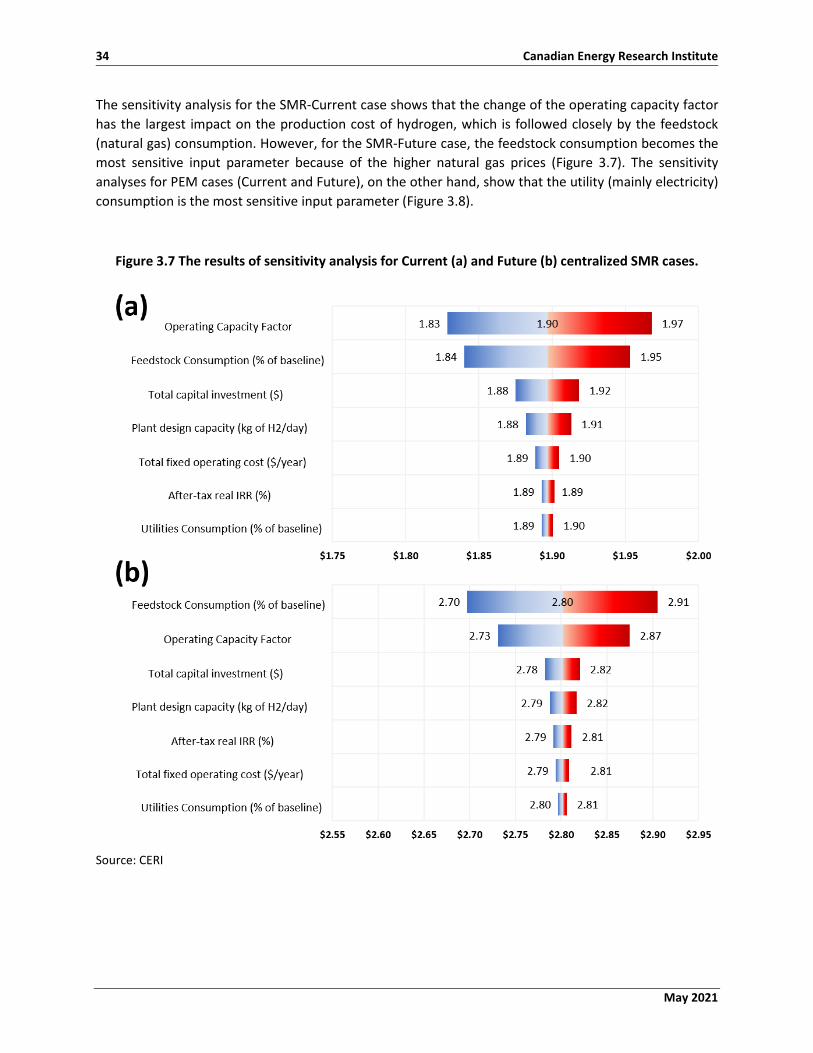
Using the parameters shown in Table 3.4, four charts were developed to examine the impact of individual parameters on LCOH in the four case studies (Figure 3.7 and Figure 3.8). The plots show the projected hydrogen cost variations on the x-axis against different single input parameters along the y-axis, including operating design capacity, operating capacity factor, After-tax real IRR, feedstock consumption, utility consumption, total capital investment, and total fixed operating cost. Each plot is organized from top to bottom to represent the most to least sensitive input parameters, respectively. The coloured shading indicates either a decrease (blue) or an increase (red) in the baseline hydrogen cost from the input parameter variation.
May 2021
34 Canadian Energy Research Institute
The sensitivity analysis for the SMR-Current case shows that the change of the operating capacity factor has the largest impact on the production cost of hydrogen, which is followed closely by the feedstock (natural gas) consumption. However, for the SMR-Future case, the feedstock consumption becomes the most sensitive input parameter because of the higher natural gas prices (Figure 3.7). The sensitivity analyses for PEM cases (Current and Future), on the other hand, show that the utility (mainly electricity) consumption is the most sensitive input parameter (Figure 3.8).
Figure 3.7 The results of sensitivity analysis for Current (a) and Future (b) centralized SMR cases.
Source: CERI

May 2021
Canadian Natural Gas Market Supply and Demand Pathways of Change 35
Figure 3.8 The sensitivity analysis results for Current (a) and Future (b) distributed PEM cases.
Source: CERI

May 2021
36 Canadian Energy Research Institute
Chapter 4 : Conclusions Natural gas has been viewed as a bridge fuel that could play a prominent role in transitioning to a low-carbon future. The US shale revolution and the developments in unconventional natural gas production have negatively impacted the Canadian natural gas supply and demand as Canada has historically been the main natural gas exporter to the US. Therefore, there have been debates on how to generate further demand for the Canadian natural gas industry.
In this report, CERI quantifies potential additional natural gas demand for three horizons (2030, 2040, and 2050) and assesses the corresponding economic impacts for the 2021-2030 period using the Energy Future Outlook 2020 database under the Evolving scenario from the Canadian Energy Regulator (CER). CERI identifies four potential areas that provide the future additional gas demand categorized as follows:
• Retirement of coal-fired power plants, • New petrochemical facilities, • New LNG plants, • Decarbonization of Canadian energy systems using hydrogen.
The results show that by 2050, the retirement of coal-fired power plants creates about 1 bcfpd additional natural gas demand while constructing new petrochemical plants requires 0.4 bcfpd additional natural gas. In addition, there will be a demand of 4.9 bcfpd for new LNG plants by 2050. Finally, the decarbonization of Canadian energy systems using hydrogen (produced via SMR technology with a CO2 capture efficiency of 90%) requires about 2.9 bcfpd additional natural gas by 2050. Hence, the total additional demand at the national level considering the four potential areas will be about 9.2 bcfpd by 2050. The results also reveal that displacing the conventional fuels with hydrogen will reduce Canada's GHG emission by more than 116 Mtpa. This will translate to an emission reduction of 21% in 2050 based on 2018 combustion emissions (541 Mt CO2e/yr).
CERI also assesses the economic impacts of the additional natural gas production on GDP, taxes, employment, and labour income in the analysis period of 2021-2030. Since most of the additional natural gas demand belongs to BC, AB, and SK, CERI limits its assessment to these provinces and the national level (Canada). In total, the additional natural gas production results in CAD$21 billion and CAD$343 million rises in Canada's GDP and tax revenues over the analysis period. AB and BC make the largest contributions to both GDP and tax revenues. AB is expected to receive the most benefit in labour income and employment, followed by BC and SK.
Finally, the LCOH is estimated for two base years: 2019 (Current) and 2040 (Future). CERI assumes two technologies in AB, including SMR with the design capacity of 379,387 kg H2/day as a centralized plant and water electrolysis using the polymer electrolyte membrane (PEM) with the design capacity of 1,500 kg H2/day as a distributed plant. The results show that for the Current and Future projects, the LCOH of SMR varies from 1.9 $CAD/kg to 2.8 $CAD/kg, whereas the LCOH of PEM changes from 5.3 $CAD/kg to 5.7 $CAD/kg, respectively. The difference in the estimated LCOHs is mainly due to the larger production capacity, more maturity of SMR technology compared to PEM, and the difference in energy prices (natural gas vs electricity).

May 2021
Canadian Natural Gas Market Supply and Demand Pathways of Change 37
Bibliography Alberta Government. 2018. “Petrochemicals Diversification Program.” 2018.
https://open.alberta.ca/dataset/6f41ae1b-9bad-4b31-8f26-8f8b3f197de7/resource/3786515f-836a-4ee2-94a1-9f8fcdc1589c/download/energy-petrochemical-diversification-factsheet.pdf.
ATCO. 2021. “Fort Saskatchewan Hydrogen Blending Project.” 2021. https://www.atco.com/en-ca/projects/fort-saskatchewan-hydrogen-blending-project.html.
Bank of Canada. 2021a. “Inflation: Definitions, Graphs and Data.” 2021. https://www.bankofcanada.ca/rates/indicators/capacity-and-inflation-pressures/inflation/.
———. 2021b. “Interest Rates Posted for Selected Products by the Major Chartered Banks.” 2021. https://www.bankofcanada.ca/rates/banking-and-financial-statistics/posted-interest-rates-offered-by-chartered-banks/.
Barth, A, J Brick, D Dediu, and H Tai. 2020. “The Future of Natural Gas in North America.” 2020. https://www.mckinsey.com/industries/electric-power-and-natural-gas/our-insights/the-future-of-natural-gas-in-north-america.
Baumgarten, Stefan. 2020. “Canada CKPC Evaluates PDH/PP Project amid Pandemic Uncertainties.” ICIS Explore. 2020. https://www.icis.com/explore/resources/news/2020/11/06/10572056/canada-ckpc-evaluates-pdh-pp-project-amid-pandemic-uncertainties.
Boswell, Clay. 2020. “Dow to Expand Fort Saskatchewan Ethylene Plant.” January 29, 2020. http://chemweek.com/CW/Document/108735/Dow-to-expand-Fort-Saskatchewan-ethylene-plant.
Canadian Press. 2020. “Dow to Build Alberta Ethylene Plant Expansion for More than US$200 Million.” Thestar.Com. January 31, 2020. https://www.thestar.com/business/2020/01/31/dow-to-build-alberta-ethylene-plant-expansion-for-more-than-us200-million.html.
CAPP. 2020. “Canadian Natural Gas: Demand and Production Forecast Scenario Modelling.” CAPP (blog). 2020. https://www.capp.ca/publications/canadian-natural-gas-demand-and-production-forecast-scenario-modelling/.
CER. 2020a. “NEB – Canada’s Energy Future 2020.” December 2, 2020. https://www.cer-rec.gc.ca/en/data-analysis/canada-energy-future/2020/index.html.
———. 2020b. “NEB – Scenarios and Assumptions.” December 2, 2020. https://www.cer-rec.gc.ca/en/data-analysis/canada-energy-future/2020/assumptions/index.html.
CERI. 2013. “North American Natural Gas Pathways.” https://ceri.ca/studies/north-american-natural-gas-pathways.
———. 2015a. “Natural Gas Liquids (NGLs) in North America: An Update. Part II Midstream and Downstream Infrastructure :: CERI.” 2015. https://ceri.ca/studies/natural-gas-liquids-ngls-in-north-america-an-update-part-ii-midstream-and-downstream-infrastructure.
———. 2015b. “Examining the Expansion Potential of the Petrochemical Industry in Canada.” Study No. 153. Calgary, AB: Canadian Energy Research Institute. https://ceri.ca/studies/examining-the-expansion-potential-of-the-petrochemical-industry-in-canada.
———. 2016. “Competitive Analysis of the Canadian Petrochemical Sector.” 2016. https://ceri.ca/studies/competitive-analysis-of-the-canadian-petrochemical-sector.

May 2021
38 Canadian Energy Research Institute
———. 2018a. “Economic Impacts and Market Challenges for the Methane to Derivatives Petrochemical Sub-Sector.” Study No. 169. Calgary, AB: Canadian Energy Research Institute. https://ceri.ca/assets/files/Study_169_Full_Report.pdf.
———. 2018b. “Competitive Analysis of Canadian LNG.” Study No. 172. Calgary, AB: Canadian Energy Research Institute. https://ceri.ca/assets/files/Study_172_Full_Report.pdf.
———. 2019a. “Canadian Crude Oil and Natural Gas Production, Supply Costs, Economic Impacts and Emissions Outlook (2019-2039).” Study No. 182. Calgary, AB: Canadian Energy Research Institute. https://ceri.ca/assets/files/Study_182_Full_Report.pdf.
———. 2019b. “Economic and Environmental Impacts of Methane Emissions Reduction in the Natural Gas Supply Chain.” Study No. 177. Calgary, AB: Canadian Energy Research Institute. https://ceri.ca/assets/files/CERI%20Study%20177A%20-%20Methane%20Emissions%20Reduction%20in%20the%20Natural%20Gas%20Supply%20Chain%20-%20February%202019.pdf.
———. 2020. “Economic Recovery Pathways For Canada’s Energy Industry: Part 2 - Canadian Crude Oil and Natural Gas, Study 192B.” https://ceri.ca/assets/files/Study_192B_Full_Report.pdf.
Davis, Steven J., Nathan S. Lewis, Matthew Shaner, Sonia Aggarwal, Doug Arent, Inês L. Azevedo, Sally M. Benson, et al. 2018. “Net-Zero Emissions Energy Systems.” Science 360 (6396). https://doi.org/10.1126/science.aas9793.
Discovery LNG. 2021. “Discovery LNG.” 2021. https://www.discoverylng.com/.
EIA. 2020. “Annual Energy Outlook 2020 with Projections to 2050.” 2020. https://www.eia.gov/outlooks/aeo/pdf/AEO2020%20Full%20Report.pdf.
———. 2021. “Natural Gas Data - U.S. Energy Information Administration (EIA).” 2021. https://www.eia.gov/naturalgas/data.php.
Énergie Saguenay. 2021. “Project Summary.” Énergie Saguenay. 2021. https://energiesaguenay.com/en/project/project-summary/.
FCHEA. 2021. “US Hydrogen Road Map.” Fuel Cell & Hydrogen Energy Association. 2021. http://www.fchea.org/us-hydrogen-study.
FRED. 2021. “Canada / U.S. Foreign Exchange Rate.” Federal reserve economic data (FRED), Federal Reserve Bank of St. Louis. 2021. https://fred.stlouisfed.org/series/AEXCAUS.
GDM. 2020. “Assessing Western Canada’s Readiness to Compete in an Emerging Hydrogen Economy.”
GEM. 2020. “LNG Terminals.” Global Energy Monitor. March 22, 2020. https://www.gem.wiki/LNG_Terminals.
Goldboro LNG. 2021. “Project Overview.” 2021. http://goldborolng.com/project/project-overview/.
Goldmeer, Jeffrey. 2019. “POWER TO GAS: HYDROGEN FOR POWER GENERATION.” GEA33861. https://www.ge.com/content/dam/gepower/global/en_US/documents/fuel-flexibility/GEA33861%20Power%20to%20Gas%20-%20Hydrogen%20for%20Power%20Generation.pdf.
Harvie, Alan, Max Collett, Gatlin Smeijers, and Mélissa Devost. 2020. “Canada to Increase Carbon Taxes by 467% | Global Law Firm | Norton Rose Fulbright.” 2020. https://www.nortonrosefulbright.com/en/knowledge/publications/d58ef644/canada-to-increase-carbon-taxes-by-566.

May 2021
Canadian Natural Gas Market Supply and Demand Pathways of Change 39
Hausfather, Z. 2016. “Is Natural Gas a Bridge Fuel? » Yale Climate Connections.” Yale Climate Connections. 2016. https://yaleclimatemediaforum.org/2016/08/is-natural-gas-a-bridge-fuel/.
Hoekstra, Gordon. 2020. “$18-Billion LNG Project Projected to Meet Mid-Decade Start despite COVID-19 Delays.” Vancouversun. 2020. https://vancouversun.com/business/18-billion-lng-project-projected-to-meet-mid-decade-start-despite-covid-19-delays.
IEA. 2019a. “The Future of Hydrogen; Seizing Today’s Opportunities.”
———. 2019b. “The Future of Hydrogen.” June 2019. https://www.iea.org/publications/reports/thefutureofhydrogen/.
IMPLAN. 2020. “Understanding Multipliers.” Economic Impact Data. 2020. https://implanhelp.zendesk.com/hc/en-us/articles/115009505707-Understanding-Multipliers.
Inter Pipeline. 2021. “Developing Canada’s First Integrated PDH and PP Complex.” 2021. https://www.interpipeline.com/operations/constructionprojects/heartlandpetrochemicalcomplex/heartland-complex.cfm.
Jang, Brent. 2015. “Vancouver-Based NewTimes Energy Latest Entrant into Crowded LNG Field,” 2015. https://www.theglobeandmail.com/report-on-business/industry-news/energy-and-resources/vancouver-based-newtimes-energy-latest-entrant-into-crowded-lng-field/article22932594/.
Jaremko, Deborah. 2019. “Inter Pipeline to Spend $935MM on New Alberta Petrochemical Plant in 2020.” 2019. https://www.jwnenergy.com/article/2019/12/9/inter-pipeline-spend-935mm-new-alberta-petrochemic/.
———. 2020. “Petrochemical Project a ‘Godsend’ for Small Ontario Business.” Canadian Energy Centre (blog). August 5, 2020. https://www.canadianenergycentre.ca/petrochemical-project-a-godsend-for-small-ontario-business/.
Layzell, David B, Jessica Lof, Cameron Young, and Jonathan Leary. 2020. “Building a Transition Pathway To A Vibrant Hydrogen Economy In The Alberta Industrial Heartland.” https://transitionaccelerator.ca/wp-content/uploads/2020/11/Building-a-Transition-Pathway-to-a-Vibrant-Hydrogen-Economy-in-the-Alberta-Industrial-Heartland-November-2020-5.pdf.
Layzell, David B, Cameron Young, Jessica Lof, Jonathan Leary, and Song Sit. 2020. “Towards Net-Zero Energy Systems In Canada: A Key Role For Hydrogen.” https://transitionaccelerator.ca/towards-net-zero-energy-systems-in-canada-a-key-role-for-hydrogen/.
Ministry of Energy, Mines and Low Carbon Innovation. 2021. “Overview of Coal in BC.” Province of British Columbia. 2021. https://www2.gov.bc.ca/gov/content/industry/mineral-exploration-mining/british-columbia-geological-survey/geology/coal-overview.
Myhre, G, and D Shindell. 2013. “Anthropogenic and Natural Radiative Forcing.” http://www.climatechange2013.org/images/report/WG1AR5_Chapter08_FINAL.pdf.
Nauticol Energy. 2018. “Nauticol - Grande Prairie.” Nauticol. 2018. https://nauticolenergy.com/operations/grande-prairie/.
NIR. 2020. “Canada. 2020 National Inventory Report (NIR) | UNFCCC.” 2020. https://unfccc.int/documents/224829.
NRCAN. 2020a. “Canadian-Lng-Projects.” Natural Resources Canada. 2020. https://www.nrcan.gc.ca/our-natural-resources/energy-sources-distribution/clean-fossil-fuels/natural-gas/canadian-lng-projects/5683.

May 2021
40 Canadian Energy Research Institute
———. 2020b. “The Hydrogen Strategy.” Natural Resources Canada. October 20, 2020. https://www.nrcan.gc.ca/climate-change/the-hydrogen-strategy/23080.
———. 2021. “Coal-Facts.” Natural Resources Canada. 2021. https://www.nrcan.gc.ca/science-and-data/data-and-analysis/energy-data-and-analysis/energy-facts/coal-facts/20071.
NREL. 2020. “Resource Assessment for Hydrogen Production.” https://www.nrel.gov/docs/fy20osti/77198.pdf.
———. 2021. “H2A: Hydrogen Analysis Production Models.” 2021. https://www.nrel.gov/hydrogen/h2a-production-models.html.
NS DOE. 2021. Nova Scotia’s LNG Opportunity. https://energy.novascotia.ca/oil-and-gas/nova-scotias-lng-opportunity.
Parhar, Aman. 2019. “$5.6B Petrochemical Facility Planned for Prince George.” Kitimat Northern Sentinel. July 26, 2019. https://www.northernsentinel.com/home2/5-6b-petrochemical-facility-planned-for-prince-george/.
Peterson, David, James Vickers, and Dan DeSantis. 2020. “Hydrogen Production Cost From PEM Electrolysis - 2019.” 19009. DOE Hydrogen and Fuel Cells Program Record. https://www.hydrogen.energy.gov/pdfs/19009_h2_production_cost_pem_electrolysis_2019.pdf.
PG&E. 2018. “Pipeline Hydrogen.”
Powell, T. 2019. “Calling Natural Gas a ‘Bridge Fuel’ Is Alarmingly Deceptive.” Sightline Institute (blog). 2019. https://www.sightline.org/2019/02/12/calling-natural-gas-a-bridge-fuel-is-alarmingly-deceptive/.
Proton Technologies. 2020. “Hygenic Earth Energy.” Proton Technologies (blog). 2020. http://proton.energy/hygenic-earth-energy/.
Quan, Holly. 2021. “Cedar LNG Project Moves Forward.” Context Magazine by CAPP. 2021. https://context.capp.ca:443/energy-matters/2020/itn-cedar-lng.
Ramsden, T., M. Ruth, and V. Diakov. 2013. “Hydrogen Pathways: Updated Cost, Well-to-Wheels Energy Use, and Emissions for the Current Technology Status of Ten Hydrogen Production, Delivery, and Distribution Scenarios.” https://www.nrel.gov/docs/fy14osti/60528.pdf.
Rapier, R. 2018. “Natural Gas Is Already A Bridge Fuel.” Forbes. 2018. https://www.forbes.com/sites/rrapier/2018/09/02/natural-gas-is-already-a-bridge-fuel/.
Reuters. 2020. “Canada’s Alberta, Saudi Firm in Talks on Petrochemical Plant: Report.” Reuters, October 30, 2020. https://www.reuters.com/article/us-canada-petrochemicals-saudi-idCAKBN27F243.
Ruth, Mark F. (ORCID:0000000218380617), Paige (ORCID:0000000310864454) Jadun, Nicholas Gilroy, Elizabeth Connelly, Richard Boardman, A. J. Simon, Amgad Elgowainy, and Jarett Zuboy. 2020. “The Technical and Economic Potential of the H2@Scale Hydrogen Concept within the United States.” NREL/TP-6A20-77610. National Renewable Energy Lab. (NREL), Golden, CO (United States). https://doi.org/10.2172/1677471.
Sproule. 2021. “Sproule Price Forecast.” Sproule. January 2021. https://sproule.com/price-forecast/.
StatCan. 2021. “Natural Gas – Imports and Exports - Open Government Portal.” 2021. https://open.canada.ca/data/en/dataset/b2f35cd0-4e54-4960-bdb1-7b040f5beaa0.
May 2021
Canadian Natural Gas Market Supply and Demand Pathways of Change 41
Statistics Canada. 2021. “National and Provincial Multipliers.” 2021. https://www150.statcan.gc.ca/n1/en/catalogue/15F0046X.
Świrk, Katarzyna, Teresa Grzybek, and Monika Motak. 2017. “Tri-Reforming as a Process of CO2 Utilization and a Novel Concept of Energy Storage in Chemical Products.” E3S Web of Conferences 14: 02038. https://doi.org/10.1051/e3sconf/20171402038.
TSIROPOULOS, Ioannis, Wouter NIJS, Dalius TARVYDAS, and Pablo RUIZ CASTELLO. 2020. “Towards Net-Zero Emissions in the EU Energy System by 2050.” Text. https://ec.europa.eu/jrc/en/publication/towards-net-zero-emissions-eu-energy-system-2050.
Veazey, Matthew V. 2020. “Fluor and Kiewit to Build Unit at New Canada Facility.” 2020. https://www.rigzone.com/news/fluor_and_kiewit_to_build_unit_at_new_canada_facility-09-jan-2020-160762-article/.
Woodfibre LNG. 2020. “Woodfibre LNG Extends Timeline on Squamish Project.” Woodfibre LNG. March 24, 2020. https://woodfibrelng.ca/woodfibre-lng-extends-timeline-on-squamish-project/.