marketbeat austin office€¦ · cushman & wakefield is a leading global real estate services...
TRANSCRIPT

AUSTIN OFFICEOffice Q1 2018
MARKETBEAT
cushmanwakefield.com
Economic Indicators
Market Indicators (Overall, All Classes)
Overall Net Absorption/Overall Asking Rent4-QTR TRAILING AVERAGE
Overall Vacancy
Q1 2017 Q1 2018 12-Month Forecast
Austin Employment 1,022k 1,058k
Austin Unemployment 3.5% 2.7%
U.S. Unemployment 4.7% 4.1%
Q1 2017 Q1 2018 12-Month Forecast
Vacancy 9.8% 10.5%
Net Absorption (sf) 153K 20k
Under Construction (sf) 3.2M 2.9M
Average Asking Rent* $35.45 $36.39
*Rental rates reflect gross asking $psf/year
EconomyThe first quarter of 2018 marked yet another quarter that the Austin unemployment rate ranked as one of the lowest amongst the 50 largest metropolitan areas, coming in at 2.7%. The local Austin unemployment rate also remained ahead of both the Texas rate of 4% and the national rate of 4.1%. Additionally, the rate of job growth in the Austin MSA continued to impress. According to the U.S. Bureau of Labor Statistics, Austin has added more than 35,000 new jobs in the past 12 months. Many of these new jobs can be attributed to more and more companies relocating or expanding to Austin from other areas, including many Silicon Valley tech companies that are finding the Austin market rich in talent.
Market OverviewThe Austin office market recorded approximately 20,000 square feet (sf) of positive absorption during Q1 2018. Class A product, particularly in the Central Business District (CBD) where there was nearly 125,000 sf of positive absorption, helped bolster overall absorption numbers, as lower class office product weighed down overall absorption figures. Vacancy rates throughout the city remained relatively steady compared to Q4 2017, as the overall vacancy rate in Austin rose only slightly to 10.5%, while in the CBD, overall vacancy fell to 9%. The overall asking rate for the entire Austin market continued to climb, coming in at $36.39 per square foot (psf). This represents a year-over-year (YoY) increase of 2.7%. As absorption numbers confirm, Class A product demand remained strong and continued to command the highest prices. Class A rates citywide were up to a record high of $39.93 PSF, while Class A rates in the CBD also hit a record high, coming in at $56.43 psf.
OutlookNew construction activity continues to be a dominant force in the Austin office market, with nearly 3 Million SF of new office product underway. However, despite this activity and other recent additions to the office inventory, robust pre-leasing has held vacancy levels in check. Large corporate users, including Google, Indeed, WeWork and others continue to demand and commit to top-tier office space. With no immediate surge in vacancy rates on the horizon and an active office market, we can expect to see the ongoing confidence in the Austin market continue.
AUSTIN OFFICE
$10
$20
$30
$40
0
200
400
600
2011 2012 2013 2014 2015 2016 2017 2018
Net Absorption, SF (thousands) Asking Rent, $ PSF
5%
8%
10%
13%
15%
18%
20%
2011 2012 2013 2014 2015 2016 2017 2018
Historical Average = 12%

AUSTIN OFFICEOffice Q1 2018
MARKETBEAT
About Cushman & WakefieldCushman & Wakefield is a leading global real estate services firm with 45,000 employees in more than 70 countries helping occupiers and investors optimize the value of their real estate. Cushman & Wakefield is among the largest commercial real estateservices firms with revenue of $6 billion across core services of agency leasing, asset services, capital markets, facility services (C&W Services), global occupier services, investment & asset management (DTZ Investors), project & development services, tenant representation, and valuation & advisory. To learn more, visit www.cushmanwakefield.com or follow @CushWake on Twitter.
Copyright © 2018 Cushman & Wakefield. All rights reserved. The information contained within this report is gathered from multiplesources considered to be reliable. The information may contain errors or omissions and is presented without any warranty orrepresentations as to its accuracy.
SUBMARKET INVENTORY(SF)
SUBLET VACANT
(SF)
DIRECT VACANT
(SF)
OVERALL VACANCY
RATE
CURRENT NET ABSORPTION
(SF)
YTD OVERALL NET ABSORPTION
(SF)
UNDER CNSTR(SF)
OVERALL AVERAGE ASKING RENT*
Class A 33,589,541 722,648 2,540,051 9.7% 169,549 169,549 2,909,930 $39.93
Class B 13,926,233 222,806 1,542,661 12.7% (106,502) (106,502) 0 $31.51
Class C 2,865,867 8,400 279,942 9.8% (43,042) (43,042) 0 $23.30
Key Lease Transactions Q1 2018
PROPERTY SF TENANT TRANSACTION TYPE SUBMARKET
300 Colorado 309,000 Parsley Energy Direct CBD
801 Barton Springs 90,500 WeWork Direct SC
Foundry 27,776 DPR Construction Direct EAST
Quarry Lake 2 20,384 Heartflow Direct FNW
Key Sales Transactions Q1 2018
PROPERTY SF SELLER/BUYER PRICE / $PSF SUBMARKET
Domain Point I & II 240,000 Crow Holdings / TIER REIT $66,420,000 / $277 FNW
Rollingwood Center I & II 214,000 Endeavor / Lionstone Investments Undisclosed SW
Lantana Ridge 165,000Lincoln Property-Goldman Sachs /
Lantana Cooler Undisclosed SW
Barton Ridge 130,613 SteelWave / EverWest RE Undisclosed SC
*Rental rates reflect gross asking $psf/year
SUBMARKET INVENTORY(SF)
SUBLET VACANT
(SF)
DIRECT VACANT(SF)
OVERALL VACANCY RATE
CURRENT QTR OVERALL NET ABSORPTION
(SF)
YTD OVERALL NET ABSORPTION
(SF)
UNDER CNSTR(SF)
OVERALL AVERAGE
ASKING RENT (ALL CLASSES)*
OVERALL AVERAGE
ASKING RENT (CLASS A)*
CBD 10,720,232 208,889 753,562 9.0% 124,838 124,838 578,163 $51.22 $56.43
Central 1,140,586 13,794 48,995 5.5% 7,221 7,221 44,391 $39.47 $45.71
Far Northwest 14,469,906 202,696 1,277,843 10.2% -197,934 -197,934 1,013,907 $35.18 $36.52
North Central 2,494,784 37,344 333,326 14.9% 39,343 39,343 0 $24.05 $25.12
Northeast 1,811,341 22,233 240,555 14.5% -76,341 -76,341 115,000 $19.11 $29.07
Northwest 4,516,797 72,770 365,299 9.7% 7,356 7,356 0 $31.96 $37.59
South Central 1,990,989 22,846 89,562 5.6% 74,427 74,427 64,275 $29.41 $45.14
Southeast 1,026,115 0 203,873 19.9% 2,703 2,703 0 $26.32 $33.77
Southwest 10,755,575 358,146 996,016 12.6% 33,974 33,974 98,195 $37.15 $38.01
Round Rock 1,156,315 15,136 53,623 5.9% -448 -448 154,476 $26.91 $33.42
East 368,006 0 0 0.0% 4,866 4,866 841,523 $42.85 $45.25
AUSTIN TOTALS 50,450,646 953,854 4,362,654 10.5% 20,005 20,005 2,909,930 $36.39 $39.93
Cushman & Wakefield200 W Cesar Chavez StSuite 250Austin, TX 78701cushmanwakefield.com
For more information, contact:Jeff GravesMarket Director, ResearchTel: +1 512 474 [email protected]

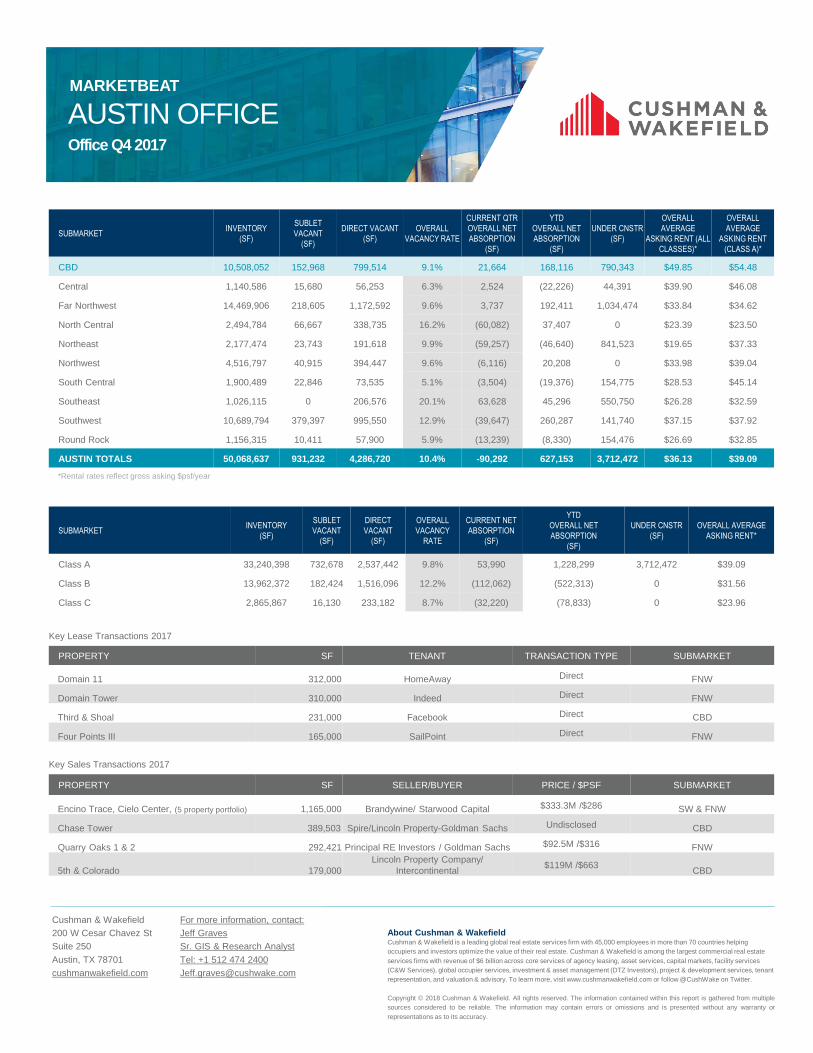
AUSTIN OFFICEOffice Q4 2017
MARKETBEAT
cushmanwakefield.com
Economic Indicators
Market Indicators (Overall, All Classes)
Overall Net Absorption/Overall Asking Rent4-QTR TRAILING AVERAGE
Overall Vacancy
Q4 2016 Q4 201712-Month
Forecast
Austin Employment 1,014k 1,037k
Austin Unemployment 3.4% 2.8%
U.S. Unemployment 4.7% 4.1%
Q4 2016 Q4 201712-Month
Forecast
Vacancy 8.2% 10.4%
Net Absorption (sf) 456K -90k
Under Construction (sf) 2.5M 3.7M
Average Asking Rent* $34.19 $36.13
*Rental rates reflect gross asking $psf/year
EconomyThe Austin market wrapped up 2017 much like it began – with job growth continuing to outpace national averages and an unemployment rate that remains one of the lowest in the country, coming in at a record low of 2.8% versus the national average of 4.1%. Fortune 500 companies including Facebook, Google, Indeed, Expedia and others proved they were bullish on the future of Austin by signing massive office leases in 2017. Furthermore, Austin’s housing market continues to sizzle at a
record pace. According to the Austin Board of Realtors, home sales in Austin jumped 2.2% from 2016, while the median home price increased 4.3% within the same time period.
Market OverviewThe Austin office market recorded approximately 90,000 square feet (SF) of negative absorption during Q4 2017. Although absorption was down for the quarter, the 2017 year-to-date total of overall absorption was on the positive side at just over +627,000 SF. Vacancy rates throughout the city remain relativity low. The overall vacancy rate in Austin fell slightly to 10.4%, while in the CBD, overall vacancy fell even further to 9.1%. The overall asking rate for the entire Austin market retreated slightly off its torrid pace, coming in at $36.13 per square foot (PSF) to end 2017. This still represents a year-over-year (YoY) increase of 5.7%. Class A product demand remains strong and continues to command the highest prices, particularly in the suburban markets, where Class A rates were up to $36.10 PSF to close out Q4 2017, a YoY increase of 6.4%. Class A rates in the CBD have followed suit and are up 2.7% YoY to $54.48 PSF.
OutlookMajor lease transactions were the theme of 2017 as blue-chip tenants took down large blocks of space throughout Austin. With several additional large transactions in the works for 2018, including Parsley Energy’s commitment to pre-lease 302,000 SF downtown, the outlook for Austin seems bright. A steady stream of corporate migration & expansion in addition to a healthy pipeline of younger start-up companies looking to call Austin home seems to be the norm. With leasing activity on the upswing and multiple new office developments on the horizon, we can expect to see Austin’s office market continue to strengthen.
AUSTIN OFFICE
$10
$20
$30
$40
0
200
400
600
2011 2012 2013 2014 2015 2016 2017
Net Absorption, SF (thousands) Asking Rent, $ PSF
5%
8%
10%
13%
15%
18%
20%
2011 2012 2013 2014 2015 2016 2017
Historical Average = 12%
AUSTIN OFFICEOffice Q4 2017
MARKETBEAT
About Cushman & WakefieldCushman & Wakefield is a leading global real estate services firm with 45,000 employees in more than 70 countries helping occupiers and investors optimize the value of their real estate. Cushman & Wakefield is among the largest commercial real estateservices firms with revenue of $6 billion across core services of agency leasing, asset services, capital markets, facility services (C&W Services), global occupier services, investment & asset management (DTZ Investors), project & development services, tenant representation, and valuation & advisory. To learn more, visit www.cushmanwakefield.com or follow @CushWake on Twitter.
Copyright © 2018 Cushman & Wakefield. All rights reserved. The information contained within this report is gathered from multiplesources considered to be reliable. The information may contain errors or omissions and is presented without any warranty orrepresentations as to its accuracy.
SUBMARKETINVENTORY
(SF)
SUBLET
VACANT
(SF)
DIRECT
VACANT
(SF)
OVERALL
VACANCY
RATE
CURRENT NET
ABSORPTION
(SF)
YTD
OVERALL NET
ABSORPTION
(SF)
UNDER CNSTR
(SF)
OVERALL AVERAGE
ASKING RENT*
Class A 33,240,398 732,678 2,537,442 9.8% 53,990 1,228,299 3,712,472 $39.09
Class B 13,962,372 182,424 1,516,096 12.2% (112,062) (522,313) 0 $31.56
Class C 2,865,867 16,130 233,182 8.7% (32,220) (78,833) 0 $23.96
Key Lease Transactions 2017
PROPERTY SF TENANT TRANSACTION TYPE SUBMARKET
Domain 11 312,000 HomeAway Direct FNW
Domain Tower 310,000 Indeed Direct FNW
Third & Shoal 231,000 Facebook Direct CBD
Four Points III 165,000 SailPoint Direct FNW
Key Sales Transactions 2017
PROPERTY SF SELLER/BUYER PRICE / $PSF SUBMARKET
Encino Trace, Cielo Center, (5 property portfolio) 1,165,000 Brandywine/ Starwood Capital $333.3M /$286 SW & FNW
Chase Tower 389,503 Spire/Lincoln Property-Goldman Sachs Undisclosed CBD
Quarry Oaks 1 & 2 292,421 Principal RE Investors / Goldman Sachs $92.5M /$316 FNW
5th & Colorado 179,000Lincoln Property Company/
Intercontinental $119M /$663 CBD
*Rental rates reflect gross asking $psf/year
SUBMARKETINVENTORY
(SF)
SUBLET
VACANT
(SF)
DIRECT VACANT
(SF)
OVERALL
VACANCY RATE
CURRENT QTR
OVERALL NET
ABSORPTION
(SF)
YTD
OVERALL NET
ABSORPTION
(SF)
UNDER CNSTR
(SF)
OVERALL
AVERAGE
ASKING RENT (ALL
CLASSES)*
OVERALL
AVERAGE
ASKING RENT
(CLASS A)*
CBD 10,508,052 152,968 799,514 9.1% 21,664 168,116 790,343 $49.85 $54.48
Central 1,140,586 15,680 56,253 6.3% 2,524 (22,226) 44,391 $39.90 $46.08
Far Northwest 14,469,906 218,605 1,172,592 9.6% 3,737 192,411 1,034,474 $33.84 $34.62
North Central 2,494,784 66,667 338,735 16.2% (60,082) 37,407 0 $23.39 $23.50
Northeast 2,177,474 23,743 191,618 9.9% (59,257) (46,640) 841,523 $19.65 $37.33
Northwest 4,516,797 40,915 394,447 9.6% (6,116) 20,208 0 $33.98 $39.04
South Central 1,900,489 22,846 73,535 5.1% (3,504) (19,376) 154,775 $28.53 $45.14
Southeast 1,026,115 0 206,576 20.1% 63,628 45,296 550,750 $26.28 $32.59
Southwest 10,689,794 379,397 995,550 12.9% (39,647) 260,287 141,740 $37.15 $37.92
Round Rock 1,156,315 10,411 57,900 5.9% (13,239) (8,330) 154,476 $26.69 $32.85
AUSTIN TOTALS 50,068,637 931,232 4,286,720 10.4% -90,292 627,153 3,712,472 $36.13 $39.09
Cushman & Wakefield200 W Cesar Chavez StSuite 250Austin, TX 78701cushmanwakefield.com
For more information, contact:Jeff GravesSr. GIS & Research AnalystTel: +1 512 474 [email protected]

AUSTIN OFFICEOffice Q4 2016
MARKETBEAT
AUSTIN OFFICEOffice Q3 2017
MARKETBEAT
cushmanwakefield.com
Economic Indicators
Market Indicators (Overall, All Classes)
Overall Net Absorption/Overall Asking Rent4-QTR TRAILING AVERAGE
Overall Vacancy
Q3 2016 Q3 201712-Month
Forecast
Austin Employment 1,004k 1,022k
Austin Unemployment 3.3% 3.1%
U.S. Unemployment 4.9% 4.4%
Q3 2016 Q3 201712-Month
Forecast
Vacancy 8.8% 10.5%
Net Absorption (sf) 420k 9k
Under Construction (sf) 1.8M 2.8M
Average Asking Rent* $34.00 $36.71
*Rental rates reflect gross asking $psf/year
EconomyThe Austin economy continued to show its vitality to close out Q3 2017. The city’s unemployment rate of 3.1% remains significantly
lower than both the national average of 4.4% and state average of 4.2%. Local job growth, while not as robust as 2016, continues to outpace national and state averages as well. High-tech and creative industries continue to fuel this economic expansion. Large companies, such as Facebook and Parsley Energy signed major leases in downtown Austin during Q3 2017, and leasing activity remains strong throughout the city.
Market OverviewAlthough overall citywide absorption totals dipped in Q3 2017 to 9,487 square feet (SF), the Austin market remains strong going into Q4 2017. Asking rates have continued to rise as space –particularly Class A product - has become more scarce, while vacancy rates remain relativity low. The overall vacancy rate in Austin remained stable at 10.5%, while in the CBD, overall vacancy decreased slightly to 9.7%. Asking rates were up yet again across all submarkets where the overall asking rate for the entire Austin market increased to $36.71 per square foot (PSF) –a year-over-year increase of 7.9%. As has been the case seemingly every quarter, asking rates in the CBD continue to hit record highs. The average rental rate in downtown Austin now stands at $51.52 PSF – a year-over-year increase of 6.9%. The average “Class A” rate in the CBD also increased to an all-time high, with an average asking rate of $55.77 PSF.
OutlookSignificant leasing activity and expansion by blue-chip companies such as Google, Facebook and Amazon reflect the ongoing confidence in the Austin office market. In addition, the market for younger start-up companies is strong and healthy. Although lease rates have continued to inch upwards, businesses appear unfazed and are looking to higher-priced, but amenity-rich facilities to attract and retain the best talent. The live, work, play lifestyle has become a powerful attraction to high-end companies and they continue to use it as a popular recruiting tool. Barring any unforeseen circumstances, Austin’s
business friendly spirit of innovation will continue to feed growth as a global tech hub and strengthen the local real estate market as we move into 2018.
AUSTIN OFFICE
$10
$20
$30
$40
0
200
400
600
2011 2012 2013 2014 2015 2016 Q3 2017
Net Absorption, SF (thousands) Asking Rent, $ PSF
5%
8%
10%
13%
15%
18%
20%
2011 2012 2013 2014 2015 2016 Q3 17
Historical Average = 12%

AUSTIN OFFICEOffice Q4 2016
MARKETBEAT
AUSTIN OFFICEOffice Q3 2017
MARKETBEAT
About Cushman & WakefieldCushman & Wakefield is a leading global real estate services firm that helps clients transform the way people work, shop, and live.Our 43,000 employees in more than 60 countries help investors and occupiers optimize the value of their real estate by combiningour global perspective and deep local knowledge with an impressive platform of real estate solutions. Cushman & Wakefield isamong the largest commercial real estate services firms with revenue of $5 billion across core services of agency leasing, assetservices, capital markets, facility services (C&W Services), global occupier services, investment & asset management (DTZInvestors), project & development services, tenant representation, and valuation & advisory. To learn more, visitwww.cushmanwakefield.com or follow @CushWake on Twitter.
Copyright © 2017 Cushman & Wakefield. All rights reserved. The information contained within this report is gathered from multiplesources considered to be reliable. The information may contain errors or omissions and is presented without any warranty orrepresentations as to its accuracy.
SUBMARKETINVENTORY
(SF)
SUBLET
VACANT
(SF)
DIRECT
VACANT
(SF)
OVERALL
VACANCY
RATE
CURRENT NET
ABSORPTION
(SF)
YTD
OVERALL NET
ABSORPTION
(SF)
UNDER CNSTR
(SF)
OVERALL AVERAGE
ASKING RENT*
Class A 33,092,477 776,509 2,561,319 10.1% 260,819 987,792 2,760,743 $39.71
Class B 14,004,525 278,461 1,401,501 12.0% (121,561) (491,227) 0 $31.34
Class C 2,846,387 13,907 192,201 7.2% (129,771) (52,129) 0 $24.99
Key Lease Transactions Q3 2017
PROPERTY SF TENANT TRANSACTION TYPE SUBMARKET
Third & Shoal 231,000 Facebook Direct CBD
2010 E. 6th St. 115,000 Main Street Hub Direct E
301 Congress 50,000 Parsley Energy Direct CBD
Bergstrom Building 312 49,293 OpCity Direct SE
Key Sales Transactions Q3 2017
PROPERTY SF SELLER/BUYER PRICE / $PSF SUBMARKET
5th & Colorado 179,000Lincoln Property Company/
Intercontinental $119,000,000 /$663 CBD
2700 La Frontera 97,311Red Leaf Properties / Empire Square
Group Undisclosed RR
*Rental rates reflect gross asking $psf/year
SUBMARKETINVENTORY
(SF)
SUBLET
VACANT
(SF)
DIRECT VACANT
(SF)
OVERALL
VACANCY RATE
CURRENT QTR
OVERALL NET
ABSORPTION
(SF)
YTD
OVERALL NET
ABSORPTION
(SF)
UNDER CNSTR
(SF)
OVERALL
AVERAGE
ASKING RENT (ALL
CLASSES)*
OVERALL
AVERAGE
ASKING RENT
(CLASS A)*
CBD 10,497,974 217,109 798,410 9.7% (29,508) 105,079 659,252 $51.52 $55.77
Central 1,140,586 26,054 62,319 7.7% (21,754) (38,666) 0 $38.85 $44.82
Far Northwest 14,476,826 310,890 1,187,841 10.4% 84,532 84,877 553,567 $34.26 $35.34
North Central 2,456,719 66,667 273,408 13.8% (107,001) 102,734 0 $23.76 $23.53
Northeast 2,174,478 23,743 137,202 7.4% 14,795 (844) 518,711 $25.56 $41.22
Northwest 4,425,608 48,018 343,178 8.8% (10,363) (24,188) 95,863 $30.08 $35.03
South Central 1,898,974 200 102,173 5.4% (6,033) (25,368) 90,500 $29.35 $44.95
Southeast 1,026,115 0 270,204 26.3% (1,058) (18,332) 550,750 $25.93 $32.08
Southwest 10,689,794 371,471 929,939 12.2% 84,700 273,656 137,624 $36.33 $37.25
Round Rock 1,156,315 4,725 50,347 4.8% 1,177 4,909 154,476 $27.91 $31.60
AUSTIN TOTALS 49,943,389 1,068,877 4,155,021 10.5% 9,487 463,857 2,760,743 $36.71 $39.71
Cushman & Wakefield200 W Cesar Chavez StSuite 250Austin, TX 78701cushmanwakefield.com
For more information, contact:Jeff GravesSr. GIS & Research AnalystTel: +1 512 474 [email protected]
AUSTIN OFFICEOffice Q4 2016
MARKETBEAT
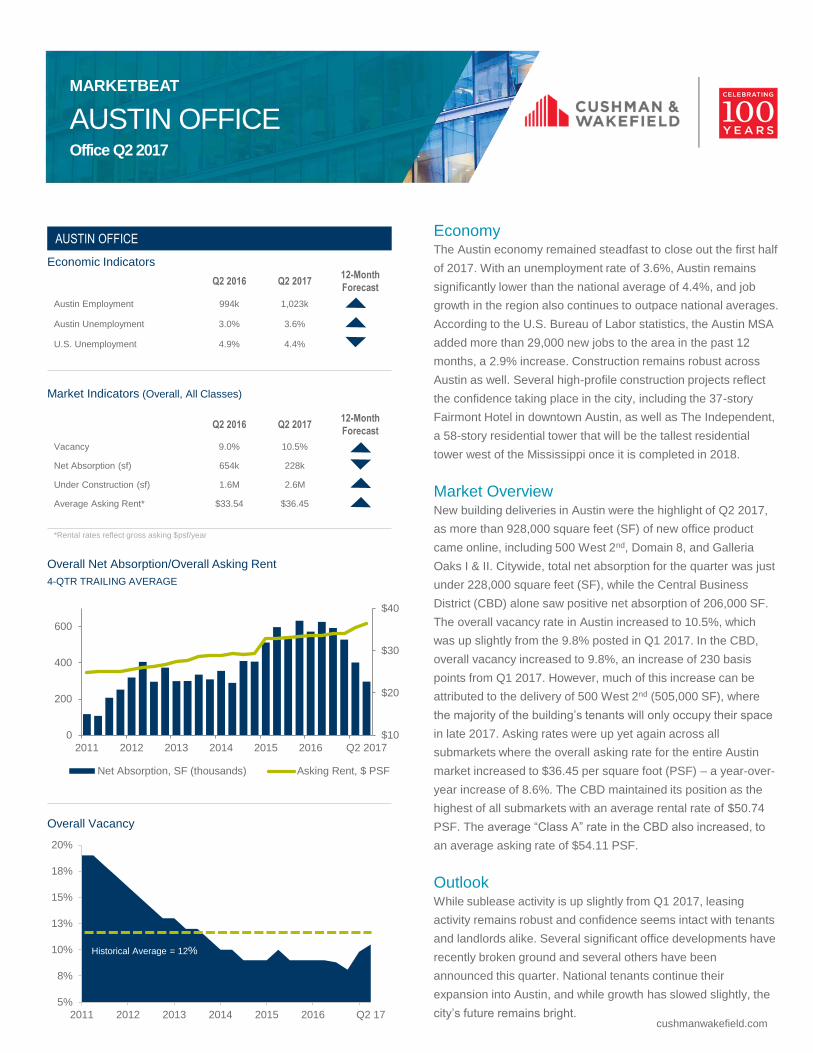
AUSTIN OFFICEOffice Q2 2017
MARKETBEAT
cushmanwakefield.com
Economic Indicators
Market Indicators (Overall, All Classes)
Overall Net Absorption/Overall Asking Rent
4-QTR TRAILING AVERAGE
Overall Vacancy
Q2 2016 Q2 201712-Month
Forecast
Austin Employment 994k 1,023k
Austin Unemployment 3.0% 3.6%
U.S. Unemployment 4.9% 4.4%
Q2 2016 Q2 201712-Month
Forecast
Vacancy 9.0% 10.5%
Net Absorption (sf) 654k 228k
Under Construction (sf) 1.6M 2.6M
Average Asking Rent* $33.54 $36.45
*Rental rates reflect gross asking $psf/year
EconomyThe Austin economy remained steadfast to close out the first half
of 2017. With an unemployment rate of 3.6%, Austin remains
significantly lower than the national average of 4.4%, and job
growth in the region also continues to outpace national averages.
According to the U.S. Bureau of Labor statistics, the Austin MSA
added more than 29,000 new jobs to the area in the past 12
months, a 2.9% increase. Construction remains robust across
Austin as well. Several high-profile construction projects reflect
the confidence taking place in the city, including the 37-story
Fairmont Hotel in downtown Austin, as well as The Independent,
a 58-story residential tower that will be the tallest residential
tower west of the Mississippi once it is completed in 2018.
Market OverviewNew building deliveries in Austin were the highlight of Q2 2017,
as more than 928,000 square feet (SF) of new office product
came online, including 500 West 2nd, Domain 8, and Galleria
Oaks I & II. Citywide, total net absorption for the quarter was just
under 228,000 square feet (SF), while the Central Business
District (CBD) alone saw positive net absorption of 206,000 SF.
The overall vacancy rate in Austin increased to 10.5%, which
was up slightly from the 9.8% posted in Q1 2017. In the CBD,
overall vacancy increased to 9.8%, an increase of 230 basis
points from Q1 2017. However, much of this increase can be
attributed to the delivery of 500 West 2nd (505,000 SF), where
the majority of the building’s tenants will only occupy their space
in late 2017. Asking rates were up yet again across all
submarkets where the overall asking rate for the entire Austin
market increased to $36.45 per square foot (PSF) – a year-over-
year increase of 8.6%. The CBD maintained its position as the
highest of all submarkets with an average rental rate of $50.74
PSF. The average “Class A” rate in the CBD also increased, to
an average asking rate of $54.11 PSF.
OutlookWhile sublease activity is up slightly from Q1 2017, leasing
activity remains robust and confidence seems intact with tenants
and landlords alike. Several significant office developments have
recently broken ground and several others have been
announced this quarter. National tenants continue their
expansion into Austin, and while growth has slowed slightly, the
city’s future remains bright.
AUSTIN OFFICE
$10
$20
$30
$40
0
200
400
600
2011 2012 2013 2014 2015 2016 Q2 2017
Net Absorption, SF (thousands) Asking Rent, $ PSF
5%
8%
10%
13%
15%
18%
20%
2011 2012 2013 2014 2015 2016 Q2 17
Historical Average = 12%

AUSTIN OFFICEOffice Q4 2016
MARKETBEAT
AUSTIN OFFICEOffice Q2 2017
MARKETBEAT
About Cushman & WakefieldCushman & Wakefield is a leading global real estate services firm that helps clients transform the way people work, shop, and live.
Our 43,000 employees in more than 60 countries help investors and occupiers optimize the value of their real estate by combining
our global perspective and deep local knowledge with an impressive platform of real estate solutions. Cushman & Wakefield is
among the largest commercial real estate services firms with revenue of $5 billion across core services of agency leasing, asset
services, capital markets, facility services (C&W Services), global occupier services, investment & asset management (DTZ
Investors), project & development services, tenant representation, and valuation & advisory. To learn more, visit
www.cushmanwakefield.com or follow @CushWake on Twitter.
Copyright © 2017 Cushman & Wakefield. All rights reserved. The information contained within this report is gathered from multiple
sources considered to be reliable. The information may contain errors or omissions and is presented without any warranty or
representations as to its accuracy.
SUBMARKETINVENTORY
(SF)
SUBLET
VACANT
(SF)
DIRECT
VACANT
(SF)
OVERALL
VACANCY
RATE
CURRENT NET
ABSORPTION
(SF)
YTD
OVERALL NET
ABSORPTION
(SF)
UNDER CNSTR
(SF)
OVERALL AVERAGE
ASKING RENT*
Class A 32,702,331 763,047 2,724,519 10.7% 455,059 696,328 2,647,609 $39.19
Class B 13,865,758 299,899 1,365,454 12.0% (206,529) (463,789) 0 $30.24
Class C 2,952,656 1,362 79,137 2.7% (20,802) 73,480 0 $26.67
Key Lease Transactions Q2 2017
PROPERTY SF TENANT TRANSACTION TYPE SUBMARKET
Domain 11 315,000 HomeAway Direct FNW
Broadmoor 55,404 IBM Direct FNW
Regency Office Center 55,000 Mood Media Direct SC
Paloma Ridge A 30,000 Charter Direct FNW
Key Sales Transactions Q2 2017
PROPERTY SF SELLER/BUYER PRICE / $PSF SUBMARKET
Capital Ridge 217,000 Riverside Resources / GLL RE Partners $94,745,243 /$437 SW
Cedar Park Medical Bldg B 83,393
Duke Realty / Healthcare Trust of
AmericaUndisclosed
FNW
Crystal Park Plaza 58,145
Farmers New World / Hayman
PropertiesUndisclosed
RR
916 S. Capital of Texas Hwy 55,216 JMA Ventures / Austin Stone Church $11,120,000 / $201 SW
*Rental rates reflect gross asking $psf/year
SUBMARKETINVENTORY
(SF)
SUBLET
VACANT
(SF)
DIRECT VACANT
(SF)
OVERALL
VACANCY RATE
CURRENT QTR
OVERALL NET
ABSORPTION
(SF)
YTD
OVERALL NET
ABSORPTION
(SF)
UNDER CNSTR
(SF)
OVERALL
AVERAGE
ASKING RENT (ALL
CLASSES)*
OVERALL
AVERAGE
ASKING RENT
(CLASS A)*
CBD 10,520,697 233,548 799,009 9.8% 205,513 116,209 659,252 $50.74 $54.11
Central 1,137,208 33,892 42,356 6.7% (6,439) (16,912) 0 $40.28 $45.69
Far Northwest 14,285,038 353,657 1,270,824 11.4% 29,725 (11,945) 530,704 $33.66 $34.29
North Central 2,589,277 45,868 239,023 11.0% (80,341) 160,280 0 $22.55 $22.50
Northeast 2,174,478 26,772 149,245 8.1% (37,032) (15,916) 378,711 $26.52 $39.05
Northwest 4,323,009 60,617 354,092 9.6% (33,924) (47,122) 95,863 $31.29 $34.55
South Central 2,152,971 200 116,640 5.4% (35,761) (39,835) 90,500 $28.54 $44.95
Southeast 992,890 0 235,921 23.8% (2,665) (13,254) 579,955 $25.12 $28.16
Southwest 10,411,123 305,029 908,052 11.7% 174,937 173,206 312,624 $36.69 $37.42
Round Rock 1,156,315 4,725 53,948 5.1% 13,715 1,308 0 $28.04 $31.44
AUSTIN TOTALS 49,743,006 1,064,308 4,169,110 10.5% 227,728 306,019 2,647,609 $36.45 $39.19
Cushman & Wakefield
200 W Cesar Chavez St
Suite 250
Austin, TX 78701
cushmanwakefield.com
For more information, contact:
Jeff Graves
Sr. GIS & Research Analyst
Tel: +1 512 474 2400

AUSTIN OFFICEOffice Q4 2016
MARKETBEAT
cushmanwakefield.com
AUSTIN OFFICEOffice Q1 2017
MARKETBEAT
Economic Indicators
Market Indicators (Overall, All Classes)
Overall Net Absorption/Overall Asking Rent4Q TRAILING AVERAGE
Overall Vacancy
Q1 2016 Q1 2017 12-Month Forecast
Austin Employment 987k 1,016k
Austin Unemployment 3.3% 3.4%
U.S. Unemployment 4.9% 4.8%
Q1 2016 Q1 2017 12-Month Forecast
Vacancy 8.5% 9.8%
Net Absorption (sf) 581k 116k
Under Construction (sf) 1.7M 3.2M
Average Asking Rent* $33.52 $35.45
*Rental rates reflect gross asking $psf/year
EconomyThe Austin economy remained robust in the first quarter of 2017. Job growth remains strong and the unemployment rate is still one of the lowest in the country, coming in at 3.4% versus the national average of 4.8%. Nationally, the technology sector is the leading industry for real estate expansion and that is certainly the case in Austin as more and more tech companies relocate to or expand operations in the capital city. Additionally, Austin’s tourism industry continues to thrive, with millions of visitors making their way to Austin each year and pumping millions of dollars into the local economy.
Market OverviewThe Austin office market recorded just over 153,000 square feet (SF) of net absorption during Q1 2017. While several submarkets experienced negative absorption, move-ins by major tenants, including Home Depot (190,000 SF) and Samsung (102,000 SF) kept citywide net absorption figures positive. The strongest absorption increase occurred in the North Central (NC) submarket, which saw net absorption of more than 240,000 SF. In the Central Business District (CBD), we saw negative absorption of approximately 87,000 SF. However, a lack of quality supply in the CBD has kept overall vacancy rates low, with an overall rate of 7.5% and 6.7% for “Class A” properties. Citywide, overall vacancy rates also saw an increase, rising to 9.8%, up 1.6 percentage points from Q4 2016.Rising taxes and operating expenses (OPEX) pushed asking rates up across all submarkets. The overall asking rate for the entire Austin market increased to $35.45 per square foot (PSF), a year-over-year increase of 5.7%. The CBD maintained its position as the highest across all submarkets with an average rental rate of $49.85 PSF and is up $0.78 from its Q4 2016 mark. The average “Class A” rate in the CBD remained stable, with an average asking rate of $53.02 PSF.
OutlookLeasing activity was once again strong as we wrapped up the first quarter of 2017. However, an excess supply of sublease space looms in the market with close to a half million square feet of sublet space set to deliver by year’s end. While this should be worth monitoring, optimism should reign as demand for high-end space remains prevalent throughout the city and job growth, while not as rampant as 2016, should continue to fuel Austin’s expansion.
AUSTIN OFFICE
$10
$20
$30
$40
0
200
400
600
2011 2012 2013 2014 2015 2016 Q1 17
Net Absorption, SF (thousands) Asking Rent, $ PSF
5%
8%
10%
13%
15%
18%
20%
2011 2012 2013 2014 2015 2016 Q1 17
Historical Average = 12%

AUSTIN OFFICEOffice Q4 2016
MARKETBEAT
cushmanwakefield.com
AUSTIN OFFICEOffice Q1 2017
MARKETBEAT
SUBMARKET INVENTORY(SF)
SUBLET VACANT
(SF)
DIRECT VACANT
(SF)
OVERALL VACANCY
RATE
CURRENT NET ABSORPTION
(SF)
YTD OVERALL NET ABSORPTION
(SF)
UNDER CNSTR(SF)
OVERALL AVERAGE ASKING RENT*
Class A 31,777,487 772,207 2,442,368 10.1% 269,583 269,583 3,258,552 $37.86
Class B 13,852,177 246,703 1,276,285 11.0% (210,616) (210,616) - $30.37
Class C 3,071,419 1,362 160,732 5.3% 94,282 94,282 - $27.04
Key Lease Transactions Q1 2017
PROPERTY SF TENANT TRANSACTION TYPE SUBMARKET
Springdale General 60,336 Notley Ventures Direct NE
Encino Trace II 42,000 Alien Vault Direct SW
301 Congress 40,000 Gerson Lehrman Group Direct CBD
500 W. 2nd 33,932 Firmspace Direct CBD
Key Sales Transactions Q1 2017
PROPERTY SF SELLER/BUYER PRICE / $PSF SUBMARKET
Chase Tower 389,503 Spire/Lincoln Property-Goldmans Sachs Undisclosed CBD
Quarry Oaks 1 & 2 292,421 Principal RE Investors/Goldman Sachs $92,500,000/$316 FNW
Lake View Plaza 120,559Equity Commonwealth/Riverside
Resources Undisclosed FNW
Quarry Lake Business Center 117,265Equity Commonwealth/Riverside
Resources Undisclosed FNW
*Rental rates reflect gross asking $psf/year
SUBMARKET INVENTORY(SF)
SUBLET VACANT
(SF)
DIRECT VACANT(SF)
OVERALL VACANCY RATE
CURRENT QTR OVERALL NET ABSORPTION
(SF)
YTD OVERALL NET ABSORPTION
(SF)
UNDER CNSTR(SF)
OVERALL AVERAGE
ASKING RENT (ALL CLASSES)*
OVERALL AVERAGE
ASKING RENT (CLASS A)*
CBD 10,031,293 127,406 623,397 7.5% (87,723) (87,723) 1,152,584 $49.59 $53.02
Central 1,130,401 23,545 45,904 6.1% (37,268) (37,268) - $40.66 $45.56
Far Northwest 13,993,980 364,963 1,074,411 10.3% (59,920) (59,920) 599,000 $32.90 $33.41
North Central 2,603,637 33,993 172,815 7.9% 240,621 240,621 - $23.95 $26.88
Northeast 2,174,478 1,470 261,082 12.1% 20,716 20,716 297,000 $25.29 $40.50
Northwest 4,287,704 58,432 323,532 8.9% 13,903 13,903 99,245 $30.98 $33.53
South Central 2,152,970 200 74,279 3.5% 2,526 2,526 90,500 $25.44 $46.88
Southeast 996,910 - 239,507 24.0% 3,246 3,246 589,204 $24.71 $25.25
Southwest 10,184,605 326,125 887,229 11.9% 69,555 69,555 431,019 $36.60 $37.03
Round Rock 1,156,315 12,407 59,981 6.3% (12,407) (12,407) - $28.52 $32.37
AUSTIN TOTALS 48,712,293 948,541 3,762,137 9.8% 153,249 153,249 3,258,552 $35.45 $37.86
Cushman & Wakefield200 W Cesar Chavez StSuite 250Austin, TX 78701cushmanwakefield.com
For more information, contact:Jeff GravesSr. GIS & Research AnalystTel: +1 512 474 [email protected]

AUSTIN OFFICEOffice Q4 2016
MARKETBEAT
cushmanwakefield.com
Economic Indicators
Market Indicators (Overall, All Classes)
Overall Net Absorption/Overall Asking Rent4Q TRAILING AVERAGE
Overall Vacancy
Q4 2015 Q4 2016 12-Month Forecast
Austin Employment 978k 997k
Austin Unemployment 3.4% 3.5%
U.S. Unemployment 5.0% 4.8%
Q4 2015 Q4 2016 12-Month Forecast
Vacancy 9.1% 8.2%
Net Absorption (sf) 713k 2.1M
Under Construction (sf) 2.3M 2.5M
Average Asking Rent* $33.37 $34.19
*Rental rates reflect gross asking $psf/year
EconomyThe Austin market wrapped up 2016 much like it began – with population in the metro area increasing at a record pace, phenomenal job growth, and an unemployment rate that remains one of the lowest in the country, coming in at 3.5% versus the national average of 4.8%. The technology sector is still the driving force behind this success and Fortune 500 companies continue to move to or expand their operations in Austin. This has an indirect benefit for smaller businesses and the economy as a whole. Austin’s tourism industry remains robust as well. According to the Austin Convention & Visitors Bureau, there were more than 24 million visitors to Austin in 2016, which led to an economic impact of $7 billion to the Live Music Capital of the World.
Market OverviewThe Austin office market recorded just under 460,000 square feet (SF) of overall absorption during Q4 2016. The strongest absorption increase occurred in the Southeast (SE) – due in large part to Superior Health occupying 219,000 SF. In the Central Business District (CBD), there was a slight increase in absorption with just over 43,000 SF. The overall vacancy rate in Austin fell to 8.2%, down slightly from the 8.8% posted in Q3 2016. The CBD saw even lower vacancy, with an overall rate of 6.2% for all classes, and 5.8% for “Class A” properties. The overall asking rate for the entire Austin market increased again, to $34.19 per square foot (PSF), a year-over-year increase of 2.5%. The CBD average rental rate of $49.07 PSF maintained its position as the highest across all submarkets. Additionally, the average “Class A” rate in the CBD climbed significantly to an all-time high of $53.05 PSF, a year-over-year increase of 11.8%.
OutlookAs we kick-off 2017, we can expect to see a spike in absorption as several large users, including Google, Samsung, and YETI occupy their new space. While asking rates in the CBD seem to have no limit as demand for high-end space remains strong, we should expect to see some stabilization of rates in the suburbs as competition from sublet space and new deliveries balance out asking rates. While we may not see the fervor experienced in the previous 18 months, strong corporate migration and expansion in Austin should remain steady.
AUSTIN OFFICE
$10
$20
$30
$40
0
200
400
600
2011 2012 2013 2014 2015 Q4 16
Net Absorption, SF (thousands) Asking Rent, $ PSF
5%
8%
10%
13%
15%
18%
20%
2011 2012 2013 2014 2015 Q4 16
Historical Average = 12.2%

MARKETBEAT
About Cushman & WakefieldCushman & Wakefield is a leading global real estate services firm that helps clients transform the way people work, shop, and live.The firm’s 43,000 employees in more than 60 countries provide deep local and global insights that create significant value foroccupiers and investors around the world. Cushman & Wakefield is among the largest commercial real estate services firms withrevenue of $5 billion across core services of agency leasing, asset services, capital markets, facility services (C&W Services), globaloccupier services, investment & asset management (DTZ Investors), project & development services, tenant representation, andvaluation & advisory. To learn more, visit www.cushmanwakefield.com or follow @CushWake on Twitter.
Copyright © 2016 Cushman & Wakefield. All rights reserved. The information contained within this report is gathered from multiplesources considered to be reliable. The information may contain errors or omissions and is presented without any warranty orrepresentations as to its accuracy.
AUSTIN OFFICE Office Q4 2016
SUBMARKET INVENTORY(SF)
SUBLET VACANT
(SF)
DIRECT VACANT
(SF)
OVERALL VACANCY
RATE
CURRENT NET ABSORPTION
(SF)
YTD OVERALL NET ABSORPTION
(SF)
UNDER CNSTR(SF)
OVERALL AVERAGE ASKING RENT*
Class A 32,484,656 502,177 2,190,776 8.2% 239,481 1,692,075 2,537,842 $36.95
Class B 13,650,877 87,506 1,119,079 8.8% 194,440 366,127 - $29.48
Class C 3,196,133 23,884 133,043 4.9% 21,828 52,083 - $24.78
Key Lease Transactions 2016
PROPERTY SF TENANT TRANSACTION TYPE SUBMARKET
5900 E. Ben White 219,699 Superior Health Direct SE
Lantana Ridge 175,000 YETI Direct SW
3900 San Clemente 112,000 Samsung Direct SW
Domain 4 104,448 Accruent Direct FNW
Key Sales Transactions 2016
PROPERTY SF SELLER/BUYER PRICE / $PSF SUBMARKET
100 Congress 411,536 MetLife/Invesco $250,000,000/$607 CBD
Stonebridge Plaza I & II 383,131 Heitman/KBS Realty Advisors $124,299,944/$324 FNW
701 Brazos (Austin Centre) 326,300 Lincoln/Invesco $123,300,000/$378 CBD
Champion Office Park 221,136 Endeavor/Menlo Equities $92,900,000/$420 NW
*Rental rates reflect gross asking $psf/year
SUBMARKET INVENTORY(SF)
SUBLET VACANT
(SF)
DIRECT VACANT(SF)
OVERALL VACANCY RATE
CURRENT QTR OVERALL NET ABSORPTION
(SF)
YTD OVERALL NET ABSORPTION
(SF)
UNDER CNSTR(SF)
OVERALL AVERAGE
ASKING RENT (ALL CLASSES)*
OVERALL AVERAGE
ASKING RENT (CLASS A)*
CBD 10,156,470 90,839 539,040 6.20% 43,254 226,867 807,584 $49.07 $53.05
Central 1,165,069 35,258 30,721 5.66% (8,534) 59,392 - $37.37 $45.61
Far Northwest 14,095,644 185,760 969,546 8.20% 84,782 797,157 291,000 $31.79 $32.43
North Central 2,408,271 23,326 194,583 9.05% 66,725 80,320 - $23.26 $26.77
Northeast 2,136,280 12,657 126,611 6.52% (920) 113,084 229,290 $21.31 $43.50
Northwest 4,230,409 28,259 401,276 10.15% 9,976 107,780 99,245 $31.09 $32.65
South Central 2,215,425 - 78,490 3.54% (14,061) (30,743) 90,500 $29.18 $46.88
Southeast 996,910 2,528 220,046 22.33% 217,815 207,743 589,204 $25.56 $28.20
Southwest 10,784,612 229,914 836,672 9.89% 29,471 408,946 431,019 $35.34 $35.89
Round Rock 1,142,576 - 45,913 4.02% 27,241 139,739 - $25.83 $29.07
AUSTIN TOTALS 49,331,666 608,541 3,442,898 8.2% 455,749 2,110,285 2,537,842 $34.19 $36.95
Cushman & Wakefield200 W Cesar Chavez StSuite 250Austin, TX 78701cushmanwakefield.com
For more information, contact:Jeff GravesSr. GIS & Research AnalystTel: +1 512 474 [email protected]

AUSTIN OFFICEOffice Q3 2016
MARKETBEAT
cushmanwakefield.com
Economic Indicators
Market Indicators (Overall, All Classes)
Overall Net Absorption/Overall Asking Rent4-QTR TRAILING AVERAGE
Overall Vacancy
Q3 15 Q3 1612-Month
Forecast
Austin Employment 965K 998K
Austin Unemployment 3.3% 3.2%
U.S. Unemployment 5.2% 4.9%
Q3 15 Q3 1612-Month
Forecast
Vacancy 9.0% 8.8%
Net Absorption (SF, YTD) 1.81M 1.65M
Under Construction (SF) 2.78M 1.8M
Average Asking Rent* $33.02 $34.00
*Rental rates reflect gross asking $PSF/year
EconomyAccording to a recent article by Forbes, the Austin metro area has the nation’s fastest-growing economy. The population boom has continued throughout Central Texas, and has expanded into the suburbs of Austin and nearby towns including Georgetown and New Braunfels, the #1 and #2 fastest-growing cities in the country, respectively, according to the US Census Bureau. This phenomenal growth trend has resulted in the Austin MSA nearly doubling its population over the last 20 years. Despite the growing population, Austin’s unemployment rate remains healthy, hovering around 3% over the last six quarters, ranking it as one of the lowest rates in the country. Additionally, money continues to flow through Austin. According to the Austin
American Statesmen, the metro’s GDP has increased over $20
billion in the last six years. Major corporations, such as Oracle, who broke ground on their 560,000 SF campus in SE Austin this quarter, continue to plant roots in the Austin MSA, bringing more jobs and revenue to the economy.
Market OverviewDespite a decrease in absorption this quarter, the Austin market remains strong going into Q4 2016. Asking rates have continued to rise as space has become more scarce with decreased vacancy rates across most submarkets. In the CBD, asking rates have increased significantly, once again. Class A rates in particular are at record highs, with several properties in the CBD asking more than $60 (PSF). The overall market rate increased to $34.00 PSF, a $0.46 increase from Q2 2016. In the Far Northwest (FNW), The Domain has experienced immense attraction with its unique blend of office, retail, and residential options. All of the 1.5million square feet (MSF) of office space has been accounted for and there are plans to add another 1.5 MSF of office in the very near future. In the Southwest (SW), a large sublease of 58,000 SF disrupted the absorption. However, this submarket has remained stable and will soon experience an increase in absorption. YETI Coolers will occupy its 175,000 SF headquarters at Lantana Ridge in early 2017. Additionally, Samsung will move into 3900 San Clemente Q1 2018, taking 112,000 SF.
OutlookThe accolades continue to pour into Austin from various publications including, #1 America’s Cities for the Future and #2 Best Places to Live in the U.S. Additionally, Austin is one of the most educated cities in the country, ranking 3rd nationally in a recent study by Wallethub. National companies are recognizing the fact Austin has little trouble attracting a quality labor force and those companies continue to expand or relocate to the area. Furthermore, annual events such as Austin City Limits Festival (ACL), Formula One, SXSW and UT Athletics bring in more than $2 Billion every year to the Austin economy further bolstering the city’s diverse economic viability. Barring any unforeseen
circumstances, the outlook for the Austin office market appears strong as we head into 2017.
AUSTIN OFFICE
Historical Average = 15%
5%
8%
10%
13%
15%
18%
20%
2011 2012 2013 2014 2015 Q3 16
Historical Average = 12.2%
$10
$20
$30
$40
0
200
400
600
2011 2012 2013 2014 2015 Q3 16
Net Absorption, SF (thousands) Asking Rent, $ PSF

MARKETBEAT
About Cushman & WakefieldCushman & Wakefield is a leading global real estate services firm that helps clients transform the way people work, shop, and live.Our 43,000 employees in more than 60 countries help investors and occupiers optimize the value of their real estate by combiningour global perspective and deep local knowledge with an impressive platform of real estate solutions. Cushman & Wakefield isamong the largest commercial real estate services firms with revenue of $5 billion across core services of agency leasing, assetservices, capital markets, facility services (C&W Services), global occupier services, investment & asset management (DTZInvestors), project & development services, tenant representation, and valuation & advisory. To learn more, visitwww.cushmanwakefield.com or follow @CushWake on Twitter.
Copyright © 2016 Cushman & Wakefield. All rights reserved. The information contained within this report is gathered from multiplesources considered to be reliable. The information may contain errors or omissions and is presented without any warranty orrepresentations as to its accuracy.
AUSTIN OFFICEOffice Q3 2016
INVENTORY
(SF)
SUBLET
VACANT
(SF)
DIRECT
VACANT
(SF)
OVERALL
VACANCY RATE
CURRENT QTR
OVERALL NET
ABSORPTION
(SF)
YTD
OVERALL NET
ABSORPTION
(SF)
UNDER CNSTR
(SF)AVERAGE
ASKING RENT*
Class A 32,513,786 628,212 2,373,323 9.23% 367,825 1,452,594 1,774,893 $36.47
Class B 13,612,373 107,712 966,077 7.89% 43,317 171,687 - $28.49
Class C 3,196,133 23,884 154,871 5.60% 8,376 30,255 - $24.14
SUBMARKETINVENTORY
(SF)
SUBLET
VACANT
(SF)
DIRECT VACANT
(SF)
OVERALL
VACANCY RATE
CURRENT QTR
OVERALL NET
ABSORPTION
(SF)
YTD
OVERALL NET
ABSORPTION
(SF)
UNDER CNSTR
(SF)
OVERALL
AVERAGE
ASKING RENT (ALL
CLASSES)*
OVERALL
AVERAGE
ASKING RENT
(CLASS A)*
CBD 10,156,470 111,509 474,335 5.77% -23,204 183,613 707,584 $48.18 $51.56
Central 1,165,069 29,997 22,187 4.48% 3,935 67,926 - $38.54 $46.65
Far Northwest 14,023,642 302,676 1,120,528 10.15% 376,775 672,293 316,500 $32.72 $33.43
North Central 2,408,271 23,326 256,224 11.61% 5,316 13,595 - $24.08 $26.91
Northeast 2,136,280 12,657 118,792 6.15% 15,713 114,004 229,290 $20.54 $43.50
Northwest 4,230,409 61,174 300,356 8.55% -336 97,804 - $30.23 $31.74
South Central 2,215,425 - 59,501 2.69% 4,687 -16,682 90,500 $28.01 -
Southeast 992,420 2,528 241,134 21.83% 1,465 -10,072 - $23.54 $28.36
Southwest 10,851,730 215,941 889,005 10.18% 3,231 379,475 431,019 $36.24 $36.78
Round Rock 1,142,576 - 39,209 3.43% -8,146 112,498 - $27.41 $29.19
AUSTIN TOTALS 49,322,292 759,808 3,494,271 8.80% 419,518 1,654,536 1,774,893 $34.00 $36.47
Key Lease Transactions Q3 2016
PROPERTY SF TENANT TRANSACTION TYPE SUBMARKET
3900 San Clemente 112,000 Samsung New SW
Research Park Plaza V 72,709 Cadence New FNW
Riata Corp IV 16,600 Zynga New FNW
Riata Corp IV 15,000 Mobiletron New FNW
Key Sales Transactions Q3 2016
PROPERTY SF SELLER/BUYER PRICE / $PSF SUBMARKET
100 Congress 411,536 MetLife/Invesco (49%) MetLife (51%) $250,000,000 CBD
Stonebridge Plaza I&II 383,131 Heitman/KBS Realty Advisors $124,299,944 FNW
*Rental rates reflect gross asking $PSF/year
Cushman & Wakefield200 W Cesar Chavez StSuite 250Austin, TX 78701cushmanwakefield.com
For more information, contact:Jeff GravesSr. GIS & Research AnalystTel: +1 512 474 [email protected]

Office Snapshot Q2 2016Austin
MARKETBEAT
cushmanwakefield.com
Economic Indicators
Market Indicators (Overall, All Classes)
Overall Net Absorption/Overall Asking Rent4Q TRAILING AVERAGE
Overall Vacancy
`Q2 2015 Q2 2016 12-Month
ForecastAustin Employment 953k 987k
Austin Unemployment 3.3% 3.0%
U.S. Unemployment 5.4% 4.9%
Q2 2015 Q2 2016 12-Month Forecast
Vacancy 9.7% 9.0%
Net Absorption (sf) 440,367 653,778
Under Construction (sf) 2,987,824 1,596,802
Average Asking Rent* $32.83 $33.54
*Rental rates reflect gross asking $psf/year
EconomyThe Austin economy continues to impress. With an unemployment rate of 3.0%, Austin remains significantly lower than the national average of 4.9%. Job growth in the region also continues to outpace national averages. According to the U.S. Bureau of Labor Statistics, the Austin MSA added more than 34,000 new jobs to the area in the past 12 months, a 3.6% increase. Population figures continue to follow a similar path. A recent demographic study by the City of Austin indicated there was a net population gain of more than 150 people per day added to the Austin MSA. This includes Georgetown, TX, a north Austin suburb, which was recently ranked #1 as the fastest growing city in the country according to the U.S. Census Bureau.
Market OverviewThe Austin office market recorded 653,778 square feet (SF) of overall absorption during 2Q 2016. The Southwest (SW) submarket posted the highest absorption total of 275,813 SF, a large portion of which can be attributed to Apple Inc. occupying 217,490 SF in the recently delivered Capital Ridge building. The overall vacancy rate in Austin increased to 9.0%, up slightly from the 8.5% vacancy posted in 1Q 2016. Vacancy rates in the Central Business District (CBD) also increased marginally as compared to 1Q 2016, but still remain healthy at 5.9%. The low vacancy rates coupled with the impressive absorption numbers have continued to push average rental rates higher. The overall full service rate for Austin rose slightly to $33.54, while the CBD average rental rate rose yet again from 1Q 2016, coming in at $47.98. Class A product in the CBD topped all, eclipsing the $50 mark for the first time, with an average rental rate of $50.21.
OutlookAustin is thriving as more and more businesses, tech companies in particular, flock to the capital city or expand their business footprints. Accolades from various publications continue to rank Austin as a place to be, including #1 City for Tech Start-ups, #2 City for Growing Companies, and #3 Best City to Start a Career. Austin’s growing reputation as a business friendly and hip city has continued to push office demand upward, and subsequently more office development into the pipeline, with more than 1.6 million SF currently under construction and several other large office projects slated to break ground in 2017.
5%
8%
10%
13%
15%
18%
20%
2011 2012 2013 2014 2015 2016
AUSTIN OFFICE
Historical Average = 13%
$10
$20
$30
$40
0
200
400
600
2011 2012 2013 2014 2015 Q2 16
Net Absorption, SF (thousands) Asking Rent, $ PSF

Office Snapshot Q2 2016Austin
MARKETBEAT
About Cushman & WakefieldCushman & Wakefield is a leading global real estate services firm that helps clients transform the way people work, shop, and live.The firm’s 43,000 employees in more than 60 countries provide deep local and global insights that create significant value foroccupiers and investors around the world. Cushman & Wakefield is among the largest commercial real estate services firms withrevenue of $5 billion across core services of agency leasing, asset services, capital markets, facility services (C&W Services), globaloccupier services, investment & asset management (DTZ Investors), project & development services, tenant representation, andvaluation & advisory. To learn more, visit www.cushmanwakefield.com or follow @CushWake on Twitter.
Copyright © 2016 Cushman & Wakefield. All rights reserved. The information contained within this report is gathered from multiplesources considered to be reliable. The information may contain errors or omissions and is presented without any warranty orrepresentations as to its accuracy.
Key Lease Transactions Q2 2016
PROPERTY SF TENANT TRANSACTION TYPE SUBMARKET
5900 E. Ben White 219,699 Superior Health Lease SE
Domain 4 104,448 Accruent Lease FNW
Domain 5 74,804 Trend Micro Lease FNW
500 W. 2nd 47,374 Deloitte Lease CBD
Key Sales Transactions Q2 2016
PROPERTY SF SELLER/BUYER PRICE / $PSF SUBMARKET
701 Brazos (Austin Centre) 326,300 Lincoln/Invesco $123,300,000 / $378 CBD
Plaza on the Lake I & II 236,561 Cornerstone/Plaza on the Lake LLC $37,600,000 / $159 CBD
Champion Office Park 221,136 Endeavor/Menlo Equities $92,900,000 / $420 NW
*Rental rates reflect gross asking $psf/year
Cushman & Wakefield200 W. Cesar Chavez StSuite 250cushmanwakefield.com
For more information, contact:Jeff Graves, Sr. GIS & Research AnalystTel: +1 512 474 [email protected]
SUBMARKET INVENTORY(SF)
SUBLET VACANT
(SF)
DIRECT VACANT(SF)
OVERALL VACANCY RATE
CURRENT NET ABSORPTION
(SF)
YTD OVERALL NET ABSORPTION
(SF)
UNDER CNSTR(SF)
OVERALL AVERAGE
ASKING RENT (ALL CLASSES)*
OVERALL AVERAGE
ASKING RENT (CLASS A)*
CBD 9,856,175 101,457 477,329 5.9% 73,593 206,817 707,584 $47.98 $50.21
Central 1,165,069 13,108 24,607 3.2% 18,647 63,991 46,000 $36.79 $46.69
Far Northwest 13,916,388 338,256 1,359,200 12.2% 155,947 295,518 291,000 $33.13 $33.71
North Central 4,785,938 36,379 180,055 4.5% (15,511) 8,279 0 $22.17 $26.34
Northeast 2,136,280 12,657 127,121 6.5% 46,543 98,291 229,290 $19.37 $40.00
Northwest 4,215,277 67,133 296,025 8.6% 36,393 98,140 0 $30.12 $31.73
South Central 2,215,425 0 79,260 3.6% (25,878) (21,369) 0 $26.79 N/A
Southeast 992,420 2,528 216,317 22.0% (1,180) (11,537) 0 $18.21 $28.43
Southwest 10,880,518 166,119 862,519 9.5% 274,314 376,244 322,928 $36.41 $36.28
Round Rock 1,142,576 0 50,760 4.4% 90,910 120,644 0 $23.94 $29.19
AUSTIN TOTALS 51,306,066 737,637 3,673,193 9.0% 653,778 1,235,018 1,596,802 $33.54 $36.36
SUBMARKET INVENTORY(SF)
SUBLET VACANT
(SF)
DIRECT VACANT(SF)
OVERALL VACANCY RATE
CURRENT NET ABSORPTION
(SF)
YTD OVERALL NET ABSORPTION
(SF)
UNDER CNSTR(SF)
AVERAGE ASKING RENT
Class A 34,882,764 671,446 2,493,915 9.6% 621,999 1,084,769 1,596,802 $36.36
Class B 13,230,512 42,307 1,033,978 8.2% 25,502 128,370 0 $26.87
Class C 3,192,790 23,884 145,300 5.6% 6,277 21,879 0 $23.08

Office Snapshot Q1 2016Austin
MARKETBEAT
Economic Indicators
Market Indicators (Overall, All Classes)
Overall Net Absorption/Asking Rent
4Q TRAILING AVERAGE
Overall Vacancy
www.oxfordcommercial.com
Q1 15 Q1 1612-Month
Forecast
Austin Employment 944k 985k
Austin Unemployment 3.5% 3.2%
U.S. Unemployment 5.6% 4.9%
Q1 15 Q1 1612-Month
Forecast
Vacancy 8.7% 8.5%
Net Absorption (sf) 822k 581k
Under Construction (sf) 3.5M 1.7M
Average Asking Rent* $32.78 $33.52
*Rental rates reflect gross asking $psf/year
EconomyThe first quarter of 2016 marked yet another quarter that the Austin
unemployment rate ranked as one of the lowest amongst the 50 largest
metropolitan areas, coming in at 3.2% (as of March 2016). The local
Austin unemployment rate also remains ahead of both the Texas rate of
4.5% and the national rate of 4.9%. Additionally, the rate of job growth in
the Austin MSA continues to impress. According to the U.S. Bureau of
Labor Statistics, Austin has added more than 39,800 new jobs in the
past 12 months, ranking it 3rd nationally. Many of these new jobs can be
attributed to more and more companies relocating or expanding to
Austin from other areas, including many Silicon Valley tech companies
that are finding the Austin market rich in talent. Austin’s unique vibes,
original cuisine, and spectacular music has only fueled this popularity
and the city’s continued economic growth is reflective of that.
Market OverviewThe Austin office market recorded 581,240 square feet (sf) of overall
absorption during Q1 2016. As was the case in the previous quarter, the
Far Northwest (FNW) submarket experienced the strongest amount of
absorption, recording 139,571 sf of overall absorption, while the Central
Business District (CBD) absorbed 133,224 sf overall. The overall
vacancy rate in Austin fell to 8.5%, down slightly from the 9.1% vacancy
posted the previous quarter. Strong absorption rates coupled with low
vacancy continue to raise full service asking average rental rates to all
time highs. The overall rental rate for the entire Austin market was
recorded at $33.52 per square foot (psf) for Q1 2016, a year-over-year
increase of 6.2%. The Central Business District (CBD) average rental
rate of $46.83 psf, maintained its position as the highest across all
submarkets. Additionally, the average “Class A” rate in the CBD climbed
to $49.07 psf, an increase of $0.64 psf from Q4 2015.
OutlookAustin continues to be an attractive destination for growing businesses.
Large, established companies such as Oracle, Apple, Google, Indeed
and others have shown their commitment to Austin and continue to
expand their presence in the capital city. Additionally, existing local
companies are continuing to add to their current office footprints as their
businesses reap the benefits of a strengthening economy. Nationally,
the spotlight continues to shine on Austin. In January, Forbes named
Austin No.1 for “America’s Next Boom Towns”, while CNN ranked Austin
No. 1 place for millennials to live. This is evident as Austin’s population
growth continues to climb at a record pace. With this increased
population, demand for quality commercial real estate will most certainly
increase while developers look to add more supply through new
construction. Until this supply catches up with the demand, we can
expect to see lower vacancy rates and higher rental rates.
5%
8%
10%
13%
15%
18%
20%
2011 2012 2013 2014 2015 Q1 16
AUSTIN OFFICE
Historical Average = 13%
$10
$20
$30
$40
0
175
350
525
700
2011 2012 2013 2014 2015 Q1 16
Net Absorption, SF (thousands) Asking Rent, $ PSF

Office Snapshot Q1 2016Austin
MARKETBEAT
Cushman & Wakefield is a global leader in commercial real estate services, helping clients transform the way people work, shop, and live. The
firm’s 43,000 employees in more than 60 countries provide deep local and global insights that create significant value for occupiers and
investors around the world. Cushman & Wakefield is among the largest commercial real estate services firms in the world with revenues of $5
billion across core services of agency leasing, asset services, capital markets, facilities services (branded C&W Services), global occupier
services, investment management (branded DTZ Investors), tenant representation and valuations & advisory. To learn more, visit
www.cushmanwakefield.com or follow @Cushwake on Twitter.
Copyright © 2016 Cushman & Wakefield. All rights reserved. The information contained within this report is gathered from multiple sources
considered to be reliable. The information may contain errors or omissions and is presented without any warranty or representations as to its
accuracy. Alliance firms are independently owned and operated.
SUBMARKETINVENTORY
(SF)
SUBLET
VACANT
(SF)
DIRECT VACANT
(SF)
OVERALL
VACANCY RATE
CURRENT NET
ABSORPTION
(SF)
YTD
OVERALL NET
ABSORPTION
(SF)
UNDER CNSTR
(SF)
AVERAGE
ASKING RENT
Class A 33,742,251 539,934 2,509,765 8.71% 462,770 462,770 1,694,831 $36.63
Class B 12,852,869 31,986 949,359 11.91% 102,868 102,868 0 $25.99
Class C 3,266,608 11,084 176,826 4.62% 15,602 15,602 0 $24.11
Key Lease Transactions Q1 2016
PROPERTY SF TENANT TRANSACTION TYPE SUBMARKET
7700 Parmer B 63,598 Google Lease FNW
1645 East 6th Street 49,214 C3 Presents Lease NE
501 Congress 20,397 Spanning Cloud Apps Lease CBD
Two Barton Skyway 15,796 US Telepacific Lease SW
Key Sales Transactions Q1 2016
PROPERTY SF SELLER/BUYER PRICE / $PSF SUBMARKET
University Park 203,893 Spear Street/Lionstone Hermes $59,900,000 / $294 NC
Donley Plaza 69,547 Libitzky Holdings/Oak Point $8,700,000 / $125 NC
Briarcroft Building 63,825 Oak Point/Valor Capital $10,200,000 / $160 NW
The Continental Building 60,485 Oak Point/Valor Capital $9,700,000 / $160 NW
*Rental rates reflect gross asking $psf/year
Cushman & Wakefield / Oxford
Commercial
200 W. Cesar Chavez Street
Suite 250
www.oxfordcommercial.com
For more information, contact:
Jeff Graves, Director of GIS and
Research
Tel: +1 512 474 2400
SUBMARKETINVENTORY
(SF)
SUBLET
VACANT
(SF)
DIRECT VACANT
(SF)
OVERALL
VACANCY RATE
CURRENT NET
ABSORPTION
(SF)
YTD
OVERALL NET
ABSORPTION
(SF)
UNDER CNSTR
(SF)
OVERALL
AVERAGE
ASKING RENT
(ALL CLASSES)*
OVERALL
AVERAGE
ASKING RENT
(CLASS A)*
CBD 9,472,029 78,336 430,074 5.2% 133,224 133,224 910,584 $46.83 $49.07
Central 1,165,069 0 96,511 8.3% 45,334 45,334 46,000 $40.27 $43.64
Far Northwest 13,277,190 256,382 1,049,598 9.2% 139,571 139,571 291,000 $32.90 $33.57
North Central 4,829,234 17,782 183,794 3.8% 23,790 23,790 0 $21.35 $25.27
Northeast 2,136,280 12,657 162,401 7.3% 51,748 51,748 174,306 $20.54 $40.00
Northwest 4,215,277 54,468 362,273 9.9% 39,237 39,237 0 $30.37 $32.41
South Central 2,258,720 0 53,382 2.4% 4,509 4,509 0 $25.34 -
Southeast 992,420 0 221,633 22.3% -10,357 -10,357 0 $17.67 $27.59
Southwest 10,470,874 163,379 1,022,089 11.3% 101,930 124,450 175,000 $36.41 $36.82
Round Rock 1,044,635 0 54,195 5.2% 29,734 29,734 97,941 $26.11 $28.81
AUSTIN TOTALS 49,861,728 583,004 3,635,950 8.5% 581,240 581,240 1,694,831 $33.52 $36.73

Office Snapshot Q4 2015Austin
MARKETBEAT
Economic Indicators
Market Indicators (Overall, All Classes)
Overall Net Absorption/Asking Rent
4Q TRAILING AVERAGE
Overall Vacancy
www.oxfordcommercial.com
Q4 14 Q4 1512-Month
Forecast
Austin Employment 927k 955k
Austin Unemployment 3.7% 3.1%
U.S. Unemployment 5.7% 5.0%
2014 201512-Month
Forecast
Vacancy 9.1% 9.1%
Net Absorption (sf) 1.4M 2.5M
Under Construction (sf) 3.7M 2.3M
Average Asking Rent* $29.31 $33.37
*Rental rates reflect gross asking $psf/year
EconomyThe fourth quarter of 2015 marked another consecutive quarter
that the Austin unemployment rate ranked as one of the lowest
amongst the 50 largest metropolitan areas, coming in at 3.1%
(as of December 2015). The local Austin unemployment rate also
remains ahead of both the Texas rate of 4.6% and the national
rate of 5.0%. Additionally, the Austin MSA continues to be a
major job producer, adding more than 32,000 jobs to the area
between October 2014 to October 2015 (U.S. Bureau of Labor
Statistics). Austin continues to be a major destination for not only
tourists, but businesses alike, specifically within the tech
industry. According to TheStreet.com, Austin ranks number one
on the list of Best Growth Cities for Tech Jobs.
Market OverviewThe Austin office market recorded 712,782 square feet (sf) of
overall absorption during Q4 2015. This number brought the
2015 year-to-date total of overall absorption to more than 2.5
million sf. The Far Northwest (FNW) submarket experienced the
strongest amount of absorption, recording 300,240 sf of overall
absorption. Vacancy rates in the Austin market remained steady
with the previous quarter at 9.1%. Strong absorption rates
coupled with low vacancy rates continue to raise full service (FS)
asking average rental rates to historic highs. The overall FS
rental rate for the entire Austin market was recorded at $33.37
per square foot (psf) for Q4 2015, an increase of 13.9% from the
rate recorded during Q4 2014. The Central Business District
(CBD) FS average rental rate of $46.34 psf, maintained its
position as the highest across all submarkets. Additionally, the
average FS rate for the CBD is $6.19 psf higher than the
average FS rate at the end of Q4 2014.
OutlookThe Austin market continues to be a go-to city for both large
corporations and start-up companies alike. Demand for qualified
employees has led to a surge in population, record low
unemployment rates and increased job growth across the greater
Austin area. Recent large real estate transactions, including the
recent announcement that Oracle will construct a 560,000-sf
campus along Lady Bird Lake and expand its Austin workforce
by more than 50% highlights the commitment that businesses
have in the future of Austin. Such demand will only increase the
need for new office product moving forward, resulting in higher
rental rates, lower vacancy and the need for new office product
construction. 5%
8%
10%
13%
15%
18%
20%
2011 2012 2013 2014 2015
AUSTIN OFFICE
Historical Average = 13%
$10
$20
$30
$40
0
200
400
600
2011 2012 2013 2014 2015
Net Absorption, SF (thousands) Asking Rent, $ PSF

Office Snapshot Q4 2015Austin
MARKETBEAT
Cushman & Wakefield is a global leader in commercial real estate services, helping clients transform the way people work, shop, and live. The
firm’s 43,000 employees in more than 60 countries provide deep local and global insights that create significant value for occupiers and
investors around the world. Cushman & Wakefield is among the largest commercial real estate services firms in the world with revenues of $5
billion across core services of agency leasing, asset services, capital markets, facilities services (branded C&W Services), global occupier
services, investment management (branded DTZ Investors), tenant representation and valuations & advisory. To learn more, visit
www.cushmanwakefield.com or follow @Cushwake on Twitter.
Copyright © 2015 Cushman & Wakefield. All rights reserved. The information contained within this report is gathered from multiple sources
considered to be reliable. The information may contain errors or omissions and is presented without any warranty or representations as to its
accuracy. Alliance firms are independently owned and operated.
SUBMARKETINVENTORY
(SF)
SUBLET
VACANT
(SF)
DIRECT VACANT
(SF)
OVERALL
VACANCY RATE
CURRENT NET
ABSORPTION
(SF)
YTD
OVERALL NET
ABSORPTION
(SF)
UNDER CNSTR
(SF)
AVERAGE
ASKING RENT
(ALL CLASSES)*
UNDER CNSTR
Class A 33,176,454 388,101 2,723,068 9.4% 626,164 2,165,671 2,168,378 $36.70 2,064,378
Class B 12,820,960 52,317 978,241 8.1% 91,317 328,496 97,941 $24.72 201,941
Class C 3,261,133 26,093 184,005 6.4% (4,699) 33,381 0 $25.67
Key Lease Transactions 2015
PROPERTY SF TENANT TRANSACTION TYPE SUBMARKET
Champion Office Park 220,600 Indeed.com Lease SW
Capital Ridge 217,490 Apple Lease SW
500 West 2nd Street 207,939 Google Lease CBD
Summit at Lantana 117,886 Solarwinds Lease SW
Key Sales Transactions 2015
PROPERTY SF SELLER/BUYER PRICE / $PSF SUBMARKET
IBM Campus 1,112,236 IBM / Brandywine Realty Trust $205,300,000 / $185 FNW
7700 Parmer 913,000 Spear Street / Accesso Partners $273,900,000 / $300 FNW
Riata Corporate Park 688,432 Spear Street / Accesso Partners $171,250,000/ $249 FNW
Domain Portfolio 668,636 RREEF / TIER REIT $200,000,000 / $299 FNW
*Rental rates reflect gross asking $psf/year
Cushman & Wakefield / Oxford
Commercial
200 W. Cesar Chavez Street
Suite 250
www.oxfordcommercial.com
For more information, contact:
Jeff Graves, Director of GIS and
Research
Tel: +1 512 474 2400
SUBMARKETINVENTORY
(SF)
SUBLET
VACANT
(SF)
DIRECT VACANT
(SF)
OVERALL
VACANCY RATE
CURRENT NET
ABSORPTION
(SF)
YTD
OVERALL NET
ABSORPTION
(SF)
UNDER CNSTR
(SF)
OVERALL
AVERAGE
ASKING RENT
(ALL CLASSES)*
OVERALL
AVERAGE
ASKING RENT
(CLASS A)*
CBD 9,472,029 47,103 564,204 6.5% 119,833 679,273 910,584 $46.34 $48.43
Central 1,165,069 0 206,994 27.14% 39,140 34,013 46,000 $39.91 $41.85
Far Northwest 13,103,660 123,528 1,014,432 8.7% 300,240 982,020 876,294 32.25 $33.09
North Central 4,785,938 13,053 189,414 4.2% 14,977 68,425 0 $21.19 $25.49
Northeast 1,994,796 1,470 139,794 7.1% 3,004 (7,258) 231,500 $19.38 -
Northwest 4,170,937 76,978 535,727 14.7% 12,957 99,802 0 31.85 $33.83
South Central 2,215,425 0 60,324 2.7% 2,947 15,980 104,000 $25.19 -
Southeast 992,420 0 211,279 21.3% 10,018 13,280 0 $14.24 $28.38
Southwest 10,471,775 190,778 1,040,211 11.7% 202,300 603,087 0 $35.23 $35.89
Round Rock 1,044,635 13,601 57,971 6.9% 7,366 38,926 97,941 $24.15 21.39
AUSTIN TOTALS 49,416,684 466,511 3,885,314 9.1% 712,782 2,527,548 2,266,319 $33.37 $36.70

Office Snapshot Q3 2015Austin
MARKETBEAT
Economic Indicators
Market Indicators
Net Absorption/Asking Rent
4Q TRAILING AVERAGE
Overall Vacancy
www.cushmanwakefield.com
EconomyThird quarter 2015 marked an additional consecutive quarter that
the Austin unemployment rate of 3.2% (as of August 2015) was
the lowest amongst the 50 largest metropolitan areas in the
entire United States. The local Austin unemployment rate also
remains ahead of both the Texas unemployment rate of 4.6%
and the national rate of 5.1%. In addition to the low levels of
unemployment, there have been 32,500 jobs created from July
2014 to July 2015 (U.S. Bureau of Labor Statistics) .
Furthermore, the Austin area remains a popular travel and
relocation destination. The Austin Bergstrom International Airport
set yet another passenger milestone, recording 1.65 million
passengers in July 2015 (the highest ever) and WalletHub
recently named Austin the Best Large City Live in for 2015.
Market OverviewThe Austin office market recorded 552,063 square feet (sf) of
overall absorption during Q3 2015. This number brought the
2015 year-to-date total of overall absorption to over 1.8 million sf.
The Far Northwest (FNW) submarket experienced the strongest
amount of absorption, recording 166,414 sf of overall absorption.
These strong absorption figures contributed to a decrease in the
overall vacancy rate. The Austin market posted a vacancy rate of
9.0%, 0.7 percentage point lower than the Q2 2015 rate of 9.7%.
Strong absorption rates coupled with low vacancy rates continue
to raise full service (FS) average rental rates to historic highs.
The overall FS rental rate for the entire Austin market was
recorded at $33.02 per square foot (psf) for Q3 2015, $3.85 psf
higher than the rate recorded during Q3 2014. The Central
Business District (CBD) FS average rental rate of $45.91 psf,
maintained its position as the highest across all submarkets.
OutlookLow unemployment rates and increased job growth, coupled with
a highly active office market have contributed to an extremely
healthy business climate across the greater Austin area. Recent
large lease transactions, particularly renewals and expansions,
indicate existing Austin companies such as Logitech, EA,
RetailMeNot and Cirrus Logic, intend to maintain and grow their
Austin presence. Notably all these companies exist in the ever-
expanding Austin technology sector. Both existing and incoming
tenants will likely drive the high demand for Austin office product.
Such demand will fuel the need for new construction projects,
create a competitive environment for space and push lease rates
to new historic highs throughout the end of 2015.
Q3 14 Q3 1512-Month
Forecast
Austin Employment 919k 946k
Austin Unemployment 4.0% 3.2%
U.S. Unemployment 6.1% 5.1%
Q3 14 Q3 1512-Month
Forecast
Overall Vacancy 8.6% 9.0%
Net Absorption 754k 552k
Under Construction 4,050k 2,781k
Overall Average Asking
Rent$29.17 $33.02
5%
8%
10%
13%
15%
18%
20%
23%
25%
2010 2011 2012 2013 2014 2015 Q32015
AUSTIN OFFICE
Historical Average = 14%
$20
$25
$30
$35
-25,000
275,000
575,000
875,000
2010 2011 2012 2013 2014 Q3 2015
Net Absorption, SF Asking Rent, $ PSF

Office Snapshot Q3 2015Austin
MARKETBEAT
www.cushmanwakefield.com
About Cushman & WakefieldCushman & Wakefield is a global leader in commercial real estate services, helping clients transform the way
people work, shop, and live. The firm’s 43,000 employees in more than 60 countries provide deep local and
global insights that create significant value for occupiers and investors around the world. Cushman & Wakefield
is among the largest commercial real estate services firms in the world with revenues of $5 billion across core
services of agency leasing, asset services, capital markets, facilities services (branded C&W Services), global
occupier services, investment management (branded DTZ Investors), tenant representation and valuations &
advisory. To learn more, visit www.cushmanwakefield.com or follow @Cushwake on Twitter.
Copyright © 2015 Cushman & Wakefield. All rights reserved. The information contained within this report is gathered from mult iple sources considered
to be reliable. The information may contain errors or omissions and is presented without any warranty or representations as to its accuracy. Alliance
firms are independently owned and operated.
SUBMARKETTOTAL
BLDGSINVENTORY
SUBLET
VACANT
DIRECT
VACANT
OVERALL
VACANCY
RATE
CURRENT NET
ABSORPTION
YTD NET
ABSORPTION
UNDER
CNSTR
AVERAGE
ASKING RENT
(ALL CLASSES)*
AVERAGE
ASKING RENT
(CLASS A)*
CBD 71 9,447,579 31,069 626,708 7.1% 142,226 559,440 910,584 $45.91 $48.07
Central 21 998,679 0 160,040 16.0% 712 (5,127) 131,722 $39.91 $40.68
Far Northwest 156 12,939,930 124,397 1,115,740 9.5% 166,414 681,780 1,144,994 $32.40 $33.08
North Central 36 4,785,938 0 204,391 4.3% 18,357 53,448 0 $21.72 $26.08
Northeast 26 2,098,896 0 149,842 7.1% 7,830 (10,262) 231,500 $19.27 -
Northwest 78 4,170,937 49,996 545,520 14.2% 70,181 86,845 0 $31.13 $33.82
South Central 36 2,215,425 5,755 55,316 2.8% 8,252 13,033 104,000 $24.75 -
Southeast 11 992,420 0 221,216 22.3% 344 3,262 0 $14.08 $26.50
Southwest 138 10,147,720 206,450 820,936 10.1% 147,781 400,787 160,000 $34.77 $35.31
Round Rock 15 1,044,635 13,601 65,337 7.6% (10,034) 31,560 97,941 $25.33 $24.97
AUSTIN TOTALS 588 48,842,159 431,268 3,965,046 9.0% 552,063 1,814,766 2,780,741 $33.02 $36.53
Key Lease Transactions Q3 2015
PROPERTY SF TENANT TRANSACTION TYPE SUBMARKET
Two Barton Skyway 99,047 Logitech Renewal/Expansion SW
7700 Parmer- Building C 98,700 Entertainment Arts Renewal/Expansion FNW
301 Congress 95,537 RetailMeNot Renewal/Expansion CBD
Shoal Creek Walk 84,872 Cirrus Logic Lease CBD
Key Sales Transactions Q3 2015
PROPERTY SF SELLER/BUYER PRICE SUBMARKET
Amber Oaks Corporate Center 648,301 CBRE Global Investors / Menlo Equities $116,000,000/$179 FNW
515 Congress 258,176 Stream Realty / KBS Undisclosed CBD
Capital Ridge 215,734 Riverside Resources / Miller Global Undisclosed SW
501 Congress 122,710 Stream Realty / AFIAA $41,213,093/$336 CBD
Richard WhiteleyResearch Analyst
200 W. Cesar Chavez Street
Suite 250
Tel: +1 512 474 2400
Fax: +1 512 477 3037
SUMMARY BY CLASS TOTAL BLDGS INVENTORYSUBLET
VACANT
DIRECT
VACANT
OVERALL
VACANCY
RATE
CURRENT NET
ABSORPTION
YTD NET
ABSORPTIONUNDER CNSTR
AVERAGE ASKING
RENT*
Class A 261 32,356,451 341,364 2,756,527 9.6% 500,892 1,539,507 2,578,800 $36.53
Class B 249 12,994,575 63,811 1,029,294 8.5% 52,389 237,179 201,941 $24.58
Class C 78 3,491,133 26,093 179,225 6.3% (1,218) 38,080 0 $24.97
*Rental rates reflect gross asking $psf/year

Cushman & Wakefield | Oxford Commercial
200 W. Cesar Chavez St. Suite 250
Austin, TX 78701
www.cushmanwakefield.com/knowledge
For more information, contact:
Richard Whiteley, Research Analyst
+1 (512) 474 2400
The market terms and definitions in this report are based on NAIOP standards. No
warranty or representation, express or implied, is made to the accuracy or completeness
of the information contained herein, and same is submitted subject to errors, omissions,
change of price, rental or other conditions, withdrawal without notice, and to any special
listing conditions imposed by our principals.
© 2015 Cushman & Wakefield, Inc. All rights reserved.
1
ECONOMIC OVERVIEW
An article recently published by Forbes states
the Austin area’s technology employment sector
has grown an impressive 17.8% since 2011.
Additionally, the latest Kaufman Index Report
places Austin as the new No. 1 U.S. city for
startups. These factors coupled with 32,000 jobs created from May
2014 to May 2015 continue to drive the unemployment rate to
historic lows. For May 2015, the Austin MSA posted a 3.1%
unemployment rate, the lowest of the largest 50 metros in the U.S. for
another consecutive quarter. Job growth combined with consistently
low unemployment rates will continue to contribute to a robust and
healthy Austin economy.
VACANY RATES EXPERIENCE SLIGHT INCREASE
A total of 327,660 square feet (sf) of direct absorption was recorded
for Q2 2015. This brought the year-to-date (YTD) total for 2015 to an
impressive 1,081,174 sf of direct absorption. This YTD total for 2015
is 61.9% higher than the YTD direct absorption recorded at the end of
Q2 2014. The Southwest (SW) submarket posted the highest direct
absorption total of 164, 547 sf, a large portion of which can be
attributed to Spiceworks occupying 95,898 sf at the recently delivered
3700 San Clemente. Despite the large amounts of absorption
recorded, a slight rise in vacancy was experienced across the market.
The total market posted an overall vacancy rate of 9.7% for Q2 2015,
marginally higher than the overall vacancy rate of 8.7% observed in Q1
2015. Similarly, the CBD experienced a slight rise in overall vacancy,
increasing from 6.0% in Q1 2015 to 7.3%. However, it is important to
note that on a year-over-year (Y-O-Y) basis the overall vacancy rates
continue to drop significantly, from the Q2 2014 posted rate of 10.2%
for the total market and the 9.9% overall vacancy rate for the CBD.
RENTAL RATES CONTINUE TO CLIMB
High demand, competition for vacant space (both large and small), and
low vacancy rates continue to push full service (FS) market asking rates
to historic highs. For Q2 2015 the average FS rate for all building
classes was $32.83 per square foot (psf), $3.62 psf higher than the
average FS rate in Q2 2014. Similarly the CBD class A average FS rate
for Q2 2015 reached an average of $47.80 psf, 10.6% higher than the
Q2 2014 rate of $43.21 psf. As leasing and absorption activity remains
highly active, it is likely rates will only continue to grow.
OUTLOOK
The Austin office market continues to operate in peak conditions.
Office buildings are selling at historic prices, available spaces are
quoting historic lease rates and occupancy rates remains higher than
ever before. New construction continues to dominate the skyline, as
many buildings are spoken for, prior to their respective completions.
Such pre-leasing activity leads to new developments doing little to
alleviate the declining vacancy rates currently being experienced.
Consequently, large blocks of contiguous space (50,000 sf and above)
are few and far between throughout the office marketplace. However,
the heavy amount of interest from out of town businesses such as
Apple, who signed the largest lease of the quarter at 217,000 sf at
Capital Ridge, and users such as Oracle expanding their existing
presence will contribute to heavier demands for additional space. This
heavy demand for space, existing or not, will likely lead to additional
buildings joining the Austin skyline.
STATS ON THE GO
Q2 2014 Q2 2015
Y-O-Y CHANGE
12 MONTH FORECAST
Overall Vacancy 10.2% 9.7% 0.5 pp
Direct Asking Rents (psf/yr) $29.21 $32.83 12.4%
YTD Direct Absorption (sf) 667,901 1,081,174 61.9%
DIRECT RENTAL VS. VACANCY RATES
NEW SUPPLY
0.0%
5.0%
10.0%
15.0%
20.0%
$0.00
$10.00
$20.00
$30.00
$40.00
2011 2012 2013 2014 Q2 2015
psf
/yr
DIRECT GROSS RENTAL RATE DIRECT VACANCY RATE
0.1
0.2
0.1
1.0
1.7
0.0
1.0
2.0
2011 2012 2013 2014 YTD 2015
msf
NEW SUPPLY
Q2 2015 AUSTIN, TX
OFFICE SNAPSHOT MARKETBEAT
A Cushman & Wakefield Research Publication

Cushman & Wakefield | Oxford Commercial
200 W. Cesar Chavez St. Suite 250
Austin, TX 78701
www.cushmanwakefield.com/knowledge
For more information, contact:
Richard Whiteley, Research Analyst
+1 (512) 474 2400
The market terms and definitions in this report are based on NAIOP standards. No
warranty or representation, express or implied, is made to the accuracy or completeness
of the information contained herein, and same is submitted subject to errors, omissions,
change of price, rental or other conditions, withdrawal without notice, and to any special
listing conditions imposed by our principals.
© 2015 Cushman & Wakefield, Inc. All rights reserved.
2
AUSTIN, TEXAS
SUBMARKET INVENTORY OVERALL VACANCY
RATE
DIRECT
VACANCY
RATE
UNDER CONSTRUCTION
YTD CONSTRUCTION COMPLETIONS
YTD DIRECT NET ABSORPTION
YTD OVERALL NET ABSORPTION
OVERALL WTD. AVG
ALL CLASSES GROSS
RENTAL RATE*
DIRECT WTD. AVG.
CLASS A GROSS RENTAL RATE*
CBD 9,256,594 7.3% 6.8% 692,404 738,799 411,162 417,214 $44.74 $47.80
Central 998,679 15.5% 15.5% 131,722 0 (9,314) (5,839) $41.69 $42.79
Far Northwest 12,912,103 10.8% 9.6% 966,094 221,973 378,674 515,366 $32.82 $33.45
North Central 2,212,938 9.6% 9.6% 0 0 29,214 35,091 $21.36 $26.26
Northeast 2,098,896 7.4% 7.4% 718,604 0 (18,092) (18,092) $19.31 N/A
Northwest 4,170,937 12.6% 11.0% 0 0 6,978 16,664 $29.11 $31.54
South Central 2,103,594 1.8% 1.5% 104,000 0 4,781 4,781 $25.47 N/A
Southeast 992,420 22.5% 22.5% 0 0 2,918 2,918 $14.18 $26.24
Southwest 9,563,048 10.2% 7.8% 375,000 731,500 235,164 253,006 $34.62 $35.16
Round Rock 1,044,635 6.6% 5.3% 0 0 39,689 41,594 $25.84 $25.92
SUBURBS 36,097,250 10.4% 9.1% 2,295,420 953,473 670,012 845,489 $30.61 $34.20
TOTALS 45,623,844 9.7% 8.6% 2,987,824 1,692,272 1,081,174 1,262,703 $32.83 $36.41
* RENTAL RATES REFLECT ASKING $PSF/YEAR
MARKET HIGHLIGHTS
SIGNIFICANT Q2 2015 LEASE TRANSACTIONS SUBMARKET TENANT BUILDING CLASS SQUARE FEET
Capital Ridge SW Apple A 217,490
Summit at Lantana SW SolarWinds A 117,886
7700 Parmer FNW Oracle A 64,227
SIGNIFICANT Q2 2015 SALE TRANSACTIONS SUBMARKET BUYER PURCHASE PRICE / $PSF SQUARE FEET
Riata Corporate Park FNW Accesso Partners $175,600,000 / $255 688,432
Domain Portfolio FNW TIER REIT $200,000,000 / $299 668,636
CityView Portfolio SW Dividend Capital $68,750,000 / $251 274,182
SIGNIFICANT Q2 2015 CONSTRUCTION
COMPLETIONS
SUBMARKET MAJOR TENANT COMPLETION DATE BUILDING SQUARE FEET (% LEASED)
3700 San Clemente SW Spiceworks Q2 2015 250,000 (38%)
Capital Ridge SW Apple Q2 2015 217,000 (100%)
Encino Trace- Building I SW ARM Q2 2015 160,000 (75%)
SIGNIFICANT PROJECTS UNDER
CONSTRUCTION
SUBMARKET MAJOR TENANT COMPLETION DATE BUILDING SQUARE FEET (% LEASED)
500 West 2nd Street CBD Google Q1 2017 489,404 (43%)
Rollingwood Center SW EZCorp Q3 2015 215,000 (100%)
Parmer 3.2 NE Speculative Q3 2015 184,500 (0%)
5th + Colorado CBD Plains Capital Bank Q1 2016 179,000 (9%)
Research Park Plaza V FNW Speculative Q4 2015 173,530 (0%)
Encino Trace Building II SW INC Research Q3 2015 160,000 (15%)
Quarry Oaks III FNW Bazaarvoice Q4 2015 140,000 (100%)
Lakes at Techridge- Phase I NE Speculative Q4 2015 137,000 (0%)
Lamar Central CEN Kendra Scott Design Q3 2015 131,722 (33%)
Aspen Lake 2 FNW Q2ebanking Q3 2015 128,700 (100%)
Domain I FNW Speculative Q4 2015 124,577 (0%)

Cushman & Wakefield | Oxford Commercial
200 W. Cesar Chavez St. Suite 250
Austin, TX 78701
www.cushmanwakefield.com/knowledge
For more information, contact:
Richard Whiteley, Research Analyst
+1 (512) 474 2400
The market terms and definitions in this report are based on NAIOP standards. No
warranty or representation, express or implied, is made to the accuracy or completeness
of the information contained herein, and same is submitted subject to errors, omissions,
change of price, rental or other conditions, withdrawal without notice, and to any special
listing conditions imposed by our principals.
© 2015 Cushman & Wakefield, Inc. All rights reserved.
1
ECONOMIC OVERVIEW
As of February 2015 the Austin MSA’s
unemployment rate of 3.4% is amongst the
lowest in the top 50 largest metropolitan areas
in the United States (U.S Bureau of Labor
Statistics, Local Area Unemployment Statistics).
In addition the Austin MSA job market generated 26,900 jobs from
February 2014 through February 2015 and 8,600 jobs In January and
February of this year. These strong economic indicators in addition to
a strong cultural identity and high quality of living continue to make
Austin a popular destination for both corporate relocations
(athenahealth), the opening of large regional offices (Apple and
Google) and for individuals looking to find a new place to call home.
CBD VACANCY RATE CONTINUES TO DECLINE
A total of 753,514 square feet (sf) of direct absorption was reported
for the entire Austin market during Q1 2015. On its own, the Central
Business District (CBD) posted 364,441 sf of absorption. Such strong
absorption can be attributed to the large amount of pre-leasing activity
and subsequent deliveries of both the Seaholm Power Plant
redevelopment and Colorado Tower. The overall vacancy rate for the
CBD dropped to 6.0% for Q1 2015, from 6.9% observed in Q4 2014.
Even amongst all the new construction deliveries, such as Seaholm and
Colorado Tower, these buildings are both over 90% pre-leased and do
little to alleviate the declining vacancy rate. Large tenants occupying
these projects include: Parsley Energy (135,700 sf), Atlassian (48,303
sf) and Scott Douglas & McConnico (40,011 sf) in Colorado Tower
and athenahealth (103,000 sf) and UnderArmour (35,300 sf) at the
Seaholm Power Redevelopment. The Far North West (FNW)
submarket also posted a strong quarter of absorption, recording
270,815 sf of direct absorption.
RENTAL RATES ON THE RISE
Low vacancy rates, high absorption figures and an extremely active
office market continue to push asking rates in the upward direction.
The average full service (FS) overall rental rate for the total market
was recorded at $32.78 per square foot (psf) for Q1 2015, 11.8%
higher than that of the Q4 2014 rate of $29.31 psf. The CBD
continues to experience the highest rate escalations, as the FS rate
increased to $43.84 psf across all building classes, a $0.51 psf increase
from the $43.32 psf rate observed in Q4 2014.
OUTLOOK
New construction activity still continues to be a dominant force in the
Austin office market. The CBD alone had almost a million square feet
completed during Q1 2015. However amongst the recent and
upcoming completions, the large amounts of pre-leasing activities have
held vacancy rates at historically low records. With large corporate
entities such as Google and Indeed.com pre-leasing upwards of
400,000 sf combined space in projects under construction, it is likely
that this trend could continue in the Austin market. If the considerable
amount of pre-leasing activity does not end, the 3.5 million sf of space
currently under construction will do little to bolster the low vacancy
rates. With no surge in vacancy rate on the immediate horizon
(particularly in that of the CBD), coupled with an active office market,
it is expected that record low vacancy rates will be observed and that
new historically high rental rates will be posted throughout the Austin
market in the remainder of 2015.
STATS ON THE GO
Q1 2014 Q1 2015
Y-O-Y CHANGE
12 MONTH FORECAST
Overall Vacancy 9.9% 8.7% 1.2 pp
Direct Asking Rents (psf/yr) $28.83 $31.55 9.4%
YTD Direct Absorption (sf) 456,340 753,514 65.1%
DIRECT RENTAL VS. VACANCY RATES
NEW SUPPLY
0.0%
5.0%
10.0%
15.0%
20.0%
$0.00
$10.00
$20.00
$30.00
$40.00
2011 2012 2013 2014 Q1 2015
psf
/yr
DIRECT GROSS RENTAL RATE DIRECT VACANCY RATE
0.1 0.2
0.1
0.9
3.8
0.0
2.0
4.0
2011 2012 2013 2014 YTD 2015
msf
Q1 2015 AUSTIN, TX
OFFICE SNAPSHOT MARKETBEAT
A Cushman & Wakefield Research Publication

Cushman & Wakefield | Oxford Commercial
200 W. Cesar Chavez St. Suite 250
Austin, TX 78701
www.cushmanwakefield.com/knowledge
For more information, contact:
Richard Whiteley, Research Analyst
+1 (512) 474 2400
The market terms and definitions in this report are based on NAIOP standards. No
warranty or representation, express or implied, is made to the accuracy or completeness
of the information contained herein, and same is submitted subject to errors, omissions,
change of price, rental or other conditions, withdrawal without notice, and to any special
listing conditions imposed by our principals.
© 2015 Cushman & Wakefield, Inc. All rights reserved.
2
AUSTIN, TEXAS
SUBMARKET INVENTORY OVERALL VACANCY
RATE
DIRECT
VACANCY
RATE
UNDER CONSTRUCTION
YTD CONSTRUCTION COMPLETIONS
YTD DIRECT NET ABSORPTION
YTD OVERALL NET ABSORPTION
OVERALL WTD. AVG
ALL CLASSES GROSS
RENTAL RATE*
DIRECT WTD. AVG.
CLASS A GROSS RENTAL RATE*
CBD 9,339,913 6.0% 6.0% 739,404 691,799 364,441 347,593 $43.84 $47.47
Central 998,679 16.0% 16.0% 131,721 0 (14,212) (14,212) $41.03 $42.09
Far Northwest 12,837,299 10.1% 9.4% 966,094 221,973 270,815 341,649 $31.66 $32.48
North Central 2,212,938 10.6% 10.4% 0 0 12,811 12,811 $21.24 $25.62
Northeast 2,098,896 6.7% 6.7% 624,104 30,248 (3,683) (3,683) $18.98 N/A
Northwest 4,170,937 12.2% 10.7% 0 0 18,100 23,786 $28.61 $31.46
South Central 2,103,594 1.5% 1.5% 0 0 3,403 3,403 $27.71 N/A
Southeast 992,420 22.0% 22.0% 0 0 7,710 7,710 $14.06 $25.76
Southwest 9,161,243 7.3% 6.5% 1,074,137 35,000 70,617 70,617 $33.81 $34.67
Round Rock 1,044,635 8.7% 8.1% 0 0 13,671 13,671 $35.01 $24.91
SUBURBS 35,620,641 9.4% 8.7% 2,796,056 256,973 389,703 465,593 $30.92 $33.35
TOTALS 44,960,554 8.7% 8.1% 3,535,460 948,772 753,514 822,336 $32.78 $35.60
* RENTAL RATES REFLECT ASKING $PSF/YEAR
MARKET HIGHLIGHTS
SIGNIFICANT Q1 2015 LEASE TRANSACTIONS SUBMARKET TENANT BUILDING CLASS SQUARE FEET
Champion Office Park FNW Indeed A 213,196
500 West 2nd Street CBD Google A 207,939
Lamar Central CEN Kendra Scott Design A 43,527
SIGNIFICANT Q1 2015 SALE TRANSACTIONS SUBMARKET BUYER PURCHASE PRICE / $PSF SQUARE FEET
The Summit at Lantana SW LaSalle Investment $260,000,000 / $320 812,350
Riata Crossing* FNW DivcoWest Undisclosed 350,000
Prominent Pointe I & II FNW GLL Real Estate Partners $76,000,000 / $303 250,565
SIGNIFICANT Q1 2015 CONSTRUCTION
COMPLETIONS
SUBMARKET MAJOR TENANT COMPLETION DATE BUILDING SQUARE FEET (% LEASED)
Colorado Tower CBD Parsley Energy Q1 2015 373,334 (95%)
Domain 7 FNW Amazon Q1 2015 221,973 (70%)
Seaholm Power Plant CBD athenahealth Q1 2015 145,138 (100%)
SIGNIFICANT PROJECTS UNDER
CONSTRUCTION
SUBMARKET MAJOR TENANT COMPLETION DATE BUILDING SQUARE FEET (% LEASED)
500 West 2nd Street CBD Google Q1 2017 489,404 (43%)
Encino Trace Building I & II SW ARM Q3 2015 320,000 (38%)
3700 San Clemente SW Spiceworks Q2 2015 250,000 (38%)
Rollingwood Center SW EZCorp Q3 2015 215,000 (100%)
Capital Ridge SW Speculative Q2 2015 207,000 (0%)
Research Park Plaza V FNW Speculative Q4 2015 173,530 (0%)
5th + Colorado CBD Speculative Q1 2016 171,000 (0%)
Lakes at Techridge- Phase I NE Speculative Q4 2015 137,000 (0%)
Quarry Oaks III FNW Bazaarvoice Q4 2015 140,000 (100%)
Lamar Central CEN Kendra Scott Design Q3 2015 131,722 (33%)
Aspen Lake 2 FNW Q2ebanking Q3 2015 128,700 (47%)
* Riata Crossing Office Park originally purchased by Apple, then immediately sold to DivcoWest.

Cushman & Wakefield | Oxford Commercial
200 W. Cesar Chavez St. Suite 250
Austin, TX 78701
www.cushmanwakefield.com/knowledge
For more information, contact:
Greg Bacus, Research Director
+1 (512) 474 2400
The market terms and definitions in this report are based on NAIOP standards. No
warranty or representation, express or implied, is made to the accuracy or completeness
of the information contained herein, and same is submitted subject to errors, omissions,
change of price, rental or other conditions, withdrawal without notice, and to any special
listing conditions imposed by our principals.
© 2015 Cushman & Wakefield, Inc. All rights reserved.
1
ECONOMIC OVERVIEW
For yet another consecutive quarter, the
economic future of Austin continues to look
bright. Forbes ranks Austin as the second best
city for future job growth in America. The
unemployment rate of 3.9% continues to be
lower than both the state (4.9%) and national (5.6%) averages, and
ranks the third lowest rate amongst all major metropolitan cities in
the United States (Bureau of Labor and Statistics). These low
unemployment rates combined with both the robust job growth and
high quality of living continue to make Austin an attractive destination
for both individuals and corporate entities to call the city home.
CBD VACANCY RATE CONTINUES TO DECLINE
A total of 1.7 million square feet of direct absorption was recorded
for all submarkets in 2014, a year-over-year increase of 40.0%. Q4
2014 experienced 291,683 square feet (sf) of absorption. This strong
absorption number left the overall vacancy rate at 9.1% for the total
market, 1.7 percentage point (pp) lower than the vacancy rate of Q4
2013. A large portion of the Q4 absorption number can be attributed
to the delivery of the IBC Bank Plaza located in the CBD, in which
173,519 sf was absorbed. Large tenants occupying the building include
IBC Bank (12,000 sf), First Trust (35,000 sf), Sizmek (15,000 sf), and
Hill + Knowlton (18,000 sf). Move-ins at IBC Bank Plaza and others,
led to a continued drop of the overall vacancy rate in the CBD to
6.9%, 0.5 (pp) lower than the rate seen in Q3 2014. The overall
vacancy rate for the CBD of Q4 2014 of 6.9% marked another
milestone, as the lowest rate recorded since Q1 2001.
RENTAL RATES ON THE RISE
With the decreases in vacancy across all submarkets, it is no surprise
that the entire market has experienced an upward trend in rental
rates. The average full-service (FS) rental rate for the total market
was recorded as $29.31 per square foot (psf) for Q4 2014. This rate
is 1.3% higher than the average rate in Q4 2013. The submarket with
the highest year-over-year increase in average FS rates was the CBD,
which experienced a 1.8% increase from Q4 2013, increasing from
the average full service rate of $39.45 psf to $43.32 psf in Q4 2014.
OUTLOOK
Substantial amounts of construction activity still dominate the Austin
skyline, and the pattern is set to continue well into 2015. The recent
deliveries of IBC Bank Plaza in the CBD, and Champion Office Park in
the Far North West (FNW) submarket, along with the soon to be
completed Colorado Tower (CBD) and Domain 7 (FNW) will add
considerable amounts of square feet to both the CBD and suburban
market inventories. However, given the sizable amounts of pre-
leasing activity in many of these buildings the overall vacancy rates will
be only slightly affected. The existing low vacancy rates coupled with
strong absorption figures throughout 2014 will likely contribute to a
gradual climb of 2015 rental rates, and lead to new record rental
rates throughout the Austin market.
STATS ON THE GO
Q4 2013 Q4 2014
Y-O-Y CHANGE
12 MONTH FORECAST
Overall Vacancy 10.8% 9.1% 1.7pp
Direct Asking Rents (psf/yr) $28.93 $29.31 1.3%
YTD Direct Absorption (sf) 1,232,692 1,725,330 40.0%
DIRECT RENTAL VS. VACANCY RATES
NEW SUPPLY
0.0%
5.0%
10.0%
15.0%
20.0%
$22.00
$23.00
$24.00
$25.00
$26.00
$27.00
$28.00
$29.00
$30.00
2010 2011 2012 2013 Q4 2014
psf
/yr
DIRECT GROSS RENTAL RATE DIRECT VACANCY RATE
0.1
0.2
0.1
0.9
3.4
0.0
1.0
2.0
3.0
4.0
2011 2012 2013 2014 2015
msf
NEW SUPPLY
Q4 2014 AUSTIN, TX
OFFICE SNAPSHOT MARKETBEAT
A Cushman & Wakefield Research Publication

Cushman & Wakefield | Oxford Commercial
200 W. Cesar Chavez St. Suite 250
Austin, TX 78701
www.cushmanwakefield.com/knowledge
For more information, contact:
Greg Bacus, Research Director
+1 (512) 474 2400
The market terms and definitions in this report are based on NAIOP standards. No
warranty or representation, express or implied, is made to the accuracy or completeness
of the information contained herein, and same is submitted subject to errors, omissions,
change of price, rental or other conditions, withdrawal without notice, and to any special
listing conditions imposed by our principals.
© 2015 Cushman & Wakefield, Inc. All rights reserved.
2
AUSTIN, TEXAS
SUBMARKET INVENTORY OVERALL VACANCY
RATE
DIRECT
VACANCY
RATE
YTD LEASING ACTIVITY
UNDER CONSTRUCTION
YTD CONSTRUCTION COMPLETIONS
YTD DIRECT NET ABSORPTION
YTD OVERALL NET ABSORPTION
OVERALL WTD. AVG
ALL CLASSES GROSS
RENTAL RATE*
DIRECT WTD. AVG.
CLASS A GROSS RENTAL RATE*
CBD 8,823,427 6.9% 6.3% N/A 916,740 194,749 597,991 592,080 $40.15 $43.32
Central 998,679 12.4% 6.9% N/A 131,721 0 86,458 86,458 $34.86 $35.30
Far Northwest 12,052,204 11.6% 10.5% N/A 1,047,537 360,600 281,976 299,655 $28.70 $29.25
North Central 2,212,938 11.3% 11.1% N/A 0 0 99,288 95,209 $21.02 $24.49
Northeast 2,098,896 6.4% 6.4% N/A 487,104 30,248 78,596 78,596 $18.41 N/A
Northwest 4,170,937 10.2% 8.5% N/A 0 0 68,773 66,072 $28.16 $30.78
South Central 2,103,594 1.7% 1.7% N/A 0 0 9,384 13,018 $24.24 N/A
Southeast 992,420 24.1% 24.1% N/A 0 0 20,048 20,048 $14.50 $25.96
Southwest 9,161,243 6.9% 5.0% N/A 1,052,500 36,530 469,145 359,063 $31.95 $32.27
Round Rock 1,044,635 9.6% 9.4% N/A 0 0 13,671 13,671 $25.98 $24.44
SUBURBS 35,285,366 9.6% 8.4% N/A 2,718,862 427,378 1,127,339 1,031,790 $27.36 $30.32
TOTALS 44,108,793 9.1% 7.9% N/A 3,635,602 622,127 1,725,330 1,628,870 $29.31 $32.36
* RENTAL RATES REFLECT ASKING $PSF/YEAR
MARKET HIGHLIGHTS
SIGNIFICANT 2014 LEASE TRANSACTIONS SUBMARKET TENANT BUILDING CLASS SQUARE FEET
Rollingwood Center SW EZCorp A 139,500
Quarry Oaks Atrium III FNW BazaarVoice A 137,615
Colorado Tower CBD Parsley Energy A 135,107
SIGNIFICANT 2014 SALE TRANSACTIONS SUBMARKET BUYER PURCHASE PRICE / $PSF SQUARE FEET
River Place Corporate Park NW Brandywine Realty Trust $128,100,000/ $217 590,881
The Avallon FNW DivcoWest $60,100,000/ $189 318,217
Research Park 7 & 8 NW ESPyder Corp Undisclosed 260,071
SIGNIFICANT 2014 CONSTRUCTION
COMPLETIONS
SUBMARKET MAJOR TENANT COMPLETION DATE BUILDING SQUARE FEET (% LEASED)
Champion Office Park FNW Jobs-to- Careers 12/2014 220,600 (5.9%)
IBC Bank Plaza CBD First Trust 10/2014 194,749 (91%)
Domain 2 FNW HomeAway 12/2014 140,000 (100%)
SIGNIFICANT PROJECTS UNDER
CONSTRUCTION
SUBMARKET MAJOR TENANT COMPLETION DATE BUILDING SQUARE FEET (% LEASED)
Colorado Tower CBD Parsley Energy Q1 2015 373,334 (95%)
3700 San Clemente SW Spiceworks Q2 2015 250,000 (38%)
Domain 7 NC Amazon Q1 2015 221,973 (70%)
Rollingwood Center SW EZCorp Q2 2015 215,000 (100%)
Capital Ridge SW N/A Q2 2015 207,000 (0.0%)
5th + Colorado CBD N/A Q1 2016 171,000 (0%)
Encino Trace Building I SW ARM Q2 2015 160,000 (75%)
Quarry Oaks III FNW Bazaarvoice Q4 2015 140,000 (100%)
Seaholm Power CBD athenahealth Q1 2015 136,000 (100%)
Lamar Central CEN N/A Q3 2015 131,722 (0%)
501 Congress CBD Dropbox Q1 2015 116,435 (48%)
* RENEWAL - NOT INCLUDED IN LEASING ACTIVITY STATISTICS

Cushman & Wakefield | Oxford Commercial
200 W. Cesar Chavez St. Suite 250
Austin, TX 78701
www.cushmanwakefield.com/knowledge
For more information, contact:
Greg Bacus, Research Director
+1 (512) 474 2400
The market terms and definitions in this report are based on NAIOP standards. No
warranty or representation, express or implied, is made to the accuracy or completeness
of the information contained herein, and same is submitted subject to errors, omissions,
change of price, rental or other conditions, withdrawal without notice, and to any special
listing conditions imposed by our principals.
© 2014 Cushman & Wakefield, Inc. All rights reserved.
1
ECONOMIC OVERVIEW
According to the Austin Chamber of
Commerce, over 9,200 jobs have been created
as a result of corporate relocations and
expansions in the Austin Metropolitan Area
since January 2014. The city-wide
unemployment rate of 4.4% remains lower than the state
unemployment rate of 5.3% and the national average of 6.1% (Bureau
of Labor Statistics, August 2014). The professional and business
services industry has experienced the highest growth rate since the
beginning of the year, growing 6.7% from August 2013 to August
2014. The leisure and hospitality industry followed close behind
increasing 6.6% during the same time period.
VACANCY RATES DROP TO A NEW LOW
Year-to-date direct absorption for the total market was 1.4 million
square feet (msf), a year-over-year increase of 68.6%, dropping the
overall vacancy rate 3.0 percentage points to 8.6%. The CBD
experienced a record-breaking quarter recording 255,474 square feet
(sf) of direct absorption. This absorption can be attributed to multiple
large move-ins by tenants including Main Street Hub (20,640 sf),
Tableau Software (36,656 sf), Box, Inc. (20,640 sf), and WeWork Labs
(32,384 sf) at One American Center. These move-ins amongst others
led to a drop in the overall vacancy rate of 2.5 percentage points
from Q2 2014 to 7.4% – the lowest rate recorded for the CBD since
Q1 2001.
The Central submarket also experienced an impressive quarter
recording 84,521sf of positive absorption and the overall vacancy rate
decline of 9.5 percentage points from Q2 2014 to 9.8%. This
substantial change in vacancy is due to the Central submarket
containing the second lowest amount of inventory across the city,
totalling less than 1.0 msf. This limited inventory coupled with Google
(49,318 sf) and Evernote (29,654 sf) occupying space at University
Park led to this dramatic decrease in the vacancy rate.
RENTAL RATES REMAIN CONSTANT
Average asking rental rates for the total market have trended upward
since Q1 2011. However, average rental rates have remained
constant during Q3 2014. These consistent rates may be reflective of
the substantial influx of competing space set to deliver in the
subsequent quarters.
OUTLOOK
Although multiple large developments are set to deliver in the
upcoming quarters, vacancy rates are not expected to increase
significantly, particularly in the CBD. Colorado Tower and IBC Bank
Plaza will deliver over 500,000 sf of office space to the CBD in Q4
2014 but will provide minimal relief as both projects are nearly 100%
leased, setting the stage for new construction to break ground and
potentially another record breaking quarter of positive absorption.
Average rental rates are expected to hold steady as multiple large
tenants in the market look to fill newly constructed space.
STATS ON THE GO
Q3 2013 Q3 2014
Y-O-Y CHANGE
12 MONTH FORECAST
Overall Vacancy 11.6% 8.6% 3.0pp
Direct Asking Rents (psf/yr) $28.54 $29.17 2.2%
YTD Direct Absorption (sf) 850,731 1,433,962 168.6%
DIRECT RENTAL VS. VACANCY RATES
NEW SUPPLY
0.0%
5.0%
10.0%
15.0%
20.0%
$22.00
$23.00
$24.00
$25.00
$26.00
$27.00
$28.00
$29.00
$30.00
2010 2011 2012 2013 Q3 2014
psf
/yr
DIRECT GROSS RENTAL RATE DIRECT VACANCY RATE
0.1
0.2
0.1
1.6
2.3
0.0
0.5
1.0
1.5
2.0
2.5
2011 2012 2013 2014 2015
msf
NEW SUPPLY
Q3 2014 AUSTIN, TX
OFFICE SNAPSHOT MARKETBEAT
A Cushman & Wakefield Research Publication

Cushman & Wakefield | Oxford Commercial
200 W. Cesar Chavez St. Suite 250
Austin, TX 78701
www.cushmanwakefield.com/knowledge
For more information, contact:
Greg Bacus, Research Director
+1 (512) 474 2400
The market terms and definitions in this report are based on NAIOP standards. No
warranty or representation, express or implied, is made to the accuracy or completeness
of the information contained herein, and same is submitted subject to errors, omissions,
change of price, rental or other conditions, withdrawal without notice, and to any special
listing conditions imposed by our principals.
© 2014 Cushman & Wakefield, Inc. All rights reserved.
2
AUSTIN, TEXAS
SUBMARKET INVENTORY OVERALL VACANCY
RATE
DIRECT
VACANCY
RATE
YTD LEASING ACTIVITY
UNDER CONSTRUCTION
YTD CONSTRUCTION COMPLETIONS
YTD DIRECT NET ABSORPTION
YTD OVERALL NET ABSORPTION
OVERALL WTD. AVG
ALL CLASSES GROSS
RENTAL RATE*
DIRECT WTD. AVG.
CLASS A GROSS RENTAL RATE*
CBD 8,628,427 7.4% 6.9% N/A 1,111,489 0 368,016 349,091 $40.13 $43.12
Central 998,679 9.8% 7.1% N/A 131,721 0 84,521 84,521 $34.78 $35.35
Far Northwest 12,229,327 9.9% 9.3% N/A 1,235,137 0 323,527 329,582 $29.20 $29.93
North Central 2,485,635 10.5% 10.3% N/A 0 0 89,106 85,027 $20.89 $24.17
Northeast 1,994,796 6.8% 6.8% N/A 487,104 30,248 76,296 76,296 $18.22 N/A
Northwest 3,950,337 7.3% 6.7% N/A 0 0 54,602 49,504 $25.52 $28.90
South Central 2,103,594 2.0% 2.0% N/A 0 0 3,046 6,680 $23.43 N/A
Southeast 992,420 24.5% 24.5% N/A 0 0 16,480 16,480 $14.58 $25.11
Southwest 9,161,243 7.6% 5.3% N/A 1,084,058 36,530 418,524 258,887 $31.70 $32.27
Round Rock 1,112,135 13.3% 13.1% N/A 0 0 (156) (156) $23.33 $22.80
SUBURBS 35,028,166 8.9% 7.9% N/A 2,938,020 66,778 1,065,946 906,821 $26.93 $30.56
TOTALS 43,656,593 8.6% 7.7% N/A 4,049,509 66,778 1,433,962 1,255,912 $29.17 $32.95
* RENTAL RATES REFLECT ASKING $PSF/YEAR
MARKET HIGHLIGHTS
SIGNIFICANT Q3 2014 LEASE TRANSACTIONS SUBMARKET TENANT BUILDING CLASS SQUARE FEET
Parmer Sector 6 – 301 Howard Ln. NE Allergan A 90,000
Aspen Lake Two FNW Q2eBanking, Inc. A 68,500
Colorado Tower CBD Parsley Energy A 48,368
SIGNIFICANT Q3 2014 SALE TRANSACTIONS SUBMARKET BUYER PURCHASE PRICE / $PSF SQUARE FEET
11001 Lakeline Blvd. FNW DRA Advisors Undisclosed 239,754
505 E. Huntland Ave. NC Taurus Investment Holdings $20,400,000 / $130 155,604
9505 Arboretum Blvd FNW UPMA Undisclosed 150,033
SIGNIFICANT 2014 CONSTRUCTION
COMPLETIONS
SUBMARKET MAJOR TENANT COMPLETION DATE BUILDING SQUARE FEET (% LEASED)
Hill Country Galleria W SW Korcett 9/2014 36,530 (82.1%)
2021 E. 5TH NE Enviromedia 01/2014 30,248 (100%)
SIGNIFICANT PROJECTS UNDER
CONSTRUCTION
SUBMARKET MAJOR TENANT COMPLETION DATE BUILDING SQUARE FEET (% LEASED)
Colorado Tower CBD Parsley Energy Q4 2014 373,334 (95.0%)
3700 San Clemente SW Spiceworks Q2 2015 250,000 (38.2%)
Domain 7 NC Ottobock Q4 2014 221,973 (18.0%)
Champion Office Park NW Jobs-to- Careers Q4 2014 220,600 (5.9%)
Rollingwood Center SW LatinWorks Q2 2015 215,000 (23.4%)
Capital Ridge SW N/A Q2 2015 207,000 (0.0%)
IBC Bank Plaza CBD IBC Bank/ Endeavor Q4 2014 194,749 (90.5%)
5th & Colorado CBD N/A Q1 2016 171,000 (0%)
Encino Trace Building I SW ARM Q2 2015 160,000 (75.0%)
Domain 2 NC HomeAway Q4 2014 140,000 (100%)
Seaholm Power CBD athenahealth Q4 2014 136,000 (100%)
3800 Lamar CEN N/A Q3 2015 131,722 (0%)
* RENEWAL - NOT INCLUDED IN LEASING ACTIVITY STATISTICS

Cushman & Wakefield | Oxford Commercial
200 W. Cesar Chavez St. Suite 250
Austin, TX 78701
www.cushmanwakefield.com/knowledge
For more information, contact:
Justin Bibb, Research Director
+1 (512) 474 2400
The market terms and definitions in this report are based on NAIOP standards. No
warranty or representation, express or implied, is made to the accuracy or completeness
of the information contained herein, and same is submitted subject to errors, omissions,
change of price, rental or other conditions, withdrawal without notice, and to any special
listing conditions imposed by our principals.
© 2014 Cushman & Wakefield, Inc. All rights reserved.
1
ECONOMIC OVERVIEW
According to the Austin Chamber of
Commerce, over 4,500 jobs have been created
in the Austin Metropolitan Area as a result of
corporate relocations and expansions since
January 2014. The city-wide unemployment
rate of 4.1% paces ahead of the state unemployment rate of 5.1% and
the national average of 6.1% (Bureau of Labor Statistics, May 2014).
The professional and business services industry has experienced the
highest growth rate since the beginning of the year, growing 7.8%
from May 2013 to May 2014.
VACANCY RATES REMAIN FASTENED
The year-to-date direct absorption rate for the total market was
667,901 square feet (sf), 15.0% higher than a year ago, dropping the
overall vacancy rate 1.4 percentage points to 10.2%. In the second
quarter, the CBD experienced a negative absorption rate of 30,064 sf,
breaking the nearly year-long trend of positive absorption. However,
leasing in the CBD remains strong, as seen by Under Armour’s lease
of 33,000 sf at the Seaholm low-rise building and Whole Foods’ lease
of 40,000 sf at 311 Bowie bringing both of these office projects to
100% leased.
Vacancy in the southwest submarket increased for the first time since
Q3 2013, rising to 8.9% which is a 3.3 percentage point increase
quarter-over-quarter. This increase can be attributed in large part to
AMD vacating 118,000 sf at the Summit at Lantana and LifeSize
Communications Inc. vacating 31,756 sf at Two Barton Skyway. With
960,000 sf under construction, the majority of which is delivering in
2015, and several large blocks of existing inventory coming vacant,
this could bring must needed relief to a submarket with historically
low vacancy. However, with several large tenants in the market and
continued demand from tech users, as seen by Apple Inc. expanding
48,956 sf at CityView Center, the southwest should continue to
perform well in subsequent quarters.
RENTAL RATES REACH RECORD HIGHS
The second quarter introduced record-breaking rental rates in the
CBD and the southwest markets. CBD rates climbed again this
quarter, reaching an average rental rate of $40.07 per square foot
(psf) for all classes and $43.21 psf for Class A properties. The
southwest market reached $31.01 psf for all classes, a year-over-year
increase of 7.8%. Furthermore, direct asking rents rose 5.8% year-to-
date from $27.60 psf to $29.21psf for all classes city-wide.
OUTLOOK
Developments under construction in the CBD are roughly 60.0% pre-
leased overall, and with continued interest at the Colorado Tower
and IBC Bank Plaza projects likely elevating that percentage in Q3 and
Q4 2014, demand for space in the CBD will keep downward pressure
on vacancy rates. This will leave the window of opportunity open for
CBD Class A projects in the pipeline to break ground soon.
STATS ON THE GO
Q2 2013 Q2 2014
Y-O-Y CHANGE
12 MONTH FORECAST
Overall Vacancy 11.6% 10.2% 1.4pp
Direct Asking Rents (psf/yr) $27.60 $29.21 5.8%
YTD Absorption (sf) 580,664 667,901 115.0%
DIRECT RENTAL VS. VACANCY RATES
NEW SUPPLY
0.0%
5.0%
10.0%
15.0%
20.0%
$22.00
$23.00
$24.00
$25.00
$26.00
$27.00
$28.00
$29.00
$30.00
2010 2011 2012 2013 Q2 2014
psf
/yr
DIRECT GROSS RENTAL RATE DIRECT VACANCY RATE
0.1 0
.2
0.1
1.6
0.8
0.0
0.5
1.0
1.5
2.0
2011 2012 2013 2014 2015
msf
NEW SUPPLY
Q2 2014 AUSTIN, TX
OFFICE SNAPSHOT MARKETBEAT
A Cushman & Wakefield Research Publication

Cushman & Wakefield | Oxford Commercial
200 W. Cesar Chavez St. Suite 250
Austin, TX 78701
www.cushmanwakefield.com/knowledge
For more information, contact:
Justin Bibb, Research Director
+1 (512) 474 2400
The market terms and definitions in this report are based on NAIOP standards. No
warranty or representation, express or implied, is made to the accuracy or completeness
of the information contained herein, and same is submitted subject to errors, omissions,
change of price, rental or other conditions, withdrawal without notice, and to any special
listing conditions imposed by our principals.
© 2014 Cushman & Wakefield, Inc. All rights reserved.
2
AUSTIN, TEXAS
SUBMARKET INVENTORY OVERALL VACANCY
RATE
DIRECT
VACANCY
RATE
YTD LEASING ACTIVITY
UNDER CONSTRUCTION
YTD CONSTRUCTION COMPLETIONS
YTD DIRECT NET ABSORPTION
YTD OVERALL NET ABSORPTION
OVERALL WTD. AVG
ALL CLASSES GROSS
RENTAL RATE*
DIRECT WTD. AVG.
CLASS A GROSS RENTAL RATE*
CBD 8,690,127 9.9% 9.7% N/A 959,887 0 112,542 129,878 $40.07 $43.21
Central 998,679 19.3% 16.6% N/A 0 0 (9,819) (9,819) $34.52 $35.00
Far Northwest 12,227,127 11.0% 10.1% N/A 0 0 224,099 194,946 $28.33 $28.97
North Central 2,485,635 11.5% 11.3% N/A 361,973 0 64,096 60,017 $20.93 $23.92
Northeast 1,994,796 9.4% 9.4% N/A 0 30,248 24,683 24,683 $18.20 N/A
Northwest 3,950,337 9.1% 8.2% N/A 220,600 0 (4,796) (20,251) $25.67 $28.49
South Central 2,103,594 1.9% 1.9% N/A 0 0 4,502 8,136 $23.02 N/A
Southeast 992,420 25.2% 25.2% N/A 0 0 8,671 8,671 $14.70 $22.96
Southwest 9,124,743 8.9% 6.8% N/A 954,030 0 245,122 107,316 $31.01 $32.03
Round Rock 1,112,135 13.6% 13.2% N/A 0 0 (1,199) (1,199) $22.39 $22.23
SUBURBS 34,989,466 10.3% 9.3% N/A 1,536,603 30,248 555,359 372,500 $26.64 $30.02
TOTALS 43,679,593 10.2% 9.4% N/A 2,496,490 30,248 667,901 502,378 $29.21 $32.68
* RENTAL RATES REFLECT ASKING $PSF/YEAR
MARKET HIGHLIGHTS
SIGNIFICANT Q2 2014 LEASE TRANSACTIONS SUBMARKET TENANT BUILDING CLASS SQUARE FEET
CityView Center SW Apple A 48,956
311 Bowie CBD Whole Foods A 40,000
Seaholm Power CBD Under Armour A 33,000
SIGNIFICANT Q2 2014 SALE TRANSACTIONS SUBMARKET BUYER PURCHASE PRICE / $PSF SQUARE FEET
Mira Vista & The Overlook (2) SW Clarion Partners $60,037,880 / $340 176,582
Overwatch Campus SW Drawbridge Realty Trust $42,500,000 / $258 164,700
5000 Plaza on the Lake SW Clarion Partners $36,916,970 / $310 119,087
SIGNIFICANT 2014 CONSTRUCTION
COMPLETIONS
SUBMARKET MAJOR TENANT COMPLETION DATE BUILDING SQUARE FEET (% LEASED)
2021 E. 5TH NE Enviromedia 01/2014 30,248 (100%)
SIGNIFICANT PROJECTS UNDER
CONSTRUCTION
SUBMARKET MAJOR TENANT COMPLETION DATE BUILDING SQUARE FEET (% LEASED)
Colorado Tower CBD Parsley Energy Q4 2014 373,334 (54.0%)
3700 San Clemente SW Spiceworks Q2 2015 250,000 (38.3%)
Domain 7 NC Ottobock Q3 2014 221,973 (18.0%)
Champion Office Park NW N/A Q3 2014 220,600 (0.0%)
Rollingwood Center SW LatinWorks Q2 2015 215,000 (23.4%)
Capital Ridge SW N/A Q2 2015 207,000 (0.0%)
IBC Bank Plaza CBD IBC Bank/ Endeavor Q3 2014 194,749 (50.1%)
Encino Trace Building I SW ARM Q2 2015 160,000 (75.0%)
Domain 2 NC HomeAway Q3 2014 140,000 (100%)
Seaholm Power CBD athenahealth Q2 2014 136,000 (100%)
501 Congress CBD Dropbox Q4 2014 116,435 (48.2%)
* RENEWAL - NOT INCLUDED IN LEASING ACTIVITY STATISTICS

Cushman & Wakefield | Oxford Commercial
200 W. Cesar Chavez St. Suite 250
Austin, TX 78701
www.cushmanwakefield.com/knowledge
For more information, contact:
Justin Bibb, Research Director
+1 (512) 474 2400
The market terms and definitions in this report are based on NAIOP standards. No
warranty or representation, express or implied, is made to the accuracy or completeness
of the information contained herein, and same is submitted subject to errors, omissions,
change of price, rental or other conditions, withdrawal without notice, and to any special
listing conditions imposed by our principals.
© 2014 Cushman & Wakefield, Inc. All rights reserved.
1
ECONOMIC OVERVIEW
The Fastest-Growing City in America for the
4th consecutive year, according to Forbes,
Austin marches forward as a cultural and
economic leader in the U.S. According to the
Texas Workforce Commission, Austin
recorded an unemployment rate of 4.8% in February of 2014, almost
one and two percentage points ahead of the state average of 5.7% and
national average of 6.7% respectively. As jobs boon the local
economy, the fundamentals point to continued growth in the office
market.
VACANCY FALLS BELOW TEN PERCENT
First quarter direct absorption for the market was 456,340 square
feet (sf), 116.6% higher than a year ago, taking the overall vacancy
rate down to 9.9%. In the CBD, overall vacancy is 9.3%, down 2
percentage points from 11.3% in Q1 2013, after 142,606 sf of leases
commenced this quarter. Tenants looking for large blocks of space
have a limited number of options, pushing those tenants toward new
construction. In the case of Encino Trace, 3700 San Clemente and
Rollingwood Center, all in the southwest submarket, construction
commenced with signing on an anchor tenant this quarter.
Furthermore, six of the ten largest office leases this quarter signed
with projects not yet delivered.
Although vacancy is at uncomfortable levels, approximately 1.6 million
square feet (msf) of office product is slated to deliver this year, of
which, 915,641 sf is in the CBD. We anticipate an increase in leasing
activity in the CBD as companies look to differentiate their culture
through a dynamic live/ work/ play environment. Although occupying
downtown adds costs, companies have found value in the ability to
retain employees in a competitive labor force. Offering employees a
unique office environment with access to the bars, restaurants and
entertainment venues that downtown provides, we expect the
urbanization theme to continue in 2014.
RENTAL RATES CLIMB AGAIN
Average asking rates for the overall market are $28.83 per square
foot (psf), up from $27.54 psf in Q1 2013, and an increase of 4.7%.
Asking rates in the CBD are up 3.2%, improving from $38.50 psf to
$39.74 psf. Over a 5 year period, asking rates have improved 14.6%
from $25.15 psf in Q1 2010 to $28.83 psf in Q1 2014. Class A rates
for the overall market improved 5.0% from $31.14 psf in Q1 2013 to
$32.70 psf this quarter. In the CBD, class A rates are up from $42.16
psf to $43.16 psf, an increase of 2.4%. Over the same 5 year period,
class A rates have improved 18.6% from $27.58 psf to $32.70 psf.
OUTLOOK
Austin’s tech and creative industries continue to fuel the economy.
Several large tech companies, such as athenahealth, Dropbox and
Websense, signed major leases this quarter and will bring large
workforces to Austin. This should help as vacancy levels will begin to
trend upward for the first time since 2010 once new construction
comes online. But as pre-leasing activity picks up, we expect to see
strong absorption that will help occupancy levels withstand the 2.5
msf, or 5.7% increase in inventory that is on the way.
STATS ON THE GO
Q1 2013 Q1 2014
Y-O-Y CHANGE
12 MONTH FORECAST
Overall Vacancy 12.5% 9.9% 2.6pp
Direct Asking Rents (psf/yr) $27.54 $28.83 4.7%
YTD Absorption (sf) 210,722 456,340 116.6%
DIRECT RENTAL VS. VACANCY RATES
NEW SUPPLY
0.0%
5.0%
10.0%
15.0%
20.0%
$22.00
$23.00
$24.00
$25.00
$26.00
$27.00
$28.00
$29.00
$30.00
2010 2011 2012 2013 Q1 2014
psf
/yr
DIRECT GROSS RENTAL RATE DIRECT VACANCY RATE
0.1
0.2
0.1
1.6
0.8
0.0
0.5
1.0
1.5
2.0
2011 2012 2013 2014 2015
msf
NEW SUPPLY
Q1 2014 AUSTIN, TX
OFFICE SNAPSHOT MARKETBEAT
A Cushman & Wakefield Research Publication

Cushman & Wakefield | Oxford Commercial
200 W. Cesar Chavez St. Suite 250
Austin, TX 78701
www.cushmanwakefield.com/knowledge
For more information, contact:
Justin Bibb, Research Director
+1 (512) 474 2400
The market terms and definitions in this report are based on NAIOP standards. No
warranty or representation, express or implied, is made to the accuracy or completeness
of the information contained herein, and same is submitted subject to errors, omissions,
change of price, rental or other conditions, withdrawal without notice, and to any special
listing conditions imposed by our principals.
© 2014 Cushman & Wakefield, Inc. All rights reserved.
2
AUSTIN, TEXAS
SUBMARKET INVENTORY OVERALL VACANCY
RATE
DIRECT
VACANCY
RATE
YTD LEASING ACTIVITY
UNDER CONSTRUCTION
YTD CONSTRUCTION COMPLETIONS
YTD DIRECT NET ABSORPTION
YTD OVERALL NET ABSORPTION
OVERALL WTD. AVG
ALL CLASSES GROSS
RENTAL RATE*
DIRECT WTD. AVG.
CLASS A GROSS RENTAL RATE*
CBD 8,630,127 9.3% 9.2% N/A 959,887 0 142,606 159,942 $39.74 $43.16
Central 998,679 19.9% 17.2% N/A 0 0 (16,097) (16,097) $34.56 $34.98
Far Northwest 12,276,829 12.1% 11.4% N/A 0 0 70,759 49,057 $28.68 $29.61
North Central 2,485,635 11.5% 11.4% N/A 361,973 0 62,519 58,440 $20.76 $24.18
Northeast 1,994,796 9.2% 9.2% N/A 0 30,248 29,381 29,381 $18.97 N/A
Northwest 3,950,337 8.5% 7.7% N/A 220,600 0 16,880 2,909 $25.26 $28.11
South Central 2,103,594 2.3% 1.9% N/A 0 0 4,390 103 $19.91 N/A
Southeast 992,420 25.4% 25.4% N/A 0 0 6,884 6,884 $14.67 $22.37
Southwest 9,124,743 6.4% 5.6% N/A 954,030 0 146,320 114,671 $29.88 $31.44
Round Rock 1,112,135 13.9% 13.7% N/A 0 0 (7,302) (7,302) $22.31 $21.82
SUBURBS 35,039,168 10.1% 9.4% N/A 1,536,603 30,248 313,734 238,046 $26.34 $29.97
TOTALS 43,669,295 9.9% 9.4% N/A 2,496,490 30,248 456,340 397,988 $28.83 $32.70
* RENTAL RATES REFLECT ASKING $PSF/YEAR
MARKET HIGHLIGHTS
SIGNIFICANT Q1 2014 LEASE TRANSACTIONS SUBMARKET TENANT BUILDING CLASS SQUARE FEET
Encino Trace Building I SW Confidential A 120,000
Seaholm Power CBD athenahealth B 103,000
Quarry Oaks Atrium FNW WebSense A 92,000
SIGNIFICANT Q1 2014 SALE TRANSACTIONS SUBMARKET BUYER PURCHASE PRICE / $PSF SQUARE FEET
Avallon 1-5 FNW DivcoWest Properties $60,125,000 / $189 318,217
Aspen Lake 1 FNW Fortis Property Group $38,819,129 / $189 204,698
Las Cimas IV SW Clarion Partners $43,200,000 / $313 138,008
SIGNIFICANT Q1 2014 CONSTRUCTION
COMPLETIONS
SUBMARKET MAJOR TENANT COMPLETION DATE BUILDING SQUARE FEET (% LEASED)
2021 E. 5TH NE Enviromedia 01/2014 30,248 (100%)
SIGNIFICANT PROJECTS UNDER
CONSTRUCTION
SUBMARKET MAJOR TENANT COMPLETION DATE BUILDING SQUARE FEET (% LEASED)
Colorado Tower CBD Parsley Energy Q3 2014 373,334 (53.1%)
3700 San Clemente SW Spiceworks Q2 2015 250,000 (38.3%)
Domain 7 NC Ottobock Q3 2014 221,973 (18.0%)
Champion Office Park NW N/A Q3 2014 220,600 (0.0%)
Rollingwood Center SW LatinWorks Q2 2015 215,000 (23.4%)
Capital Ridge SW N/A Q2 2015 207,000 (0.0%)
IBC Bank Plaza CBD IBC Bank/ Endeavor Q3 2014 194,749 (34.1%)
Encino Trace Building I SW Confidential Q2 2015 160,000 (75.0%)
Domain 2 NC HomeAway Q3 2014 140,000 (100%)
Seaholm Power CBD athenahealth Q2 2014 136,000 (75.7%)
501 Congress CBD Dropbox Q4 2014 116,435 (48.2%)
* RENEWAL - NOT INCLUDED IN LEASING ACTIVITY STATISTICS