market and feasibility study fredericksburg ... and feasibility study fredericksburg conference...
TRANSCRIPT
MARKET AND FEASIBILITY STUDY
Fredericksburg ConferenceCenter
FREDERICKSBURG, TEXAS
SUBMITTED TO:EXISTING
Mr. Ernest LoefflerFredericksburg Convention and Visitor Bureau302 East Austin StreetFredericksburg, Texas, [email protected]+1 (830) 997-6523
PREPARED BY:
HVS Convention, Sports & EntertainmentFacilities Consulting
205 West RandolphSuite 1650Chicago, Illinois 60606+1 (312) 587-9900
May 27, 2015
Convention, Sports & EntertainmentFacilities ConsultingChicago, Illinois
May 27, 2015
Mr. Ernest LoefflerFredericksburg Convention and Visitor Bureau302 East Austin StreetFredericksburg, Texas, [email protected]
Re: Fredericksburg Conference Center
Fredericksburg, Texas
Dear Mr. Loeffler:
Attached you will find our Market and Feasibility Study of a FredericksburgConference Center in Fredericksburg, Texas.
We certify that we have no undisclosed interest in the property, and ouremployment and compensation are not contingent upon our findings. This study issubject to the comments made throughout this report and to all assumptions andlimiting conditions set forth herein.
It has been a pleasure working with you. Please let us know if we can provide anyadditional services.
Sincerely,
HVS Convention, Sports & Entertainment
Facilities Consulting
Thomas A Hazinski
Managing Director
Catherine Sarrett
Project Manager
Brian Harris
Director
205 West Randolph
Suite 1650
Chicago, Illinois 60606
+1 312-587-9900
+1 312-488-3631 FAX
www.hvs.com
Atlanta
Boston
Boulder
Chicago
Dallas
Denver
Las Vegas
Mexico City
Miami
Nassau
New York
Newport
San Francisco
Toronto
Vancouver
Washington
Athens
Buenos Aires
Dubai
Hong Kong
Lima
London
Madrid
Mumbai
New Delhi
Sao Paulo
Shanghai
Singapore
Convention, Sports & EntertainmentFacilities ConsultingChicago, Illinois
Table of Contents
SECTION TITLE
1. Introduction and Executive Summary
2. Market Area Overview
3. Industry Trends
4. Comparable Venues
5. Survey Findings
6. Building Program Recommendations
7. Demand Analysis
8. Hotel Supply and Demand Analysis
9. Site Evaluation
10. Financial Analysis
11. Economic Impact
12. Approach to Financing
13. Statement of Assumptions and Limiting Conditions
14. Certification

Convention, Sports & EntertainmentFacilities ConsultingChicago, Illinois
May 27, 2015 Introduction and Executive SummaryMarket and Feasibility Study Fredericksburg Conference Center – Fredericksburg, Texas 1-1
1. Introduction and Executive Summary
The Fredericksburg Convention and Visitor Bureau (“FCVB”) engaged HVSConvention, Sports & Entertainment Facilities Consulting (“HVS”) to conduct amarket and feasibility study for a proposed conference center in Fredericksburg,Texas. The FCVB tasked HVS with investigating whether the development of aconference center could enhance the demand potential of the meetings market inFredericksburg and allow the city to compete more effectively for regional andstate group meetings business
In accordance with the Scope of Services, HVS performed the following tasks:
1. Thomas Hazinski and Catherine Sarrett traveled to Fredericksburg, Texason December 16-17, 2014 for a site visit and client meeting. During thisvisit, they toured the city, local attractions, hotels, and other amenities andmet with project stakeholders,
2. Analyzed the economic and demographic data that indicate whether, andthe extent to which, the local market area would support the proposedconference center development,
3. Surveyed current and potential users of Fredericksburg’s group meetinginfrastructure to understand their event needs, their overall impressions ofFredericksburg and its existing properties, and the likelihood of bookingevents in a new facility,
4. Compiled data on 25 competitive and comparable convention centers toinform and test the reasonableness of the building programrecommendations,
5. Recommended a building program for a conference center inFredericksburg based on the above steps,
6. Prepared event demand and attendance forecasts based on theimplementation of the conference center recommendations,
7. Prepared a hotel market supply and demand analysis,
8. Prepared a site analysis to recommend preferred locations for theproposed conference center,
9. Prepared a financial forecast for the proposed conference centeroperations,
Nature of theAssignment
Methodology
Convention, Sports & EntertainmentFacilities ConsultingChicago, Illinois
May 27, 2015 Introduction and Executive SummaryMarket and Feasibility Study Fredericksburg Conference Center – Fredericksburg, Texas 1-2
10. Prepared an economic and fiscal impact analysis for the proposedconference center, and
11. Outlined possible approaches to the management and funding of theproposed conference center.
HVS staff collected and analyzed all information contained in this report. Wesought out reliable sources and deemed information obtained from third parties tobe accurate.
In Fredericksburg and Gillespie County, major employers in the service sector,including several food based manufacturers, drive the local economy. Althoughrelatively small, the market enjoys low unemployment. Strong agricultural andmanufacturing sectors are sources of a modest amount of group demand. Ananalysis of the wider drive time markets surrounding Fredericksburg shows amuch stronger corporate base from which to draw meeting and conferencedemand, notably in markets within two to three hours of Fredericksburg.
As a convention and meeting option, Fredericksburg is well positioned in heart ofthe Texas Hill Country. Its easy drive-in access from large markets, such as SanAntonio, has made it a popular tourism destination for weekend getaways. Inaddition to its growing reputation as wine country, downtown Fredericksburg hasa well-defined dining and shopping district and historically significant culturalattractions. While the Fredericksburg market contains several smaller venuessuitable for banquets, receptions, and other social events, it lacks a single venuewhich contains the combination of banquet and meeting spaces required tosupport a conference or large meeting. In addition, the larger event spaces inFredericksburg are located in areas without convenient access to downtowndining, retail, and lodging properties, a feature of major importance to eventattendees.
The addition of appropriately sized conference space should allow Fredericksburgto expand its share of the state meeting and conference market.
HVS analyzed 17 potentially competitive conference centers and hotels in the Stateof Texas and eight conference centers and hotels located in comparable winecountry destinations in California, Kentucky, Oregon, and Washington Thisanalysis provides a basis for building program recommendations by comparingthe function spaces and other amenities in each of the facilities along with othermarket characteristics relevant to the success of the venue.
The competitive and comparable venues have a varied mix of exhibit, ballroom,and meeting spaces. While some contain exhibit halls, most only offer meeting andballroom spaces which can support light exhibitions as needed. Ballroom space
Market Area Analysis
Comparable VenueAssessment
Convention, Sports & EntertainmentFacilities ConsultingChicago, Illinois
May 27, 2015 Introduction and Executive SummaryMarket and Feasibility Study Fredericksburg Conference Center – Fredericksburg, Texas 1-3
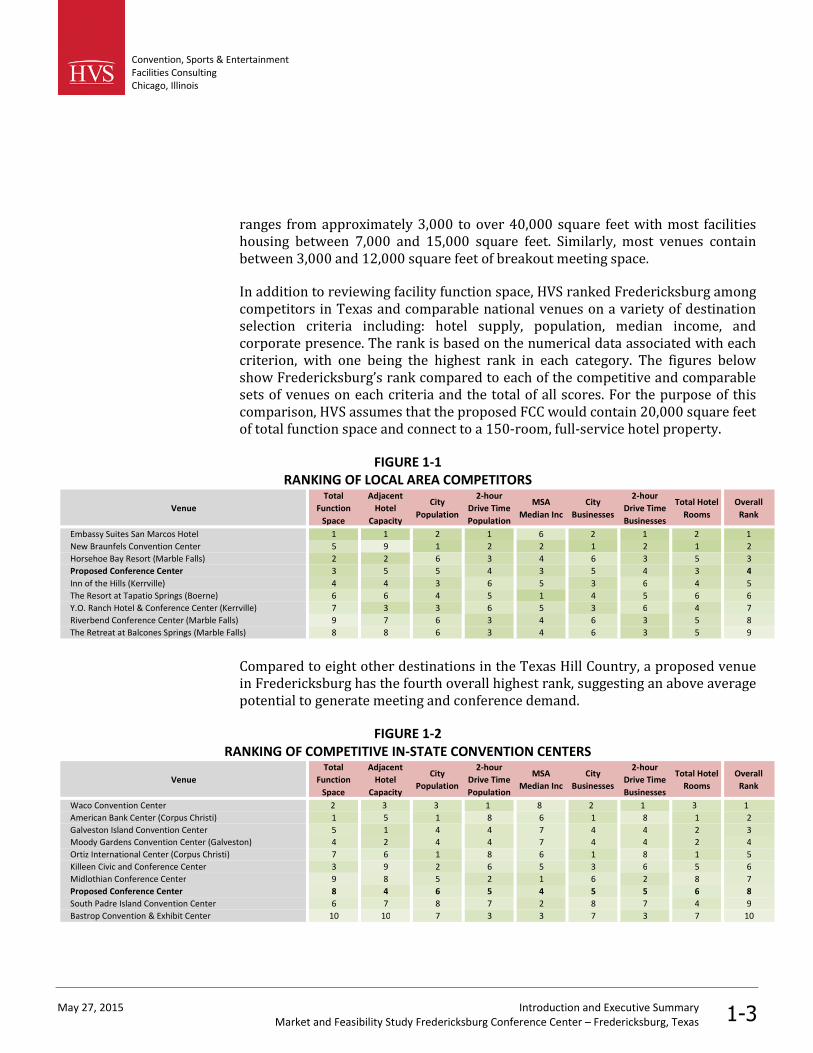
ranges from approximately 3,000 to over 40,000 square feet with most facilitieshousing between 7,000 and 15,000 square feet. Similarly, most venues containbetween 3,000 and 12,000 square feet of breakout meeting space.
In addition to reviewing facility function space, HVS ranked Fredericksburg amongcompetitors in Texas and comparable national venues on a variety of destinationselection criteria including: hotel supply, population, median income, andcorporate presence. The rank is based on the numerical data associated with eachcriterion, with one being the highest rank in each category. The figures belowshow Fredericksburg’s rank compared to each of the competitive and comparablesets of venues on each criteria and the total of all scores. For the purpose of thiscomparison, HVS assumes that the proposed FCC would contain 20,000 square feetof total function space and connect to a 150-room, full-service hotel property.
FIGURE 1-1RANKING OF LOCAL AREA COMPETITORS
Venue
Total
Function
Space
Adjacent
Hotel
Capacity
City
Population
2-hour
Drive Time
Population
MSA
Median Inc
City
Businesses
2-hour
Drive Time
Businesses
Total Hotel
Rooms
Overall
Rank
Embassy Suites San Marcos Hotel 1 1 2 1 6 2 1 2 1
New Braunfels Convention Center 5 9 1 2 2 1 2 1 2
Horsehoe Bay Resort (Marble Falls) 2 2 6 3 4 6 3 5 3
Proposed Conference Center 3 5 5 4 3 5 4 3 4
Inn of the Hills (Kerrville) 4 4 3 6 5 3 6 4 5
The Resort at Tapatio Springs (Boerne) 6 6 4 5 1 4 5 6 6
Y.O. Ranch Hotel & Conference Center (Kerrville) 7 3 3 6 5 3 6 4 7
Riverbend Conference Center (Marble Falls) 9 7 6 3 4 6 3 5 8
The Retreat at Balcones Springs (Marble Falls) 8 8 6 3 4 6 3 5 9
Compared to eight other destinations in the Texas Hill Country, a proposed venuein Fredericksburg has the fourth overall highest rank, suggesting an above averagepotential to generate meeting and conference demand.
FIGURE 1-2RANKING OF COMPETITIVE IN-STATE CONVENTION CENTERS
Venue
Total
Function
Space
Adjacent
Hotel
Capacity
City
Population
2-hour
Drive Time
Population
MSA
Median Inc
City
Businesses
2-hour
Drive Time
Businesses
Total Hotel
Rooms
Overall
Rank
Waco Convention Center 2 3 3 1 8 2 1 3 1
American Bank Center (Corpus Christi) 1 5 1 8 6 1 8 1 2
Galveston Island Convention Center 5 1 4 4 7 4 4 2 3
Moody Gardens Convention Center (Galveston) 4 2 4 4 7 4 4 2 4
Ortiz International Center (Corpus Christi) 7 6 1 8 6 1 8 1 5
Killeen Civic and Conference Center 3 9 2 6 5 3 6 5 6
Midlothian Conference Center 9 8 5 2 1 6 2 8 7
Proposed Conference Center 8 4 6 5 4 5 5 6 8
South Padre Island Convention Center 6 7 8 7 2 8 7 4 9
Bastrop Convention & Exhibit Center 10 10 7 3 3 7 3 7 10
Convention, Sports & EntertainmentFacilities ConsultingChicago, Illinois
May 27, 2015 Introduction and Executive SummaryMarket and Feasibility Study Fredericksburg Conference Center – Fredericksburg, Texas 1-4
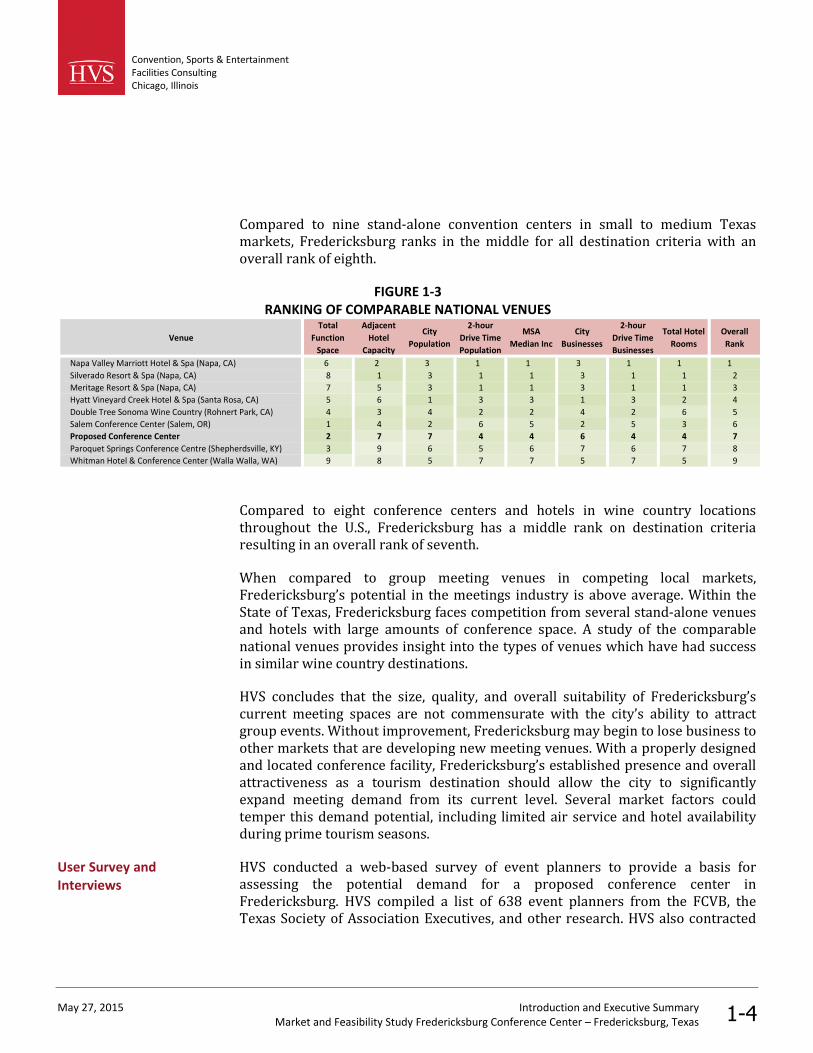
Compared to nine stand-alone convention centers in small to medium Texasmarkets, Fredericksburg ranks in the middle for all destination criteria with anoverall rank of eighth.
FIGURE 1-3RANKING OF COMPARABLE NATIONAL VENUES
Venue
Total
Function
Space
Adjacent
Hotel
Capacity
City
Population
2-hour
Drive Time
Population
MSA
Median Inc
City
Businesses
2-hour
Drive Time
Businesses
Total Hotel
Rooms
Overall
Rank
Napa Valley Marriott Hotel & Spa (Napa, CA) 6 2 3 1 1 3 1 1 1
Silverado Resort & Spa (Napa, CA) 8 1 3 1 1 3 1 1 2
Meritage Resort & Spa (Napa, CA) 7 5 3 1 1 3 1 1 3
Hyatt Vineyard Creek Hotel & Spa (Santa Rosa, CA) 5 6 1 3 3 1 3 2 4
Double Tree Sonoma Wine Country (Rohnert Park, CA) 4 3 4 2 2 4 2 6 5
Salem Conference Center (Salem, OR) 1 4 2 6 5 2 5 3 6
Proposed Conference Center 2 7 7 4 4 6 4 4 7
Paroquet Springs Conference Centre (Shepherdsville, KY) 3 9 6 5 6 7 6 7 8
Whitman Hotel & Conference Center (Walla Walla, WA) 9 8 5 7 7 5 7 5 9
Compared to eight conference centers and hotels in wine country locationsthroughout the U.S., Fredericksburg has a middle rank on destination criteriaresulting in an overall rank of seventh.
When compared to group meeting venues in competing local markets,Fredericksburg’s potential in the meetings industry is above average. Within theState of Texas, Fredericksburg faces competition from several stand-alone venuesand hotels with large amounts of conference space. A study of the comparablenational venues provides insight into the types of venues which have had successin similar wine country destinations.
HVS concludes that the size, quality, and overall suitability of Fredericksburg’scurrent meeting spaces are not commensurate with the city’s ability to attractgroup events. Without improvement, Fredericksburg may begin to lose business toother markets that are developing new meeting venues. With a properly designedand located conference facility, Fredericksburg’s established presence and overallattractiveness as a tourism destination should allow the city to significantlyexpand meeting demand from its current level. Several market factors couldtemper this demand potential, including limited air service and hotel availabilityduring prime tourism seasons.
HVS conducted a web-based survey of event planners to provide a basis forassessing the potential demand for a proposed conference center inFredericksburg. HVS compiled a list of 638 event planners from the FCVB, theTexas Society of Association Executives, and other research. HVS also contracted
User Survey andInterviews

Convention, Sports & EntertainmentFacilities ConsultingChicago, Illinois
May 27, 2015 Introduction and Executive SummaryMarket and Feasibility Study Fredericksburg Conference Center – Fredericksburg, Texas 1-5
with Plan Your Meetings to perform an email “blast” to roughly 4,000 Texas-basedcorporate and association meeting planners.
Survey responses included 121 completed surveys and 49 partial surveys in whichthe respondent left one or more questions blank. Approximately 98 percent ofrespondents represent organizations based in the State of Texas, primarilyincluding associations, corporations, and educational organizations. Key resultsinclude the following:
Based on historical bookings and event planner perceptions, the strongestcompetition for the proposed conference center in Fredericksburg would comefrom hotel properties in the surrounding metropolitan areas of Austin and SanAntonio and the Texas Hill Country destination of San Marcos.
For those planners who have booked an event in Fredericksburg, most havebeen satisfied with the location and cost of hotel rooms and meeting venues.Many are less satisfied with the quality of meeting venues and hotel rooms.Aspects related to the size of event spaces received the lowest rankings fromplanners.
The greatest deterrents to event planners considering Fredericksburg for anevent are its distance from major cities and airports and its lack of adequatevenues in which to place events. Specifically, planners identified the lack of fullservice hotel properties and meetings space which is too small and dated.
Of those planners who have not been able to book an event in Fredericksburg,70 percent note a lack of function space as the primary reason. Plannersindicate a lack of adequate meeting space most often.
Fredericksburg has several strengths as a group event destination, includingits quaint downtown, dining and retail amenities, and natural beauty. Otherplanners note the area’s wineries and the history and culture of the city asdesirable attributes.
Given a conference center which suits their needs, over 60 percent of theplanners feel that they would be “likely” or “somewhat likely” to book an eventat the proposed venue in Fredericksburg. This figure increases to 65 percentwhen planners were asked to consider a conference center hotel. Both of thesefigures compare favorably to the 30 percent of respondents who had bookedevents in Fredericksburg in the past.
Approximately 90 percent of events described by event planners could beaccommodated by a venue with banquet seating for 250 people, 10 meetingrooms, and around 5,000 square feet of exhibit space.
Convention, Sports & EntertainmentFacilities ConsultingChicago, Illinois
May 27, 2015 Introduction and Executive SummaryMarket and Feasibility Study Fredericksburg Conference Center – Fredericksburg, Texas 1-6
Approximately 90 percent of the events described by event planners require ahotel room block of less than 200 rooms, and 75 percent of events require aroom block of less than 100 rooms. The majority of event planners prefer tobook a room block in one full service hotel but would accept a block in up tofour properties.
While Fredericksburg enjoys a strong presence in the state tourism market, it doesnot currently have the facilities required to capture group meeting demand. HVSconcludes that the development of a Fredericksburg Conference Center (“FCC”)would place Fredericksburg in a position to significantly expand its currentpresence in the group meetings industry. The venue could also serve the customerbase currently using other smaller, older facilities in Fredericksburg, allowingmany events which face venue size restrictions to grow and remain inFredericksburg. The facility could also become a valuable amenity for local-basedevents and other needs. HVS program recommendations revolve around theprincipal that the venue must host simultaneous events with different venue needsand include the following elements.
A 12,000 square foot multipurpose ballroom with a flexible wall system toallow the space to divide into three sections that could serve as space forbanquets, light exhibition, and large assembly meeting space, and
A 5,500 square foot meeting room block with a variety of large and small,flexible meeting spaces,
Including the above spaces, HVS estimates that the gross floor area of theproposed FCC would be approximately 40,000 square feet. A more precisedetermination of the floor areas would require a concept plan created by a designfirm that illustrates how the proposed convention center would fit on the selectedsite. The process of concept planning would likely require adjustments to therecommended floor areas.
The FCVB reports that Fredericksburg has lost several opportunities for groupbusiness due to its lack of appropriate meeting space. This lost business is oftenassociation or corporate business which typically requires event space thatcontains separate banquet and breakout meeting spaces in a single facility. Thissituation is corroborated by the HVS user survey in which nearly 30 percent ofsurvey respondents reported that they have wanted to host an event inFredericksburg but were unable to book the event due to insufficient eventinfrastructure. Of those planners, 70 percent cited insufficient event space as theprimary reason for not booking their event in Fredericksburg.
FacilityRecommendations
Demand Projections
Convention, Sports & EntertainmentFacilities ConsultingChicago, Illinois
May 27, 2015 Introduction and Executive SummaryMarket and Feasibility Study Fredericksburg Conference Center – Fredericksburg, Texas 1-7
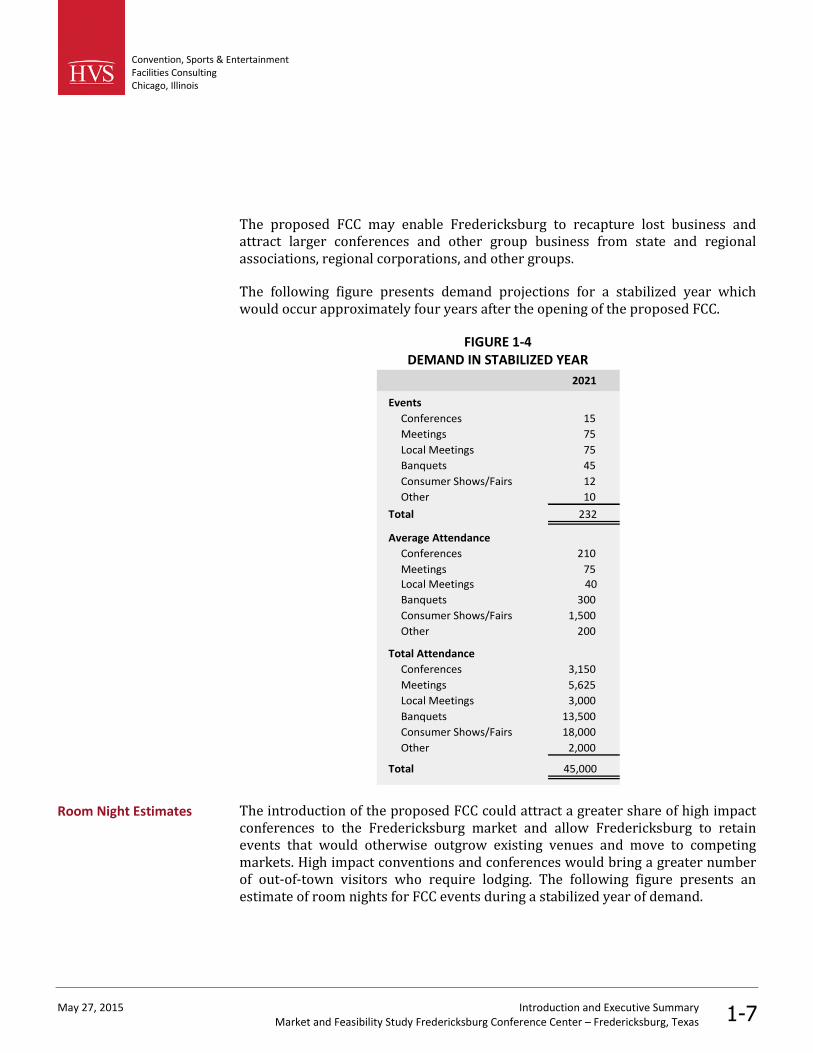
The proposed FCC may enable Fredericksburg to recapture lost business andattract larger conferences and other group business from state and regionalassociations, regional corporations, and other groups.
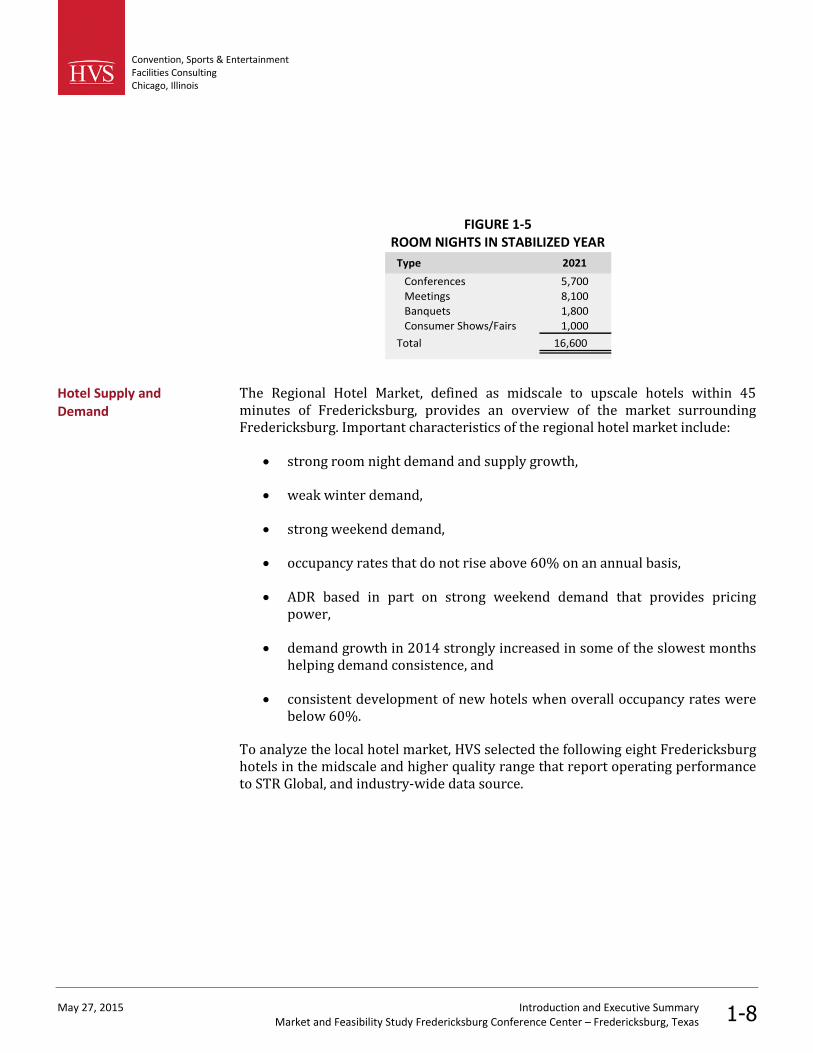
The following figure presents demand projections for a stabilized year whichwould occur approximately four years after the opening of the proposed FCC.
FIGURE 1-4DEMAND IN STABILIZED YEAR
2021
Events
Conferences 15
Meetings 75
Local Meetings 75
Banquets 45
Consumer Shows/Fairs 12
Other 10
Total 232
Average Attendance
Conferences 210
Meetings 75
Local Meetings 40
Banquets 300
Consumer Shows/Fairs 1,500
Other 200
Total Attendance
Conferences 3,150
Meetings 5,625
Local Meetings 3,000
Banquets 13,500
Consumer Shows/Fairs 18,000
Other 2,000
Total 45,000
The introduction of the proposed FCC could attract a greater share of high impactconferences to the Fredericksburg market and allow Fredericksburg to retainevents that would otherwise outgrow existing venues and move to competingmarkets. High impact conventions and conferences would bring a greater numberof out-of-town visitors who require lodging. The following figure presents anestimate of room nights for FCC events during a stabilized year of demand.
Room Night Estimates
Convention, Sports & EntertainmentFacilities ConsultingChicago, Illinois
May 27, 2015 Introduction and Executive SummaryMarket and Feasibility Study Fredericksburg Conference Center – Fredericksburg, Texas 1-8
FIGURE 1-5ROOM NIGHTS IN STABILIZED YEAR
Type 2021
Conferences 5,700
Meetings 8,100
Banquets 1,800
Consumer Shows/Fairs 1,000
Total 16,600
The Regional Hotel Market, defined as midscale to upscale hotels within 45minutes of Fredericksburg, provides an overview of the market surroundingFredericksburg. Important characteristics of the regional hotel market include:
strong room night demand and supply growth,
weak winter demand,
strong weekend demand,
occupancy rates that do not rise above 60% on an annual basis,
ADR based in part on strong weekend demand that provides pricingpower,
demand growth in 2014 strongly increased in some of the slowest monthshelping demand consistence, and
consistent development of new hotels when overall occupancy rates werebelow 60%.
To analyze the local hotel market, HVS selected the following eight Fredericksburghotels in the midscale and higher quality range that report operating performanceto STR Global, and industry-wide data source.
Hotel Supply andDemand

Convention, Sports & EntertainmentFacilities ConsultingChicago, Illinois
May 27, 2015 Introduction and Executive SummaryMarket and Feasibility Study Fredericksburg Conference Center – Fredericksburg, Texas 1-9
FIGURE 1-6SELECTED PROPERTIES IN THE LOCAL HOTEL MARKKET
Name of Establishment Class Aff Date Open Date Rooms
Windcrest Inn & Suites Midscale Class Feb 2004 Sep 1983 46
Fredericksburg Inn & Suites Upscale Class Jun 1996 Jun 1996 103
Best Western Plus Fredericksburg Upper Midscale Class Jun 2011 Mar 2002 56
Comfort Inn & Suites Fredericksburg Upper Midscale Class May 2004 May 2004 57
La Quinta Inns & Suites Fredericksburg Midscale Class Nov 2004 Nov 2004 55
Inn On Baron`s Creek Upper Upscale Class Mar 2005 Mar 2005 90
Hampton Inn Suites Fredericksburg Upper Midscale Class May 2007 May 2007 55
Holiday Inn Express & Suites Fredericksburg Upper Midscale Class Jun 2012 Jun 2012 76
Total Properties: 8 538
The regional hotel market and the local hotel market share similar overall monthlyvariation, with winter lows and spring and summer highs. The local hotel markethas a higher overall occupancy and average daily room rate (ADR) resulting in asignificantly higher revenue per available room (RevPAR) premium over theregional hotel market. Both the regional hotel market and the local hotel marketshow significantly stronger occupancy rates on the weekends due to leisure guestsfrom Austin and San Antonio. The local hotel market shows a day-of-weekoccupancy premium over the regional hotel market which is at its greatest on theweekends. The occupancy and ADR premium for the local hotel market over theregional hotel market provides support for the development of additional hotelrooms. The high weekend occupancy rates permit both the regional and local hotelmarkets to charge a significantly higher weekend ADR.
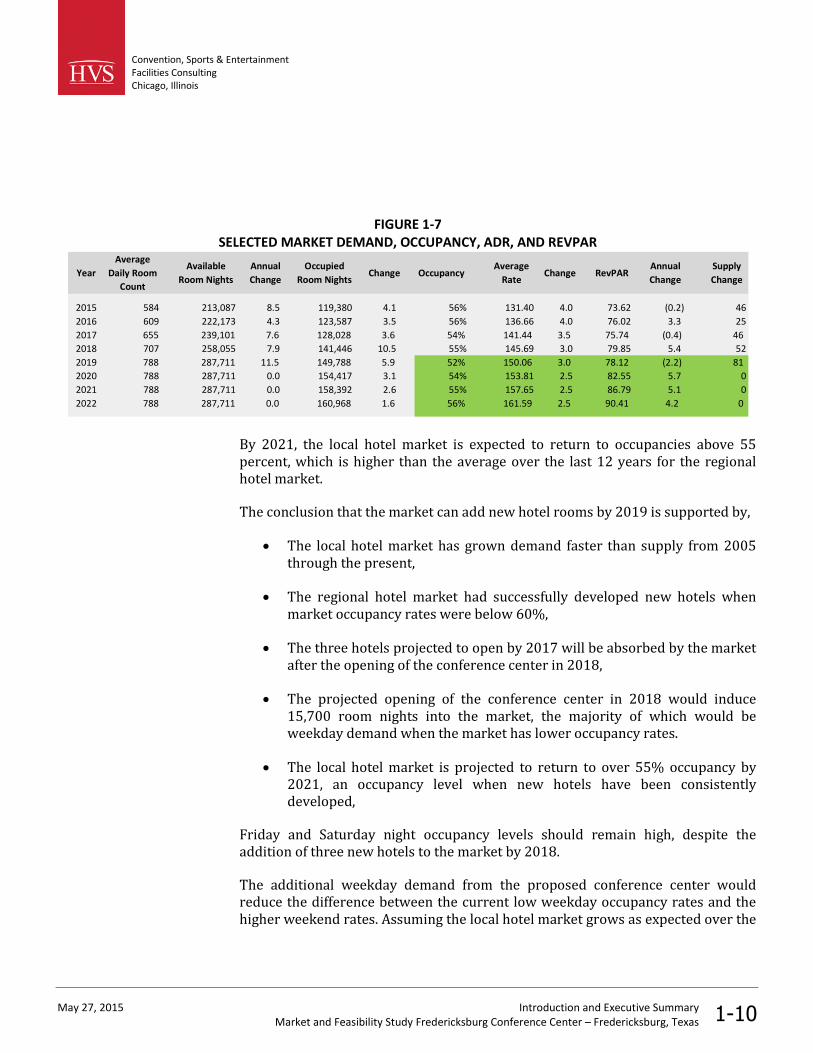
While occupancies and room rates currently support new hotel development,anticipated new supply will negatively affect market occupancy rates, albeittemporary. Additional hotel development will have to wait until room nightdemand absorbs the new rooms supply. The green box in the following figureshows the possible future opportunity for additional new hotel rooms to enter theFredericksburg market.
Convention, Sports & EntertainmentFacilities ConsultingChicago, Illinois
May 27, 2015 Introduction and Executive SummaryMarket and Feasibility Study Fredericksburg Conference Center – Fredericksburg, Texas 1-10
FIGURE 1-7SELECTED MARKET DEMAND, OCCUPANCY, ADR, AND REVPAR
Year
Average
Daily Room
Count
Available
Room Nights
Annual
Change
Occupied
Room NightsChange Occupancy
Average
RateChange RevPAR
Annual
Change
Supply
Change
2015 584 213,087 8.5 119,380 4.1 56% 131.40 4.0 73.62 (0.2) 46
2016 609 222,173 4.3 123,587 3.5 56% 136.66 4.0 76.02 3.3 25
2017 655 239,101 7.6 128,028 3.6 54% 141.44 3.5 75.74 (0.4) 46
2018 707 258,055 7.9 141,446 10.5 55% 145.69 3.0 79.85 5.4 52
2019 788 287,711 11.5 149,788 5.9 52% 150.06 3.0 78.12 (2.2) 81
2020 788 287,711 0.0 154,417 3.1 54% 153.81 2.5 82.55 5.7 0
2021 788 287,711 0.0 158,392 2.6 55% 157.65 2.5 86.79 5.1 0
2022 788 287,711 0.0 160,968 1.6 56% 161.59 2.5 90.41 4.2 0
By 2021, the local hotel market is expected to return to occupancies above 55percent, which is higher than the average over the last 12 years for the regionalhotel market.
The conclusion that the market can add new hotel rooms by 2019 is supported by,
The local hotel market has grown demand faster than supply from 2005through the present,
The regional hotel market had successfully developed new hotels whenmarket occupancy rates were below 60%,
The three hotels projected to open by 2017 will be absorbed by the marketafter the opening of the conference center in 2018,
The projected opening of the conference center in 2018 would induce15,700 room nights into the market, the majority of which would beweekday demand when the market has lower occupancy rates.
The local hotel market is projected to return to over 55% occupancy by2021, an occupancy level when new hotels have been consistentlydeveloped,
Friday and Saturday night occupancy levels should remain high, despite theaddition of three new hotels to the market by 2018.
The additional weekday demand from the proposed conference center wouldreduce the difference between the current low weekday occupancy rates and thehigher weekend rates. Assuming the local hotel market grows as expected over the
Convention, Sports & EntertainmentFacilities ConsultingChicago, Illinois
May 27, 2015 Introduction and Executive SummaryMarket and Feasibility Study Fredericksburg Conference Center – Fredericksburg, Texas 1-11
coming years, the market could absorb new hotel rooms within a year of theopening of the proposed conference center in 2018.
The suitability of a site for the development of a conference center is an importantconsideration affecting the economic viability of a facility and its ultimatemarketability. Factors such as size, accessibility, visibility, and the proximity otheramenities have a direct impact on the suitability of a particular site. Therelationship between a conference venue and other nearby existing or plannedland uses can also play an important role in selecting a site. Other factor, such asthe cost of obtaining the site, infrastructure needs, and costs of improving a siteshould also be considered.
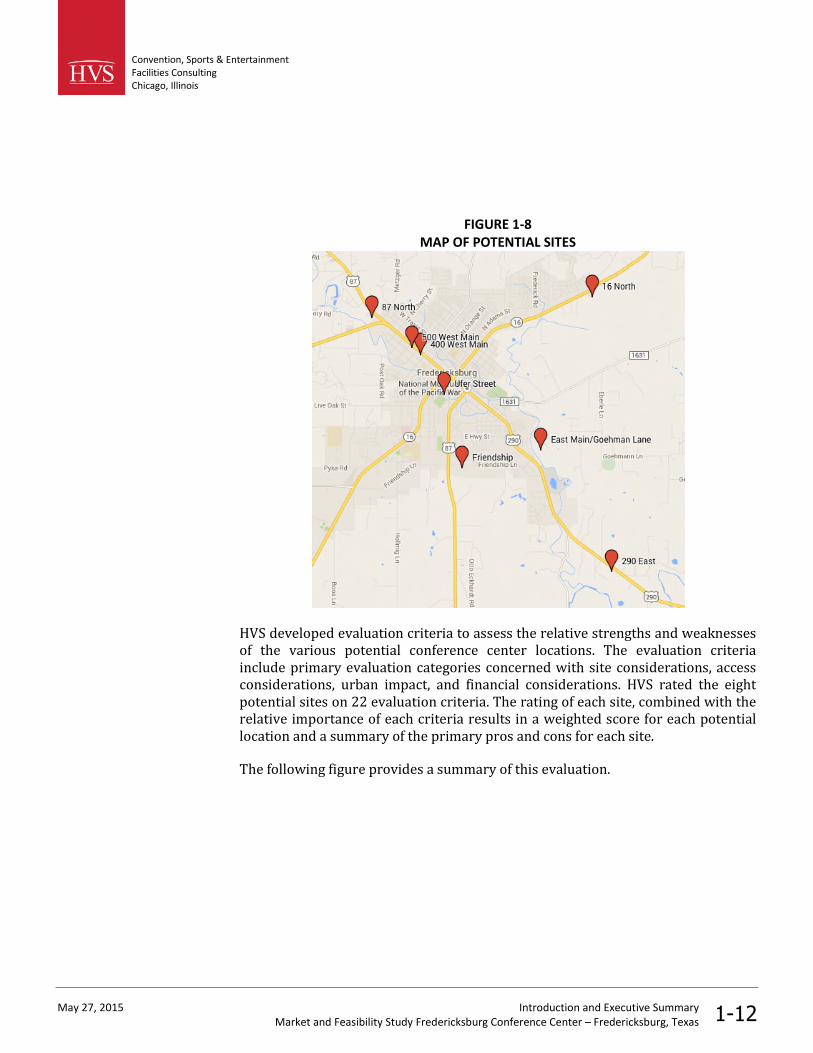
HVS compared the suitability of eight potential locations within Fredericksburgand its surrounding county. These sites include undeveloped land and vacant,existing structures which would require renovation or demolition. Some sites arecurrently owned by private developers and slated for future hotel and otherdevelopment. Other sites would require acquisition by the city or otherdevelopment group. The following figure provides a map of the locations of theseven sites in relation to Fredericksburg
Site Selection Analysis
Convention, Sports & EntertainmentFacilities ConsultingChicago, Illinois
May 27, 2015 Introduction and Executive SummaryMarket and Feasibility Study Fredericksburg Conference Center – Fredericksburg, Texas 1-12
FIGURE 1-8MAP OF POTENTIAL SITES
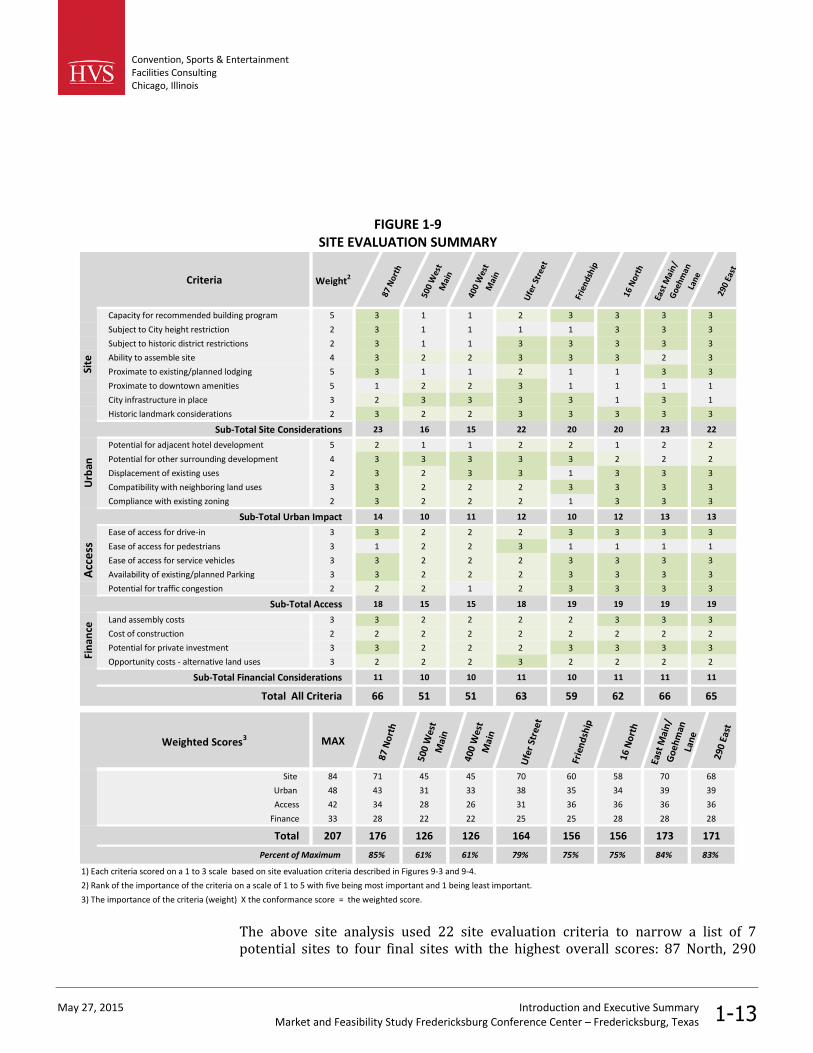
HVS developed evaluation criteria to assess the relative strengths and weaknessesof the various potential conference center locations. The evaluation criteriainclude primary evaluation categories concerned with site considerations, accessconsiderations, urban impact, and financial considerations. HVS rated the eightpotential sites on 22 evaluation criteria. The rating of each site, combined with therelative importance of each criteria results in a weighted score for each potentiallocation and a summary of the primary pros and cons for each site.
The following figure provides a summary of this evaluation.
Convention, Sports & EntertainmentFacilities ConsultingChicago, Illinois
May 27, 2015 Introduction and Executive SummaryMarket and Feasibility Study Fredericksburg Conference Center – Fredericksburg, Texas 1-13
FIGURE 1-9SITE EVALUATION SUMMARY
Criteria Weight2
87N
orth
500
Wes
tM
ain
400
Wes
tM
ain
Ufe
rSt
reet
Frie
ndsh
ip
16N
orth
East
Mai
n/G
oehm
anLa
ne
290
East
Capacity for recommended building program 5 3 1 1 2 3 3 3 3
Subject to City height restriction 2 3 1 1 1 1 3 3 3
Subject to historic district restrictions 2 3 1 1 3 3 3 3 3
Ability to assemble site 4 3 2 2 3 3 3 2 3
Proximate to existing/planned lodging 5 3 1 1 2 1 1 3 3
Proximate to downtown amenities 5 1 2 2 3 1 1 1 1
City infrastructure in place 3 2 3 3 3 3 1 3 1
Historic landmark considerations 2 3 2 2 3 3 3 3 3
Sub-Total Site Considerations 23 16 15 22 20 20 23 22
Potential for adjacent hotel development 5 2 1 1 2 2 1 2 2
Potential for other surrounding development 4 3 3 3 3 3 2 2 2
Displacement of existing uses 2 3 2 3 3 1 3 3 3
Compatibility with neighboring land uses 3 3 2 2 2 3 3 3 3
Compliance with existing zoning 2 3 2 2 2 1 3 3 3
Sub-Total Urban Impact 14 10 11 12 10 12 13 13
Ease of access for drive-in 3 3 2 2 2 3 3 3 3
Ease of access for pedestrians 3 1 2 2 3 1 1 1 1
Ease of access for service vehicles 3 3 2 2 2 3 3 3 3
Availability of existing/planned Parking 3 3 2 2 2 3 3 3 3
Potential for traffic congestion 2 2 2 1 2 3 3 3 3
Sub-Total Access 18 15 15 18 19 19 19 19
Land assembly costs 3 3 2 2 2 2 3 3 3
Cost of construction 2 2 2 2 2 2 2 2 2
Potential for private investment 3 3 2 2 2 3 3 3 3
Opportunity costs - alternative land uses 3 2 2 2 3 2 2 2 2
Sub-Total Financial Considerations 11 10 10 11 10 11 11 11
Total All Criteria 66 51 51 63 59 62 66 65
Site
Urb
anA
cce
ssFi
nan
ce
Weighted Scores3 MAX
87N
ort
h
500
Wes
tM
ain
400
Wes
tM
ain
Ufe
rSt
reet
Frie
nd
ship
16N
ort
h
East
Mai
n/
Go
ehm
anLa
ne
290
East
Site 84 71 45 45 70 60 58 70 68
Urban 48 43 31 33 38 35 34 39 39
Access 42 34 28 26 31 36 36 36 36
Finance 33 28 22 22 25 25 28 28 28
Total 207 176 126 126 164 156 156 173 171
Percent of Maximum 85% 61% 61% 79% 75% 75% 84% 83%
1) Each criteria scored on a 1 to 3 scale based on site evaluation criteria described in Figures 9-3 and 9-4.
2) Rank of the importance of the criteria on a scale of 1 to 5 with five being most important and 1 being least important.
3) The importance of the criteria (weight) X the conformance score = the weighted score.
The above site analysis used 22 site evaluation criteria to narrow a list of 7potential sites to four final sites with the highest overall scores: 87 North, 290

Convention, Sports & EntertainmentFacilities ConsultingChicago, Illinois
May 27, 2015 Introduction and Executive SummaryMarket and Feasibility Study Fredericksburg Conference Center – Fredericksburg, Texas 1-14
East. East Main/Goehman Lane, and Ufer Street. While none of the remaining sitespossess a fatal flaw that would preclude them from consideration, they are not aswell suited for the recommended conference center program.
HVS recommends further investigation into the four highest scoring sites,including the following.
Preparation of concept plans and preliminary cost estimate for the proposedconference center by a design firm,
Initial discussions with land owners of the 87 North, 290 East, and East MainGoehman Lane sites to understand ability to incorporate conference centerprogram into current conceptual plans and the timing of anticipateddevelopments, and
Revaluation of the initial plans for Texas Center for Wine and Culinary Arts onthe Ufer Street site to assess ability to incorporate conference center programinto the current plans or as an alternate use of the site.
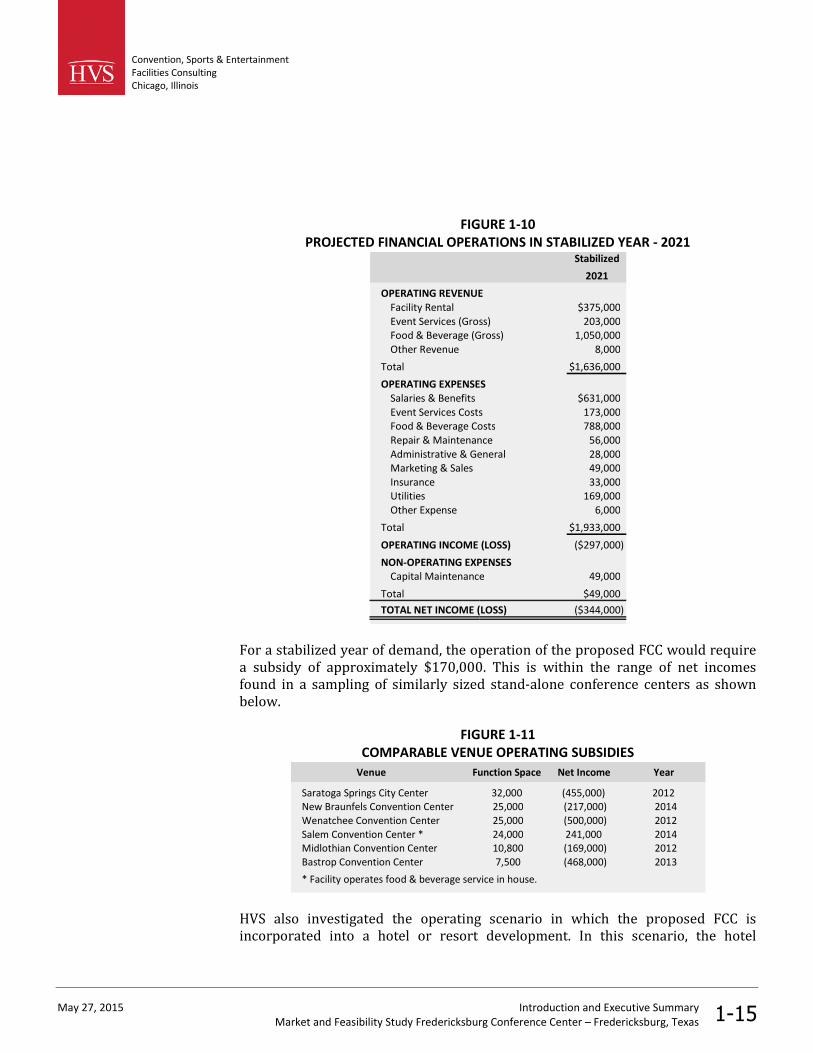
HVS applied a series of revenue and expense assumptions regarding the facilityutilization and operations to develop a comprehensive operating financialstatement for the proposed FCC. The figure below presents the stabilized year ofoperating projections for the proposed FCC, including the multi-purpose banquethall and meeting spaces. All revenues and expenses are for a stabilized year ofdemand in inflated dollars.
Financial Analysis
Convention, Sports & EntertainmentFacilities ConsultingChicago, Illinois
May 27, 2015 Introduction and Executive SummaryMarket and Feasibility Study Fredericksburg Conference Center – Fredericksburg, Texas 1-15
FIGURE 1-10PROJECTED FINANCIAL OPERATIONS IN STABILIZED YEAR - 2021
Stabilized
2021
OPERATING REVENUEFacility Rental $375,000Event Services (Gross) 203,000Food & Beverage (Gross) 1,050,000Other Revenue 8,000
Total $1,636,000
OPERATING EXPENSESSalaries & Benefits $631,000Event Services Costs 173,000Food & Beverage Costs 788,000Repair & Maintenance 56,000Administrative & General 28,000Marketing & Sales 49,000Insurance 33,000Utilities 169,000Other Expense 6,000
Total $1,933,000
OPERATING INCOME (LOSS) ($297,000)
NON-OPERATING EXPENSESCapital Maintenance 49,000
Total $49,000
TOTAL NET INCOME (LOSS) ($344,000)
For a stabilized year of demand, the operation of the proposed FCC would requirea subsidy of approximately $170,000. This is within the range of net incomesfound in a sampling of similarly sized stand-alone conference centers as shownbelow.
FIGURE 1-11COMPARABLE VENUE OPERATING SUBSIDIES
Venue Function Space Net Income Year
Saratoga Springs City Center 32,000 (455,000) 2012New Braunfels Convention Center 25,000 (217,000) 2014Wenatchee Convention Center 25,000 (500,000) 2012Salem Convention Center * 24,000 241,000 2014Midlothian Convention Center 10,800 (169,000) 2012Bastrop Convention Center 7,500 (468,000) 2013
* Facility operates food & beverage service in house.
HVS also investigated the operating scenario in which the proposed FCC isincorporated into a hotel or resort development. In this scenario, the hotel

Convention, Sports & EntertainmentFacilities ConsultingChicago, Illinois
May 27, 2015 Introduction and Executive SummaryMarket and Feasibility Study Fredericksburg Conference Center – Fredericksburg, Texas 1-16
operator would also be responsible for the marketing and operation of theconference center, and the conference center would be a department of the hotel.As a department of a larger hotel operation, operating expenses associated withsome administrative and marketing activities, including some staff salaries, wouldbe captured in other departmental budgets. HVS reevaluated the FCC operatingexpenses as departmental expenses to yield a departmental income for the FCC.
FIGURE 1-12PROJECTED DEPARTMENTAL INCOME IN STABILIZED YEAR-2021
Stabilized
2021
DEPARTMENTAL REVENUEFacility Rental $375,000Event Services (Gross) 203,000Food & Beverage (Gross) 1,050,000Other Revenue 8,000
Total $1,636,000
DEPARTMENTAL EXPENSES
Event Services Costs $173,000Food & Beverage Costs 630,000Repair & Maintenance 65,000Administrative & General 173,000Marketing & Sales 110,000Utilities 95,000
Total $1,246,000
TOTAL DEPARTMENTAL INCOME (LOSS) $389,000
HVS identified the new direct spending that would occur in the local economy dueto the operations of the proposed FCC. HVS used the IMPLAN input-output modelto estimate indirect and induced impacts as well as jobs created on the directspending. HVS investigated the incremental impacts on the City of Fredericksburgand Gillespie County.
HVS direct spending estimates include only new spending that originates fromoutside the market area defined above. Spending by attendees who live within themarket area is a transfer of income from one sector of the area’s economy toanother; therefore, this analysis does not count spending by local residents as anew economic impact. HVS further removes attendee spending from groups whichwould transfer business to FCC from another venue in a market area.
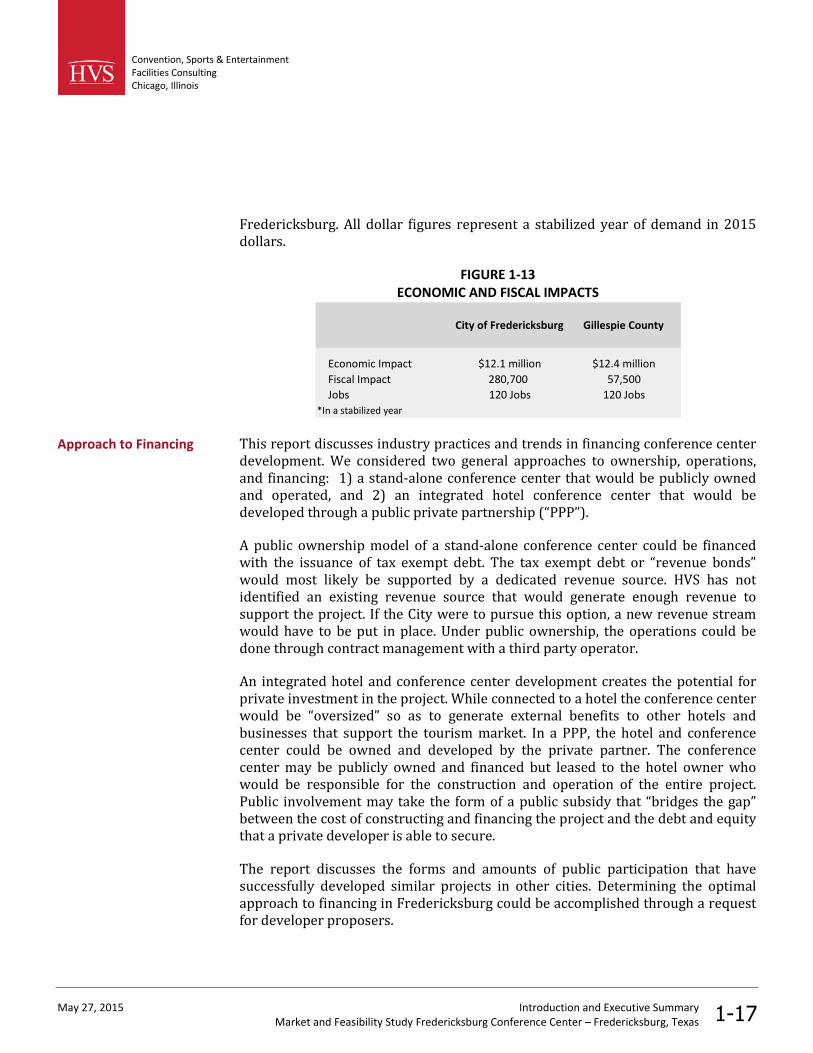
The following figure summarizes the results of this analysis for the new,incremental spending projected in the market area. The figure also contains thecorresponding fiscal or tax revenue impacts of this spending in the City of
Economic and FiscalImpacts
Convention, Sports & EntertainmentFacilities ConsultingChicago, Illinois
May 27, 2015 Introduction and Executive SummaryMarket and Feasibility Study Fredericksburg Conference Center – Fredericksburg, Texas 1-17
Fredericksburg. All dollar figures represent a stabilized year of demand in 2015dollars.
FIGURE 1-13ECONOMIC AND FISCAL IMPACTS
City of Fredericksburg Gillespie County
Economic Impact $12.1 million $12.4 million
Fiscal Impact 280,700 57,500
Jobs 120 Jobs 120 Jobs
*In a stabilized year
This report discusses industry practices and trends in financing conference centerdevelopment. We considered two general approaches to ownership, operations,and financing: 1) a stand-alone conference center that would be publicly ownedand operated, and 2) an integrated hotel conference center that would bedeveloped through a public private partnership (“PPP”).
A public ownership model of a stand-alone conference center could be financedwith the issuance of tax exempt debt. The tax exempt debt or “revenue bonds”would most likely be supported by a dedicated revenue source. HVS has notidentified an existing revenue source that would generate enough revenue tosupport the project. If the City were to pursue this option, a new revenue streamwould have to be put in place. Under public ownership, the operations could bedone through contract management with a third party operator.
An integrated hotel and conference center development creates the potential forprivate investment in the project. While connected to a hotel the conference centerwould be “oversized” so as to generate external benefits to other hotels andbusinesses that support the tourism market. In a PPP, the hotel and conferencecenter could be owned and developed by the private partner. The conferencecenter may be publicly owned and financed but leased to the hotel owner whowould be responsible for the construction and operation of the entire project.Public involvement may take the form of a public subsidy that “bridges the gap”between the cost of constructing and financing the project and the debt and equitythat a private developer is able to secure.
The report discusses the forms and amounts of public participation that havesuccessfully developed similar projects in other cities. Determining the optimalapproach to financing in Fredericksburg could be accomplished through a requestfor developer proposers.
Approach to Financing
Convention, Sports & EntertainmentFacilities ConsultingChicago, Illinois
May 27, 2015 Market Area OverviewMarket and Feasibility Study Fredericksburg Conference Center – Fredericksburg, Texas 2-1
2. Market Area Overview
This market area analysis reviews economic and demographic data that describethe overall condition of the local economy in Fredericksburg, Texas. Thecharacteristics of the area economy and trends that indicate growth or declineprovide indicators of the performance of the Fredericksburg market in themeetings and convention industry. HVS analyzed the following indicators:population, income, retail sales, work force characteristics, employment levels,major businesses, transportation, event infrastructure, hotel supply, and tourismattractions.
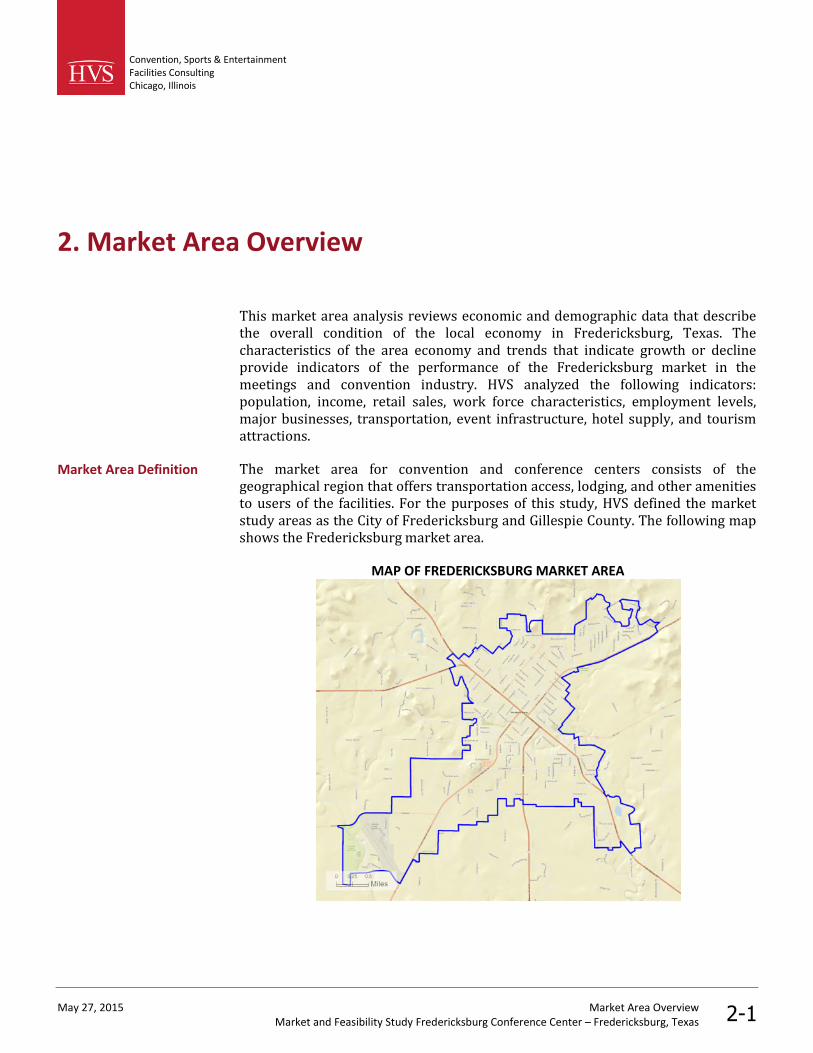
The market area for convention and conference centers consists of thegeographical region that offers transportation access, lodging, and other amenitiesto users of the facilities. For the purposes of this study, HVS defined the marketstudy areas as the City of Fredericksburg and Gillespie County. The following mapshows the Fredericksburg market area.
MAP OF FREDERICKSBURG MARKET AREA
Market Area Definition
Convention, Sports & EntertainmentFacilities ConsultingChicago, Illinois
May 27, 2015 Market Area OverviewMarket and Feasibility Study Fredericksburg Conference Center – Fredericksburg, Texas 2-2
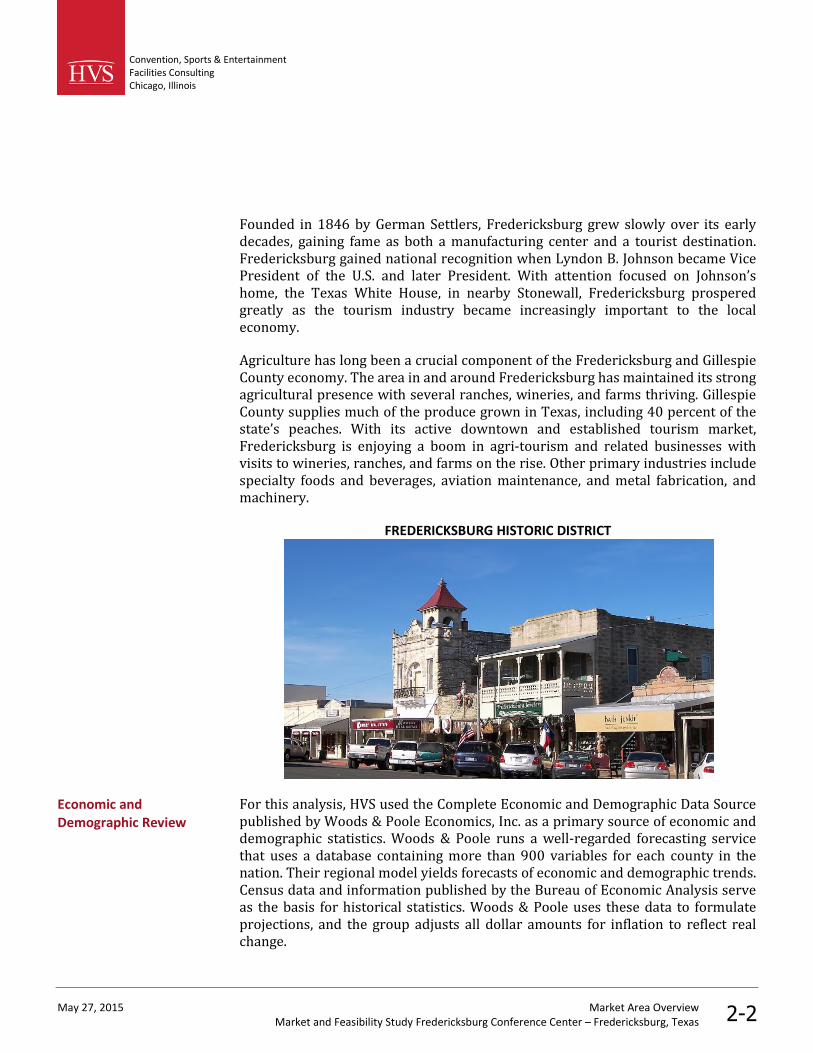
Founded in 1846 by German Settlers, Fredericksburg grew slowly over its earlydecades, gaining fame as both a manufacturing center and a tourist destination.Fredericksburg gained national recognition when Lyndon B. Johnson became VicePresident of the U.S. and later President. With attention focused on Johnson’shome, the Texas White House, in nearby Stonewall, Fredericksburg prosperedgreatly as the tourism industry became increasingly important to the localeconomy.
Agriculture has long been a crucial component of the Fredericksburg and GillespieCounty economy. The area in and around Fredericksburg has maintained its strongagricultural presence with several ranches, wineries, and farms thriving. GillespieCounty supplies much of the produce grown in Texas, including 40 percent of thestate’s peaches. With its active downtown and established tourism market,Fredericksburg is enjoying a boom in agri-tourism and related businesses withvisits to wineries, ranches, and farms on the rise. Other primary industries includespecialty foods and beverages, aviation maintenance, and metal fabrication, andmachinery.
FREDERICKSBURG HISTORIC DISTRICT
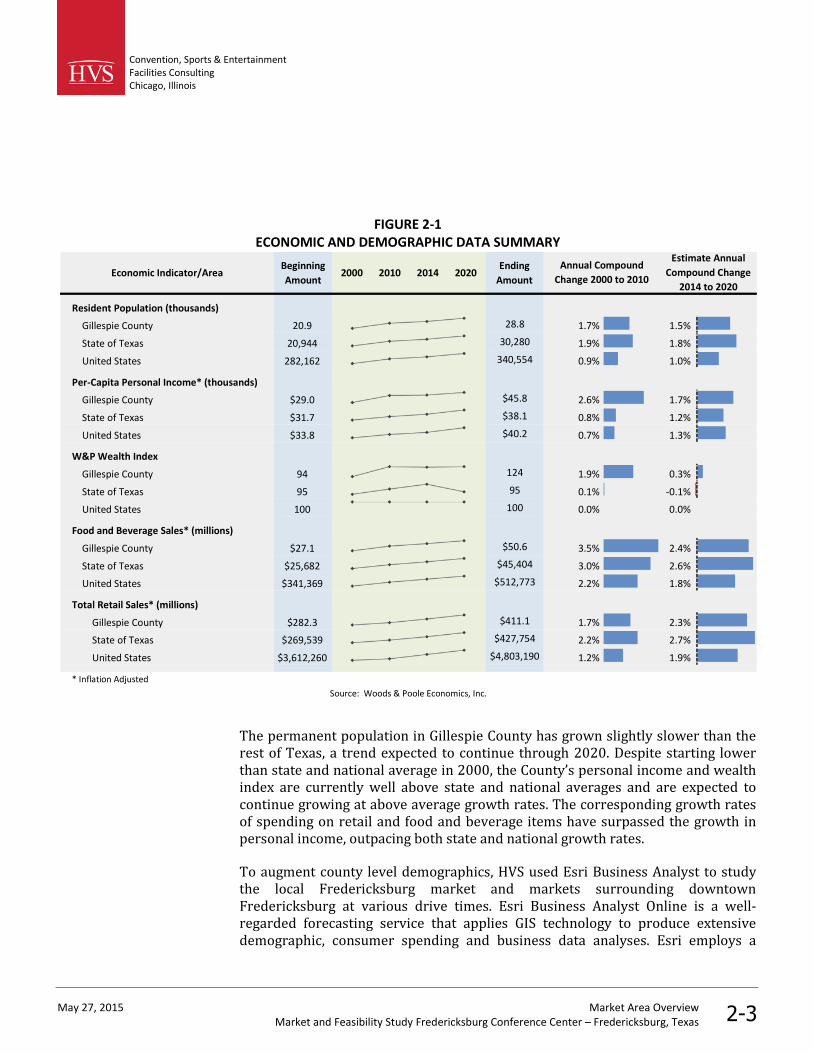
For this analysis, HVS used the Complete Economic and Demographic Data Sourcepublished by Woods & Poole Economics, Inc. as a primary source of economic anddemographic statistics. Woods & Poole runs a well-regarded forecasting servicethat uses a database containing more than 900 variables for each county in thenation. Their regional model yields forecasts of economic and demographic trends.Census data and information published by the Bureau of Economic Analysis serveas the basis for historical statistics. Woods & Poole uses these data to formulateprojections, and the group adjusts all dollar amounts for inflation to reflect realchange.
Economic andDemographic Review
Convention, Sports & EntertainmentFacilities ConsultingChicago, Illinois
May 27, 2015 Market Area OverviewMarket and Feasibility Study Fredericksburg Conference Center – Fredericksburg, Texas 2-3
FIGURE 2-1ECONOMIC AND DEMOGRAPHIC DATA SUMMARY
Economic Indicator/AreaBeginning
Amount2000 2010 2014 2020
Ending
Amount
Resident Population (thousands)
Gillespie County 20.9 28.8 1.7% 1.5%
State of Texas 20,944 30,280 1.9% 1.8%
United States 282,162 340,554 0.9% 1.0%
Per-Capita Personal Income* (thousands)
Gillespie County $29.0 $45.8 2.6% 1.7%
State of Texas $31.7 $38.1 0.8% 1.2%
United States $33.8 $40.2 0.7% 1.3%
W&P Wealth Index
Gillespie County 94 124 1.9% 0.3%
State of Texas 95 95 0.1% -0.1%
United States 100 100 0.0% 0.0%
Food and Beverage Sales* (millions)
Gillespie County $27.1 $50.6 3.5% 2.4%
State of Texas $25,682 $45,404 3.0% 2.6%
United States $341,369 $512,773 2.2% 1.8%
Total Retail Sales* (millions)
Gillespie County $282.3 $411.1 1.7% 2.3%
State of Texas $269,539 $427,754 2.2% 2.7%
United States $3,612,260 $4,803,190 1.2% 1.9%
* Inflation Adjusted
Source: Woods & Poole Economics, Inc.
Estimate Annual
Compound Change
2014 to 2020
Annual Compound
Change 2000 to 2010
The permanent population in Gillespie County has grown slightly slower than therest of Texas, a trend expected to continue through 2020. Despite starting lowerthan state and national average in 2000, the County’s personal income and wealthindex are currently well above state and national averages and are expected tocontinue growing at above average growth rates. The corresponding growth ratesof spending on retail and food and beverage items have surpassed the growth inpersonal income, outpacing both state and national growth rates.
To augment county level demographics, HVS used Esri Business Analyst to studythe local Fredericksburg market and markets surrounding downtownFredericksburg at various drive times. Esri Business Analyst Online is a well-regarded forecasting service that applies GIS technology to produce extensivedemographic, consumer spending and business data analyses. Esri employs a

Convention, Sports & EntertainmentFacilities ConsultingChicago, Illinois
May 27, 2015 Market Area OverviewMarket and Feasibility Study Fredericksburg Conference Center – Fredericksburg, Texas 2-4
sophisticated location-based model to forecast economic and demographic trends.Esri bases historical statistics on U.S. census data, the American CommunitySurvey, and other primary research. The following figure presents demographicdata for the City of Fredericksburg, Texas and drive markets within one, two, andthree hours of downtown Fredericksburg.
FIGURE 2-2LOCAL MARKET AND DRIVE TIME DEMOGRAPHICS
2014 2019
Annual
Growth
Rate
2014 2019
Annual
Growth
Rate
City of Fredericksburg 10,701 10,973 0.50% 50,641 57,331 2.51%
One-hour drive time 433,774 474,508 1.81% 61,009 75,642 4.39%
Two-hour drive time 4,500,204 4,963,789 1.98% 64,610 65,003 3.32%
Three-hour drive time 5,915,849 6,442,358 1.72% 51,930 60,850 2.55%
Source: ESRI
Market
Population Median Household Income ($)
The relatively small and stable resident population of Fredericksburg issurrounded by a large, growing, and more affluent population base. Largepopulation increases at the two and three-hour drive time markets indicateFredericksburg’s proximity to large population centers in Texas.
The characteristics of an area's workforce provide an indication of the type andamount of transient visitation local businesses would generate. Sectors such asfinance, insurance, and real estate (FIRE), wholesale trade, and services produce aconsiderable number of visitors who are not particularly rate sensitive. Thegovernment sector often generates transient room nights, but per-diemreimbursement allowances often limit the accommodations selection to budgetand mid-priced lodging facilities. Some employers of manufacturers, construction,transportation, communications, and public utilities (TCPU) contribute manyvisitors to the area.
The following table shows Gillespie County’s workforce distribution by businesssector for the ten largest sectors.
WorkforceCharacteristics
Convention, Sports & Entertainment
Facilities Consulting
Chicago, Illinois
May 27, 2015 Market Area Overview
Market and Feasibility Study Fredericksburg Conference Center – Fredericksburg, Texas 2-5
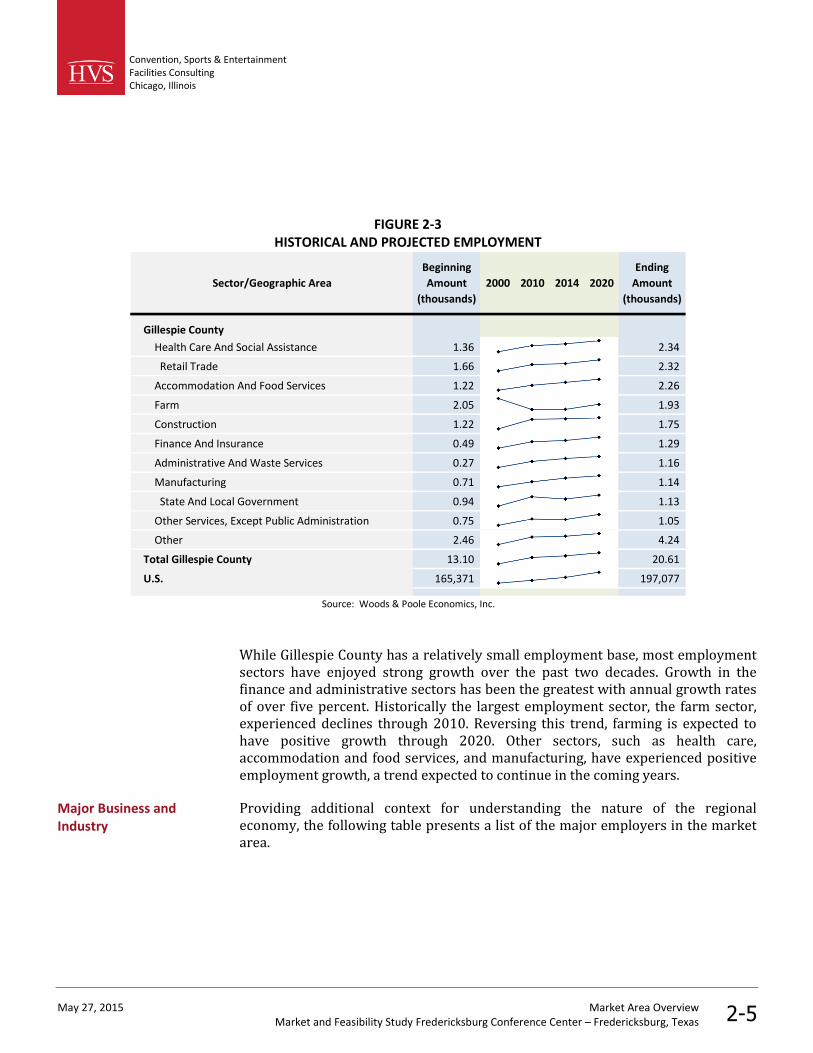
FIGURE 2-3
HISTORICAL AND PROJECTED EMPLOYMENT
Sector/Geographic Area
Beginning
Amount
(thousands)
2000 2010 2014 2020
Ending
Amount
(thousands)
Gillespie County
Health Care And Social Assistance 1.36 2.34
Retail Trade 1.66 2.32
Accommodation And Food Services 1.22 2.26
Farm 2.05 1.93
Construction 1.22 1.75
Finance And Insurance 0.49 1.29
Administrative And Waste Services 0.27 1.16
Manufacturing 0.71 1.14
State And Local Government 0.94 1.13
Other Services, Except Public Administration 0.75 1.05
Other 2.46 4.24
Total Gillespie County 13.10 20.61
U.S. 165,371 197,077
Source: Woods & Poole Economics, Inc.
While Gillespie County has a relatively small employment base, most employment
sectors have enjoyed strong growth over the past two decades. Growth in the
finance and administrative sectors has been the greatest with annual growth rates
of over five percent. Historically the largest employment sector, the farm sector,
experienced declines through 2010. Reversing this trend, farming is expected to
have positive growth through 2020. Other sectors, such as health care,
accommodation and food services, and manufacturing, have experienced positive
employment growth, a trend expected to continue in the coming years.
Providing additional context for understanding the nature of the regional
economy, the following table presents a list of the major employers in the market
area.
Major Business and
Industry
Convention, Sports & EntertainmentFacilities ConsultingChicago, Illinois
May 27, 2015 Market Area OverviewMarket and Feasibility Study Fredericksburg Conference Center – Fredericksburg, Texas 2-6
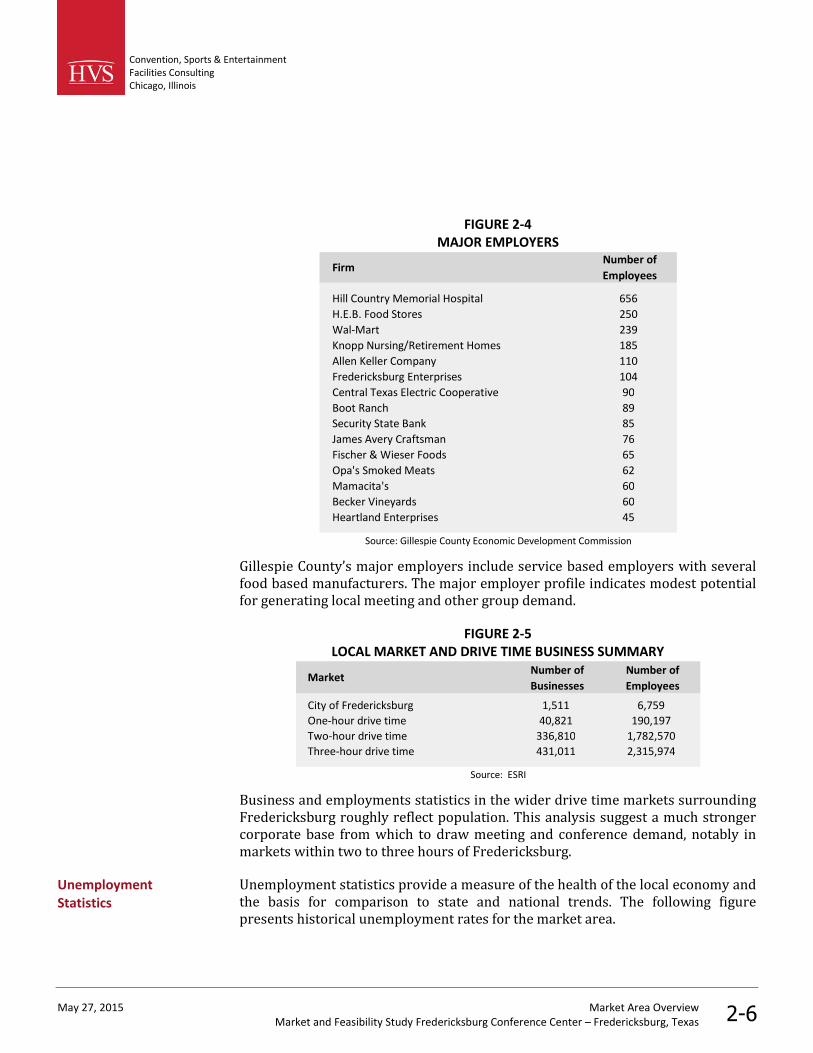
FIGURE 2-4MAJOR EMPLOYERS
FirmNumber of
Employees
Hill Country Memorial Hospital 656
H.E.B. Food Stores 250
Wal-Mart 239
Knopp Nursing/Retirement Homes 185
Allen Keller Company 110
Fredericksburg Enterprises 104
Central Texas Electric Cooperative 90
Boot Ranch 89
Security State Bank 85
James Avery Craftsman 76
Fischer & Wieser Foods 65
Opa's Smoked Meats 62
Mamacita's 60
Becker Vineyards 60
Heartland Enterprises 45
Source: Gillespie County Economic Development Commission
Gillespie County’s major employers include service based employers with severalfood based manufacturers. The major employer profile indicates modest potentialfor generating local meeting and other group demand.
FIGURE 2-5LOCAL MARKET AND DRIVE TIME BUSINESS SUMMARY
MarketNumber of
Businesses
Number of
Employees
City of Fredericksburg 1,511 6,759
One-hour drive time 40,821 190,197
Two-hour drive time 336,810 1,782,570
Three-hour drive time 431,011 2,315,974
Source: ESRI
Business and employments statistics in the wider drive time markets surroundingFredericksburg roughly reflect population. This analysis suggest a much strongercorporate base from which to draw meeting and conference demand, notably inmarkets within two to three hours of Fredericksburg.
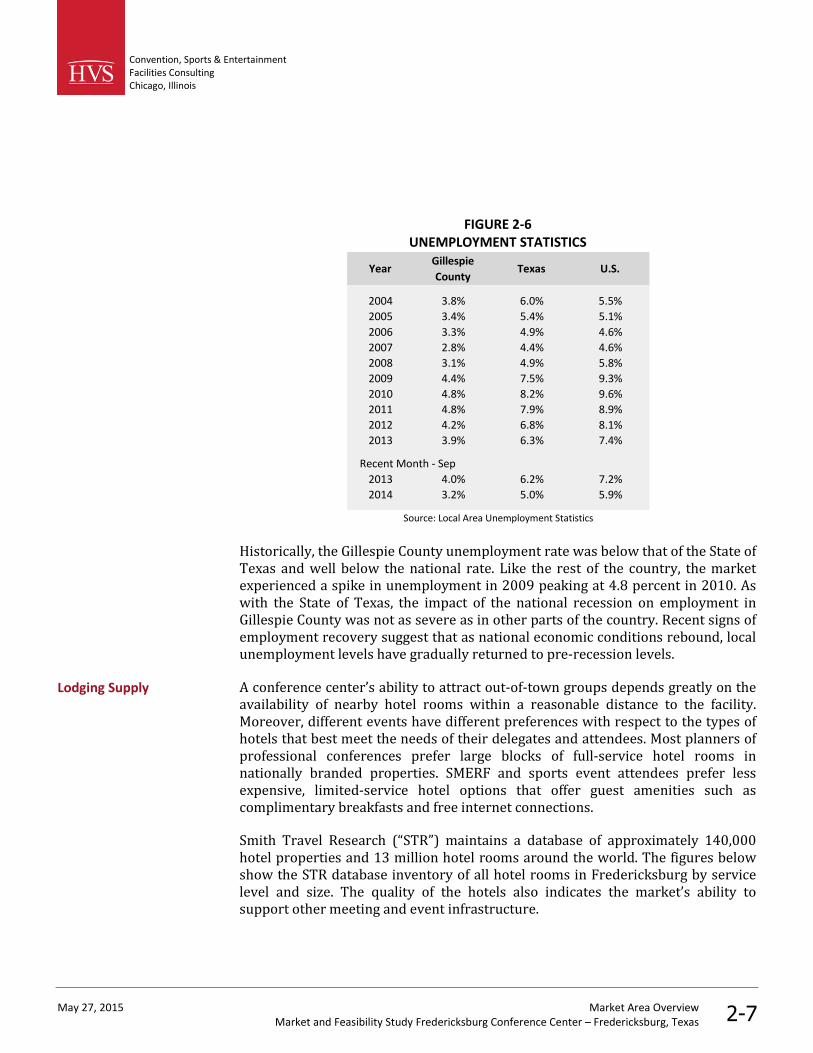
Unemployment statistics provide a measure of the health of the local economy andthe basis for comparison to state and national trends. The following figurepresents historical unemployment rates for the market area.
UnemploymentStatistics
Convention, Sports & EntertainmentFacilities ConsultingChicago, Illinois
May 27, 2015 Market Area OverviewMarket and Feasibility Study Fredericksburg Conference Center – Fredericksburg, Texas 2-7
FIGURE 2-6UNEMPLOYMENT STATISTICS
YearGillespie
CountyTexas U.S.
2004 3.8% 6.0% 5.5%
2005 3.4% 5.4% 5.1%
2006 3.3% 4.9% 4.6%
2007 2.8% 4.4% 4.6%
2008 3.1% 4.9% 5.8%
2009 4.4% 7.5% 9.3%
2010 4.8% 8.2% 9.6%
2011 4.8% 7.9% 8.9%
2012 4.2% 6.8% 8.1%
2013 3.9% 6.3% 7.4%
Recent Month - Sep
2013 4.0% 6.2% 7.2%
2014 3.2% 5.0% 5.9%
Source: Local Area Unemployment Statistics
Historically, the Gillespie County unemployment rate was below that of the State ofTexas and well below the national rate. Like the rest of the country, the marketexperienced a spike in unemployment in 2009 peaking at 4.8 percent in 2010. Aswith the State of Texas, the impact of the national recession on employment inGillespie County was not as severe as in other parts of the country. Recent signs ofemployment recovery suggest that as national economic conditions rebound, localunemployment levels have gradually returned to pre-recession levels.
A conference center’s ability to attract out-of-town groups depends greatly on theavailability of nearby hotel rooms within a reasonable distance to the facility.Moreover, different events have different preferences with respect to the types ofhotels that best meet the needs of their delegates and attendees. Most planners ofprofessional conferences prefer large blocks of full-service hotel rooms innationally branded properties. SMERF and sports event attendees prefer lessexpensive, limited-service hotel options that offer guest amenities such ascomplimentary breakfasts and free internet connections.
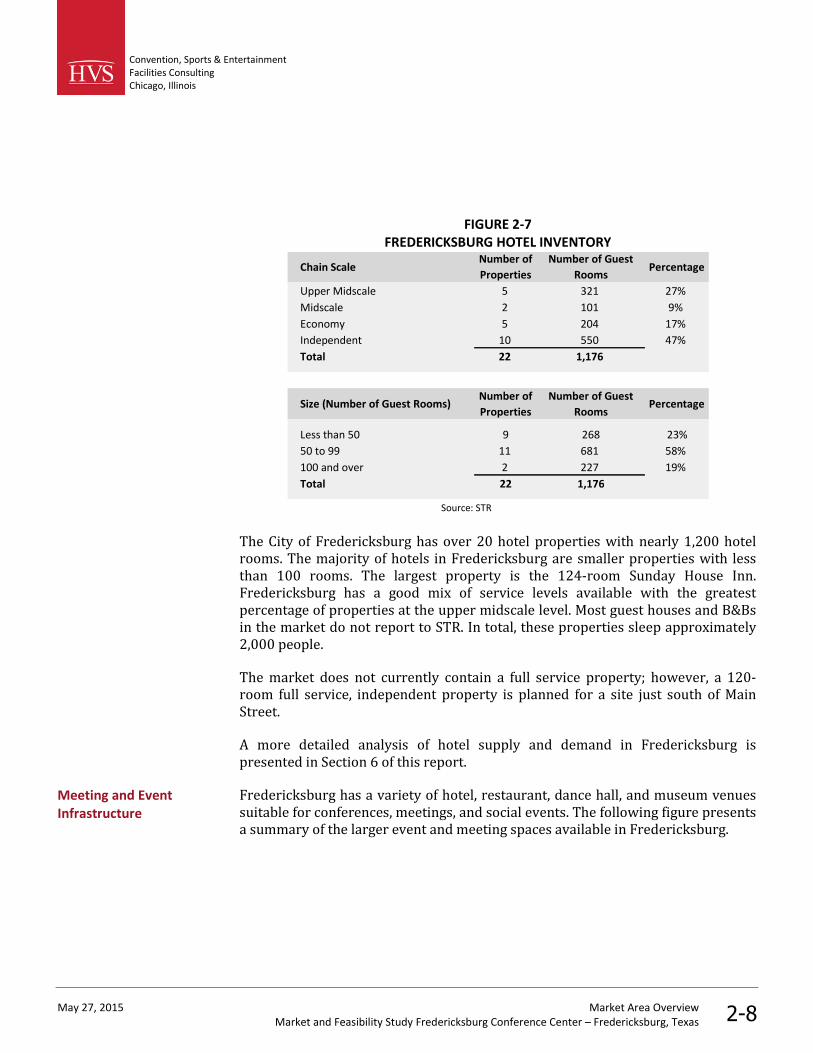
Smith Travel Research (“STR”) maintains a database of approximately 140,000hotel properties and 13 million hotel rooms around the world. The figures belowshow the STR database inventory of all hotel rooms in Fredericksburg by servicelevel and size. The quality of the hotels also indicates the market’s ability tosupport other meeting and event infrastructure.
Lodging Supply
Convention, Sports & EntertainmentFacilities ConsultingChicago, Illinois
May 27, 2015 Market Area OverviewMarket and Feasibility Study Fredericksburg Conference Center – Fredericksburg, Texas 2-8
FIGURE 2-7FREDERICKSBURG HOTEL INVENTORY
Chain ScaleNumber of
Properties
Number of Guest
RoomsPercentage
Upper Midscale 5 321 27%
Midscale 2 101 9%
Economy 5 204 17%
Independent 10 550 47%
Total 22 1,176
Size (Number of Guest Rooms)Number of
Properties
Number of Guest
RoomsPercentage
Less than 50 9 268 23%
50 to 99 11 681 58%
100 and over 2 227 19%
Total 22 1,176
Source: STR
The City of Fredericksburg has over 20 hotel properties with nearly 1,200 hotelrooms. The majority of hotels in Fredericksburg are smaller properties with lessthan 100 rooms. The largest property is the 124-room Sunday House Inn.Fredericksburg has a good mix of service levels available with the greatestpercentage of properties at the upper midscale level. Most guest houses and B&Bsin the market do not report to STR. In total, these properties sleep approximately2,000 people.
The market does not currently contain a full service property; however, a 120-room full service, independent property is planned for a site just south of MainStreet.
A more detailed analysis of hotel supply and demand in Fredericksburg ispresented in Section 6 of this report.
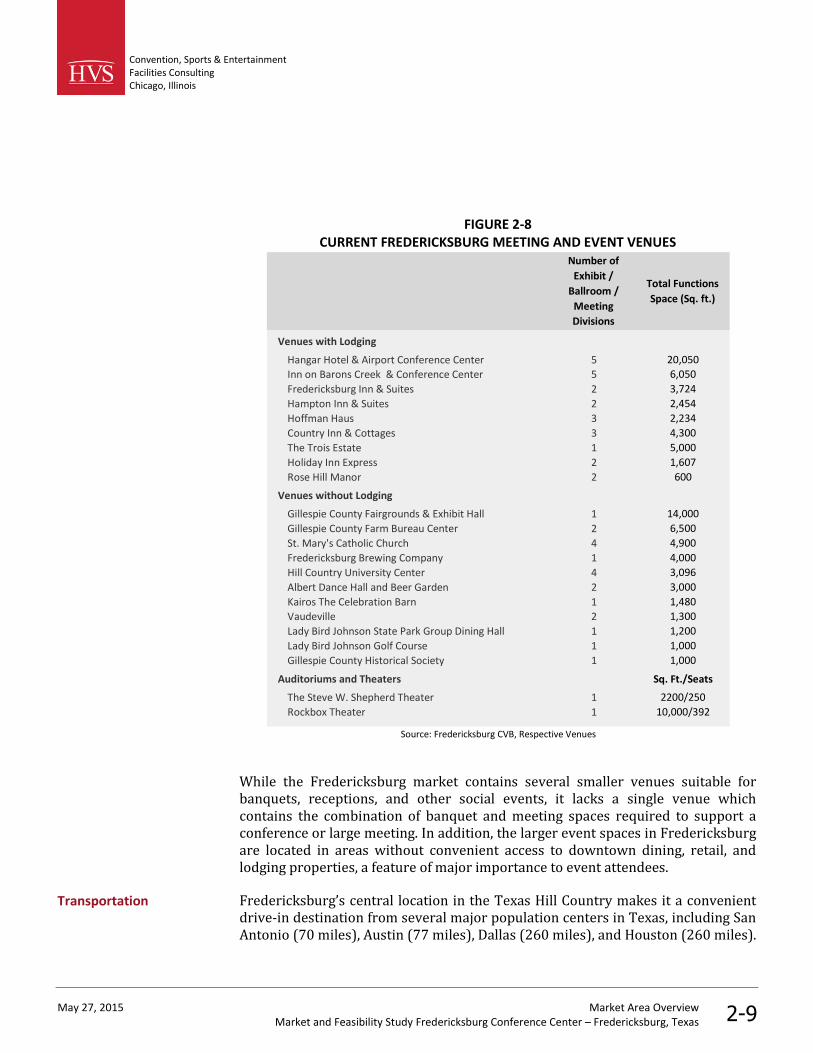
Fredericksburg has a variety of hotel, restaurant, dance hall, and museum venuessuitable for conferences, meetings, and social events. The following figure presentsa summary of the larger event and meeting spaces available in Fredericksburg.
Meeting and EventInfrastructure
Convention, Sports & EntertainmentFacilities ConsultingChicago, Illinois
May 27, 2015 Market Area OverviewMarket and Feasibility Study Fredericksburg Conference Center – Fredericksburg, Texas 2-9
FIGURE 2-8CURRENT FREDERICKSBURG MEETING AND EVENT VENUES
Number of
Exhibit /
Ballroom /
Meeting
Divisions
Total Functions
Space (Sq. ft.)
Venues with Lodging
Hangar Hotel & Airport Conference Center 5 20,050
Inn on Barons Creek & Conference Center 5 6,050
Fredericksburg Inn & Suites 2 3,724
Hampton Inn & Suites 2 2,454
Hoffman Haus 3 2,234
Country Inn & Cottages 3 4,300
The Trois Estate 1 5,000
Holiday Inn Express 2 1,607
Rose Hill Manor 2 600
Venues without Lodging
Gillespie County Fairgrounds & Exhibit Hall 1 14,000
Gillespie County Farm Bureau Center 2 6,500
St. Mary's Catholic Church 4 4,900
Fredericksburg Brewing Company 1 4,000
Hill Country University Center 4 3,096
Albert Dance Hall and Beer Garden 2 3,000
Kairos The Celebration Barn 1 1,480
Vaudeville 2 1,300
Lady Bird Johnson State Park Group Dining Hall 1 1,200
Lady Bird Johnson Golf Course 1 1,000
Gillespie County Historical Society 1 1,000
Auditoriums and Theaters Sq. Ft./Seats
The Steve W. Shepherd Theater 1 2200/250
Rockbox Theater 1 10,000/392
Source: Fredericksburg CVB, Respective Venues
While the Fredericksburg market contains several smaller venues suitable forbanquets, receptions, and other social events, it lacks a single venue whichcontains the combination of banquet and meeting spaces required to support aconference or large meeting. In addition, the larger event spaces in Fredericksburgare located in areas without convenient access to downtown dining, retail, andlodging properties, a feature of major importance to event attendees.
Fredericksburg’s central location in the Texas Hill Country makes it a convenientdrive-in destination from several major population centers in Texas, including SanAntonio (70 miles), Austin (77 miles), Dallas (260 miles), and Houston (260 miles).
Transportation
Convention, Sports & EntertainmentFacilities ConsultingChicago, Illinois
May 27, 2015 Market Area OverviewMarket and Feasibility Study Fredericksburg Conference Center – Fredericksburg, Texas 2-10
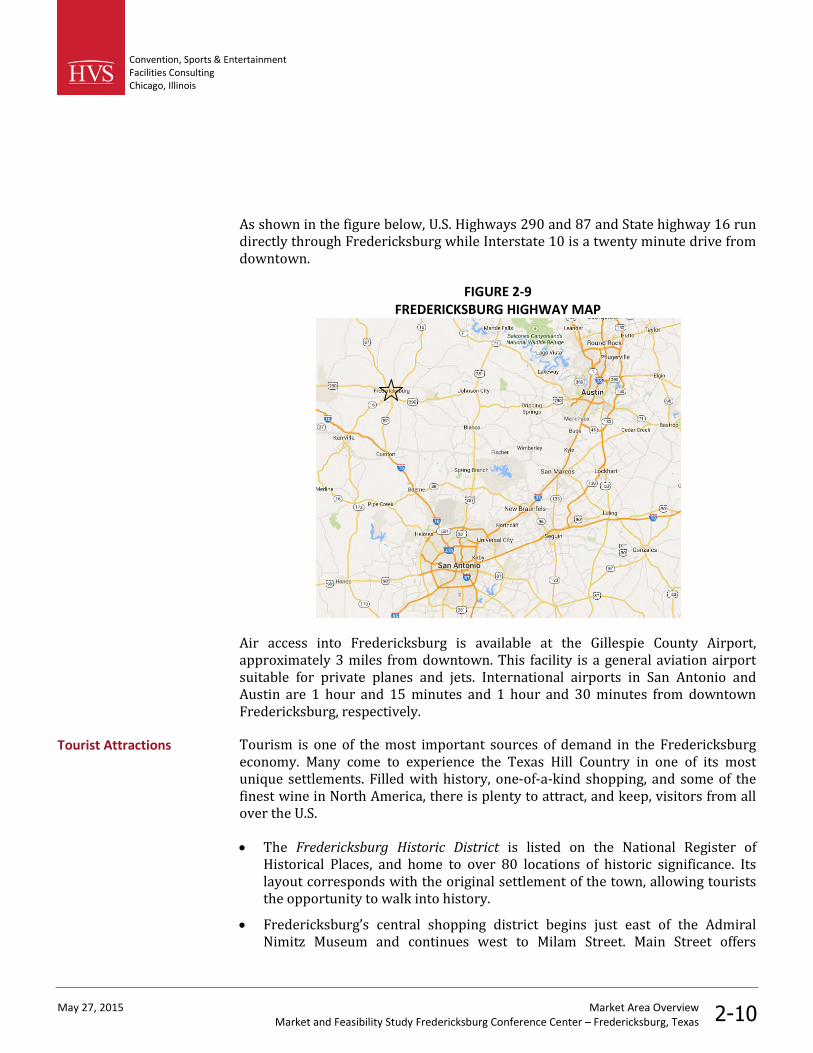
As shown in the figure below, U.S. Highways 290 and 87 and State highway 16 rundirectly through Fredericksburg while Interstate 10 is a twenty minute drive fromdowntown.
FIGURE 2-9FREDERICKSBURG HIGHWAY MAP
Air access into Fredericksburg is available at the Gillespie County Airport,approximately 3 miles from downtown. This facility is a general aviation airportsuitable for private planes and jets. International airports in San Antonio andAustin are 1 hour and 15 minutes and 1 hour and 30 minutes from downtownFredericksburg, respectively.
Tourism is one of the most important sources of demand in the Fredericksburgeconomy. Many come to experience the Texas Hill Country in one of its mostunique settlements. Filled with history, one-of-a-kind shopping, and some of thefinest wine in North America, there is plenty to attract, and keep, visitors from allover the U.S.
The Fredericksburg Historic District is listed on the National Register ofHistorical Places, and home to over 80 locations of historic significance. Itslayout corresponds with the original settlement of the town, allowing touriststhe opportunity to walk into history.
Fredericksburg’s central shopping district begins just east of the AdmiralNimitz Museum and continues west to Milam Street. Main Street offers
Tourist Attractions
Convention, Sports & EntertainmentFacilities ConsultingChicago, Illinois
May 27, 2015 Market Area OverviewMarket and Feasibility Study Fredericksburg Conference Center – Fredericksburg, Texas 2-11
historical buildings, shopping, dining, and entertainment. Marketplatz, on MainStreet, offers pavilions, picnic tables, and public restrooms and hosts manyfestivals and local events.
Enchanted Rock, the second largest granite formation in North America, rising325 feet above the surrounding topography. The area also offers hiking trails,rock climbing, and cave exploration.
The National Museum of the Pacific War is America’s only museum dedicatedto WWII’s Pacific campaign. As one of the most intricate military museums inthe nation, this attraction has over 40 media installations, 900 artifacts, andhundreds of photographs taking up over 33,000 square feet of space.
The Pioneer Museum Complex is homage to the city’s German heritage withseveral historic structures, and recreations of early Texas life. The Vereins-Kirche, the first public building of Fredericksburg is located at Marketplatz;built by settlers in 1847 and rebuilt in 1935, it served as school, fort, church,and a general public building.
The Old St. Mary’s Church/Marienkirche was completed in 1863 and is built incruciform, typical of early Christian churches. The “new” St. Mary’s wascompleted in 1908 and is considered one of the painted churches of Texas ---adorned with beautiful stained glass (with inscriptions in German) andstenciling. Both church buildings are outstanding examples of Gothicarchitecture and open for tours.
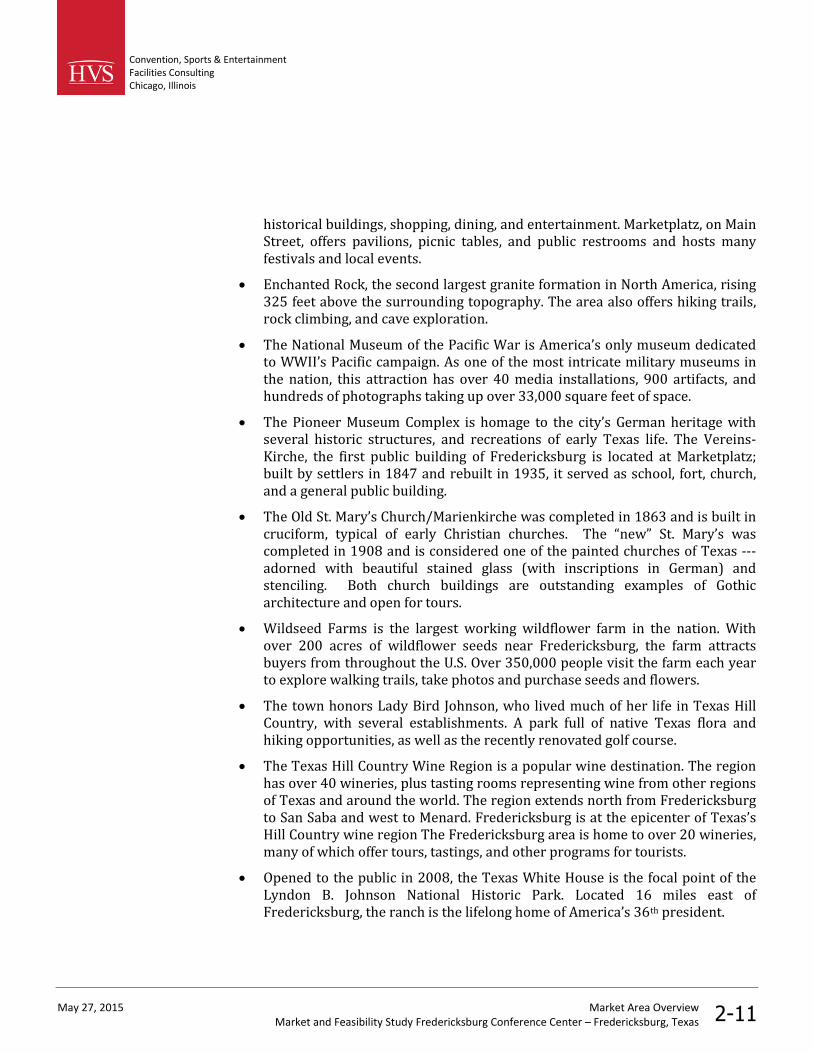
Wildseed Farms is the largest working wildflower farm in the nation. Withover 200 acres of wildflower seeds near Fredericksburg, the farm attractsbuyers from throughout the U.S. Over 350,000 people visit the farm each yearto explore walking trails, take photos and purchase seeds and flowers.
The town honors Lady Bird Johnson, who lived much of her life in Texas HillCountry, with several establishments. A park full of native Texas flora andhiking opportunities, as well as the recently renovated golf course.
The Texas Hill Country Wine Region is a popular wine destination. The regionhas over 40 wineries, plus tasting rooms representing wine from other regionsof Texas and around the world. The region extends north from Fredericksburgto San Saba and west to Menard. Fredericksburg is at the epicenter of Texas’sHill Country wine region The Fredericksburg area is home to over 20 wineries,many of which offer tours, tastings, and other programs for tourists.
Opened to the public in 2008, the Texas White House is the focal point of theLyndon B. Johnson National Historic Park. Located 16 miles east ofFredericksburg, the ranch is the lifelong home of America’s 36th president.
Convention, Sports & EntertainmentFacilities ConsultingChicago, Illinois
May 27, 2015 Market Area OverviewMarket and Feasibility Study Fredericksburg Conference Center – Fredericksburg, Texas 2-12
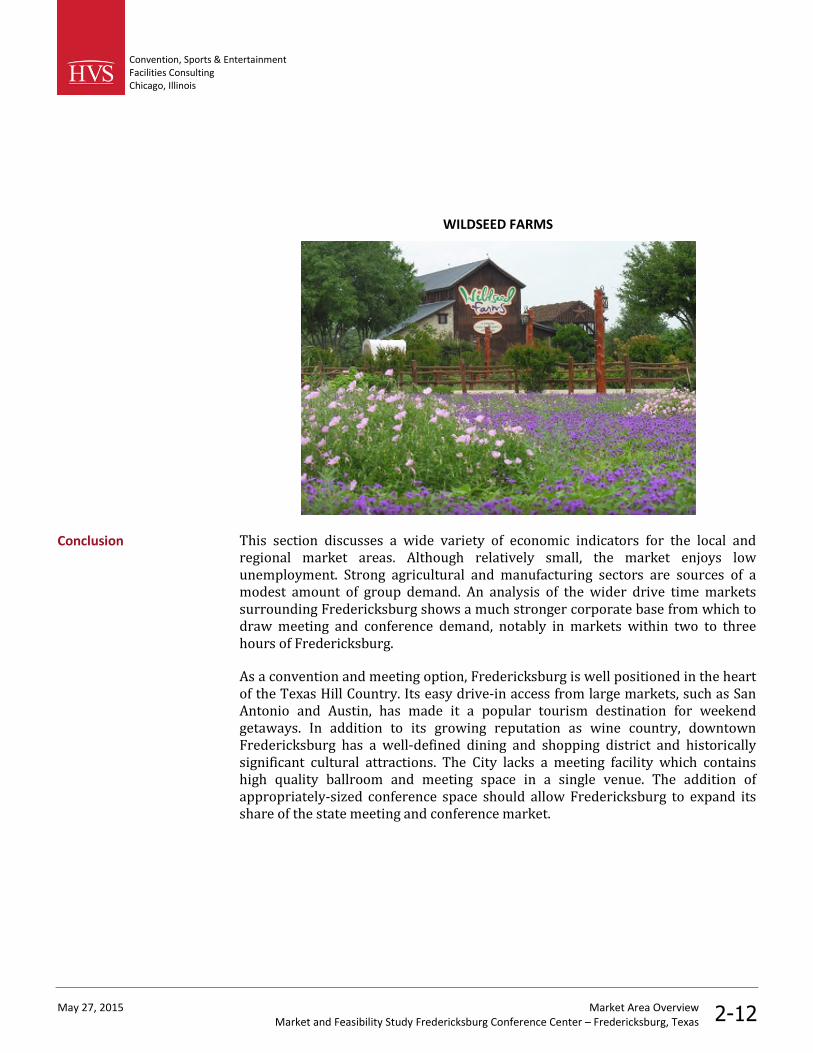
WILDSEED FARMS
This section discusses a wide variety of economic indicators for the local andregional market areas. Although relatively small, the market enjoys lowunemployment. Strong agricultural and manufacturing sectors are sources of amodest amount of group demand. An analysis of the wider drive time marketssurrounding Fredericksburg shows a much stronger corporate base from which todraw meeting and conference demand, notably in markets within two to threehours of Fredericksburg.
As a convention and meeting option, Fredericksburg is well positioned in the heartof the Texas Hill Country. Its easy drive-in access from large markets, such as SanAntonio and Austin, has made it a popular tourism destination for weekendgetaways. In addition to its growing reputation as wine country, downtownFredericksburg has a well-defined dining and shopping district and historicallysignificant cultural attractions. The City lacks a meeting facility which containshigh quality ballroom and meeting space in a single venue. The addition ofappropriately-sized conference space should allow Fredericksburg to expand itsshare of the state meeting and conference market.
Conclusion
Convention, Sports & EntertainmentFacilities ConsultingChicago, Illinois
May 27, 2015 Industry TrendsMarket and Feasibility Study Fredericksburg Conference Center – Fredericksburg, Texas 3-1
3. Industry Trends
In this section, HVS presents an analysis of the convention, conference, tradeshowand meeting industry, including trends in the supply and demand of meeting andevent facilities, as well as trends in expenditures and meeting planner preferences.The purpose of this trends analysis is to provide background informationnecessary to assess the potential for a conference center in Fredericksburg, Texas.This section of the report also provides definitions of industry terms usedthroughout the remainder of this report.
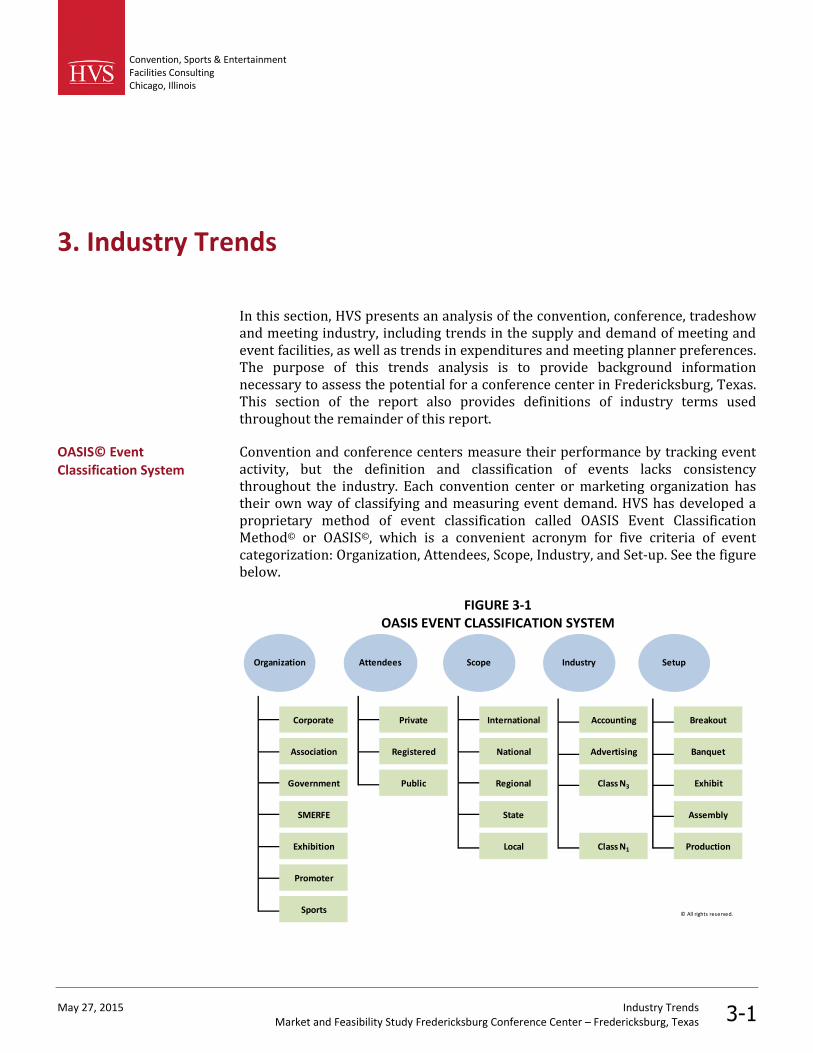
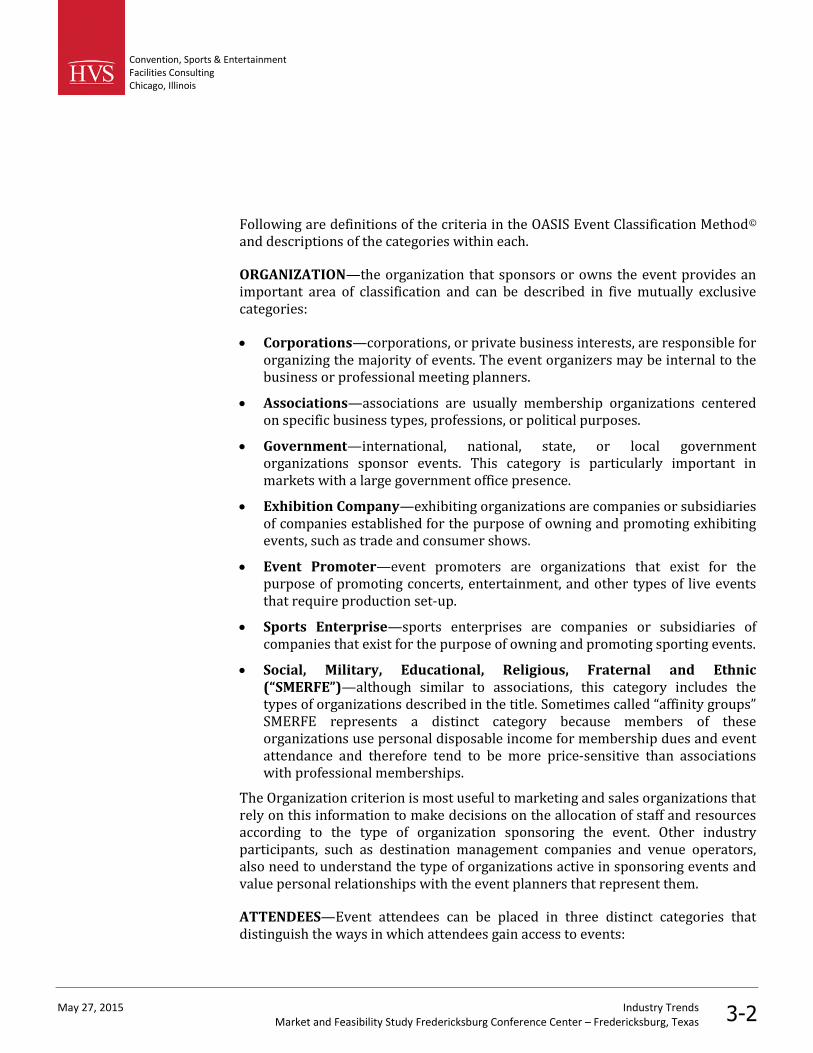
Convention and conference centers measure their performance by tracking eventactivity, but the definition and classification of events lacks consistencythroughout the industry. Each convention center or marketing organization hastheir own way of classifying and measuring event demand. HVS has developed aproprietary method of event classification called OASIS Event ClassificationMethod© or OASIS©, which is a convenient acronym for five criteria of eventcategorization: Organization, Attendees, Scope, Industry, and Set-up. See the figurebelow.
FIGURE 3-1OASIS EVENT CLASSIFICATION SYSTEM
Organization Attendees Scope Industry SetupIndustry Setup
Corporate
Association
Government
SMERFE
Exhibition
Promoter
Sports
Private
Registered
Public
International
National
Regional
State
Local
Accounting
Advertising
Class N3
Class N1
Breakout
Banquet
Exhibit
Assembly
Production
© All rights reserved.
OASIS© EventClassification System
Convention, Sports & EntertainmentFacilities ConsultingChicago, Illinois
May 27, 2015 Industry TrendsMarket and Feasibility Study Fredericksburg Conference Center – Fredericksburg, Texas 3-2
Following are definitions of the criteria in the OASIS Event Classification Method©
and descriptions of the categories within each.
ORGANIZATION—the organization that sponsors or owns the event provides animportant area of classification and can be described in five mutually exclusivecategories:
Corporations—corporations, or private business interests, are responsible fororganizing the majority of events. The event organizers may be internal to thebusiness or professional meeting planners.
Associations—associations are usually membership organizations centeredon specific business types, professions, or political purposes.
Government—international, national, state, or local governmentorganizations sponsor events. This category is particularly important inmarkets with a large government office presence.
Exhibition Company—exhibiting organizations are companies or subsidiariesof companies established for the purpose of owning and promoting exhibitingevents, such as trade and consumer shows.
Event Promoter—event promoters are organizations that exist for thepurpose of promoting concerts, entertainment, and other types of live eventsthat require production set-up.
Sports Enterprise—sports enterprises are companies or subsidiaries ofcompanies that exist for the purpose of owning and promoting sporting events.
Social, Military, Educational, Religious, Fraternal and Ethnic(“SMERFE”)—although similar to associations, this category includes thetypes of organizations described in the title. Sometimes called “affinity groups”SMERFE represents a distinct category because members of theseorganizations use personal disposable income for membership dues and eventattendance and therefore tend to be more price-sensitive than associationswith professional memberships.
The Organization criterion is most useful to marketing and sales organizations thatrely on this information to make decisions on the allocation of staff and resourcesaccording to the type of organization sponsoring the event. Other industryparticipants, such as destination management companies and venue operators,also need to understand the type of organizations active in sponsoring events andvalue personal relationships with the event planners that represent them.
ATTENDEES—Event attendees can be placed in three distinct categories thatdistinguish the ways in which attendees gain access to events:
Convention, Sports & EntertainmentFacilities ConsultingChicago, Illinois
May 27, 2015 Industry TrendsMarket and Feasibility Study Fredericksburg Conference Center – Fredericksburg, Texas 3-3
Private—attendees come to the event by invitation only and do not pay aregistration or admission fee. Private attendees may be individually asked toattend, as to a wedding, or invited by virtue of belonging to a certain group,such as company employees or shareholders.
Registered—attendees do not necessarily need an invitation, but typically payan advance registration fee to attend the event. Registered attendees are oftencalled delegates or qualified buyers and they usually attend an event formultiple days.
Public—the event is open to the general public. Attendees may need topurchase a ticket for admission such as at a consumer show. Other civic eventsmay be free of charge.
In addition, some events have combination shows with an initial period ofexclusive registered attendance and subsequent public attendance.
The Attendees category is particularly important to venue operators and industryanalysts. Understanding the type of attendee at a given event is critical forassessing the impact on convention center operations and projecting economicimpact. The length of stay of attendees and their spending patterns variesconsiderably among the types of attendees.
SCOPE—this category refers to the geographic origin of the attendees. Events areclassified accordingly if a significant proportion of the attendees come from theindicated geographic region surrounding the convention center. Five categoriescapture all the potential geographic scopes and are self-explanatory:
International
National
Regional
State/Provincial
Local
Understanding the origin of attendees is critical to event planners and in theestimation of the economic impact of events. Events that draw attendees fromlarger geographic regions tend to have higher new spending associated with theevent. The allocation of marketing and sales resources may also break downaccording to the geographic scope of events.
INDUSTRY—in North America, HVS recommends relying on the North AmericanIndustry Classification System (“NAICS”) which replaced the previously used U.S.Standard Industrial Classification (“SIC”) system. NAICS was developed jointly by

Convention, Sports & EntertainmentFacilities ConsultingChicago, Illinois
May 27, 2015 Industry TrendsMarket and Feasibility Study Fredericksburg Conference Center – Fredericksburg, Texas 3-4
the U.S., Canada, and Mexico to provide new comparability in statistics aboutbusiness activity across North America. Other economic regions and countrieshave similar industrial classification systems that are widely used and can beadopted for the purposes of classifying events by industry.
NAICS has hundreds of categories but these categories are organized hierarchicallyin five levels. All categories can be rolled up into twenty of the top levels in thehierarchy. However, not all top level industry classifications are useful for eventclassification because little or no event activity is associated with them. Other toplevel categories, such as Manufacturing, are too broad to provide meaningfulinformation, and level two or three categories can be used to form a usefulbreakdown of events.
The choice of industry classifications should result in a reasonable share of eventsfalling into each category. According to the Tradeshow Week data book, theleading industries that are represented by conventions, tradeshows and exhibitioninclude:
Medical and Health Care
Home Furnishings and Interior Design
Sporting Goods and Recreation
Apparel
Building and Construction
Landscape and Garden Supplies
Computers and Computer Applications
Education
Gifts
Associations
Use of the NAICS codes allows for the orderly roll-up of industrial classificationsacross different events and venues, regardless of the categories or the hierarchicallevels that different people may choose to use. Industrial classification informationis useful for those planning to develop new events and for other analysts that needto understand how trends in economic health of the underlying industries affectthe success of particular events and venues.
SPACE SETUP—this final criterion provides for the categorization of events byset-up of the function spaces they utilize. These categories are not mutually
Convention, Sports & EntertainmentFacilities ConsultingChicago, Illinois
May 27, 2015 Industry TrendsMarket and Feasibility Study Fredericksburg Conference Center – Fredericksburg, Texas 3-5
exclusive as events may use any combination of the five primary types of eventset-up.
Breakout—typically involves the use of meeting rooms, boardrooms or othermulti-purpose spaces for meeting functions in a classroom or meeting setting.This set-up may involve some catering services such as coffee breaks orlunches.
Banquet—includes the set-up for catered banquets events such as a weddingsand may include some staging for presentations such as at a general sessionevent.
Exhibit—includes the set-up displays in exhibition halls or other multi-purpose spaces. Concession services and buffet lunches are often a componentof this set-up.
Assembly—includes set-up in theater style seating in plenary halls and fixedseat theaters or other multi-purposes spaces that are used primarily forassemblies and general sessions.
Production—includes the set-up for concerts, entertainment, sporting eventsand other types of events that require significant staging, lighting, and otherlive-event related set-up.
Application of the OASIS© system can provide precise definitions of commonlyused event classifications. All commonly used terms for event types can be definedby a combination of three OASIS© categories: organization, attendees, and spaceset-up.
Conventions—associations, government, and SMERFE organizations registerattendees for multi-day events. Facility set up includes breakout, banquet andexhibit space set-up and may include plenary sessions. Typically, the primarypurpose of a convention is information exchange.
Tradeshows—provide a means for wholesalers and retailers to transactbusiness with industry buyers. Like conventions, tradeshows offer a forum forexchanging industry ideas. In order to clearly differentiate conventions fromtradeshows, HVS assumes that only corporations and enterprises can sponsorand produce tradeshows. Similar to conventions, tradeshows requireregistered attendees. While they also require exhibit space set-up, they onlysometimes require banquet, plenary, and/or breakout space set-up.
Combination Shows—are either corporate or enterprise produced, typicallywith an initial period of attendance by registered attendees only, and later bythe public. Always requiring exhibit set-up, they sometimes also requireplenary, banquet and/or breakout set-up for additional portions of their show.
Event Types
Convention, Sports & EntertainmentFacilities ConsultingChicago, Illinois
May 27, 2015 Industry TrendsMarket and Feasibility Study Fredericksburg Conference Center – Fredericksburg, Texas 3-6
Consumer Shows—public, ticketed events featuring the exhibitions ofmerchandise for sale or display. Exhibition companies produce consumershows, as they provide a means of product distribution and advertising. Theyonly require exhibit space set-up.
Conferences—require a mix of banquet and breakout space set-up as well asoccasional assembly space, but do not require any exhibit set-up. Conferencescan be conducted by any organization type, but always require attendees to beregistered.
Meetings—only require breakout space set-up. Like conferences, they can beproduced from any of the organization types, but unlike conferences, they areprivate events to which one must be invited.
Banquets—only require a banquet set-up for food and beverage meal service.These events also can be produced by any organizational type, and are eitherare held privately or require guests to register.
Assemblies—usually involve a ceremony, a speech, or another similar activitythat attracts a crowd of spectators. Produced by any type of organization,assemblies are always public events. Additionally, assemblies only require aplenary set-up.
Fairs—usually involve an exhibit booth set-up for a public event in which anumber of organizations or companies represent themselves and/or a productor service, with a similar theme or purpose uniting the event. Corporations,associations, governments, or SMERFE groups may present a fair.
Concert/Entertainment—usually a concert or some form of liveentertainment, owned and organized by an event promoter for the public.Entertainment events only require production set-up.
Sports/Amateur Sports—require only a production set-up. Attendees tosporting events, which are always organized by sports enterprises, may bepublic or registered. Some sporting events have both a registered and publicaspect to the event over the span of a few days.
The purpose of this section is to describe the conference, convention, and meetingindustry and analyze trends in the number of events, attendance, and the supply offacilities.
The convention and conference center industry experienced significant year-over-growth in supply from 2000 through 2006. Since 2007, the rate of growth insupply has slowed, but remained positive. As the majority of convention andmeeting facilities involve public funding, economic conditions affect the level of
Trends
Supply Trends

Convention, Sports & EntertainmentFacilities ConsultingChicago, Illinois
May 27, 2015 Industry TrendsMarket and Feasibility Study Fredericksburg Conference Center – Fredericksburg, Texas 3-7
public investment in convention and meeting facilities that are intended tostimulate economic activity. As poor economic conditions continue to constrainpublic budgets nationwide, lack of available funding for convention and meetingfacilities will continue to limit supply growth in the near future. As the economyimproves, supply growth will likely remain low as convention venue projects havelong lead times due to planning, financing and construction requirements.
Conference centers typically have a mix of meeting and ballroom space and areideally suited for conferences, meetings, and small conventions. Conferencecenters often host weddings, banquets, and other social functions along with smallconventions and tradeshows. Each year the International Association ofConference Centers (IACC) conducts an in-depth survey of IACC certifiedconference centers in North America and issues a trends report based on itsfindings. The report distinguishes between residential and non-residentialconference centers and provides a statistical and financial profile for each. Whilethe majority of conference centers across the country do not have an IACCcertification, the overall trends reported by the survey do provide some insightinto the industries which have the most direct implications on the operations of apossible conference center in Fredericksburg.
FIGURE 3-2PROFILE OF ALL SURVEYED NORTH AMERICAN CONFERENCE CENTERS
0.0%
10.0%
20.0%
30.0%
40.0%
Source: IACC Trends in Conference Center Industry, 2014 Edition
Unlike convention centers, which are typically owned by a city or other publicentity, conference centers have a variety of ownership structures. Public entities,private corporations, universities, and non-profit organizations often own
Conference Centers

Convention, Sports & EntertainmentFacilities ConsultingChicago, Illinois
May 27, 2015 Industry TrendsMarket and Feasibility Study Fredericksburg Conference Center – Fredericksburg, Texas 3-8
conference centers for their internal meetings and training. Function spaces arethen rented to external organizations when not in use by the primary tenant.
FIGURE 3-3PROFILE OF CONFERENCE CENTER OWNERSHIP
0%
10%
20%
30%
40%
50%
Resident ial Non- Residential
Source: IACC Trends in Conference Center Industry, 2014 Edition
Unlike convention centers which utilize exhibit space to introduce new productsand services in an industry, conference centers are most often used for trainingand continuing education purposes.

Convention, Sports & EntertainmentFacilities ConsultingChicago, Illinois
May 27, 2015 Industry TrendsMarket and Feasibility Study Fredericksburg Conference Center – Fredericksburg, Texas 3-9
FIGURE 3-4TYPES OF MEETINGS IN CONFERENCE CENTERS
0%
10%
20%
30%
40%
50%
ManagementPlanning
Professional /Technical
Training /ContinuingEducation
SalesMeetings
Other
Residential
Non- Residential
Source: IACC Trends in Conference Center Industry, 2014 Edition
As the meetings industry as a whole continues to rebound from recession, meetingplanners also report being less concerned about the negative publicity associatedwith hosting events in upscale properties and destinations than in recent years.
Another indicator of the national recession’s impact on the meetings market is thegeographic scope of meetings. As groups reduced their meetings budget,conference facilities began to rely more heavily on local meetings and events.
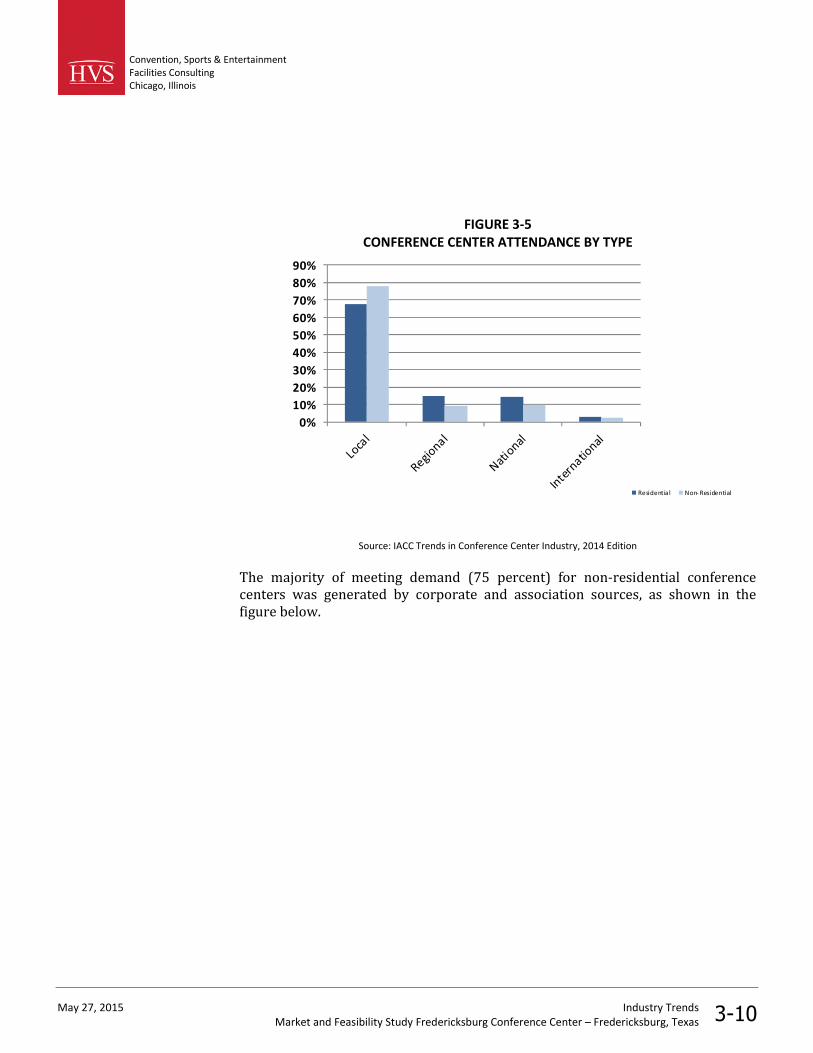
Convention, Sports & EntertainmentFacilities ConsultingChicago, Illinois
May 27, 2015 Industry TrendsMarket and Feasibility Study Fredericksburg Conference Center – Fredericksburg, Texas 3-10
FIGURE 3-5CONFERENCE CENTER ATTENDANCE BY TYPE
0%
10%
20%
30%
40%
50%
60%
70%
80%
90%
Residential Non- Residential
Source: IACC Trends in Conference Center Industry, 2014 Edition
The majority of meeting demand (75 percent) for non-residential conferencecenters was generated by corporate and association sources, as shown in thefigure below.

Convention, Sports & EntertainmentFacilities ConsultingChicago, Illinois
May 27, 2015 Industry TrendsMarket and Feasibility Study Fredericksburg Conference Center – Fredericksburg, Texas 3-11
FIGURE 3-6NON-RESIDENT CONFERENCE CENTER DEMAND SEGMENTS
43.6%
20.3%
12.6%
0.6%
10.3%
12.6%
Corporate
Association
Government
Civic
SMERF
Other
Source: IACC Trends in Conference Center Industry, 2014 Edition
Over the past few decades, the meeting and convention industry has evolveddramatically from a budding industry to a more mature one that has become animportant driver of the national economy. As an established industry, the meetingand convention industry has been marked by rapid growth in the last four decadesand a subsequent slowdown in supply growth in the late 2000s. As the economicrecession continues to affect the level of demand and available budgets forconventions and meetings, the industry continues to evolve.
Technology: Rapidly evolving communications technology affects convention andconference centers as events need more band width, faster Wi-Fi connections, andreliable cellular connections. The capacities of these systems will need to becontinually expanded in the foreseeable future.
Changes in Demand and Supply Transformation: As discussed earlier, thematurity of the industry has sharply increased competition. Nearby or attachedhotel rooms, flexible meeting space, price points at convention centers and hotels,and airport capacity and rates continue to drive site selection, and thus dictatehow supply changes over time. Quality of convention facilities and hotelscontinues to be an important factor in site selection.
Travel Costs: Organizations hosting and planning events continue to work withtightened budgets, as do attendees. Recent increases in travel costs have decreased
Convention andMeeting Trends for theFuture
Convention, Sports & EntertainmentFacilities ConsultingChicago, Illinois
May 27, 2015 Industry TrendsMarket and Feasibility Study Fredericksburg Conference Center – Fredericksburg, Texas 3-12
the desire to travel for some attendees and exhibitors. In the long run, expansionsin the transportation system and continued innovations, as well as improvedeconomic conditions, are likely to support the growth of the meeting industry.
Electronic Meetings: In recent years, industry experts have speculated thatimprovements in telecommunications technology would supplant the need forface-to-face meetings. While data indicates that some meetings and events havebeen replaced by webinars or other electronic forms of meetings, in the long run,electronic meetings act as a demand generator for future meeting growth byexpanding the networks and interactions of businesses and organizations. Furtheradvancements in communications technology will be necessary before electronicmeeting became a realistic substitute for face-to-face meetings.
Mixed-Use Developments: For many markets, the presence of conference andconvention centers offer an opportunity to develop an adjacent mixed-useattraction with land uses such as hotels, retail, dining, sports venues, and otherentertainment uses. Some conference and convention centers have become thecenter of their own “districts,” offering a wide variety of entertainment options todelegates, event organizers, or exhibitors. The growth of mixed-use developments,particularly as economic conditions have improved, will continue to change themeeting and convention industry as supply transforms.
As the meetings and convention industry continues to rebound from its 2009 lows,Fredericksburg should have the opportunity to improve its market share ofconference and meeting events by addressing its programming and strategicneeds. Improved and expanded event space via the development of a state-of-the-art conference center should meet the needs of event planners. A popular tourismdestination, Fredericksburg’s central location and proximity to large populationcenters in Texas make a new venue an attractive and competitive destination forattendees. The following sections in this report present estimates ofFredericksburg’s event demand potential in the meetings industry and the meetinginfrastructure required to realize that potential.
Implications forFredericksburg

Convention, Sports & EntertainmentFacilities ConsultingChicago, Illinois
May 27, 2015 Comparable VenuesMarket and Feasibility Study Fredericksburg Conference Center – Fredericksburg, Texas 4-1
4. Comparable Venues
This analysis of comparable venues provides a basis for developing buildingprogram recommendations and forecasts of event demand and financialoperations. We compare the function spaces, adjacent hotel capacities, andcharacteristics of the markets relevant to the success of the event venues. Weconclude with an assessment of the relative strengths and weaknesses ofFredericksburg.
Fredericksburg competes with other cities in the State of Texas for a share ofassociation, corporate, and SMERFE business. Event planners select host cities fortheir events based on the overall package that a city may offer. Several factorsdetermine a city’s overall strength and potential in the meetings market. Thesefactors include the attributes of the conference facilities, lodging supply, theeconomic and demographic profile of the community, transportation access,tourism amenities, and overall destination appeal.
HVS analyzed three set of venues:
conference centers and hotel conference centers in the Texas Hill Countrywhich would compete directly with the proposed venue in Fredericksburg,
conference and convention centers in small to medium Texas cities that havetourism markets and may compete with proposed venue in Fredericksburg,and
conference centers and hotel conference centers in comparable wine countrydestinations in California, Kentucky, Oregon, and Washington.
HVS analyzed competitive venues shown in the figure below.
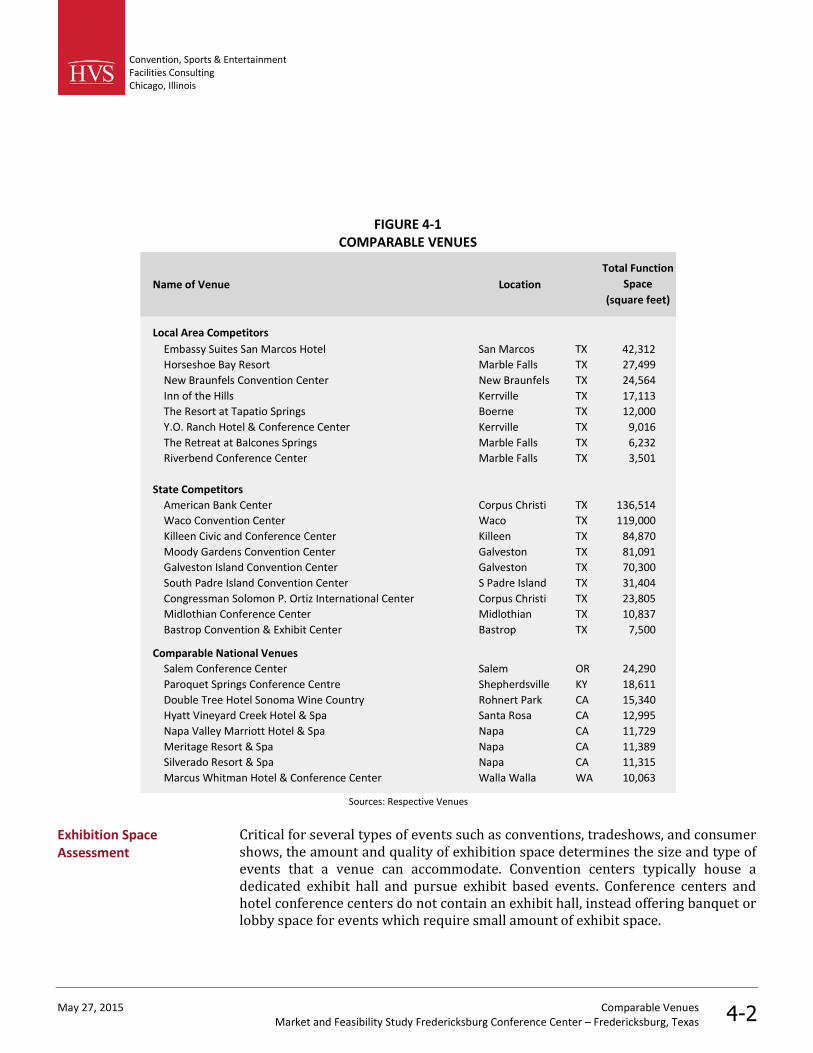
Convention, Sports & EntertainmentFacilities ConsultingChicago, Illinois
May 27, 2015 Comparable VenuesMarket and Feasibility Study Fredericksburg Conference Center – Fredericksburg, Texas 4-2
FIGURE 4-1COMPARABLE VENUES
Name of Venue Location
Local Area Competitors
Embassy Suites San Marcos Hotel San Marcos TX 42,312
Horseshoe Bay Resort Marble Falls TX 27,499
New Braunfels Convention Center New Braunfels TX 24,564
Inn of the Hills Kerrville TX 17,113
The Resort at Tapatio Springs Boerne TX 12,000
Y.O. Ranch Hotel & Conference Center Kerrville TX 9,016
The Retreat at Balcones Springs Marble Falls TX 6,232
Riverbend Conference Center Marble Falls TX 3,501
State Competitors
American Bank Center Corpus Christi TX 136,514
Waco Convention Center Waco TX 119,000
Killeen Civic and Conference Center Killeen TX 84,870
Moody Gardens Convention Center Galveston TX 81,091
Galveston Island Convention Center Galveston TX 70,300
South Padre Island Convention Center S Padre Island TX 31,404
Congressman Solomon P. Ortiz International Center Corpus Christi TX 23,805
Midlothian Conference Center Midlothian TX 10,837
Bastrop Convention & Exhibit Center Bastrop TX 7,500
Comparable National Venues
Salem Conference Center Salem OR 24,290
Paroquet Springs Conference Centre Shepherdsville KY 18,611
Double Tree Hotel Sonoma Wine Country Rohnert Park CA 15,340
Hyatt Vineyard Creek Hotel & Spa Santa Rosa CA 12,995
Napa Valley Marriott Hotel & Spa Napa CA 11,729
Meritage Resort & Spa Napa CA 11,389
Silverado Resort & Spa Napa CA 11,315
Marcus Whitman Hotel & Conference Center Walla Walla WA 10,063
Sources: Respective Venues
Total Function
Space
(square feet)
Critical for several types of events such as conventions, tradeshows, and consumershows, the amount and quality of exhibition space determines the size and type ofevents that a venue can accommodate. Convention centers typically house adedicated exhibit hall and pursue exhibit based events. Conference centers andhotel conference centers do not contain an exhibit hall, instead offering banquet orlobby space for events which require small amount of exhibit space.
Exhibition SpaceAssessment
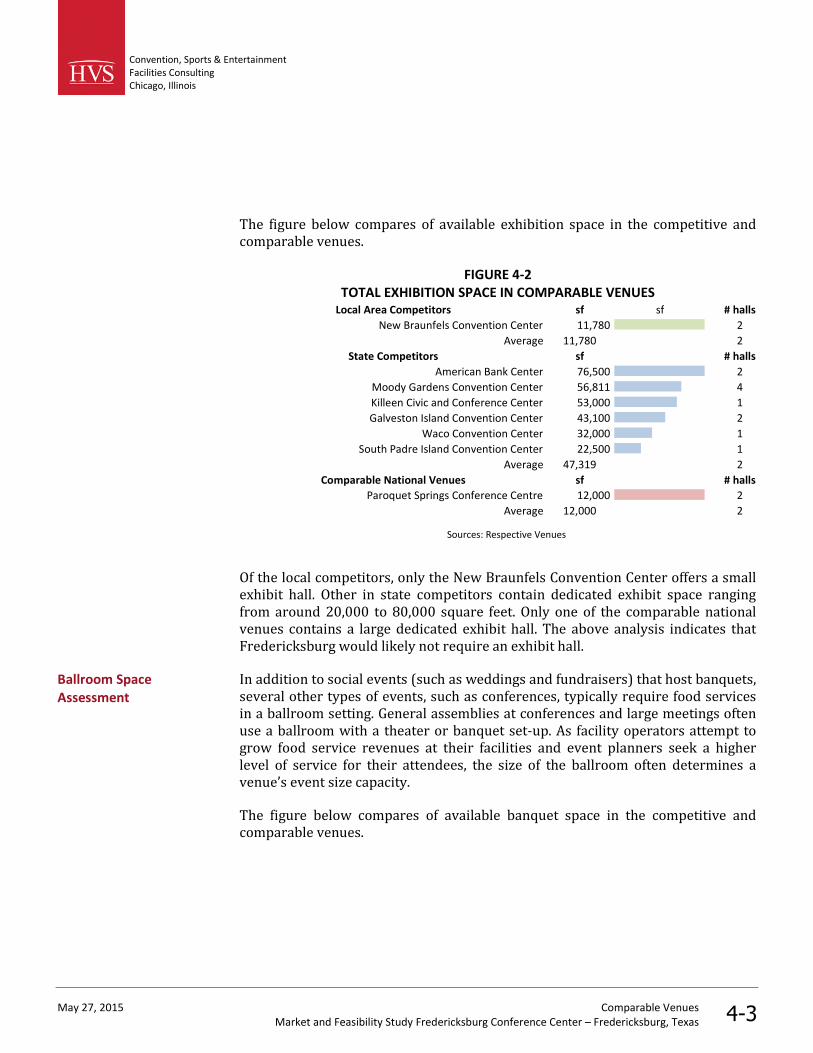
Convention, Sports & EntertainmentFacilities ConsultingChicago, Illinois
May 27, 2015 Comparable VenuesMarket and Feasibility Study Fredericksburg Conference Center – Fredericksburg, Texas 4-3
The figure below compares of available exhibition space in the competitive andcomparable venues.
FIGURE 4-2TOTAL EXHIBITION SPACE IN COMPARABLE VENUES
Local Area Competitors sf sf # halls
New Braunfels Convention Center 11,780 2
Average 11,780 2
State Competitors sf # halls
American Bank Center 76,500 2
Moody Gardens Convention Center 56,811 4
Killeen Civic and Conference Center 53,000 1
Galveston Island Convention Center 43,100 2
Waco Convention Center 32,000 1
South Padre Island Convention Center 22,500 1
Average 47,319 2
Comparable National Venues sf # halls
Paroquet Springs Conference Centre 12,000 2
Average 12,000 2
Sources: Respective Venues
Of the local competitors, only the New Braunfels Convention Center offers a smallexhibit hall. Other in state competitors contain dedicated exhibit space rangingfrom around 20,000 to 80,000 square feet. Only one of the comparable nationalvenues contains a large dedicated exhibit hall. The above analysis indicates thatFredericksburg would likely not require an exhibit hall.
In addition to social events (such as weddings and fundraisers) that host banquets,several other types of events, such as conferences, typically require food servicesin a ballroom setting. General assemblies at conferences and large meetings oftenuse a ballroom with a theater or banquet set-up. As facility operators attempt togrow food service revenues at their facilities and event planners seek a higherlevel of service for their attendees, the size of the ballroom often determines avenue’s event size capacity.
The figure below compares of available banquet space in the competitive andcomparable venues.
Ballroom SpaceAssessment
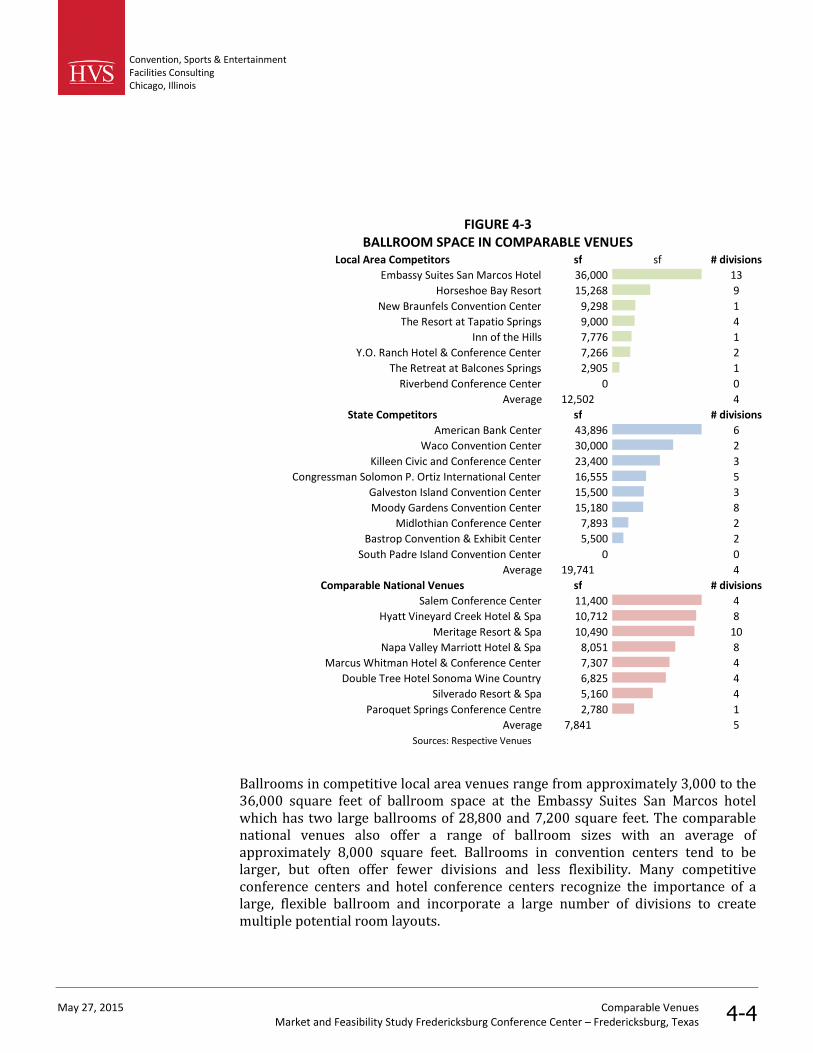
Convention, Sports & EntertainmentFacilities ConsultingChicago, Illinois
May 27, 2015 Comparable VenuesMarket and Feasibility Study Fredericksburg Conference Center – Fredericksburg, Texas 4-4
FIGURE 4-3BALLROOM SPACE IN COMPARABLE VENUES
Local Area Competitors sf sf # divisions
Embassy Suites San Marcos Hotel 36,000 13
Horseshoe Bay Resort 15,268 9
New Braunfels Convention Center 9,298 1
The Resort at Tapatio Springs 9,000 4
Inn of the Hills 7,776 1
Y.O. Ranch Hotel & Conference Center 7,266 2
The Retreat at Balcones Springs 2,905 1
Riverbend Conference Center 0 0
Average 12,502 4
State Competitors sf # divisions
American Bank Center 43,896 6
Waco Convention Center 30,000 2
Killeen Civic and Conference Center 23,400 3
Congressman Solomon P. Ortiz International Center 16,555 5
Galveston Island Convention Center 15,500 3
Moody Gardens Convention Center 15,180 8
Midlothian Conference Center 7,893 2
Bastrop Convention & Exhibit Center 5,500 2
South Padre Island Convention Center 0 0
Average 19,741 4
Comparable National Venues sf # divisions
Salem Conference Center 11,400 4
Hyatt Vineyard Creek Hotel & Spa 10,712 8
Meritage Resort & Spa 10,490 10
Napa Valley Marriott Hotel & Spa 8,051 8
Marcus Whitman Hotel & Conference Center 7,307 4
Double Tree Hotel Sonoma Wine Country 6,825 4
Silverado Resort & Spa 5,160 4
Paroquet Springs Conference Centre 2,780 1
Average 7,841 5
Sources: Respective Venues
Ballrooms in competitive local area venues range from approximately 3,000 to the36,000 square feet of ballroom space at the Embassy Suites San Marcos hotelwhich has two large ballrooms of 28,800 and 7,200 square feet. The comparablenational venues also offer a range of ballroom sizes with an average ofapproximately 8,000 square feet. Ballrooms in convention centers tend to belarger, but often offer fewer divisions and less flexibility. Many competitiveconference centers and hotel conference centers recognize the importance of alarge, flexible ballroom and incorporate a large number of divisions to createmultiple potential room layouts.

Convention, Sports & EntertainmentFacilities ConsultingChicago, Illinois
May 27, 2015 Comparable VenuesMarket and Feasibility Study Fredericksburg Conference Center – Fredericksburg, Texas 4-5
Meeting rooms can accommodate sub-groups as they break out of larger generalsessions at conventions and tradeshows. Additionally, these smaller rooms cansupport self-contained meetings, training sessions, seminars, classes, and a varietyof small meeting functions. A facility’s meeting rooms are often its most frequentlyused function spaces. Generally, conference centers should offer meeting spaceproportionate to the amount of ballroom space available at the facility. However,the optimum amount of meeting space can vary depending on a facility’s targetmarket. Many hotel properties contain large, flexible ballroom spaces which can bedivided into several sections and used at breakout meeting space.
The following figure presents a comparison of available meeting space.
FIGURE 4-4MEETING SPACE IN COMPARABLE VENUES
Local Area Competitors sf sf # rooms
Horseshoe Bay Resort 11,871 16
Inn of the Hills 9,337 7
Embassy Suites San Marcos Hotel 6,312 8
Riverbend Conference Center 3,501 4
The Retreat at Balcones Springs 3,327 4
New Braunfels Convention Center 3,286 4
The Resort at Tapatio Springs 3,000 5
Y.O. Ranch Hotel & Conference Center 1,750 3
Average 5,298 6
State Competitors sf # rooms
Waco Convention Center 57,000 18
American Bank Center 16,118 14
Galveston Island Convention Center 11,700 11
Moody Gardens Convention Center 9,100 12
South Padre Island Convention Center 8,904 6
Killeen Civic and Conference Center 8,470 8
Congressman Solomon P. Ortiz International Center 7,250 5
Midlothian Conference Center 2,944 4
Bastrop Convention & Exhibit Center 2,000 4
Average 13,721 9
Comparable National Venues sf # rooms
Salem Conference Center 12,890 10
Double Tree Hotel Sonoma Wine Country 8,515 9
Silverado Resort & Spa 6,155 13
Paroquet Springs Conference Centre 3,831 6
Napa Valley Marriott Hotel & Spa 3,678 5
Marcus Whitman Hotel & Conference Center 2,756 5
Hyatt Vineyard Creek Hotel & Spa 2,283 3
Meritage Resort & Spa 899 2
Average 5,126 7
Sources: Respective Venues
Meeting/BreakoutRoom Assessment
Convention, Sports & EntertainmentFacilities ConsultingChicago, Illinois
May 27, 2015 Comparable VenuesMarket and Feasibility Study Fredericksburg Conference Center – Fredericksburg, Texas 4-6
Meeting space in the area competitive venues ranges from approximately 2,000 to12,000 square feet with a similar distribution found in the comparable nationalvenues. Convention centers tend to have greater amounts of meeting space.Several venues from each competitive set house large amounts of meeting spaceand a greater number of meeting rooms, increasing their ability to host largerevents and simultaneous smaller functions. Hotels with smaller amounts ofdedicated meeting space often rely on flexible ballroom space for breakoutmeetings.
The quality and proximity of hotel supply represents one of the most importantselection factors for facility users in recent years. To attract out-of-town groups, anadequate supply of nearby hotel rooms should support the lodging needs ofdelegates, exhibitors, and other attendees. Event planners consider proximity andconnectivity as critical factors when evaluating the overall hotel packagesavailable in competing communities. Generally, the number of rooms offered athotels adjacent or connected to the convention center is the key point ofcomparison. Other important factors include hotel brands, service levels, buildingage, ease of access, and available meeting and banquet spaces in these hotels.
The figure below compares the number of adjacent hotel rooms in the competitiveand comparable venues. The figure only shows those venues with attachedlodging.
Adjacent HotelCapacity
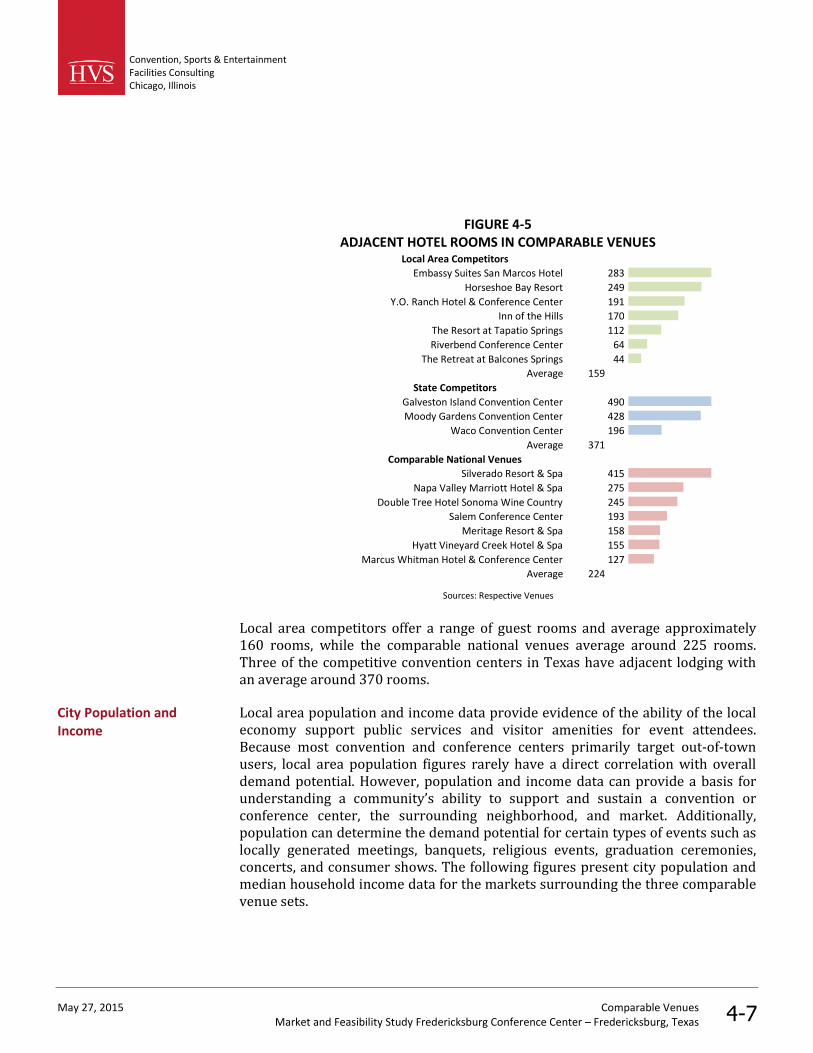
Convention, Sports & EntertainmentFacilities ConsultingChicago, Illinois
May 27, 2015 Comparable VenuesMarket and Feasibility Study Fredericksburg Conference Center – Fredericksburg, Texas 4-7
FIGURE 4-5ADJACENT HOTEL ROOMS IN COMPARABLE VENUES
Local Area Competitors
Embassy Suites San Marcos Hotel 283
Horseshoe Bay Resort 249
Y.O. Ranch Hotel & Conference Center 191
Inn of the Hills 170
The Resort at Tapatio Springs 112
Riverbend Conference Center 64
The Retreat at Balcones Springs 44
Average 159
State Competitors
Galveston Island Convention Center 490
Moody Gardens Convention Center 428
Waco Convention Center 196
Average 371
Comparable National Venues
Silverado Resort & Spa 415
Napa Valley Marriott Hotel & Spa 275
Double Tree Hotel Sonoma Wine Country 245
Salem Conference Center 193
Meritage Resort & Spa 158
Hyatt Vineyard Creek Hotel & Spa 155
Marcus Whitman Hotel & Conference Center 127
Average 224
Sources: Respective Venues
Local area competitors offer a range of guest rooms and average approximately160 rooms, while the comparable national venues average around 225 rooms.Three of the competitive convention centers in Texas have adjacent lodging withan average around 370 rooms.
Local area population and income data provide evidence of the ability of the localeconomy support public services and visitor amenities for event attendees.Because most convention and conference centers primarily target out-of-townusers, local area population figures rarely have a direct correlation with overalldemand potential. However, population and income data can provide a basis forunderstanding a community’s ability to support and sustain a convention orconference center, the surrounding neighborhood, and market. Additionally,population can determine the demand potential for certain types of events such aslocally generated meetings, banquets, religious events, graduation ceremonies,concerts, and consumer shows. The following figures present city population andmedian household income data for the markets surrounding the three comparablevenue sets.
City Population andIncome

Convention, Sports & EntertainmentFacilities ConsultingChicago, Illinois
May 27, 2015 Comparable VenuesMarket and Feasibility Study Fredericksburg Conference Center – Fredericksburg, Texas 4-8
FIGURE 4-6CITY POPULATION OF COMPARABLE MARKETS
Local Area Competitors
New Braunfels 65,306
San Marcos 48,864
Kerrville 23,049
Boerne 12,444
Fredericksburg 10,701
Marble Falls 6,140
State Competitors
Corpus Christi 314,889
Killeen 139,685
Waco 127,979
Galveston 48,597
Midlothian 20,140
Fredericksburg 10,701
Bastrop 7,785
S Padre Island 2,844
Comparable National Venues
Santa Rosa 171,453
Salem 158,073
Napa 77,566
Rohnert Park 41,976
Walla Walla 32,180
Shepherdsville 11,872
Fredericksburg 10,701

Convention, Sports & EntertainmentFacilities ConsultingChicago, Illinois
May 27, 2015 Comparable VenuesMarket and Feasibility Study Fredericksburg Conference Center – Fredericksburg, Texas 4-9
FIGURE 4-7MEDIAN HOUSEHOLD INCOME OF COMPARABLE MARKETS
Local Area Competitors
Boerne 71,052
New Braunfels 58,510
Fredericksburg 50,641
Marble Falls 44,111
Kerrville 43,652
San Marcos 26,727
State Competitors
Midlothian 76,905
S Padre Island 63,924
Bastrop 55,212
Fredericksburg 50,641
Killeen 48,134
Corpus Christi 45,302
Galveston 32,241
Waco 31,881
Comparable National Venues
Napa 59,022
Rohnert Park 57,027
Santa Rosa 56,609
Fredericksburg 50,641
Salem 46,462
Shepherdsville 44,218
Walla Walla 33,167
Source: Esri
Fredericksburg has one of the smallest city populations among the local in-statecompetitors, while its median income is about average, suggesting a more limitedability to drive locally-generated demand at a conference center. A similar scenarioexists when comparing the Fredericksburg market to other wine country locationsin the U.S.
The density and breadth of a city’s corporate base indicates demand potential inthe meetings industry. Businesses generate demand for conventions, conferences,training, and other industry-specific events. The following figures demonstratehow Fredericksburg compares with the comparable markets with respect to thetotal number of business establishments.
Corporate Comparison
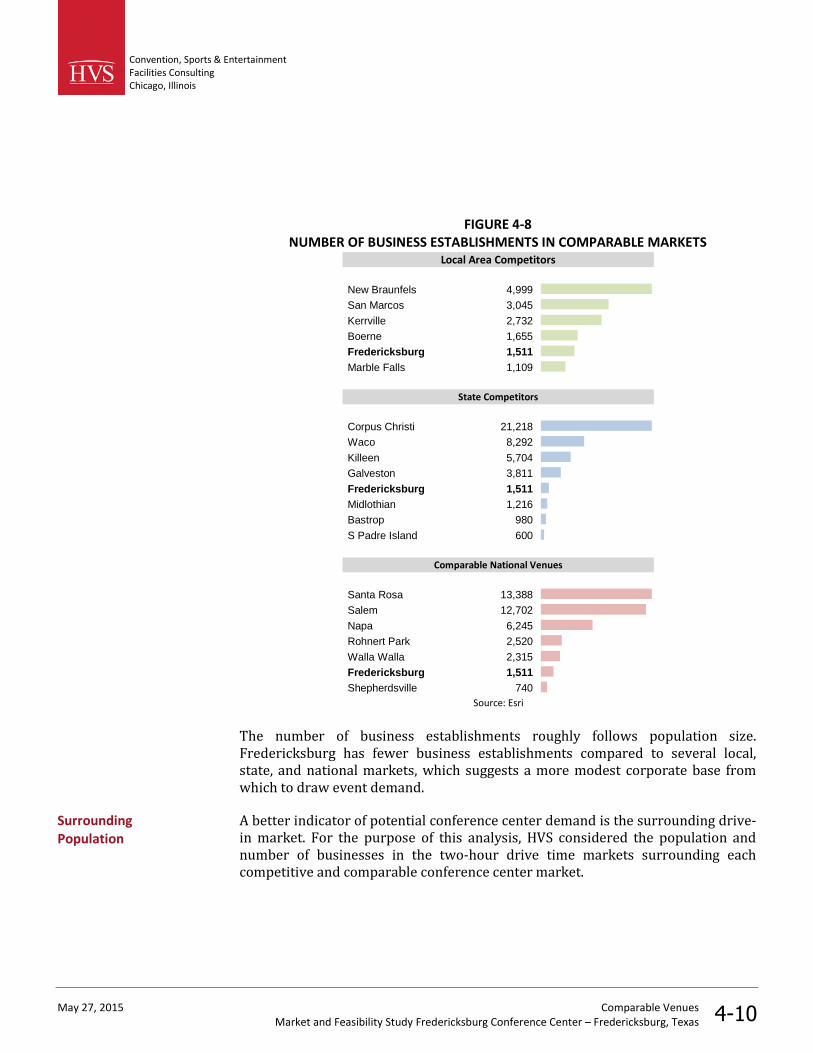
Convention, Sports & EntertainmentFacilities ConsultingChicago, Illinois
May 27, 2015 Comparable VenuesMarket and Feasibility Study Fredericksburg Conference Center – Fredericksburg, Texas 4-10
FIGURE 4-8NUMBER OF BUSINESS ESTABLISHMENTS IN COMPARABLE MARKETS
Local Area Competitors
New Braunfels 4,999
San Marcos 3,045
Kerrville 2,732
Boerne 1,655
Fredericksburg 1,511
Marble Falls 1,109
State Competitors
Corpus Christi 21,218
Waco 8,292
Killeen 5,704
Galveston 3,811
Fredericksburg 1,511
Midlothian 1,216
Bastrop 980
S Padre Island 600
Comparable National Venues
Santa Rosa 13,388
Salem 12,702
Napa 6,245
Rohnert Park 2,520
Walla Walla 2,315
Fredericksburg 1,511
Shepherdsville 740
Source: Esri
The number of business establishments roughly follows population size.Fredericksburg has fewer business establishments compared to several local,state, and national markets, which suggests a more modest corporate base fromwhich to draw event demand.
A better indicator of potential conference center demand is the surrounding drive-in market. For the purpose of this analysis, HVS considered the population andnumber of businesses in the two-hour drive time markets surrounding eachcompetitive and comparable conference center market.
SurroundingPopulation
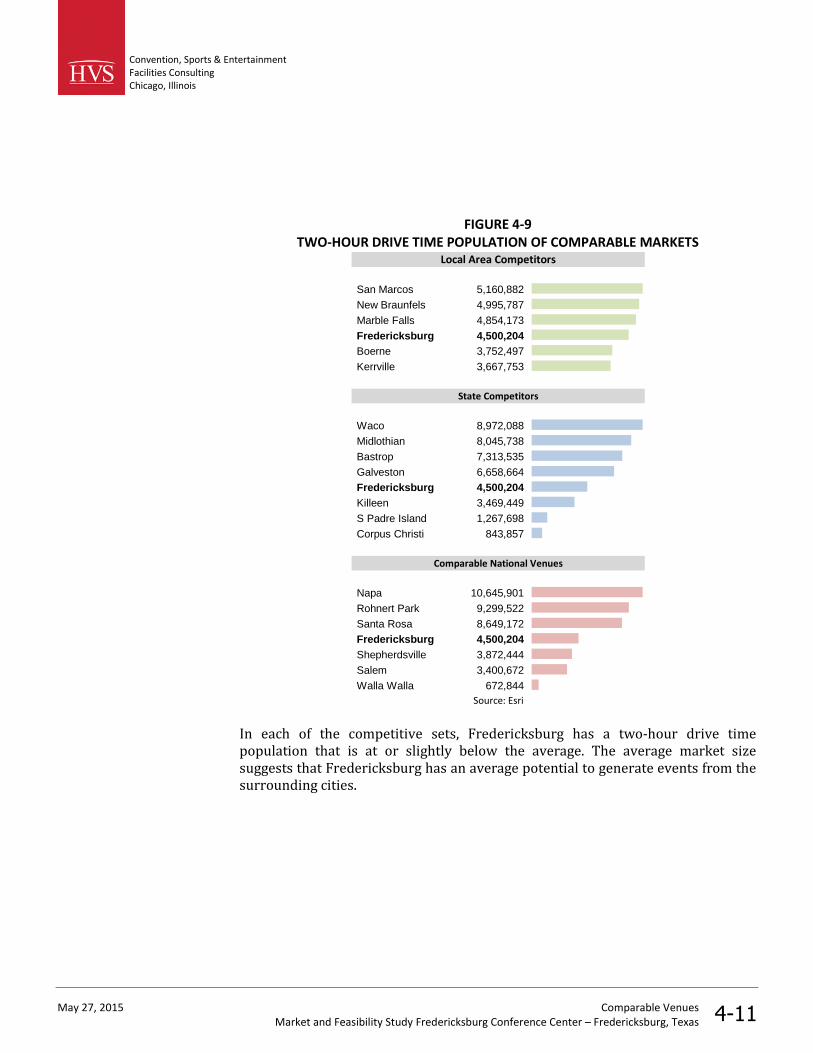
Convention, Sports & EntertainmentFacilities ConsultingChicago, Illinois
May 27, 2015 Comparable VenuesMarket and Feasibility Study Fredericksburg Conference Center – Fredericksburg, Texas 4-11
FIGURE 4-9TWO-HOUR DRIVE TIME POPULATION OF COMPARABLE MARKETS
Local Area Competitors
San Marcos 5,160,882
New Braunfels 4,995,787
Marble Falls 4,854,173
Fredericksburg 4,500,204
Boerne 3,752,497
Kerrville 3,667,753
State Competitors
Waco 8,972,088
Midlothian 8,045,738
Bastrop 7,313,535
Galveston 6,658,664
Fredericksburg 4,500,204
Killeen 3,469,449
S Padre Island 1,267,698
Corpus Christi 843,857
Comparable National Venues
Napa 10,645,901
Rohnert Park 9,299,522
Santa Rosa 8,649,172
Fredericksburg 4,500,204
Shepherdsville 3,872,444
Salem 3,400,672
Walla Walla 672,844
Source: Esri
In each of the competitive sets, Fredericksburg has a two-hour drive timepopulation that is at or slightly below the average. The average market sizesuggests that Fredericksburg has an average potential to generate events from thesurrounding cities.

Convention, Sports & EntertainmentFacilities ConsultingChicago, Illinois
May 27, 2015 Comparable VenuesMarket and Feasibility Study Fredericksburg Conference Center – Fredericksburg, Texas 4-12
FIGURE 4-10TWO-HOUR DRIVE TIME NUMBER OF BUSINESS ESTABLISHMENTS
Local Area Competitors
San Marcos 379,931
New Braunfels 369,578
Marble Falls 367,217
Fredericksburg 336,810
Boerne 287,194
Kerrville 283,521
State Competitors
Waco 759,346
Midlothian 678,048
Bastrop 549,197
Galveston 507,578
Fredericksburg 336,810
Killeen 266,144
S Padre Island 61,447
Corpus Christi 51,657
Comparable National Venues
Napa 809,943
Rohnert Park 731,609
Santa Rosa 683,729
Fredericksburg 336,810
Salem 305,809
Shepherdsville 275,122
Walla Walla 39,227
Source: Esri
Compared the competitive venues in the Texas Hill Country, Fredericksburg has anaverage number of surrounding businesses. The other sets contain a wider varietyof corporate presence with Fredericksburg falling slightly below the average.
Market wide lodging counts provide an indication of the visitation capacity of amarket. While many of the comparable venues are integrated hotel conferencecenters, the market wide hotel capacity can provide insight into a destination’sability to support a city-wide event in which multiple hotel properties are requiredfor attendee lodging. The following figure presents the number of market-widehotel rooms included in the STR database. Not all properties report to STR,therefore, the actual number of total guest rooms may differ. HVS assumes that asimilar proportion of lodging properties report to STR and that the following
Market Wide HotelRooms
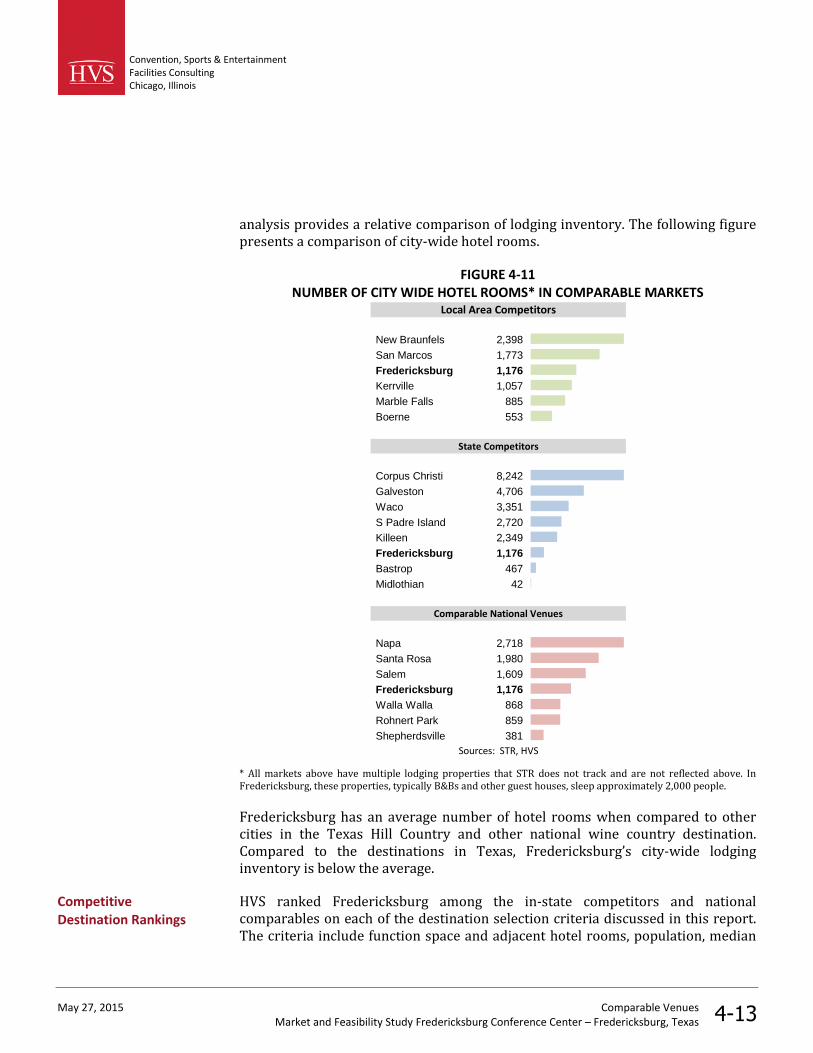
Convention, Sports & EntertainmentFacilities ConsultingChicago, Illinois
May 27, 2015 Comparable VenuesMarket and Feasibility Study Fredericksburg Conference Center – Fredericksburg, Texas 4-13
analysis provides a relative comparison of lodging inventory. The following figurepresents a comparison of city-wide hotel rooms.
FIGURE 4-11NUMBER OF CITY WIDE HOTEL ROOMS* IN COMPARABLE MARKETS
Local Area Competitors
New Braunfels 2,398
San Marcos 1,773
Fredericksburg 1,176
Kerrville 1,057
Marble Falls 885
Boerne 553
State Competitors
Corpus Christi 8,242
Galveston 4,706
Waco 3,351
S Padre Island 2,720
Killeen 2,349
Fredericksburg 1,176
Bastrop 467
Midlothian 42
Comparable National Venues
Napa 2,718
Santa Rosa 1,980
Salem 1,609
Fredericksburg 1,176
Walla Walla 868
Rohnert Park 859
Shepherdsville 381
Sources: STR, HVS
* All markets above have multiple lodging properties that STR does not track and are not reflected above. InFredericksburg, these properties, typically B&Bs and other guest houses, sleep approximately 2,000 people.
Fredericksburg has an average number of hotel rooms when compared to othercities in the Texas Hill Country and other national wine country destination.Compared to the destinations in Texas, Fredericksburg’s city-wide lodginginventory is below the average.
HVS ranked Fredericksburg among the in-state competitors and nationalcomparables on each of the destination selection criteria discussed in this report.The criteria include function space and adjacent hotel rooms, population, median
CompetitiveDestination Rankings

Convention, Sports & EntertainmentFacilities ConsultingChicago, Illinois
May 27, 2015 Comparable VenuesMarket and Feasibility Study Fredericksburg Conference Center – Fredericksburg, Texas 4-14
income, corporate presence, and the number of market wide hotel. The rank isbased on the numerical data associated with each criterion, with one being thehighest rank in each category. For the purpose of this comparison, HVS assumesthat the proposed FCC would include 20,000 square feet of total function spaceand a connected 150-room hotel property.
The figures below show Fredericksburg’s and each of the comparable venues’ rankon each criteria and the total of all scores.
FIGURE 4-12RANKING OF LOCAL AREA COMPETITORS
Venue
Total
Function
Space
Adjacent
Hotel
Capacity
City
Population
2-hour
Drive Time
Population
MSA
Median Inc
City
Businesses
2-hour
Drive Time
Businesses
Total Hotel
Rooms
Overall
Rank
Embassy Suites San Marcos Hotel 1 1 2 1 6 2 1 2 1
New Braunfels Convention Center 3 9 1 2 2 1 2 1 2
Horsehoe Bay Resort (Marble Falls) 2 2 6 3 4 6 3 5 3
Proposed Conference Center 4 5 5 4 3 5 4 3 4
Inn of the Hills (Kerrville) 5 4 3 6 5 3 6 4 5
The Resort at Tapatio Springs (Boerne) 6 6 4 5 1 4 5 6 6
Y.O. Ranch Hotel & Conference Center (Kerrville) 7 3 3 6 5 3 6 4 7
Riverbend Conference Center (Marble Falls) 9 7 6 3 4 6 3 5 8
The Retreat at Balcones Springs (Marble Falls) 8 8 6 3 4 6 3 5 9
Compared to eight other destinations in the Texas Hill Country, a proposed venuein Fredericksburg has the fourth overall highest rank, suggesting an above averagepotential to generate meeting and conference demand.
FIGURE 4-13RANKING OF COMPETITIVE IN-STATE CONVENTION CENTERS
Venue
Total
Function
Space
Adjacent
Hotel
Capacity
City
Population
2-hour
Drive Time
Population
MSA
Median Inc
City
Businesses
2-hour
Drive Time
Businesses
Total Hotel
Rooms
Overall
Rank
Waco Convention Center 2 3 3 1 8 2 1 3 1
American Bank Center (Corpus Christi) 1 5 1 8 6 1 8 1 2
Galveston Island Convention Center 5 1 4 4 7 4 4 2 3
Moody Gardens Convention Center (Galveston) 4 2 4 4 7 4 4 2 4
Ortiz International Center (Corpus Christi) 7 6 1 8 6 1 8 1 5
Killeen Civic and Conference Center 3 9 2 6 5 3 6 5 6
Midlothian Conference Center 9 8 5 2 1 6 2 8 7
Proposed Conference Center 8 4 6 5 4 5 5 6 8
South Padre Island Convention Center 6 7 8 7 2 8 7 4 9
Bastrop Convention & Exhibit Center 10 10 7 3 3 7 3 7 10
Compared to nine stand-alone convention centers in small to medium Texasmarkets, Fredericksburg ranks at or below average for all destination criteriaresulting in an overall rank of eighth.

Convention, Sports & EntertainmentFacilities ConsultingChicago, Illinois
May 27, 2015 Comparable VenuesMarket and Feasibility Study Fredericksburg Conference Center – Fredericksburg, Texas 4-15
FIGURE 4-14RANKING OF COMPARABLE NATIONAL VENUES
Venue
Total
Function
Space
Adjacent
Hotel
Capacity
City
Population
2-hour
Drive Time
Population
MSA
Median Inc
City
Businesses
2-hour
Drive Time
Businesses
Total Hotel
Rooms
Overall
Rank
Napa Valley Marriott Hotel & Spa (Napa, CA) 6 2 3 1 1 3 1 1 1
Silverado Resort & Spa (Napa, CA) 8 1 3 1 1 3 1 1 2
Meritage Resort & Spa (Napa, CA) 7 5 3 1 1 3 1 1 3
Hyatt Vineyard Creek Hotel & Spa (Santa Rosa, CA) 5 6 1 3 3 1 3 2 4
Double Tree Sonoma Wine Country (Rohnert Park, CA) 4 3 4 2 2 4 2 6 5
Salem Conference Center (Salem, OR) 1 4 2 6 5 2 5 3 6
Proposed Conference Center 2 7 7 4 4 6 4 4 7
Paroquet Springs Conference Centre (Shepherdsville, KY) 3 9 6 5 6 7 6 7 8
Whitman Hotel & Conference Center (Walla Walla, WA) 9 8 5 7 7 5 7 5 9
Compared to eight conference centers and hotels in wine country locationsthroughout the U.S., Fredericksburg ranks about average on destination criteriaresulting in an overall rank of seventh.
When analyzed in the context of the overall market characteristics presented inSection 2 of this report, a study of competitive and comparable cities and venuesindicates the appropriate building program for a conference center inFredericksburg. When compared to group meeting venues in competing localmarkets, Fredericksburg’ potential in the meetings industry is above average.However, within the State of Texas, Fredericksburg faces competition from severalstand-alone venues and hotels with large amounts of conference space. A study ofthe comparable national venues provides insight into the types of venues whichhave had success in similar wine country destinations.
HVS concludes that the size, quality, and overall suitability of Fredericksburg’scurrent meeting spaces are not commensurate with the city’s ability to attractgroup events. Without improvement, Fredericksburg may begin to lose business toother markets that are developing new meeting venues. With a properly designedand located conference facility, Fredericksburg’s established presence and overallattractiveness as a tourism destination should allow the city to significantlyexpand meeting demand from its current level. Several market factors couldtemper this demand potential, including limited air service and hotel availabilityduring prime tourism seasons.
Conclusions andImplications forFredericksburg

Convention, Sports & EntertainmentFacilities ConsultingChicago, Illinois
May 27, 2015 Survey FindingsMarket and Feasibility Study Fredericksburg Conference Center – Fredericksburg, Texas 5-1
5. Survey Findings
HVS designed and conducted a survey of event planners to provide a basis forassessing the potential demand for a conference center development inFredericksburg, Texas. This survey gathered information from professional eventplanners about their event needs and event destination preferences.
HVS collected contact information for 638 event planners from the FredericksburgConvention and Visitor Bureau (“FCVB”). Via email, HVS introduced the purpose ofthe survey and provided a link to the web-based survey. HVS also contracted withPlan Your Meetings to perform an email “Blast” to roughly 4,000 Texas-basedcorporate and association meeting planners. The Blast included similarinformation as the HVS email and also provided the survey link. Survey responsesincluded 121 completed survey and 49 partial surveys in which the respondentleft one or more questions blank.
The following summary of responses highlights key results.
To indicate whether this group of respondents fairly represents a cross section ofthe meeting industry, HVS collected data on the type of organization theyrepresent and the types of events they plan.
Survey respondents represent nearly 50 cities in the state with the largestmajority (39 percent) residing in Austin. Other well represented metro areasinclude Dallas (17 percent) and Houston (6 percent).
To understand the types of organizations responding to the survey, HVS askedrespondents a series of questions to describe the organizations they represent andtheir past use of venues in the market. Respondents may represent more than onetype of organization, as shown in the figure below.
FIGURE 5-1
RESPONDING ORGANIZATIONS BY TYPEAssociation 60%
Corporate 18%
Education 18%
Government 9%
Social 4%
Fraternal 2%
Sports 1%
Other 12%
Overview
Survey Respondents

Convention, Sports & EntertainmentFacilities ConsultingChicago, Illinois
May 27, 2015 Survey FindingsMarket and Feasibility Study Fredericksburg Conference Center – Fredericksburg, Texas 5-2
Event planners representing associations make up 60 percent of the sample,followed by those representing corporations and educational institutions whicheach represent approximately 20 percent of the sample.
HVS asked event planners to identify the types of events they plan.
FIGURE 5-2
TYPES OF EVENTS PLANNEDMeetings 89%
Conferences 82%
Training/Workshops 66%
Conventions 49%
Banquets 39%
Trade Shows 30%
Entertainment 13%
Sports Events 5%
Consumer Shows 4%
Meeting planners organize a wide variety of event types—most often meeting andconferences. Two-thirds plan training meetings and workshops, while nearly halfplan conventions.
The sample obtained through this survey appears to reflect a broad cross sectionof event planners that are typical of the make-up of the industry as a whole.
HVS asked event planners if they had planned an event in Fredericksburg duringthe past five years. See the figure below.
FIGURE 5-3
30%
70%
EVENT HELD IN FREDERICKSBURG DURINGPAST 5 YEARS
Yes
No
Past Events
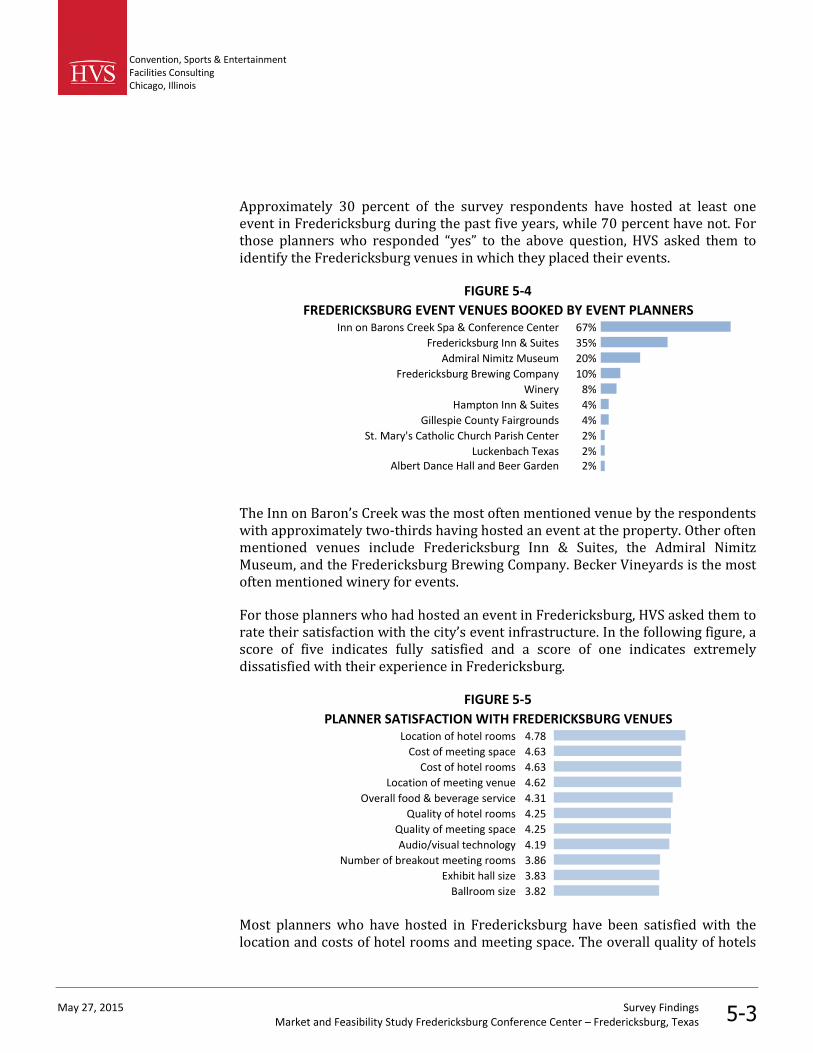
Convention, Sports & EntertainmentFacilities ConsultingChicago, Illinois
May 27, 2015 Survey FindingsMarket and Feasibility Study Fredericksburg Conference Center – Fredericksburg, Texas 5-3
Approximately 30 percent of the survey respondents have hosted at least oneevent in Fredericksburg during the past five years, while 70 percent have not. Forthose planners who responded “yes” to the above question, HVS asked them toidentify the Fredericksburg venues in which they placed their events.
FIGURE 5-4
FREDERICKSBURG EVENT VENUES BOOKED BY EVENT PLANNERSInn on Barons Creek Spa & Conference Center 67%
Fredericksburg Inn & Suites 35%
Admiral Nimitz Museum 20%
Fredericksburg Brewing Company 10%
Winery 8%
Hampton Inn & Suites 4%
Gillespie County Fairgrounds 4%
St. Mary's Catholic Church Parish Center 2%
Luckenbach Texas 2%Albert Dance Hall and Beer Garden 2%
The Inn on Baron’s Creek was the most often mentioned venue by the respondentswith approximately two-thirds having hosted an event at the property. Other oftenmentioned venues include Fredericksburg Inn & Suites, the Admiral NimitzMuseum, and the Fredericksburg Brewing Company. Becker Vineyards is the mostoften mentioned winery for events.
For those planners who had hosted an event in Fredericksburg, HVS asked them torate their satisfaction with the city’s event infrastructure. In the following figure, ascore of five indicates fully satisfied and a score of one indicates extremelydissatisfied with their experience in Fredericksburg.
FIGURE 5-5
PLANNER SATISFACTION WITH FREDERICKSBURG VENUESLocation of hotel rooms 4.78
Cost of meeting space 4.63
Cost of hotel rooms 4.63
Location of meeting venue 4.62
Overall food & beverage service 4.31
Quality of hotel rooms 4.25
Quality of meeting space 4.25
Audio/visual technology 4.19
Number of breakout meeting rooms 3.86
Exhibit hall size 3.83
Ballroom size 3.82
Most planners who have hosted in Fredericksburg have been satisfied with thelocation and costs of hotel rooms and meeting space. The overall quality of hotels

Convention, Sports & EntertainmentFacilities ConsultingChicago, Illinois
May 27, 2015 Survey FindingsMarket and Feasibility Study Fredericksburg Conference Center – Fredericksburg, Texas 5-4
and meeting space ranks slightly lower. Planners are less satisfied with the size ofevent spaces as well as the number of available meeting rooms.
In an unaided question, HVS asked the 70 percent of event planners who have notheld an event in Fredericksburg to identify why. HVS classified their answers intothe categories shown in the figure below.
FIGURE 5-6
REASONS FOR NOT HOSTING EVENT IN FREDERICKSBURGInadequate meeting venues 37%
Inadequate hotel rooms, amenity level 22%
Geographic location, distance to major cities 22%
Distance from major airport 19%
Internal preference, budget contraints 14%
Lack of knowledge, have not considered 13%
Not perceived as group destination 7%
Meeting planners most often indicated the lack of sufficient meeting space as theprimary reason for not hosting their events in Fredericksburg. Inadequate hotelrooms and the lack of resort amenities received several mentions as didFredericksburg’s distance to major cities and airports. Several planners indicated alack of knowledge about the destination and their perception that Fredericksburgis not a group destination.
HVS asked all event planners to identify up to five facilities outside ofFredericksburg in which they have recently held events. Respondents noted avariety of hotels, convention centers, conference centers, and other venues. Thefollowing figure shows the percentage of venue use by type.
FIGURE 5-7RECENTLY BOOKED EVENTS BY TYPE OF VENUE
Hotels and Resorts 77%
Convention/Conference Center 16%
Restaurant, Museum, Other 4%
University Venue 1%
Hotels and resorts make up over three-quarters of all other venues in which eventplanners have booked events. Convention and conference centers make upanother 16 percent.
In total, planners reported hosting events in over 100 cities, with over 90 percentof those cities in the State of Texas. The following figure shows the Texas cities inwhich event planners most frequently place events.
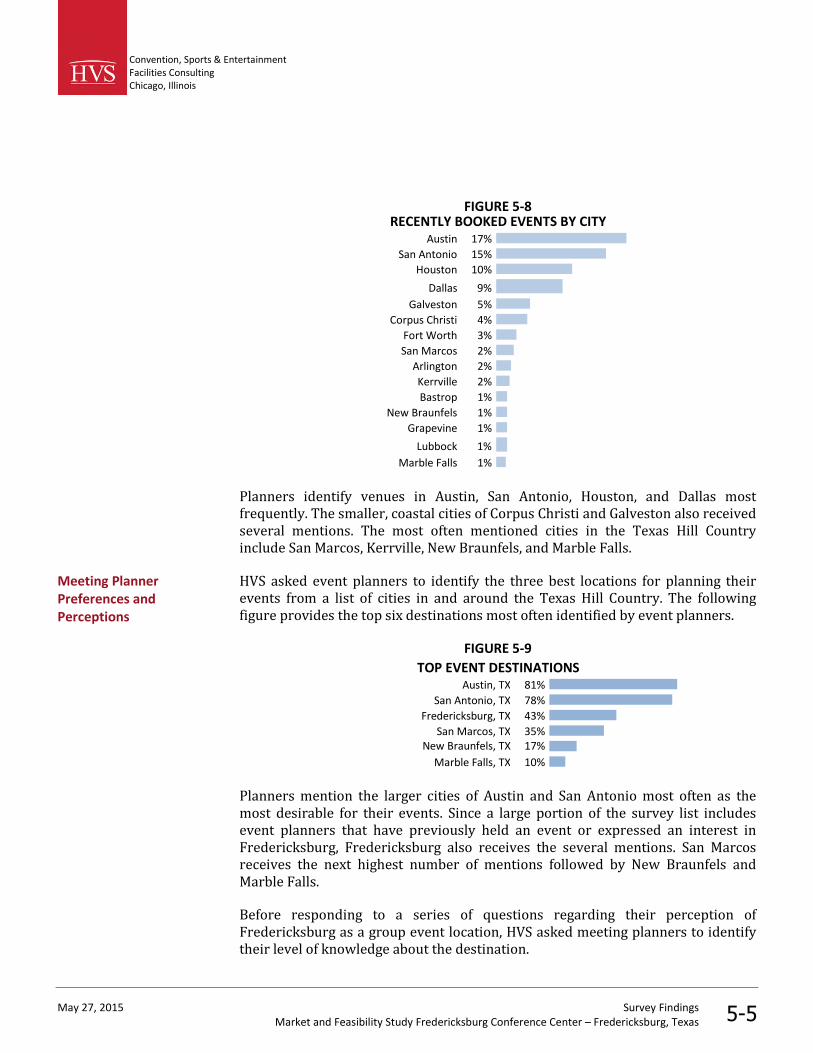
Convention, Sports & EntertainmentFacilities ConsultingChicago, Illinois
May 27, 2015 Survey FindingsMarket and Feasibility Study Fredericksburg Conference Center – Fredericksburg, Texas 5-5
FIGURE 5-8RECENTLY BOOKED EVENTS BY CITY
Austin 17%
San Antonio 15%
Houston 10%
Dallas 9%
Galveston 5%
Corpus Christi 4%
Fort Worth 3%
San Marcos 2%
Arlington 2%
Kerrville 2%
Bastrop 1%
New Braunfels 1%
Grapevine 1%
Lubbock 1%
Marble Falls 1%
Planners identify venues in Austin, San Antonio, Houston, and Dallas mostfrequently. The smaller, coastal cities of Corpus Christi and Galveston also receivedseveral mentions. The most often mentioned cities in the Texas Hill Countryinclude San Marcos, Kerrville, New Braunfels, and Marble Falls.
HVS asked event planners to identify the three best locations for planning theirevents from a list of cities in and around the Texas Hill Country. The followingfigure provides the top six destinations most often identified by event planners.
FIGURE 5-9
TOP EVENT DESTINATIONSAustin, TX 81%
San Antonio, TX 78%
Fredericksburg, TX 43%
San Marcos, TX 35%New Braunfels, TX 17%
Marble Falls, TX 10%
Planners mention the larger cities of Austin and San Antonio most often as themost desirable for their events. Since a large portion of the survey list includesevent planners that have previously held an event or expressed an interest inFredericksburg, Fredericksburg also receives the several mentions. San Marcosreceives the next highest number of mentions followed by New Braunfels andMarble Falls.
Before responding to a series of questions regarding their perception ofFredericksburg as a group event location, HVS asked meeting planners to identifytheir level of knowledge about the destination.
Meeting PlannerPreferences andPerceptions
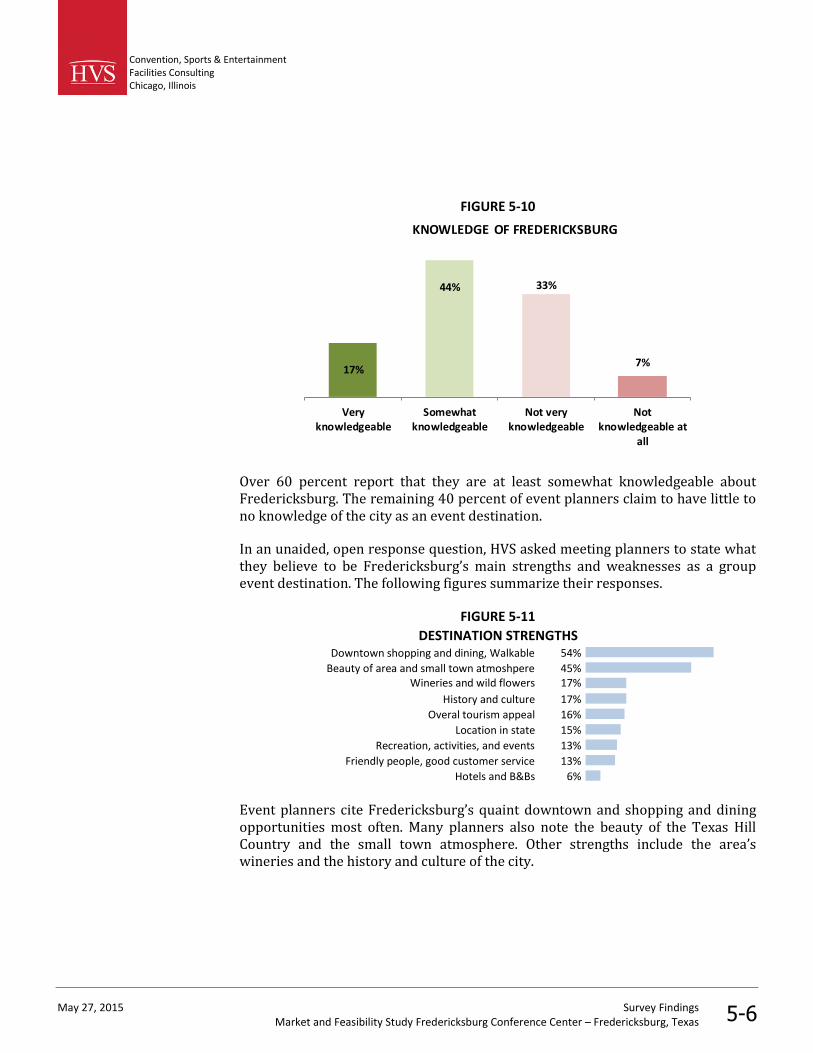
Convention, Sports & EntertainmentFacilities ConsultingChicago, Illinois
May 27, 2015 Survey FindingsMarket and Feasibility Study Fredericksburg Conference Center – Fredericksburg, Texas 5-6
FIGURE 5-10
17%
44% 33%
7%
Veryknowledgeable
Somewhatknowledgeable
Not veryknowledgeable
Notknowledgeable at
all
KNOWLEDGE OF FREDERICKSBURG
Over 60 percent report that they are at least somewhat knowledgeable aboutFredericksburg. The remaining 40 percent of event planners claim to have little tono knowledge of the city as an event destination.
In an unaided, open response question, HVS asked meeting planners to state whatthey believe to be Fredericksburg’s main strengths and weaknesses as a groupevent destination. The following figures summarize their responses.
FIGURE 5-11
DESTINATION STRENGTHSDowntown shopping and dining, Walkable 54%
Beauty of area and small town atmoshpere 45%Wineries and wild flowers 17%
History and culture 17%
Overal tourism appeal 16%
Location in state 15%
Recreation, activities, and events 13%
Friendly people, good customer service 13%
Hotels and B&Bs 6%
Event planners cite Fredericksburg’s quaint downtown and shopping and diningopportunities most often. Many planners also note the beauty of the Texas HillCountry and the small town atmosphere. Other strengths include the area’swineries and the history and culture of the city.

Convention, Sports & EntertainmentFacilities ConsultingChicago, Illinois
May 27, 2015 Survey FindingsMarket and Feasibility Study Fredericksburg Conference Center – Fredericksburg, Texas 5-7
FIGURE 5-12
DESTINATION WEAKNESSESLocation, too far from airport, major cities 50%
Insufficient meeting space, outdated 45%
Lack of hotel rooms, no full service property 24%
Too small, lack of activities and entertainment 8%
Perception as weekend getaway 6%
Weekend crowds 5%
High room rates 5%
Event planners most frequently cited Fredericksburg’s location as its primaryweakness as an event destination. Planners also note the City’s lack of meetingspace for larger events. Fredericksburg’s smaller hotels and lack of a full serviceproperty also received several mentions from event planners.
Some destination attributes such as the availability of destination amenitiesappear as both strengths and weaknesses, which reflects the variety of locations,perspectives, and needs of event planners.
HVS asked survey respondents to identity their five most important criteria whenselecting an event destination. The following figure presents the percentage ofsurvey respondents who indicated which selection criteria ranked in their top five.
FIGURE 5-13
PERCENTAGE OF PLANNERS WHO CONSIDER CRITERIA MOST IMPORTANTPrice of hotel rooms 64%
Price of facility rentals 62%
Availability of facility event space 61%
Availability of hotel rooms 48%
Geographic location within state 38%
Quality of hotel rooms 32%Dining, retail & entertainment options 30%
Overall level of destination appeal 26%
Convenience for drive-in visitors 26%
Proximity of hotels to event spaces 26%
Availability of air travel 21%
Ability to attract attendees 21%
Recreation, tourism & cultural activities 11%Availability of convenient nearby parking 9%
Adequate technology services 8%
Safety 8%
Cleanliness 8%
Green building and conferencing practices 1%
Most event planners cited the price of hotel rooms and event space and theavailability of adequate facility event space as the important criteria when

Convention, Sports & EntertainmentFacilities ConsultingChicago, Illinois
May 27, 2015 Survey FindingsMarket and Feasibility Study Fredericksburg Conference Center – Fredericksburg, Texas 5-8
selecting an event location. Just under half of the planners noted that theavailability of hotel rooms also helps determine their choice. The geographiclocation, hotel quality, and dining, retail and entertainment options also rankhighly among the respondents. Approximately one-quarter of event plannersidentified the proximity of hotel rooms to event space as one of their top fivecriteria.
HVS then asked event planners to rate Fredericksburg on these same criteria. Inthe following figure, a rating of five means excellent and a rating of one meanspoor.
FIGURE 5-14
PLANNERS' SCORE OF FREDERICKSBURG ON CRITERIASafety 4.3
Overall level of destination appeal 4.3
Ability to attract attendees 4.2
Cleanliness 4.0
Recreation, tourism & cultural activities 3.9
Price of facility rentals 3.9
Price of hotel rooms 3.9
Dining, retail & entertainment options 3.8
Proximity of hotels to event spaces 3.6
Convenience for drive-in visitors 3.5
Availability of hotel rooms 3.4
Geographic location within state 3.4
Quality of hotel rooms 3.3
Availability of convenient nearby parking 3.3
Availability of facility event space 3.2
Adequate technology services 2.5
Green building and conferencing practices 2.0
Availability of air travel 1.9
Fredericksburg received excellent ratings for the relatively important criteria ofoverall destination appeal and ability to attract attendees. It also ranks high onother criteria, such as safety and cleanliness. However, these criteria are lessimportant to event planners, and therefore, do not create a significant advantagefor the destination. Fredericksburg received above average ratings on pricing andaverage ratings on hotel room availability and geographic location.
To understand the relative impact of these perceptions, HVS created a net score oreach criteria and weighted each net score by its importance as shown below.
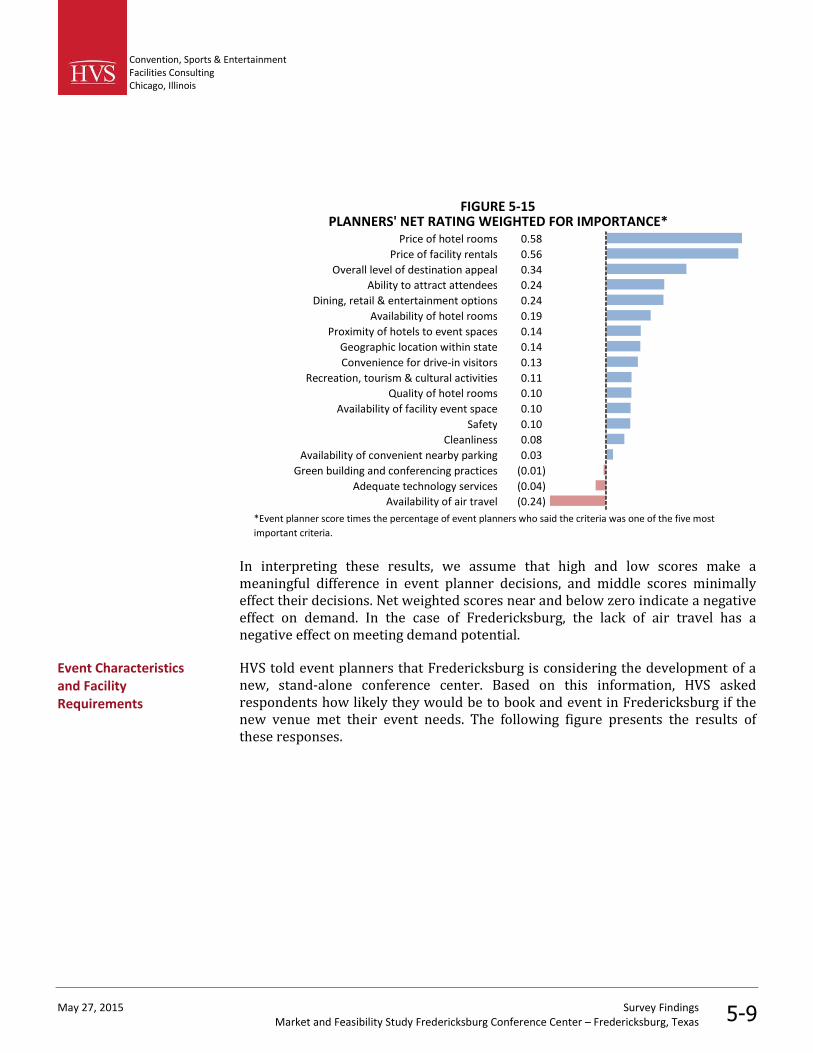
Convention, Sports & EntertainmentFacilities ConsultingChicago, Illinois
May 27, 2015 Survey FindingsMarket and Feasibility Study Fredericksburg Conference Center – Fredericksburg, Texas 5-9
FIGURE 5-15PLANNERS' NET RATING WEIGHTED FOR IMPORTANCE*
Price of hotel rooms 0.58
Price of facility rentals 0.56
Overall level of destination appeal 0.34
Ability to attract attendees 0.24
Dining, retail & entertainment options 0.24
Availability of hotel rooms 0.19
Proximity of hotels to event spaces 0.14
Geographic location within state 0.14
Convenience for drive-in visitors 0.13
Recreation, tourism & cultural activities 0.11
Quality of hotel rooms 0.10
Availability of facility event space 0.10
Safety 0.10
Cleanliness 0.08
Availability of convenient nearby parking 0.03
Green building and conferencing practices (0.01)
Adequate technology services (0.04)
Availability of air travel (0.24)
*Event planner score times the percentage of event planners who said the criteria was one of the five most
important criteria.
In interpreting these results, we assume that high and low scores make ameaningful difference in event planner decisions, and middle scores minimallyeffect their decisions. Net weighted scores near and below zero indicate a negativeeffect on demand. In the case of Fredericksburg, the lack of air travel has anegative effect on meeting demand potential.
HVS told event planners that Fredericksburg is considering the development of anew, stand-alone conference center. Based on this information, HVS askedrespondents how likely they would be to book and event in Fredericksburg if thenew venue met their event needs. The following figure presents the results ofthese responses.
Event Characteristicsand FacilityRequirements
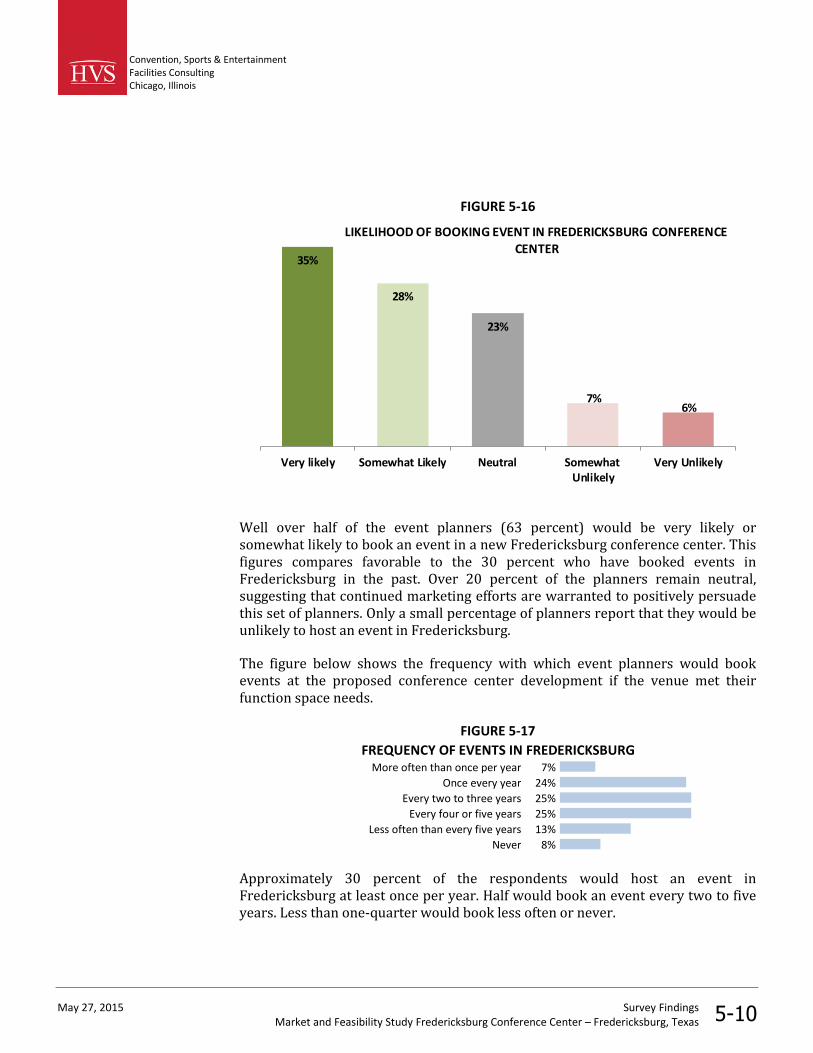
Convention, Sports & EntertainmentFacilities ConsultingChicago, Illinois
May 27, 2015 Survey FindingsMarket and Feasibility Study Fredericksburg Conference Center – Fredericksburg, Texas 5-10
FIGURE 5-16
35%
28%
23%
7%6%
Very likely Somewhat Likely Neutral SomewhatUnlikely
Very Unlikely
LIKELIHOOD OF BOOKING EVENT IN FREDERICKSBURG CONFERENCECENTER
Well over half of the event planners (63 percent) would be very likely orsomewhat likely to book an event in a new Fredericksburg conference center. Thisfigures compares favorable to the 30 percent who have booked events inFredericksburg in the past. Over 20 percent of the planners remain neutral,suggesting that continued marketing efforts are warranted to positively persuadethis set of planners. Only a small percentage of planners report that they would beunlikely to host an event in Fredericksburg.
The figure below shows the frequency with which event planners would bookevents at the proposed conference center development if the venue met theirfunction space needs.
FIGURE 5-17
FREQUENCY OF EVENTS IN FREDERICKSBURGMore often than once per year 7%
Once every year 24%
Every two to three years 25%
Every four or five years 25%
Less often than every five years 13%
Never 8%
Approximately 30 percent of the respondents would host an event inFredericksburg at least once per year. Half would book an event every two to fiveyears. Less than one-quarter would book less often or never.

Convention, Sports & EntertainmentFacilities ConsultingChicago, Illinois
May 27, 2015 Survey FindingsMarket and Feasibility Study Fredericksburg Conference Center – Fredericksburg, Texas 5-11
HVS told event planners that Fredericksburg is also considering the developmentof a conference center hotel. Based on this information HVS asked respondentshow likely they would be to book an event in Fredericksburg if the meeting spaceand adjacent hotel met their event needs. The following figure presents the resultsof these responses.
FIGURE 5-18
35%
30%
21%
9%
5%
Very likely Somewhat Likely Neutral SomewhatUnlikely
Very Unlikely
LIKELIHOOD OF BOOKING EVENT IN FREDERICKSBURGCONFERENCE CENTER HOTEL
With the inclusion of an adjacent hotel, the percentage of event planners thatwould be likely to host an event in Fredericksburg increases modestly from 63 to65 percent.
HVS asked event planners how often they would book events at conference centerhotel in Fredericksburg if the venue and hotel met their function space needs.
FIGURE 5-19
More often than once per year 8%
Once every year 23%
Every two to three years 26%
Every four or five years 21%
Less often than every five years 17%
Never 9%
FREQUENCY OF EVENTS IN FREDERICKSBURG
With the inclusion of an adjacent hotel, event planners indicate only a modestchange in the frequency of event than for a stand-alone center.
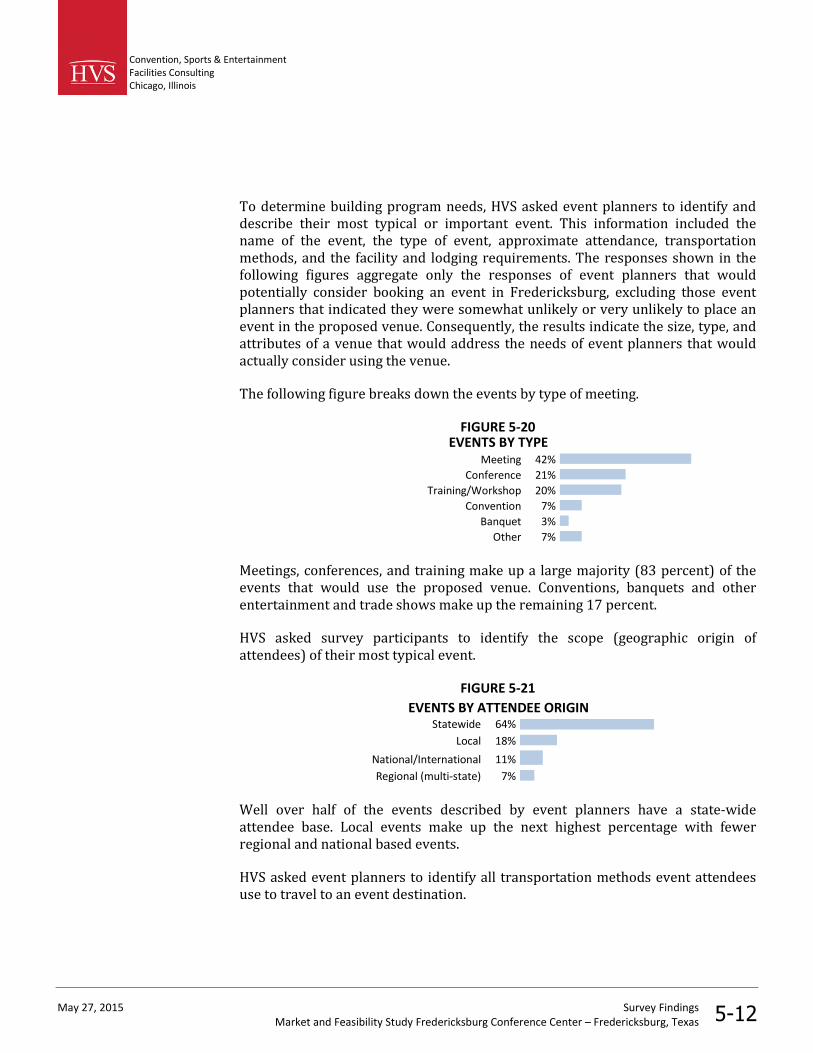
Convention, Sports & EntertainmentFacilities ConsultingChicago, Illinois
May 27, 2015 Survey FindingsMarket and Feasibility Study Fredericksburg Conference Center – Fredericksburg, Texas 5-12
To determine building program needs, HVS asked event planners to identify anddescribe their most typical or important event. This information included thename of the event, the type of event, approximate attendance, transportationmethods, and the facility and lodging requirements. The responses shown in thefollowing figures aggregate only the responses of event planners that wouldpotentially consider booking an event in Fredericksburg, excluding those eventplanners that indicated they were somewhat unlikely or very unlikely to place anevent in the proposed venue. Consequently, the results indicate the size, type, andattributes of a venue that would address the needs of event planners that wouldactually consider using the venue.
The following figure breaks down the events by type of meeting.
FIGURE 5-20EVENTS BY TYPE
Meeting 42%
Conference 21%
Training/Workshop 20%
Convention 7%
Banquet 3%
Other 7%
Meetings, conferences, and training make up a large majority (83 percent) of theevents that would use the proposed venue. Conventions, banquets and otherentertainment and trade shows make up the remaining 17 percent.
HVS asked survey participants to identify the scope (geographic origin ofattendees) of their most typical event.
FIGURE 5-21
EVENTS BY ATTENDEE ORIGINStatewide 64%
Local 18%
National/International 11%
Regional (multi-state) 7%
Well over half of the events described by event planners have a state-wideattendee base. Local events make up the next highest percentage with fewerregional and national based events.
HVS asked event planners to identify all transportation methods event attendeesuse to travel to an event destination.
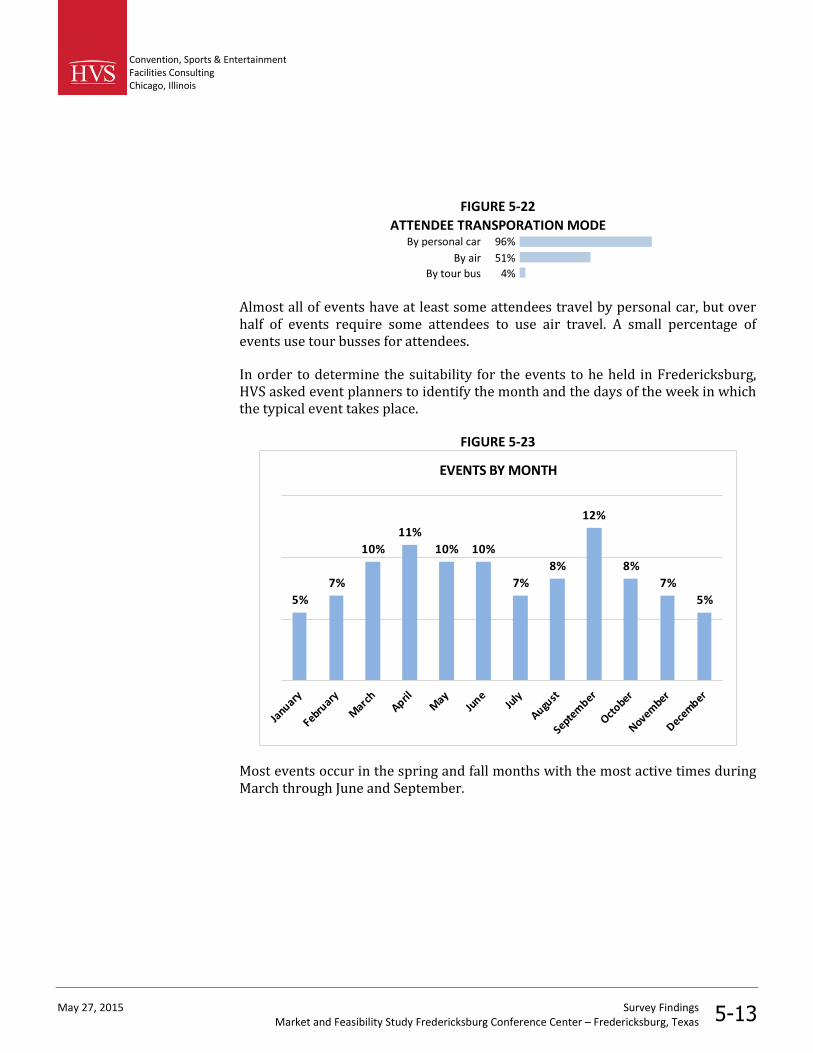
Convention, Sports & EntertainmentFacilities ConsultingChicago, Illinois
May 27, 2015 Survey FindingsMarket and Feasibility Study Fredericksburg Conference Center – Fredericksburg, Texas 5-13
FIGURE 5-22
ATTENDEE TRANSPORATION MODEBy personal car 96%
By air 51%
By tour bus 4%
Almost all of events have at least some attendees travel by personal car, but overhalf of events require some attendees to use air travel. A small percentage ofevents use tour busses for attendees.
In order to determine the suitability for the events to he held in Fredericksburg,HVS asked event planners to identify the month and the days of the week in whichthe typical event takes place.
FIGURE 5-23
5%
7%
10%
11%
10% 10%
7%
8%
12%
8%
7%
5%
EVENTS BY MONTH
Most events occur in the spring and fall months with the most active times duringMarch through June and September.
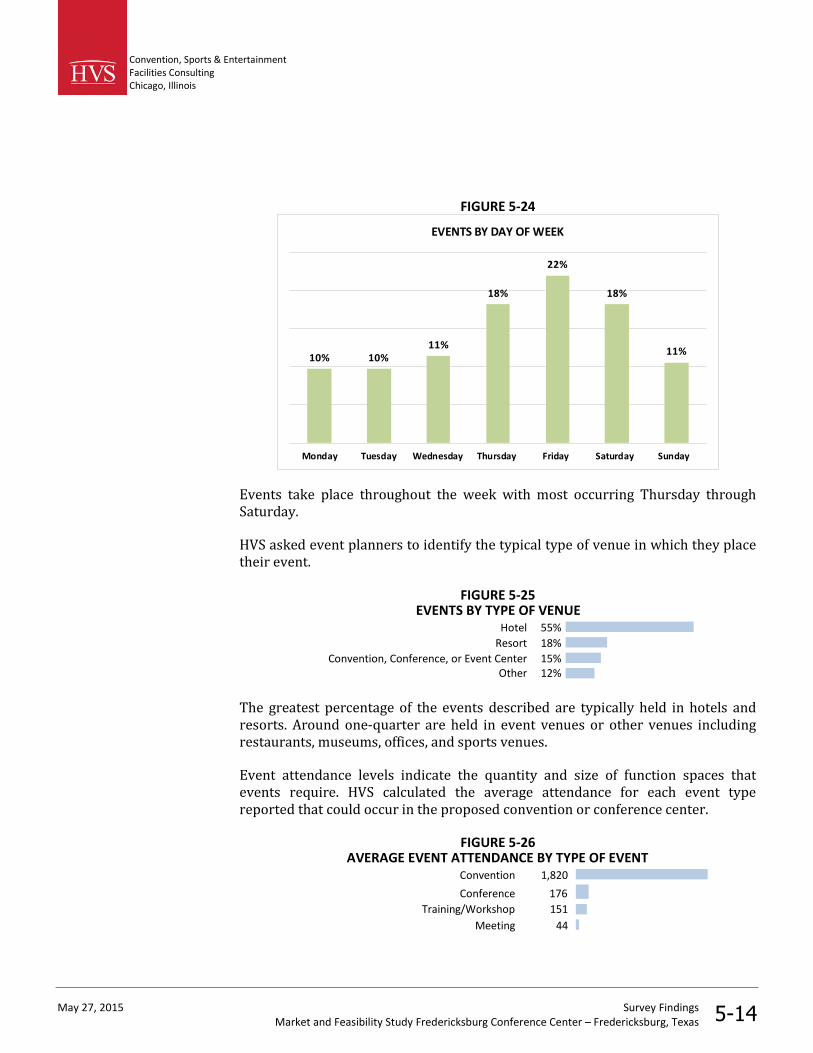
Convention, Sports & EntertainmentFacilities ConsultingChicago, Illinois
May 27, 2015 Survey FindingsMarket and Feasibility Study Fredericksburg Conference Center – Fredericksburg, Texas 5-14
FIGURE 5-24
10% 10%11%
18%
22%
18%
11%
Monday Tuesday Wednesday Thursday Friday Saturday Sunday
EVENTS BY DAY OF WEEK
Events take place throughout the week with most occurring Thursday throughSaturday.
HVS asked event planners to identify the typical type of venue in which they placetheir event.
FIGURE 5-25EVENTS BY TYPE OF VENUE
Hotel 55%
Resort 18%
Convention, Conference, or Event Center 15%Other 12%
The greatest percentage of the events described are typically held in hotels andresorts. Around one-quarter are held in event venues or other venues includingrestaurants, museums, offices, and sports venues.
Event attendance levels indicate the quantity and size of function spaces thatevents require. HVS calculated the average attendance for each event typereported that could occur in the proposed convention or conference center.
FIGURE 5-26AVERAGE EVENT ATTENDANCE BY TYPE OF EVENT
Convention 1,820
Conference 176
Training/Workshop 151
Meeting 44
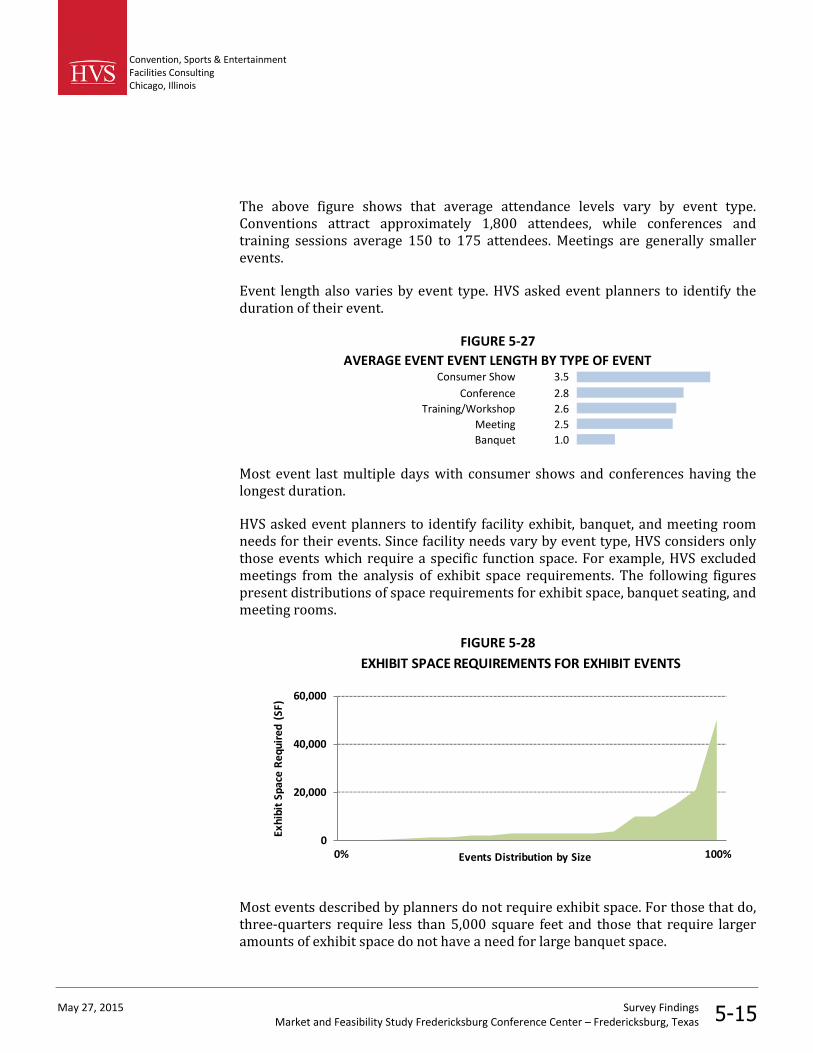
Convention, Sports & EntertainmentFacilities ConsultingChicago, Illinois
May 27, 2015 Survey FindingsMarket and Feasibility Study Fredericksburg Conference Center – Fredericksburg, Texas 5-15
The above figure shows that average attendance levels vary by event type.Conventions attract approximately 1,800 attendees, while conferences andtraining sessions average 150 to 175 attendees. Meetings are generally smallerevents.
Event length also varies by event type. HVS asked event planners to identify theduration of their event.
FIGURE 5-27
AVERAGE EVENT EVENT LENGTH BY TYPE OF EVENTConsumer Show 3.5
Conference 2.8
Training/Workshop 2.6
Meeting 2.5
Banquet 1.0
Most event last multiple days with consumer shows and conferences having thelongest duration.
HVS asked event planners to identify facility exhibit, banquet, and meeting roomneeds for their events. Since facility needs vary by event type, HVS considers onlythose events which require a specific function space. For example, HVS excludedmeetings from the analysis of exhibit space requirements. The following figurespresent distributions of space requirements for exhibit space, banquet seating, andmeeting rooms.
FIGURE 5-28
0
20,000
40,000
60,000
Exhi
bit
Spac
eR
equ
ired
(SF)
Events Distribution by Size
EXHIBIT SPACE REQUIREMENTS FOR EXHIBIT EVENTS
0% 100%
Most events described by planners do not require exhibit space. For those that do,three-quarters require less than 5,000 square feet and those that require largeramounts of exhibit space do not have a need for large banquet space.

Convention, Sports & EntertainmentFacilities ConsultingChicago, Illinois
May 27, 2015 Survey FindingsMarket and Feasibility Study Fredericksburg Conference Center – Fredericksburg, Texas 5-16
FIGURE 5-29
0
200
400
600
800
1,000#
Ban
que
tS
eats
Req
uir
ed
Event Distribution By Size
BANQUET SEATING REQUIREMENTS FOR ALL EVENT TYPES
0% 100%
Most events require banquet seating for their attendees. Approximately 90 percentof the events require banquet seating for 250 people or less.
FIGURE 5-30
0
5
10
15
20
Num
ber
ofM
eeti
ngR
oom
sR
equi
red
Events Distribution by Size
MEETING ROOM REQUIREMENTS FOR ALL EVENT TYPES
0% 100%
Most events also require breakout meeting space. Approximately 88 percent ofevents require 10 meeting rooms or fewer.
The above figures provide insight into the exhibit space, banquet seating, andmeeting room requirements for typical events that event planners could book inFredericksburg. These results also inform program recommendations as well aspotential event demand and attendance projections.

Convention, Sports & EntertainmentFacilities ConsultingChicago, Illinois
May 27, 2015 Survey FindingsMarket and Feasibility Study Fredericksburg Conference Center – Fredericksburg, Texas 5-17
Hotel room block requirements for conventions, conferences, and other events canvary significantly and do not necessarily follow attendance levels.
FIGURE 5-31
0
200
400
600
800S
ize
ofPe
akH
ote
lRoo
mB
lock
Re
quir
ed
Events Distribution by Size
EVENT PEAK HOTEL ROOM BLOCK REQUIREMENTS
0% 100%
Around 90 percent of events described by planners require a peak meeting roomblock of fewer than 200 rooms, and 75 percent require fewer than 100 rooms.
HVS asked event planners to identify their preferred and maximum number ofhotel properties necessary to accommodate their room block. The vast majority ofplanners (87 percent) prefer a single hotel property accommodate their entireroom block. The following figure presents the maximum number of hotelproperties that would be acceptable to event planners.
FIGURE 5-32
53%
38%
8%
2%
0%
10%
20%
30%
40%
50%
60%
1 2 to 4 5 to 9 10+
MAXIMUM HOTEL PROPERTIES IN ROOM BLOCK
Hotel Room BlockRequirements
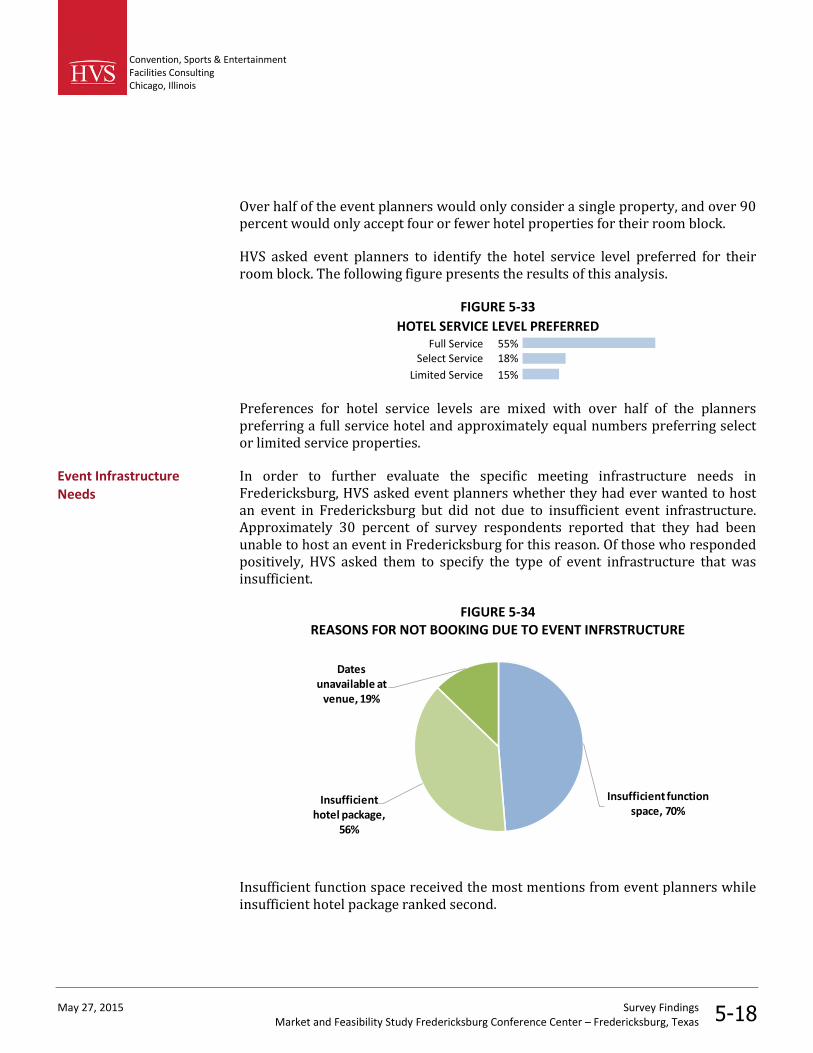
Convention, Sports & EntertainmentFacilities ConsultingChicago, Illinois
May 27, 2015 Survey FindingsMarket and Feasibility Study Fredericksburg Conference Center – Fredericksburg, Texas 5-18
Over half of the event planners would only consider a single property, and over 90percent would only accept four or fewer hotel properties for their room block.
HVS asked event planners to identify the hotel service level preferred for theirroom block. The following figure presents the results of this analysis.
FIGURE 5-33
HOTEL SERVICE LEVEL PREFERREDFull Service 55%
Select Service 18%
Limited Service 15%
Preferences for hotel service levels are mixed with over half of the plannerspreferring a full service hotel and approximately equal numbers preferring selector limited service properties.
In order to further evaluate the specific meeting infrastructure needs inFredericksburg, HVS asked event planners whether they had ever wanted to hostan event in Fredericksburg but did not due to insufficient event infrastructure.Approximately 30 percent of survey respondents reported that they had beenunable to host an event in Fredericksburg for this reason. Of those who respondedpositively, HVS asked them to specify the type of event infrastructure that wasinsufficient.
FIGURE 5-34REASONS FOR NOT BOOKING DUE TO EVENT INFRSTRUCTURE
Insufficient functionspace, 70%
Insufficienthotel package,
56%
Datesunavailable at
venue, 19%
Insufficient function space received the most mentions from event planners whileinsufficient hotel package ranked second.
Event InfrastructureNeeds
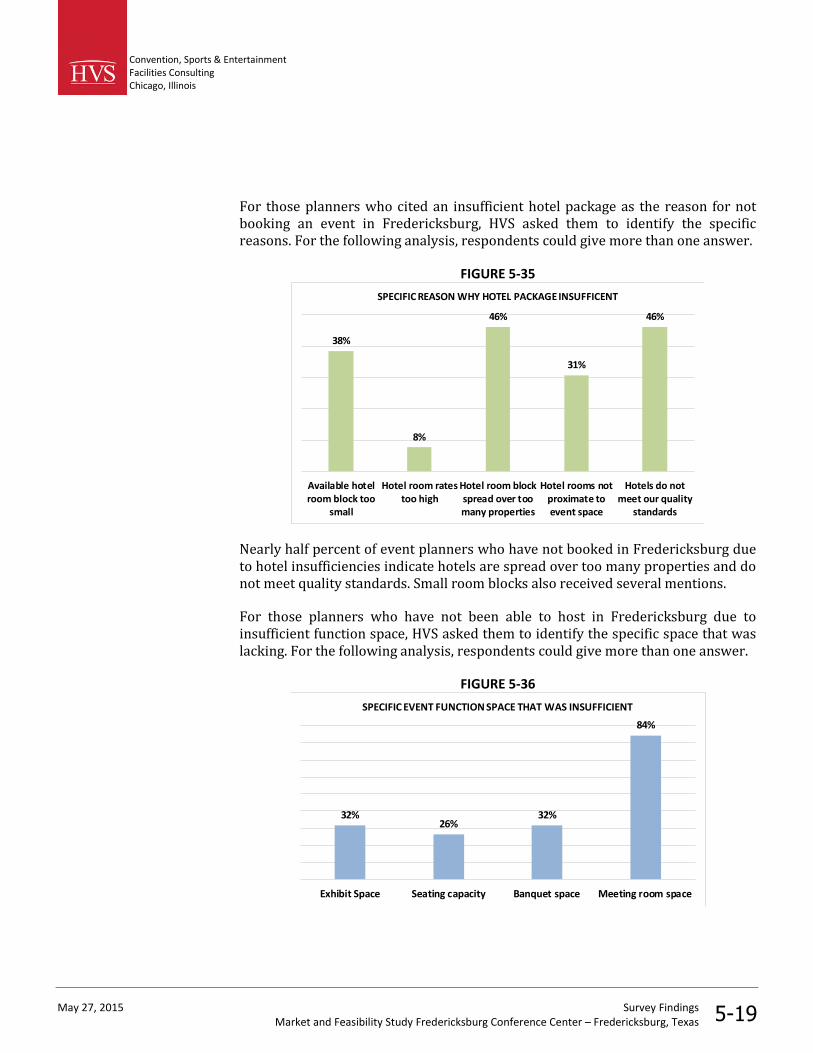
Convention, Sports & EntertainmentFacilities ConsultingChicago, Illinois
May 27, 2015 Survey FindingsMarket and Feasibility Study Fredericksburg Conference Center – Fredericksburg, Texas 5-19
For those planners who cited an insufficient hotel package as the reason for notbooking an event in Fredericksburg, HVS asked them to identify the specificreasons. For the following analysis, respondents could give more than one answer.
FIGURE 5-35
38%
8%
46%
31%
46%
Available hotelroom block too
small
Hotel room ratestoo high
Hotel room blockspread over toomany properties
Hotel rooms notproximate toevent space
Hotels do notmeet our quality
standards
SPECIFIC REASON WHY HOTEL PACKAGE INSUFFICENT
Nearly half percent of event planners who have not booked in Fredericksburg dueto hotel insufficiencies indicate hotels are spread over too many properties and donot meet quality standards. Small room blocks also received several mentions.
For those planners who have not been able to host in Fredericksburg due toinsufficient function space, HVS asked them to identify the specific space that waslacking. For the following analysis, respondents could give more than one answer.
FIGURE 5-36
32%26%
32%
84%
Exhibit Space Seating capacity Banquet space Meeting room space
SPECIFIC EVENT FUNCTION SPACE THAT WAS INSUFFICIENT

Convention, Sports & EntertainmentFacilities ConsultingChicago, Illinois
May 27, 2015 Survey FindingsMarket and Feasibility Study Fredericksburg Conference Center – Fredericksburg, Texas 5-20
Almost 85 percent of respondents noted a lack of breakout meeting space inFredericksburg and over 30 percent indicated that there is insufficient ballroomand exhibit space.
Survey respondents provide a good sample representation of the target market forthe proposed conference center with the majority of planners representingassociations, corporate businesses, and education groups in Texas. The eventplanners represent a variety of entities and plan a range of meeting and eventtypes and sizes. Key findings and conclusions include the following:
Based on historical bookings and event planner perceptions, the strongestcompetition for the proposed conference center in Fredericksburg would comefrom hotel properties in the surrounding metropolitan areas of Austin and SanAntonio and the Texas Hill Country destination of San Marcos.
For those planners who have booked an event in Fredericksburg, most havebeen satisfied with the location and cost of hotel rooms and meeting venues.Many are less satisfied with the quality of meeting venues and hotel rooms.Aspects related to the size of event spaces received the lowest rankings fromplanners.
The greatest deterrents to event planners considering Fredericksburg for anevent are its distance from major cities and airports and its lack of adequatevenues in which to place events. Specifically, planners identified the lack of fullservice hotel properties and meetings space which is too small and dated.
Fredericksburg has several strengths as a group event destination, includingits quaint downtown, dining and retail amenities, and natural beauty. Otherplanners note the area’s wineries and the history and culture of the city asdesirable attributes.
Given a conference center which suits their needs, over 60 percent of theplanners feel that they would be “likely” or “somewhat likely” to book an eventat the proposed venue in Fredericksburg. This figures increases slightly to 65percent when planners were asked to consider a conference center hotel. Bothof these figures compare favorably to the 30 percent of respondents who hadbooked events in Fredericksburg in the past.
Approximately 90 percent of events described by event planners could beaccommodated by a venue with banquet seating for 250 people, 10 meetingrooms, and around 5,000 square feet of exhibit space.
Approximately 90 percent of the events described by event planners require ahotel room block of less than 200 rooms, and 75 percent of events require aroom block of less than 100 rooms. The greatest majority of event plannersprefer to book a room block in one full service hotel but would accept a blockof up to four properties.
Survey Conclusions andImplications forFredericksburg
Convention, Sports & EntertainmentFacilities ConsultingChicago, Illinois
May 27, 2015 Survey FindingsMarket and Feasibility Study Fredericksburg Conference Center – Fredericksburg, Texas 5-21
Of those planners who have not been able to book an event in Fredericksburg,70 note a lack of function space as the primary reason. Planners indicate a lackof adequate meeting most often.
Convention, Sports & EntertainmentFacilities ConsultingChicago, Illinois
May 27, 2015 Building Program RecommendationsMarket and Feasibility Study Fredericksburg Conference Center – Fredericksburg, Texas 6-1
6. Building Program Recommendations
In this section, HVS provides market driven recommendation for the developmentof a Fredericksburg Convention Center (“FCC”). The market area analysis, eventplanner survey, and analysis of comparable and competitive markets indicate thatthe development of a FCC would allow the city to grow its current meeting andconference demand, offering event planners an additional option for events in theTexas Hill Country
The facility recommendations presented herein describe the floor areas of varioustypes of function spaces and other important convention center amenities. Toformulate the recommendations for the proposed development, HVS relied on thefollowing.
An review of existing meeting and convention infrastructure inFredericksburg,
An in-depth user survey,
An analysis of event space programming in competitive venues andcomparable markets,
Interviews with Fredericksburg Convention & Visitors Bureau (“FCVB”) staffregarding existing meeting demand and lost business, and
Knowledge of standard industry practices.
The development program presented in this section should serve as a guide forsubsequent physical planning aimed at providing the desired facility elements.
In terms of function space, Fredericksburg’ largest convention hotel property isthe Hangar Hotel and Airport Conference Center which houses approximately20,000 square feet of function space. With only 50 hotel rooms and locatedsouthwest of downtown Fredericksburg, this property lacks convenient access torestaurants, retail shops, and other lodging to support its function space. The Innon Barons Creek, with 6,000 square feet, the Fredericksburg Inn and Suites, with3,700 square feet, and the Hampton Inn with 2,500 square feet represent thelargest hotel meeting venues in downtown Fredericksburg. While they offer higherquality space, these properties do not offer adequate amounts of function space formany events.
Convention, Sports & EntertainmentFacilities ConsultingChicago, Illinois
May 27, 2015 Building Program RecommendationsMarket and Feasibility Study Fredericksburg Conference Center – Fredericksburg, Texas 6-2
Other event spaces in Fredericksburg include the Gillespie County Fairgrounds,dance halls, restaurants, and function rooms in museums and churches. Thesevenues are suitable for banquets and social functions, but do not contain thebreakout meetings spaces necessary to support a conference or small convention.
HVS’s survey of event planners indicates that many factors influence planners’selection processes when considering Fredericksburg as an event destination.Fredericksburg’s existing reputation throughout Texas as a desirable tourismdestination suggests that expanded event space could allow the City to expand itspresence in the group meetings industry. If the development of a conferencecenter in Fredericksburg produced a venue that suited their needs, around 65percent of respondents report that they would likely host an event there. Thiscompares favorably to the 30 percent of survey respondents who have held anevent in Fredericksburg in the recent past.
HVS program recommendations for the proposed FCC would place Fredericksburgin a position to attract a significant number of new meetings and conferences tothe Fredericksburg market. The venue could also serve the customer basecurrently using other smaller, older facilities in Fredericksburg, allowing manyevents which face venue size restrictions to grow and remain in Fredericksburg.
Functional requirements of the proposed FCC revolve around the principle that thevenue must host simultaneous events with different venue needs, such as socialevents that use banquet space and corporate meetings that use a combination ofmeeting and banquet space. Banquet and meeting spaces should have sufficientsize to accommodate large conferences with flexible divisions that can also serveas meeting and banquet space for smaller association and corporate events. Backof house spaces, including the loading dock and storage areas, should servemultiple events without hindering the efficiency of another event’s operation.Specific recommendations include the following elements.
A 12,000 square foot multipurpose ballroom with a flexible wall system toallow the space to divide into three sections that could serve as space forbanquets, light exhibition, and large assembly meeting space, and
A 5,500 square foot meeting room block with a variety of large and smallmeeting spaces,
The following figure provides a summary of FCC functions spaces. Detaileddescriptions of FCC function and support spaces follow.
ProgramRecommendations

Convention, Sports & EntertainmentFacilities ConsultingChicago, Illinois
May 27, 2015 Building Program RecommendationsMarket and Feasibility Study Fredericksburg Conference Center – Fredericksburg, Texas 6-3
FIGURE 6-1FCC BUILDING PROGRAM RECOMMENDATIONS
Total Area
(SF)Theatre Banquet Classroom
Exhibit
Booths
(10'x10')
Multipurpose Ballroom 12,000 1,330 710 830 70
Sub-Divisions
Division 1 4,000 440 240 280
Sub-division 1a 2,000 220 120 140
Sub-division 1b 2,000 220 120 140
Division 2 4,000 440 240 280
Division 3 4,000 440 240 280
Sub-division 3a 2,000 220 120 140
Sub-division 3b 2,000 220 120 140
Meeting Rooms 5,500
Medium (2 at 1,500 sf) 3,000 170 90 100
Small (2 at 750 sf) 1,500 30 10 20
Board Rooms (2 at 500 sf) 1,000
TOTAL MEETING SPACE 17,500
Capacities
Event Space
Site constraints and other design issues would affect the final layout of themultipurpose ballroom. To allow for maximum flexibility as light exhibit, banquet,and meeting space, the multi-purpose ballroom should be carpeted with durablewall finishes and ceilings heights suitable for exhibit and banquet events. Themulti-purpose ballroom should have convenient access to a main lobby and otherpre-function spaces which are either stand-alone or shared with other functionspaces. Service access should be such that each division of the multi-purpose hallhas independent rear access allowing an event to take place in one division whileanother is being serviced for a separate event. The following figure provides ofconceptual plan of the proposed multi-purpose hall.
Multipurpose Ballroom

Convention, Sports & EntertainmentFacilities ConsultingChicago, Illinois
May 27, 2015 Building Program RecommendationsMarket and Feasibility Study Fredericksburg Conference Center – Fredericksburg, Texas 6-4
FIGURE 6-2MULTIPURPOSE BALLROOM CONCEPTUAL LAYOUT
Meeting space is essential to provide breakout space for larger conference andmeeting events and to support stand-alone meetings and food and beveragefunctions. Many events require banquet space which is separate and distinct froma meeting room block. While site constraints and other design issues will affect thefinal layout of these functional spaces, configuration of the meeting room blockshould be such that they conveniently support the new multipurpose hall. HVSrecommends that the new meeting space be located in flexible blocks in areaswhich are conveniently accessible for attendees and efficiently serviced by eventstaff.
In addition to the function spaces provided above, the gross floor area of the FCCwould include the following elements:
Lobby and Pre-function Areas – A well-appointed lobby and pre-function areas provide meeting planners areas for greeting andregistration, social gatherings, and well-defined public access to themultipurpose hall and meeting rooms. This space is also appropriatefor stand-alone receptions, meals, and other community events.
Circulation – Circulation space provides for the movement of attendeesinto and through the FCC. These areas would include hallways,
Pre-Function Area
Service Corridor
Meeting Spaces
Event Support andService Spaces

Convention, Sports & EntertainmentFacilities ConsultingChicago, Illinois
May 27, 2015 Building Program RecommendationsMarket and Feasibility Study Fredericksburg Conference Center – Fredericksburg, Texas 6-5
connecting walkways, and bridges as required. Depending on theconcept plan, these areas could also include vertical circulation(stairwells, elevators, and escalators).
Service access – Service corridors provide non-public access to theevent hall and meeting rooms as well as connection to the facility’sloading docks, mechanical rooms, and storage.
Drop-off zone – The FCC should have a well-defined vehicular drop-offarea and pedestrian access solely for the use of event attendees.
Loading areas – Service access that is separate from the drop-off zone,truck docks, and waste disposal areas necessary to support the FCCexpansion.
Kitchen – Depending on final site selection, further investigationshould determine whether a main FCC production kitchen is necessary.At a minimum, a new pantry kitchen should be incorporated into theFCC space.
Storage – Adequate and convenient equipment storage is important tothe efficient operation of the facility.
Facility Operations – Spaces needed to support facility’s managementand physical plant, including offices, HVAC, plumbing, electrical andfire protection systems.
Including the above spaces, HVS estimates that the total gross size of theproposed FCC would be approximately 40,000 square feet. A more precisedetermination of the floor areas would require a concept plan created by adesign firm that illustrates how the proposed convention center would fiton the selected site. The process of concept planning would likely requireadjustments to the recommended floor areas.
Convention, Sports & EntertainmentFacilities ConsultingChicago, Illinois
May 27, 2015 Demand AnalysisMarket and Feasibility Study Fredericksburg Conference Center – Fredericksburg, Texas 7-1
7. Demand Analysis
HVS based event demand projections for the proposed Fredericksburg ConferenceCenter (“FCC”) on the following research and analysis;
the program recommendations presented in Section 6 of this report,
an in-depth user survey detailed in Section 5,
industry data and trends reports,
key market and economic indicators outlined in Section 2,
comparable venue program and demand data presented in Section 4, and
discussions with representatives from the Fredericksburg Convention andVisitor Bureau (“FCVB”) management and sales staff and other localstakeholders.
For the purposes of this study, HVS assumes that all recommendations throughoutthis report are completed by January 1, 2018. HVS estimates that event demandwould stabilize in 2021, the fourth year of operation. Demand projections alsoassume the presence of a highly qualified, professional sales and managementteam for the proposed FCC.
The FCVB is the primary sales and marketing organization dedicated to bringingmeetings and other group events to Fredericksburg. The organization works withthe local hotels and other venues to solicit business through proposals and othermarketing efforts. The FCVB reports that Fredericksburg has lost severalopportunities for group business due to its lack of appropriate meeting space. Thislost business is often association or corporate business which typically requiresevent space to contain separate banquet and breakout meeting spaces in a singlefacility. This situation is corroborated by the HVS user survey in which nearly 30percent of survey respondents reported that they have wanted to host an event inFredericksburg but were unable to book the event due to insufficient eventinfrastructure. Of those planners, 70 percent cited insufficient event space as theprimary reason for not booking their event in Fredericksburg.
Recent lost business includes the Texas Hill Country Chapter of Meeting PlannersInternational which requires 15,000 square feet of meeting space forapproximately 200 attendees and the Texas Society of Anesthesiologists whichrequires 10,000 square feet, including numerous breakout meeting rooms for its
Lost Business

Convention, Sports & EntertainmentFacilities ConsultingChicago, Illinois
May 27, 2015 Demand AnalysisMarket and Feasibility Study Fredericksburg Conference Center – Fredericksburg, Texas 7-2
400 attendees. In general, Fredericksburg’s current event facilities are capable ofhosting events with up to 200 attendees, but cannot offer those events separatespaces for both meals and break out meetings.
Based on user survey results, Fredericksburg often loses business to other cities inthe Texas Hill Country, including San Marcos, New Braunfels, Kerrville, and MarbleFalls. Each of these destinations has at least one venue with ballroom and meetingspace ranging from 12,000 to 42,000 square feet of total function space.
HVS’s analysis of comparable and competitive venues and an in-depth user surveysuggest that the proposed FCC should allow Fredericksburg to grow its currentmeeting and convention demand in the face of strengthening competition fromother regional markets. The development could also serve the customer basecurrently using smaller, older facilities in Fredericksburg, allowing many eventswhich face venue size restrictions to grow and remain in Fredericksburg.
In addition to attracting out of town users, the proposed FCC could become avaluable public asset providing event space to a variety of local groups, includinglocal government, civic organizations, nonprofits, schools, charities, andbusinesses. The multipurpose ballroom and meeting spaces would supportmeetings, fundraisers, exams, social events, recitals, sports competitions,graduation, health screenings, press conferences, and many other civic uses.
HVS based demand projections on the completion of the FCC by January 1, 2018.HVS estimates that following the completion of the proposed venue, incrementalevent demand would ramp up and stabilize after three years, during calendar year2021. The figure below breaks down convention center event projections by typeof event. Projections begin in the 2018 calendar year and go through 2022, oneyear following stabilized demand. Total attendance figures represent individualevent attendees. A brief description of event types and demand assumptionsfollows.
Conference CenterDemand Projections
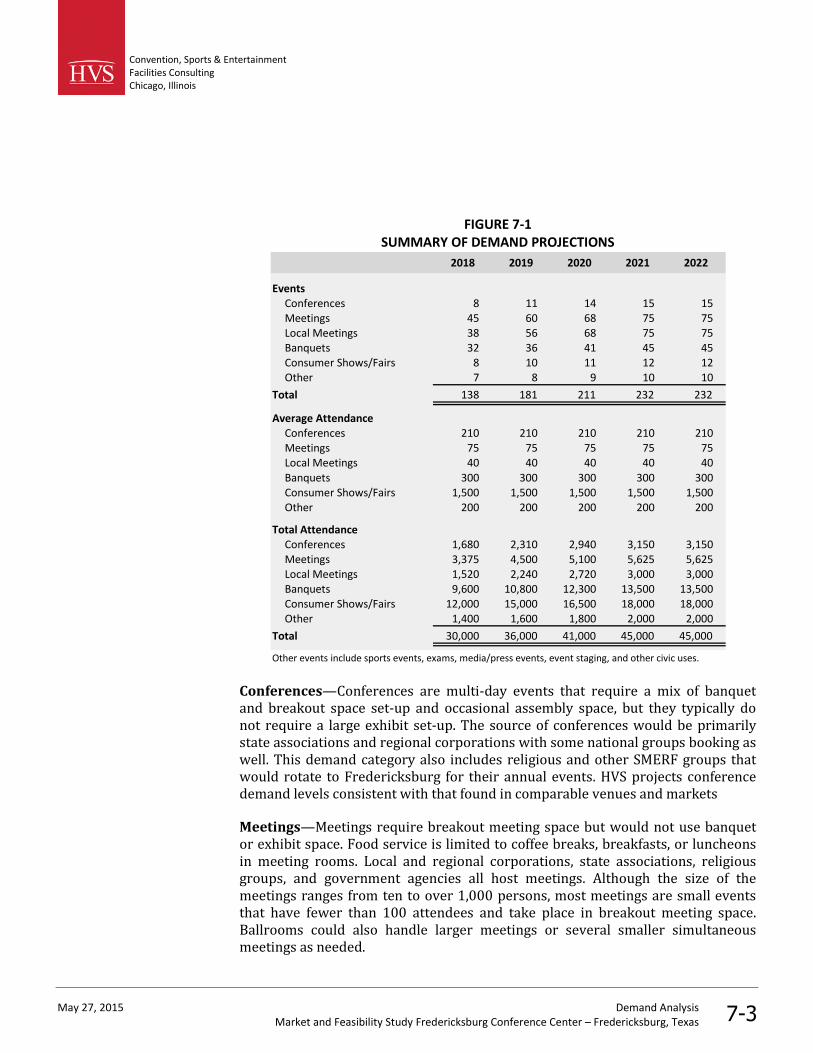
Convention, Sports & EntertainmentFacilities ConsultingChicago, Illinois
May 27, 2015 Demand AnalysisMarket and Feasibility Study Fredericksburg Conference Center – Fredericksburg, Texas 7-3
FIGURE 7-1SUMMARY OF DEMAND PROJECTIONS
2018 2019 2020 2021 2022
EventsConferences 8 11 14 15 15Meetings 45 60 68 75 75Local Meetings 38 56 68 75 75Banquets 32 36 41 45 45Consumer Shows/Fairs 8 10 11 12 12Other 7 8 9 10 10
Total 138 181 211 232 232
Average AttendanceConferences 210 210 210 210 210Meetings 75 75 75 75 75Local Meetings 40 40 40 40 40
Banquets 300 300 300 300 300Consumer Shows/Fairs 1,500 1,500 1,500 1,500 1,500Other 200 200 200 200 200
Total AttendanceConferences 1,680 2,310 2,940 3,150 3,150Meetings 3,375 4,500 5,100 5,625 5,625Local Meetings 1,520 2,240 2,720 3,000 3,000Banquets 9,600 10,800 12,300 13,500 13,500Consumer Shows/Fairs 12,000 15,000 16,500 18,000 18,000Other 1,400 1,600 1,800 2,000 2,000
Total 30,000 36,000 41,000 45,000 45,000
Other events include sports events, exams, media/press events, event staging, and other civic uses.
Conferences—Conferences are multi-day events that require a mix of banquetand breakout space set-up and occasional assembly space, but they typically donot require a large exhibit set-up. The source of conferences would be primarilystate associations and regional corporations with some national groups booking aswell. This demand category also includes religious and other SMERF groups thatwould rotate to Fredericksburg for their annual events. HVS projects conferencedemand levels consistent with that found in comparable venues and markets
Meetings—Meetings require breakout meeting space but would not use banquetor exhibit space. Food service is limited to coffee breaks, breakfasts, or luncheonsin meeting rooms. Local and regional corporations, state associations, religiousgroups, and government agencies all host meetings. Although the size of themeetings ranges from ten to over 1,000 persons, most meetings are small eventsthat have fewer than 100 attendees and take place in breakout meeting space.Ballrooms could also handle larger meetings or several smaller simultaneousmeetings as needed.
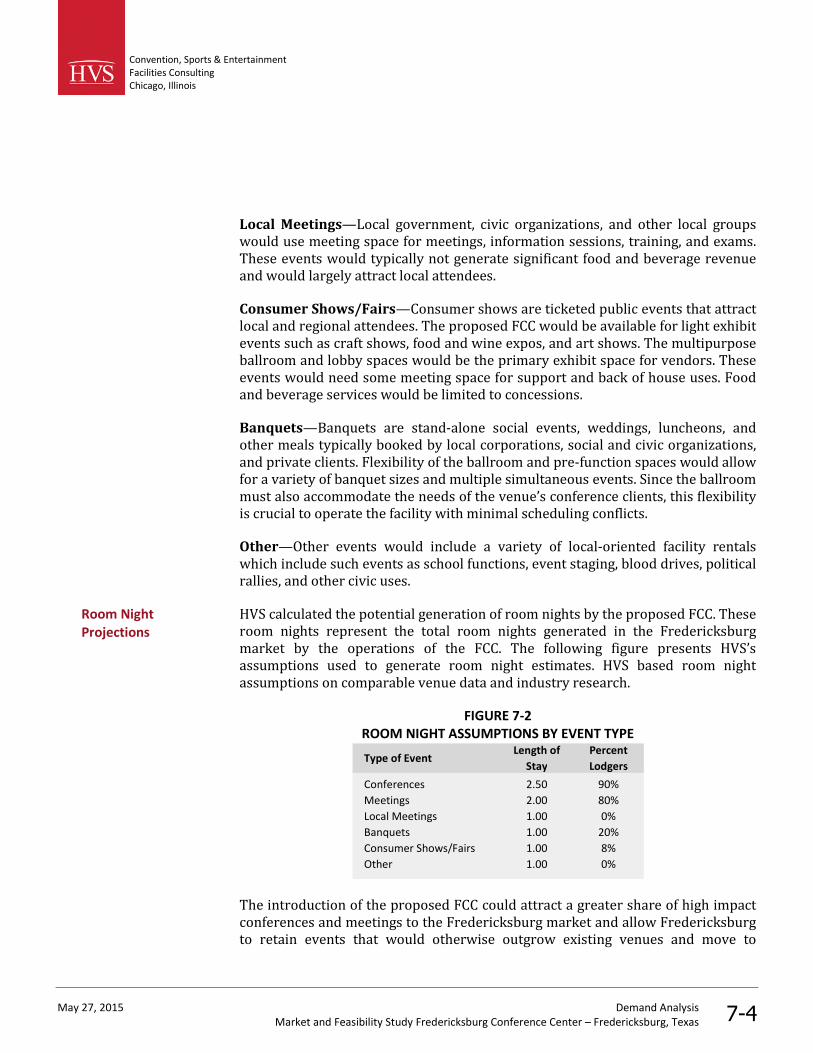
Convention, Sports & EntertainmentFacilities ConsultingChicago, Illinois
May 27, 2015 Demand AnalysisMarket and Feasibility Study Fredericksburg Conference Center – Fredericksburg, Texas 7-4
Local Meetings—Local government, civic organizations, and other local groupswould use meeting space for meetings, information sessions, training, and exams.These events would typically not generate significant food and beverage revenueand would largely attract local attendees.
Consumer Shows/Fairs—Consumer shows are ticketed public events that attractlocal and regional attendees. The proposed FCC would be available for light exhibitevents such as craft shows, food and wine expos, and art shows. The multipurposeballroom and lobby spaces would be the primary exhibit space for vendors. Theseevents would need some meeting space for support and back of house uses. Foodand beverage services would be limited to concessions.
Banquets—Banquets are stand-alone social events, weddings, luncheons, andother meals typically booked by local corporations, social and civic organizations,and private clients. Flexibility of the ballroom and pre-function spaces would allowfor a variety of banquet sizes and multiple simultaneous events. Since the ballroommust also accommodate the needs of the venue’s conference clients, this flexibilityis crucial to operate the facility with minimal scheduling conflicts.
Other—Other events would include a variety of local-oriented facility rentalswhich include such events as school functions, event staging, blood drives, politicalrallies, and other civic uses.
HVS calculated the potential generation of room nights by the proposed FCC. Theseroom nights represent the total room nights generated in the Fredericksburgmarket by the operations of the FCC. The following figure presents HVS’sassumptions used to generate room night estimates. HVS based room nightassumptions on comparable venue data and industry research.
FIGURE 7-2ROOM NIGHT ASSUMPTIONS BY EVENT TYPE
Type of EventLength of
Stay
Percent
Lodgers
Conferences 2.50 90%
Meetings 2.00 80%
Local Meetings 1.00 0%
Banquets 1.00 20%
Consumer Shows/Fairs 1.00 8%
Other 1.00 0%
The introduction of the proposed FCC could attract a greater share of high impactconferences and meetings to the Fredericksburg market and allow Fredericksburgto retain events that would otherwise outgrow existing venues and move to
Room NightProjections
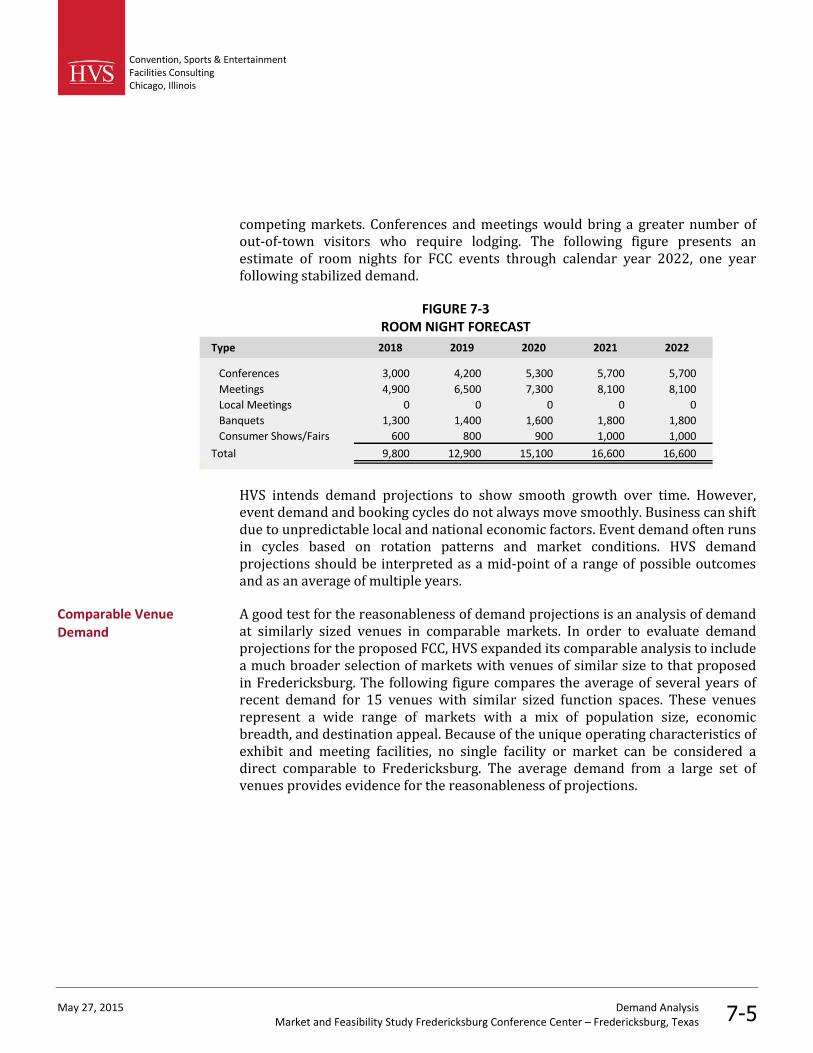
Convention, Sports & EntertainmentFacilities ConsultingChicago, Illinois
May 27, 2015 Demand AnalysisMarket and Feasibility Study Fredericksburg Conference Center – Fredericksburg, Texas 7-5
competing markets. Conferences and meetings would bring a greater number ofout-of-town visitors who require lodging. The following figure presents anestimate of room nights for FCC events through calendar year 2022, one yearfollowing stabilized demand.
FIGURE 7-3ROOM NIGHT FORECAST
Type 2018 2019 2020 2021 2022
Conferences 3,000 4,200 5,300 5,700 5,700
Meetings 4,900 6,500 7,300 8,100 8,100
Local Meetings 0 0 0 0 0
Banquets 1,300 1,400 1,600 1,800 1,800
Consumer Shows/Fairs 600 800 900 1,000 1,000
Total 9,800 12,900 15,100 16,600 16,600
HVS intends demand projections to show smooth growth over time. However,event demand and booking cycles do not always move smoothly. Business can shiftdue to unpredictable local and national economic factors. Event demand often runsin cycles based on rotation patterns and market conditions. HVS demandprojections should be interpreted as a mid-point of a range of possible outcomesand as an average of multiple years.
A good test for the reasonableness of demand projections is an analysis of demandat similarly sized venues in comparable markets. In order to evaluate demandprojections for the proposed FCC, HVS expanded its comparable analysis to includea much broader selection of markets with venues of similar size to that proposedin Fredericksburg. The following figure compares the average of several years ofrecent demand for 15 venues with similar sized function spaces. These venuesrepresent a wide range of markets with a mix of population size, economicbreadth, and destination appeal. Because of the unique operating characteristics ofexhibit and meeting facilities, no single facility or market can be considered adirect comparable to Fredericksburg. The average demand from a large set ofvenues provides evidence for the reasonableness of projections.
Comparable VenueDemand
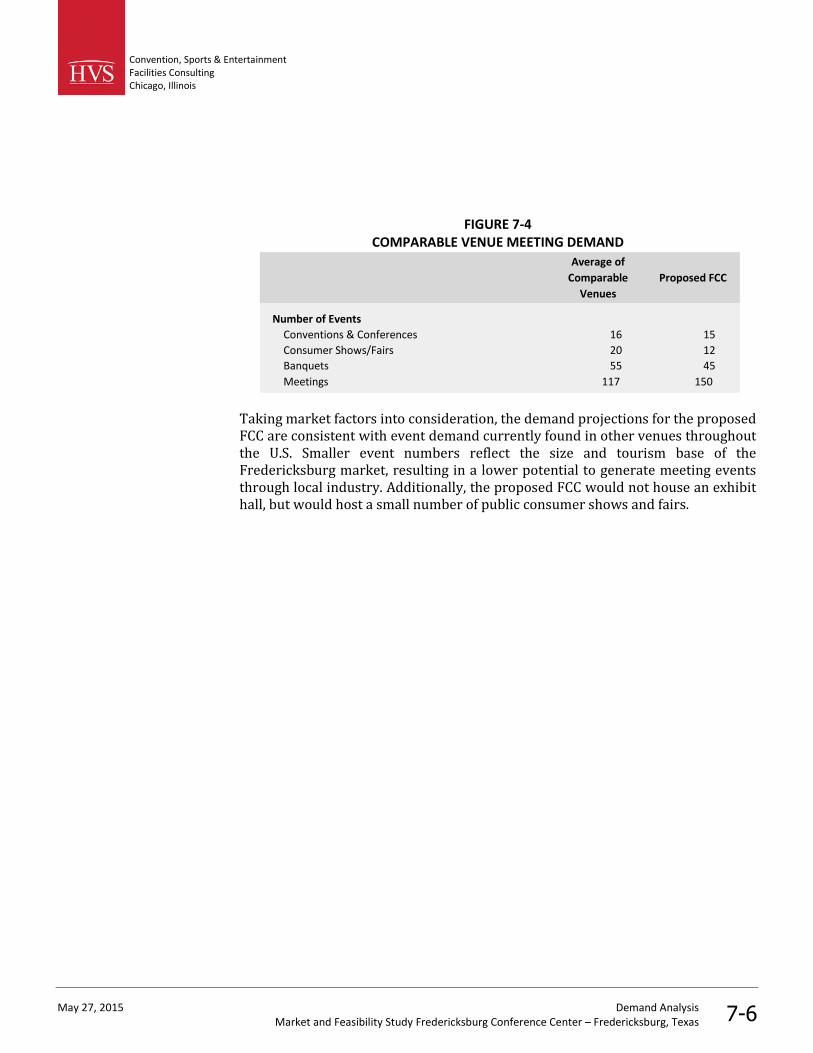
Convention, Sports & EntertainmentFacilities ConsultingChicago, Illinois
May 27, 2015 Demand AnalysisMarket and Feasibility Study Fredericksburg Conference Center – Fredericksburg, Texas 7-6
FIGURE 7-4COMPARABLE VENUE MEETING DEMAND
Average of
Comparable
Venues
Proposed FCC
Number of Events
Conventions & Conferences 16 15
Consumer Shows/Fairs 20 12
Banquets 55 45
Meetings 117 150
Taking market factors into consideration, the demand projections for the proposedFCC are consistent with event demand currently found in other venues throughoutthe U.S. Smaller event numbers reflect the size and tourism base of theFredericksburg market, resulting in a lower potential to generate meeting eventsthrough local industry. Additionally, the proposed FCC would not house an exhibithall, but would host a small number of public consumer shows and fairs.
Convention, Sports & Entertainment Facilities Consulting Chicago, Illinois
May 27, 2015 Hotel Supply and Demand Analysis Market and Feasibility Study Fredericksburg Conference Center – Fredericksburg, Texas 8-1
8. Hotel Supply and Demand Analysis
This section examines the regional and local Fredericksburg hotel markets, looks at the impact of recently opened and proposed properties, and shows projected changes in rooms supply, room night demand, occupancy, average daily rates (“ADR”), and Revenue per Available Room (“RevPAR”). For the purposes of this study, HVS defines the “regional hotel market” as midscale to upscale hotels within a 45-mile radius of Fredericksburg. We consider midscale to upscale properties in the city of Fredericksburg as the “local hotel market”. Regional and local hotel markets only include properties that report operating performance to Smith Travel Research (“STR Global”). The regional hotel market focuses on similar properties in the cities surrounding Fredericksburg and did not extend to Austin or San Antonio.
The regional hotel market benefits from a variety of tourist and leisure attractions in the area. March to October comprise the peak months for tourism in this area. During other times of the year, weekend demand involves travelers passing through en route to other destinations, people visiting friends or relatives, and other similar weekend demand generators. The cities of San Antonio to the south and Austin to the east provide consistent weekend leisure demand from residents wishing to enjoy the many outdoor activities, shopping, and dining available in the Texas Hill Country. The primary attractions in the area are presented in the Market Overview, Chapter 2 of this report.
Current and historical market performances of potential competitors serve as the basis for determining the feasibility of developing new hotels. The table below contains the specific properties in the STR Global Custom Trend Report used to calculate historical supply, demand, and ADR trends for the regional hotel market. The list of properties runs from oldest to newest in the regional hotel market.
Hotel Demand Generators
Historical Supply and Demand Data
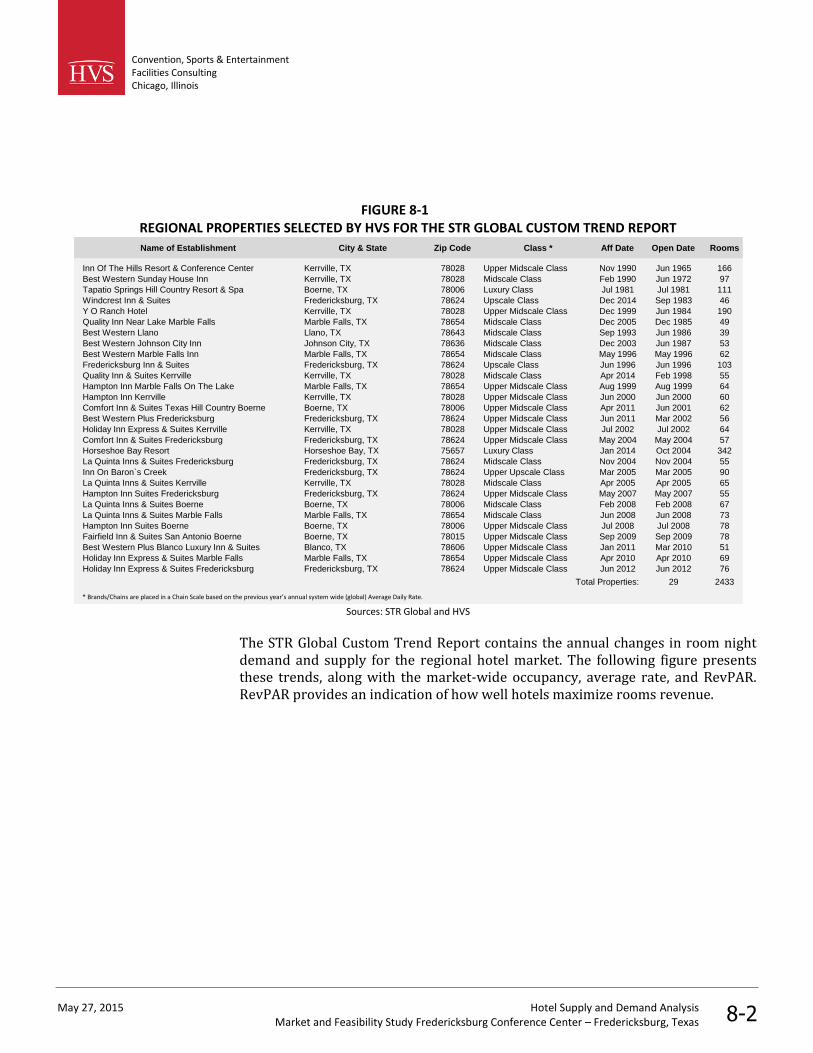
Convention, Sports & Entertainment Facilities Consulting Chicago, Illinois
May 27, 2015 Hotel Supply and Demand Analysis Market and Feasibility Study Fredericksburg Conference Center – Fredericksburg, Texas 8-2
FIGURE 8-1 REGIONAL PROPERTIES SELECTED BY HVS FOR THE STR GLOBAL CUSTOM TREND REPORT
Name of Establishment City & State Zip Code Class * Aff Date Open Date Rooms
Inn Of The Hills Resort & Conference Center Kerrville, TX 78028 Upper Midscale Class Nov 1990 Jun 1965 166
Best Western Sunday House Inn Kerrville, TX 78028 Midscale Class Feb 1990 Jun 1972 97
Tapatio Springs Hill Country Resort & Spa Boerne, TX 78006 Luxury Class Jul 1981 Jul 1981 111
Windcrest Inn & Suites Fredericksburg, TX 78624 Upscale Class Dec 2014 Sep 1983 46
Y O Ranch Hotel Kerrville, TX 78028 Upper Midscale Class Dec 1999 Jun 1984 190
Quality Inn Near Lake Marble Falls Marble Falls, TX 78654 Midscale Class Dec 2005 Dec 1985 49
Best Western Llano Llano, TX 78643 Midscale Class Sep 1993 Jun 1986 39
Best Western Johnson City Inn Johnson City, TX 78636 Midscale Class Dec 2003 Jun 1987 53
Best Western Marble Falls Inn Marble Falls, TX 78654 Midscale Class May 1996 May 1996 62
Fredericksburg Inn & Suites Fredericksburg, TX 78624 Upscale Class Jun 1996 Jun 1996 103
Quality Inn & Suites Kerrville Kerrville, TX 78028 Midscale Class Apr 2014 Feb 1998 55
Hampton Inn Marble Falls On The Lake Marble Falls, TX 78654 Upper Midscale Class Aug 1999 Aug 1999 64
Hampton Inn Kerrville Kerrville, TX 78028 Upper Midscale Class Jun 2000 Jun 2000 60
Comfort Inn & Suites Texas Hill Country Boerne Boerne, TX 78006 Upper Midscale Class Apr 2011 Jun 2001 62
Best Western Plus Fredericksburg Fredericksburg, TX 78624 Upper Midscale Class Jun 2011 Mar 2002 56
Holiday Inn Express & Suites Kerrville Kerrville, TX 78028 Upper Midscale Class Jul 2002 Jul 2002 64
Comfort Inn & Suites Fredericksburg Fredericksburg, TX 78624 Upper Midscale Class May 2004 May 2004 57
Horseshoe Bay Resort Horseshoe Bay, TX 75657 Luxury Class Jan 2014 Oct 2004 342
La Quinta Inns & Suites Fredericksburg Fredericksburg, TX 78624 Midscale Class Nov 2004 Nov 2004 55
Inn On Baron`s Creek Fredericksburg, TX 78624 Upper Upscale Class Mar 2005 Mar 2005 90
La Quinta Inns & Suites Kerrville Kerrville, TX 78028 Midscale Class Apr 2005 Apr 2005 65
Hampton Inn Suites Fredericksburg Fredericksburg, TX 78624 Upper Midscale Class May 2007 May 2007 55
La Quinta Inns & Suites Boerne Boerne, TX 78006 Midscale Class Feb 2008 Feb 2008 67
La Quinta Inns & Suites Marble Falls Marble Falls, TX 78654 Midscale Class Jun 2008 Jun 2008 73
Hampton Inn Suites Boerne Boerne, TX 78006 Upper Midscale Class Jul 2008 Jul 2008 78
Fairfield Inn & Suites San Antonio Boerne Boerne, TX 78015 Upper Midscale Class Sep 2009 Sep 2009 78
Best Western Plus Blanco Luxury Inn & Suites Blanco, TX 78606 Upper Midscale Class Jan 2011 Mar 2010 51
Holiday Inn Express & Suites Marble Falls Marble Falls, TX 78654 Upper Midscale Class Apr 2010 Apr 2010 69
Holiday Inn Express & Suites Fredericksburg Fredericksburg, TX 78624 Upper Midscale Class Jun 2012 Jun 2012 76
Total Properties: 29 2433
* Brands/Chains are placed in a Chain Scale based on the previous year’s annual system wide (global) Average Daily Rate. Sources: STR Global and HVS
The STR Global Custom Trend Report contains the annual changes in room night demand and supply for the regional hotel market. The following figure presents these trends, along with the market-wide occupancy, average rate, and RevPAR. RevPAR provides an indication of how well hotels maximize rooms revenue.
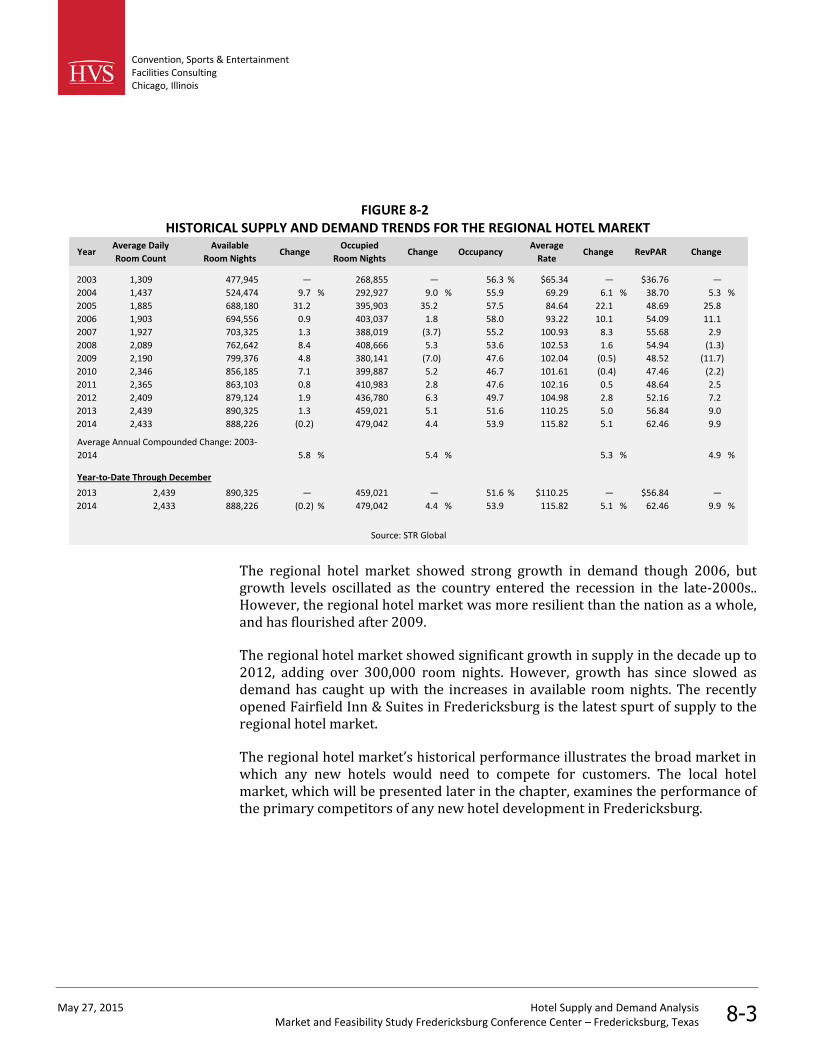
Convention, Sports & Entertainment Facilities Consulting Chicago, Illinois
May 27, 2015 Hotel Supply and Demand Analysis Market and Feasibility Study Fredericksburg Conference Center – Fredericksburg, Texas 8-3
FIGURE 8-2 HISTORICAL SUPPLY AND DEMAND TRENDS FOR THE REGIONAL HOTEL MAREKT
YearAverage Daily
Room Count
Available
Room NightsChange
Occupied
Room NightsChange Occupancy
Average
RateChange RevPAR Change
2003 1,309 477,945 — 268,855 — 56.3 % $65.34 — $36.76 —
2004 1,437 524,474 9.7 % 292,927 9.0 % 55.9 69.29 6.1 % 38.70 5.3 %
2005 1,885 688,180 31.2 395,903 35.2 57.5 84.64 22.1 48.69 25.8
2006 1,903 694,556 0.9 403,037 1.8 58.0 93.22 10.1 54.09 11.1
2007 1,927 703,325 1.3 388,019 (3.7) 55.2 100.93 8.3 55.68 2.9
2008 2,089 762,642 8.4 408,666 5.3 53.6 102.53 1.6 54.94 (1.3)
2009 2,190 799,376 4.8 380,141 (7.0) 47.6 102.04 (0.5) 48.52 (11.7)
2010 2,346 856,185 7.1 399,887 5.2 46.7 101.61 (0.4) 47.46 (2.2)
2011 2,365 863,103 0.8 410,983 2.8 47.6 102.16 0.5 48.64 2.5
2012 2,409 879,124 1.9 436,780 6.3 49.7 104.98 2.8 52.16 7.2
2013 2,439 890,325 1.3 459,021 5.1 51.6 110.25 5.0 56.84 9.0
2014 2,433 888,226 (0.2) 479,042 4.4 53.9 115.82 5.1 62.46 9.9
5.8 % 5.4 % 5.3 % 4.9 %
Year-to-Date Through December
2013 2,439 890,325 — 459,021 — 51.6 % $110.25 — $56.84 —
2014 2,433 888,226 (0.2) % 479,042 4.4 % 53.9 115.82 5.1 % 62.46 9.9 %
Source: STR Global
Average Annual Compounded Change: 2003-
2014
The regional hotel market showed strong growth in demand though 2006, but growth levels oscillated as the country entered the recession in the late-2000s.. However, the regional hotel market was more resilient than the nation as a whole, and has flourished after 2009.
The regional hotel market showed significant growth in supply in the decade up to 2012, adding over 300,000 room nights. However, growth has since slowed as demand has caught up with the increases in available room nights. The recently opened Fairfield Inn & Suites in Fredericksburg is the latest spurt of supply to the regional hotel market.
The regional hotel market’s historical performance illustrates the broad market in which any new hotels would need to compete for customers. The local hotel market, which will be presented later in the chapter, examines the performance of the primary competitors of any new hotel development in Fredericksburg.
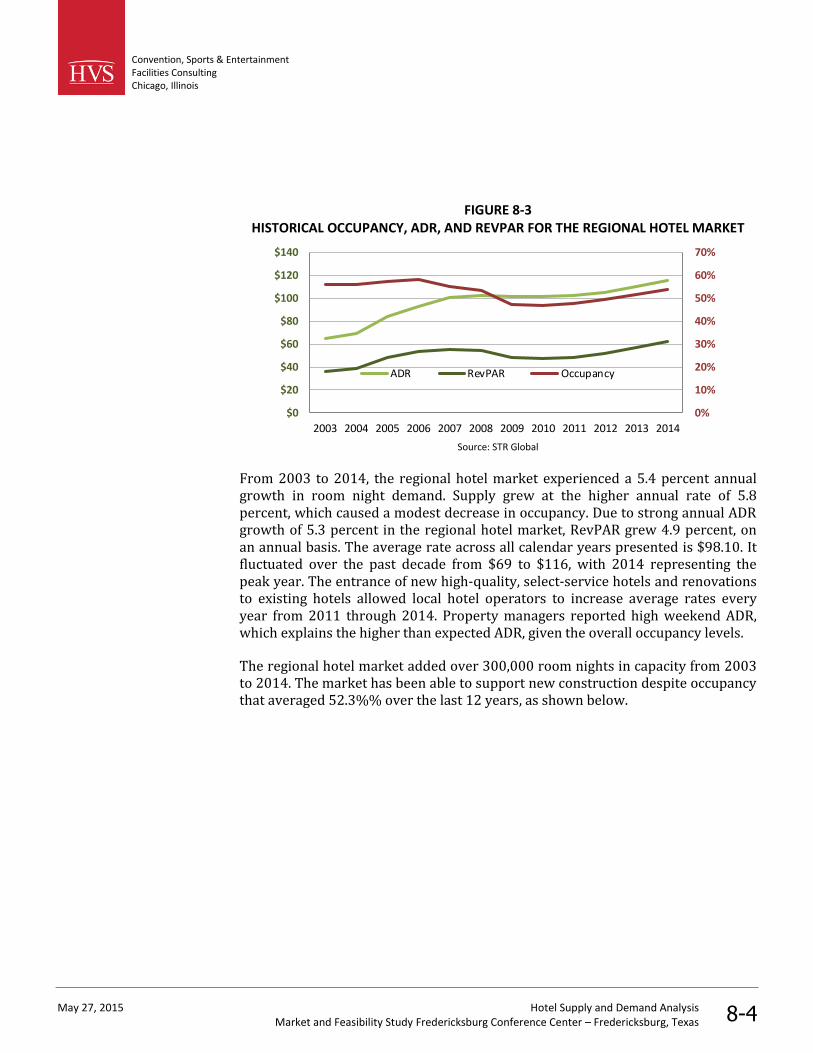
Convention, Sports & Entertainment Facilities Consulting Chicago, Illinois
May 27, 2015 Hotel Supply and Demand Analysis Market and Feasibility Study Fredericksburg Conference Center – Fredericksburg, Texas 8-4
FIGURE 8-3 HISTORICAL OCCUPANCY, ADR, AND REVPAR FOR THE REGIONAL HOTEL MARKET
0%
10%
20%
30%
40%
50%
60%
70%
$0
$20
$40
$60
$80
$100
$120
$140
2003 2004 2005 2006 2007 2008 2009 2010 2011 2012 2013 2014
ADR RevPAR Occupancy
Source: STR Global
From 2003 to 2014, the regional hotel market experienced a 5.4 percent annual growth in room night demand. Supply grew at the higher annual rate of 5.8 percent, which caused a modest decrease in occupancy. Due to strong annual ADR growth of 5.3 percent in the regional hotel market, RevPAR grew 4.9 percent, on an annual basis. The average rate across all calendar years presented is $98.10. It fluctuated over the past decade from $69 to $116, with 2014 representing the peak year. The entrance of new high-quality, select-service hotels and renovations to existing hotels allowed local hotel operators to increase average rates every year from 2011 through 2014. Property managers reported high weekend ADR, which explains the higher than expected ADR, given the overall occupancy levels.
The regional hotel market added over 300,000 room nights in capacity from 2003 to 2014. The market has been able to support new construction despite occupancy that averaged 52.3%% over the last 12 years, as shown below.
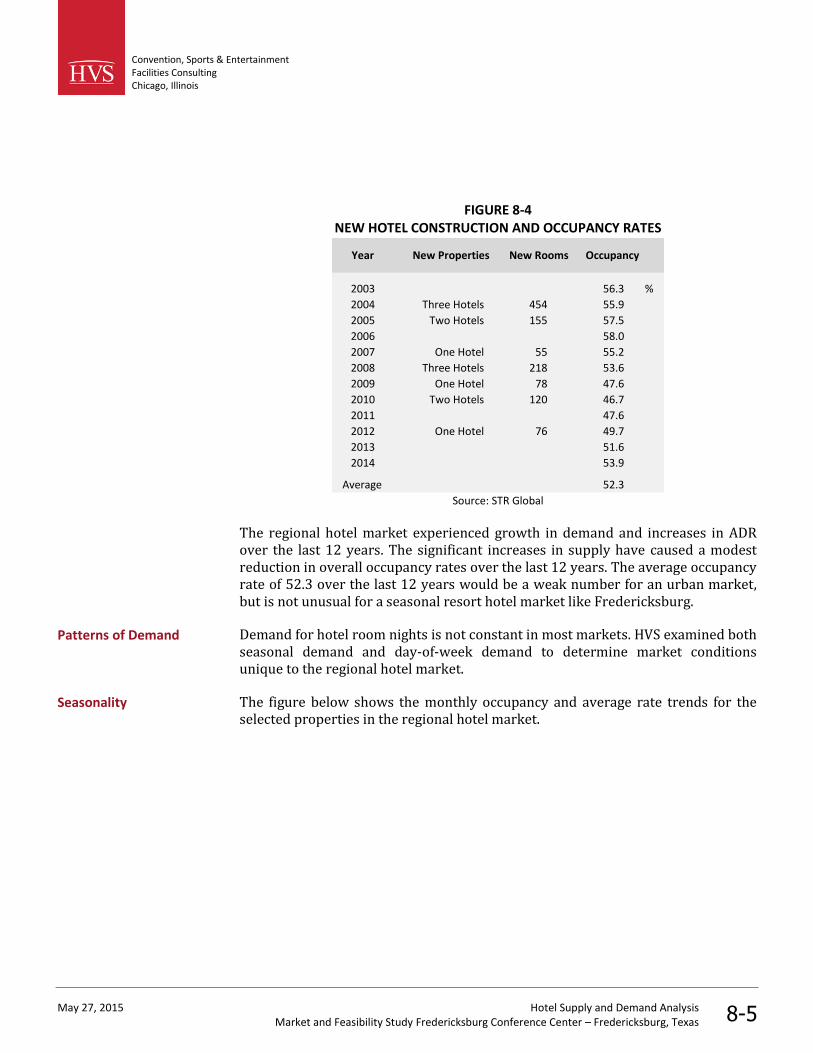
Convention, Sports & Entertainment Facilities Consulting Chicago, Illinois
May 27, 2015 Hotel Supply and Demand Analysis Market and Feasibility Study Fredericksburg Conference Center – Fredericksburg, Texas 8-5
FIGURE 8-4 NEW HOTEL CONSTRUCTION AND OCCUPANCY RATES
Year New Properties New Rooms Occupancy
2003 56.3 %
2004 Three Hotels 454 55.9
2005 Two Hotels 155 57.5
2006 58.0
2007 One Hotel 55 55.2
2008 Three Hotels 218 53.6
2009 One Hotel 78 47.6
2010 Two Hotels 120 46.7
2011 47.6
2012 One Hotel 76 49.7
2013 51.6
2014 53.9
Average 52.3 Source: STR Global
The regional hotel market experienced growth in demand and increases in ADR over the last 12 years. The significant increases in supply have caused a modest reduction in overall occupancy rates over the last 12 years. The average occupancy rate of 52.3 over the last 12 years would be a weak number for an urban market, but is not unusual for a seasonal resort hotel market like Fredericksburg.
Demand for hotel room nights is not constant in most markets. HVS examined both seasonal demand and day-of-week demand to determine market conditions unique to the regional hotel market.
The figure below shows the monthly occupancy and average rate trends for the selected properties in the regional hotel market.
Patterns of Demand
Seasonality

Convention, Sports & Entertainment Facilities Consulting Chicago, Illinois
May 27, 2015 Hotel Supply and Demand Analysis Market and Feasibility Study Fredericksburg Conference Center – Fredericksburg, Texas 8-6
FIGURE 8-5 REGIONAL HOTEL MARKET SEASONALITY GRAPH
$0
$20
$40
$60
$80
$100
$120
0%
10%
20%
30%
40%
50%
60%
70%
Jan Feb Mar Apr May Jun Jul Aug Sep Oct Nov Dec
Occupancy ADR
Source: STR Global
The above figure shows the seasonal nature of the regional hotel market. Market interviews indicate that leisure travel drives ADRs and occupancies during the spring and summer months. High occupancy during the peak months of June and July drive ADR higher.
Interviews with local officials and hotel management indicate that a high level of weekend leisure demand is generated by residents of Austin and San Antonio. The following figure shows weeknight ADR and occupancy.
FIGURE 8-6 REGIONAL HOTEL MARKET OCCUPANCY AND ADR BY DAY OF WEEK
$0
$25
$50
$75
$100
$125
$150
0%
10%
20%
30%
40%
50%
60%
70%
80%
90%
Sun Mon Tue Wed Thu Fri Sat
Occupancy ADR
Source: STR Global
Day-of-week
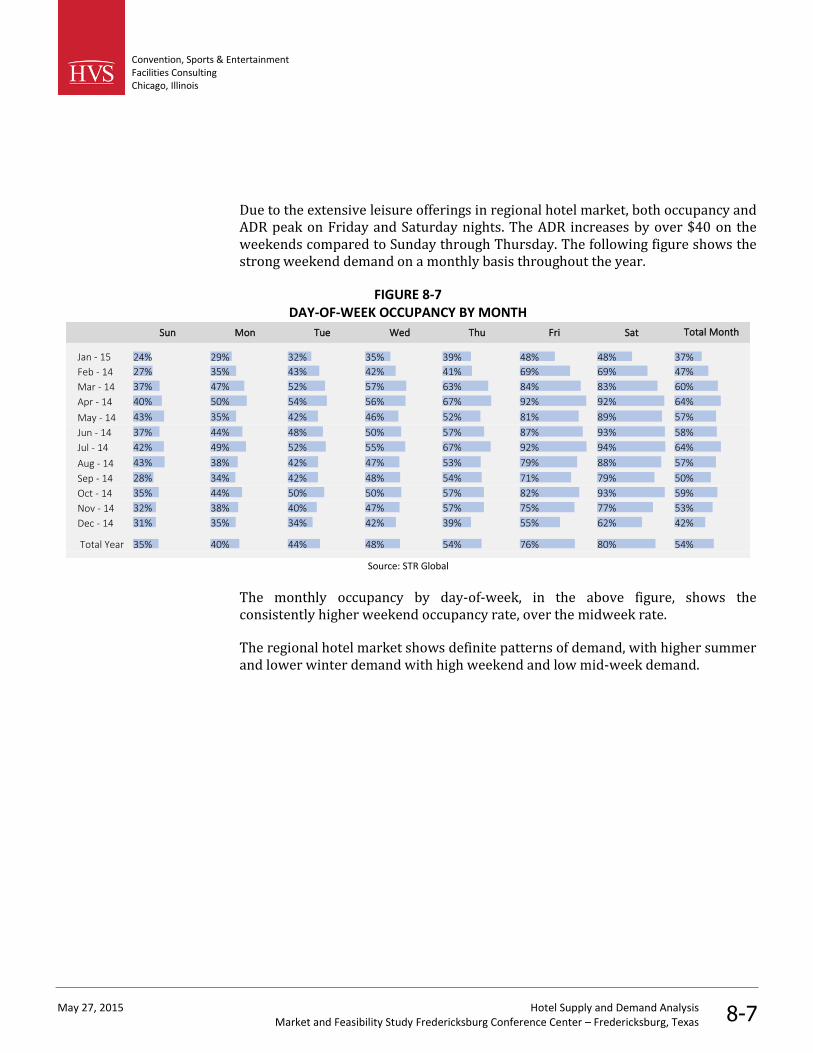
Convention, Sports & Entertainment Facilities Consulting Chicago, Illinois
May 27, 2015 Hotel Supply and Demand Analysis Market and Feasibility Study Fredericksburg Conference Center – Fredericksburg, Texas 8-7
Due to the extensive leisure offerings in regional hotel market, both occupancy and ADR peak on Friday and Saturday nights. The ADR increases by over $40 on the weekends compared to Sunday through Thursday. The following figure shows the strong weekend demand on a monthly basis throughout the year.
FIGURE 8-7 DAY-OF-WEEK OCCUPANCY BY MONTH
Sun Mon Tue Wed Thu Fri Sat
Jan - 15 24% 29% 32% 35% 39% 48% 48% 37%
Feb - 14 27% 35% 43% 42% 41% 69% 69% 47%
Mar - 14 37% 47% 52% 57% 63% 84% 83% 60%
Apr - 14 40% 50% 54% 56% 67% 92% 92% 64%
May - 14 43% 35% 42% 46% 52% 81% 89% 57%
Jun - 14 37% 44% 48% 50% 57% 87% 93% 58%
Jul - 14 42% 49% 52% 55% 67% 92% 94% 64%
Aug - 14 43% 38% 42% 47% 53% 79% 88% 57%
Sep - 14 28% 34% 42% 48% 54% 71% 79% 50%
Oct - 14 35% 44% 50% 50% 57% 82% 93% 59%
Nov - 14 32% 38% 40% 47% 57% 75% 77% 53%
Dec - 14 31% 35% 34% 42% 39% 55% 62% 42%
Total Year 35% 40% 44% 48% 54% 76% 80% 54%
Total Month
Source: STR Global
The monthly occupancy by day-of-week, in the above figure, shows the consistently higher weekend occupancy rate, over the midweek rate.
The regional hotel market shows definite patterns of demand, with higher summer and lower winter demand with high weekend and low mid-week demand.
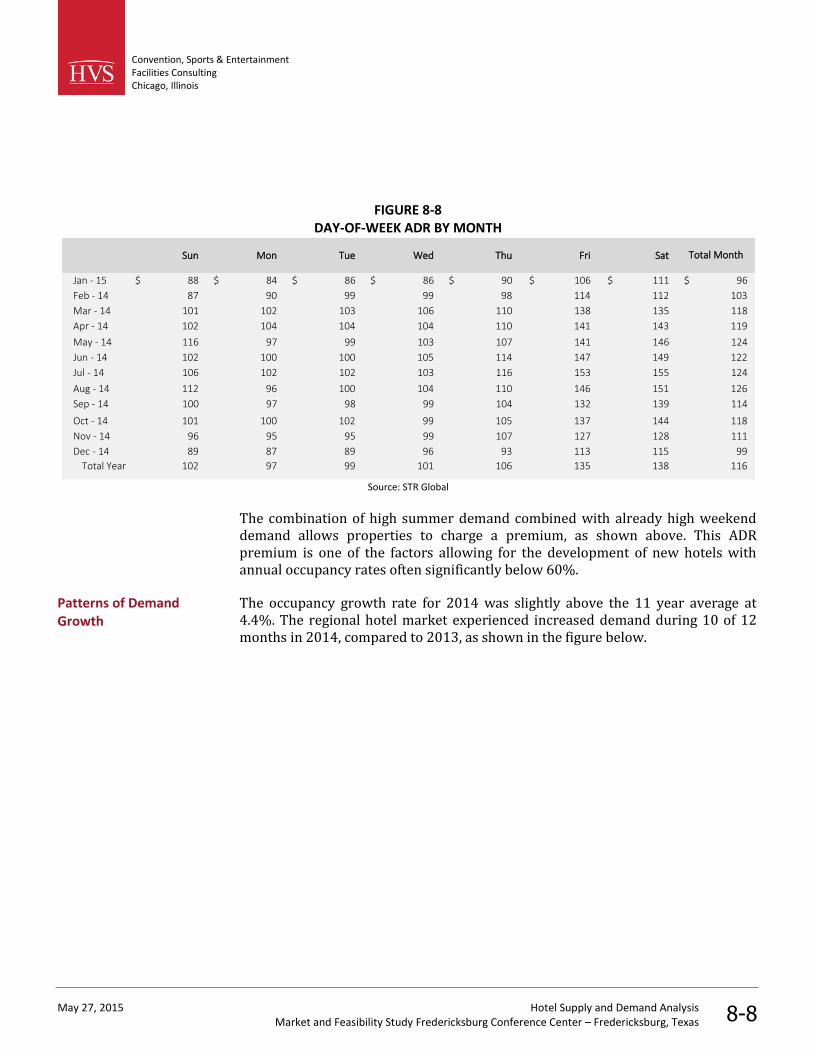
Convention, Sports & Entertainment Facilities Consulting Chicago, Illinois
May 27, 2015 Hotel Supply and Demand Analysis Market and Feasibility Study Fredericksburg Conference Center – Fredericksburg, Texas 8-8
FIGURE 8-8 DAY-OF-WEEK ADR BY MONTH
Sun Mon Tue Wed Thu Fri Sat
Jan - 15 $ 88 $ 84 $ 86 $ 86 $ 90 $ 106 $ 111 $ 96
Feb - 14 87 90 99 99 98 114 112 103
Mar - 14 101 102 103 106 110 138 135 118
Apr - 14 102 104 104 104 110 141 143 119
May - 14 116 97 99 103 107 141 146 124
Jun - 14 102 100 100 105 114 147 149 122
Jul - 14 106 102 102 103 116 153 155 124
Aug - 14 112 96 100 104 110 146 151 126
Sep - 14 100 97 98 99 104 132 139 114
Oct - 14 101 100 102 99 105 137 144 118
Nov - 14 96 95 95 99 107 127 128 111
Dec - 14 89 87 89 96 93 113 115 99
Total Year 102 97 99 101 106 135 138 116
Total Month
Source: STR Global
The combination of high summer demand combined with already high weekend demand allows properties to charge a premium, as shown above. This ADR premium is one of the factors allowing for the development of new hotels with annual occupancy rates often significantly below 60%.
The occupancy growth rate for 2014 was slightly above the 11 year average at 4.4%. The regional hotel market experienced increased demand during 10 of 12 months in 2014, compared to 2013, as shown in the figure below.
Patterns of Demand Growth
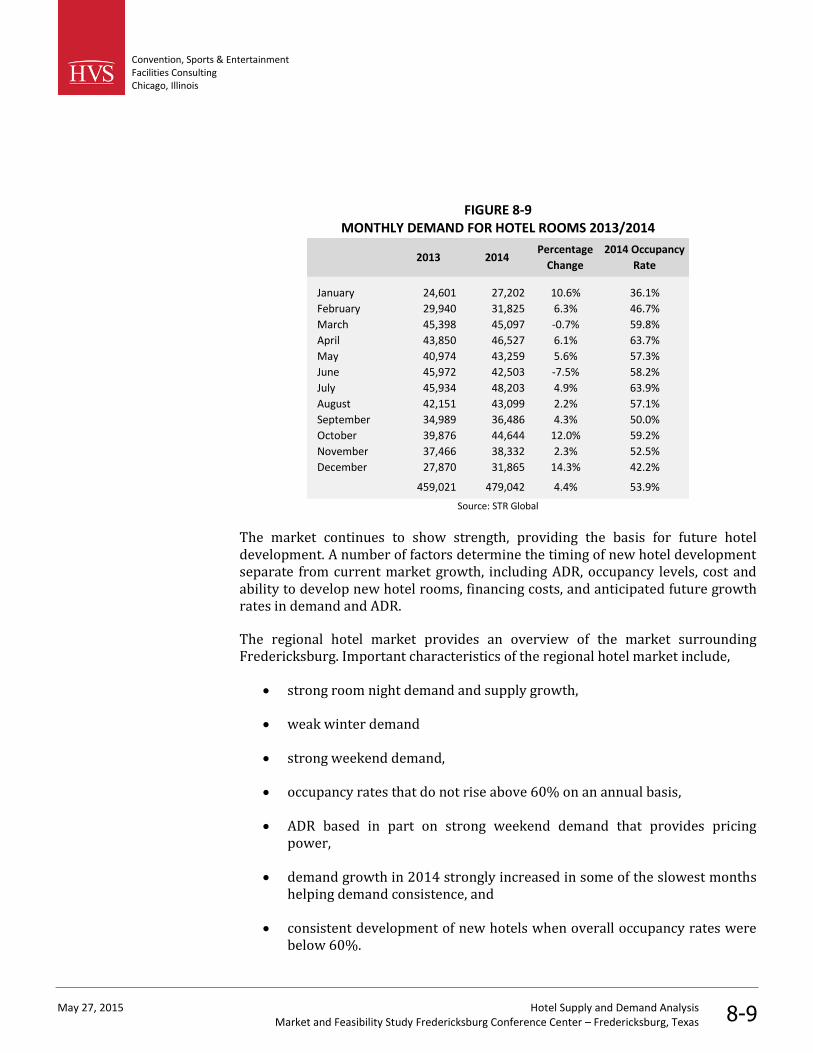
Convention, Sports & Entertainment Facilities Consulting Chicago, Illinois
May 27, 2015 Hotel Supply and Demand Analysis Market and Feasibility Study Fredericksburg Conference Center – Fredericksburg, Texas 8-9
FIGURE 8-9 MONTHLY DEMAND FOR HOTEL ROOMS 2013/2014
2013 2014Percentage
Change
2014 Occupancy
Rate
January 24,601 27,202 10.6% 36.1%
February 29,940 31,825 6.3% 46.7%
March 45,398 45,097 -0.7% 59.8%
April 43,850 46,527 6.1% 63.7%
May 40,974 43,259 5.6% 57.3%
June 45,972 42,503 -7.5% 58.2%
July 45,934 48,203 4.9% 63.9%
August 42,151 43,099 2.2% 57.1%
September 34,989 36,486 4.3% 50.0%
October 39,876 44,644 12.0% 59.2%
November 37,466 38,332 2.3% 52.5%
December 27,870 31,865 14.3% 42.2%
459,021 479,042 4.4% 53.9%
Source: STR Global
The market continues to show strength, providing the basis for future hotel development. A number of factors determine the timing of new hotel development separate from current market growth, including ADR, occupancy levels, cost and ability to develop new hotel rooms, financing costs, and anticipated future growth rates in demand and ADR.
The regional hotel market provides an overview of the market surrounding Fredericksburg. Important characteristics of the regional hotel market include,
strong room night demand and supply growth,
weak winter demand
strong weekend demand,
occupancy rates that do not rise above 60% on an annual basis,
ADR based in part on strong weekend demand that provides pricing power,
demand growth in 2014 strongly increased in some of the slowest months helping demand consistence, and
consistent development of new hotels when overall occupancy rates were below 60%.
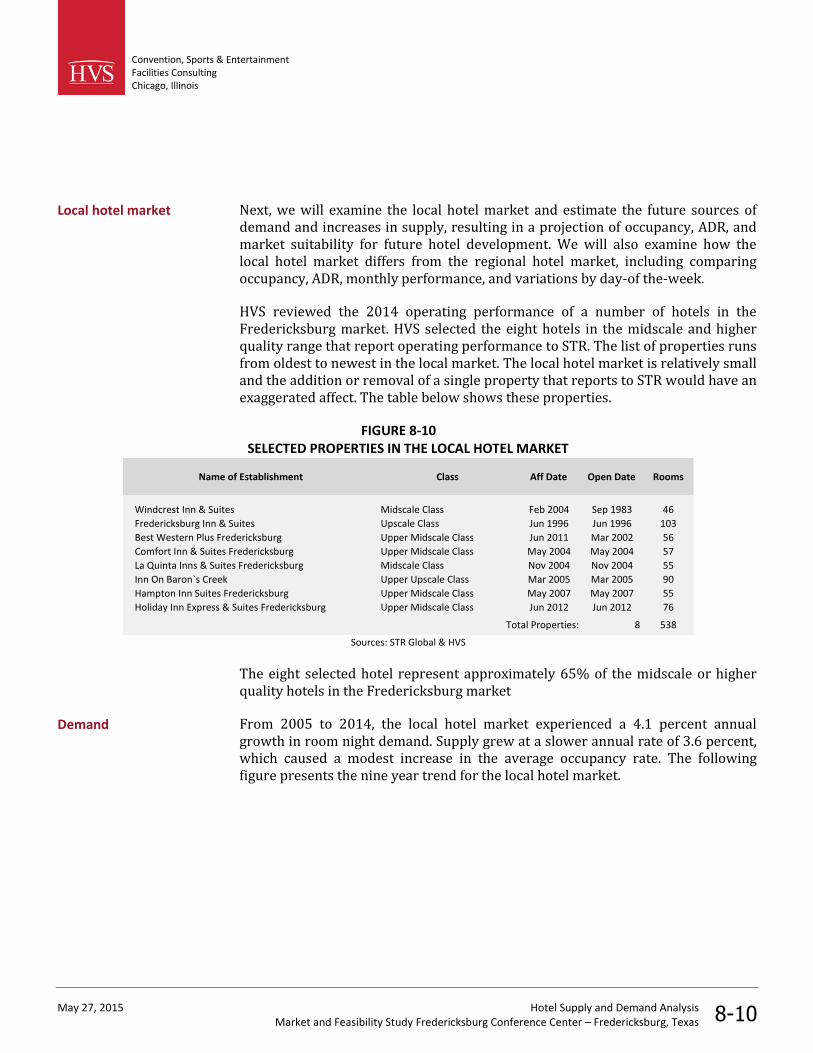
Convention, Sports & Entertainment Facilities Consulting Chicago, Illinois
May 27, 2015 Hotel Supply and Demand Analysis Market and Feasibility Study Fredericksburg Conference Center – Fredericksburg, Texas 8-10
Next, we will examine the local hotel market and estimate the future sources of demand and increases in supply, resulting in a projection of occupancy, ADR, and market suitability for future hotel development. We will also examine how the local hotel market differs from the regional hotel market, including comparing occupancy, ADR, monthly performance, and variations by day-of the-week.
HVS reviewed the 2014 operating performance of a number of hotels in the Fredericksburg market. HVS selected the eight hotels in the midscale and higher quality range that report operating performance to STR. The list of properties runs from oldest to newest in the local market. The local hotel market is relatively small and the addition or removal of a single property that reports to STR would have an exaggerated affect. The table below shows these properties.
FIGURE 8-10 SELECTED PROPERTIES IN THE LOCAL HOTEL MARKET
Name of Establishment Class Aff Date Open Date Rooms
Windcrest Inn & Suites Midscale Class Feb 2004 Sep 1983 46
Fredericksburg Inn & Suites Upscale Class Jun 1996 Jun 1996 103
Best Western Plus Fredericksburg Upper Midscale Class Jun 2011 Mar 2002 56
Comfort Inn & Suites Fredericksburg Upper Midscale Class May 2004 May 2004 57
La Quinta Inns & Suites Fredericksburg Midscale Class Nov 2004 Nov 2004 55
Inn On Baron`s Creek Upper Upscale Class Mar 2005 Mar 2005 90
Hampton Inn Suites Fredericksburg Upper Midscale Class May 2007 May 2007 55
Holiday Inn Express & Suites Fredericksburg Upper Midscale Class Jun 2012 Jun 2012 76
Total Properties: 8 538
Sources: STR Global & HVS
The eight selected hotel represent approximately 65% of the midscale or higher quality hotels in the Fredericksburg market
From 2005 to 2014, the local hotel market experienced a 4.1 percent annual growth in room night demand. Supply grew at a slower annual rate of 3.6 percent, which caused a modest increase in the average occupancy rate. The following figure presents the nine year trend for the local hotel market.
Local hotel market
Demand

Convention, Sports & Entertainment Facilities Consulting Chicago, Illinois
May 27, 2015 Hotel Supply and Demand Analysis Market and Feasibility Study Fredericksburg Conference Center – Fredericksburg, Texas 8-11
FIGURE 8-11 HISTORICAL LOCAL HOTEL MARKET SUPPLY AND DEMAND TRENDS
YearAverage Daily
Room Count
Available
Room NightsChange
Occupied
Room NightsChange
2005 392 143,245 — 79,948 —
2006 407 148,555 3.7 % 78,981 (1.2) %
2007 444 162,030 9.1 79,829 1.1
2008 463 168,995 4.3 85,426 7.0
2009 463 168,995 0.0 85,405 (0.0)
2010 463 168,995 0.0 92,252 8.0
2011 463 168,873 (0.1) 91,701 (0.6)
2012 507 184,894 9.5 100,316 9.4
2013 538 196,370 6.2 109,843 9.5
2014 538 196,370 0.0 114,680 4.4
3.6 % 4.1 %
Year-to-Date Through December
2013 538 196,370 — 109,843 —
2014 538 196,370 0.0 % 114,680 4.4 %
Average Annual Compounded Change:
2005-2014
Source: STR Global
The local hotel market exhibited strong demand growth in 2013 and 2014, but the rate of increase slowed from 9.5 percent in 2013 to 4.4 percent in 2014.
The figure below shows the monthly occupancy and average rate trends for the selected properties in the local hotel market.
FIGURE 8-12 LOCAL HOTEL MARKET SEASONALITY GRAPH
$0
$20
$40
$60
$80
$100
$120
$140
0%
10%
20%
30%
40%
50%
60%
70%
80%
Jan Feb Mar Apr May Jun Jul Aug Sep Oct Nov Dec
Occupancy ADR
Source: STR Global
Seasonality
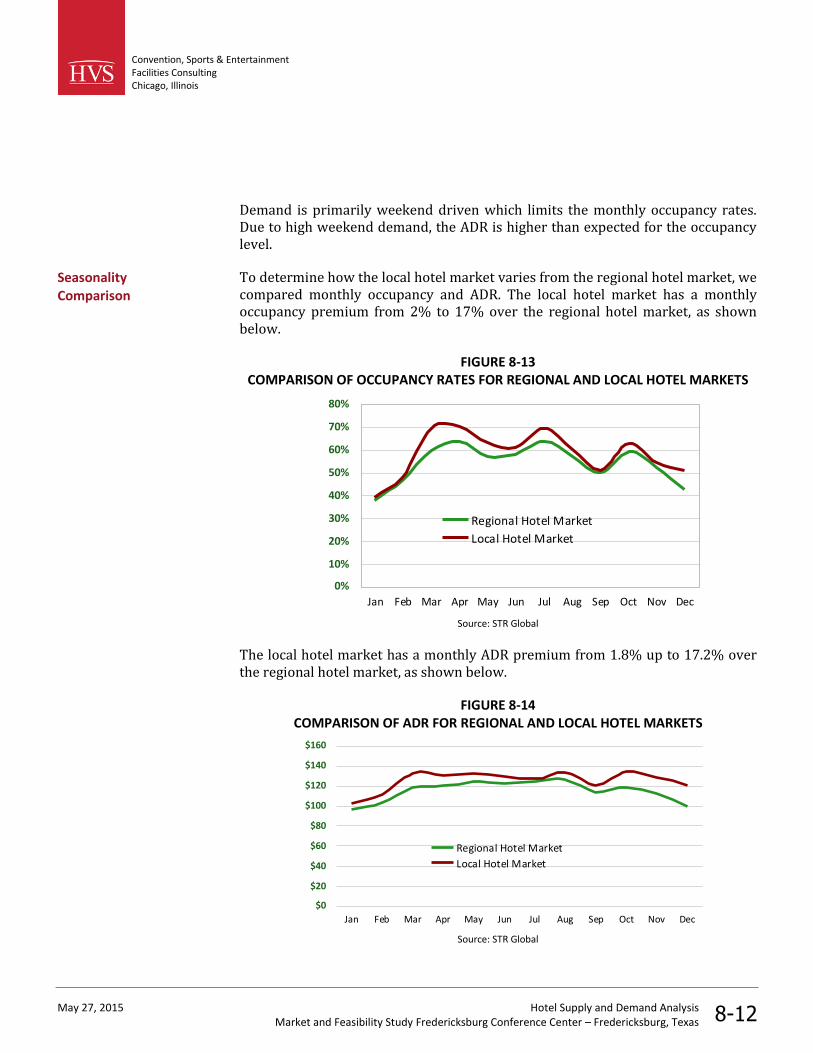
Convention, Sports & Entertainment Facilities Consulting Chicago, Illinois
May 27, 2015 Hotel Supply and Demand Analysis Market and Feasibility Study Fredericksburg Conference Center – Fredericksburg, Texas 8-12
Demand is primarily weekend driven which limits the monthly occupancy rates. Due to high weekend demand, the ADR is higher than expected for the occupancy level.
To determine how the local hotel market varies from the regional hotel market, we compared monthly occupancy and ADR. The local hotel market has a monthly occupancy premium from 2% to 17% over the regional hotel market, as shown below.
FIGURE 8-13 COMPARISON OF OCCUPANCY RATES FOR REGIONAL AND LOCAL HOTEL MARKETS
0%
10%
20%
30%
40%
50%
60%
70%
80%
Jan Feb Mar Apr May Jun Jul Aug Sep Oct Nov Dec
Regional Hotel Market
Local Hotel Market
Source: STR Global
The local hotel market has a monthly ADR premium from 1.8% up to 17.2% over the regional hotel market, as shown below.
FIGURE 8-14 COMPARISON OF ADR FOR REGIONAL AND LOCAL HOTEL MARKETS
$0
$20
$40
$60
$80
$100
$120
$140
$160
Jan Feb Mar Apr May Jun Jul Aug Sep Oct Nov Dec
Regional Hotel Market
Local Hotel Market
Source: STR Global
Seasonality Comparison
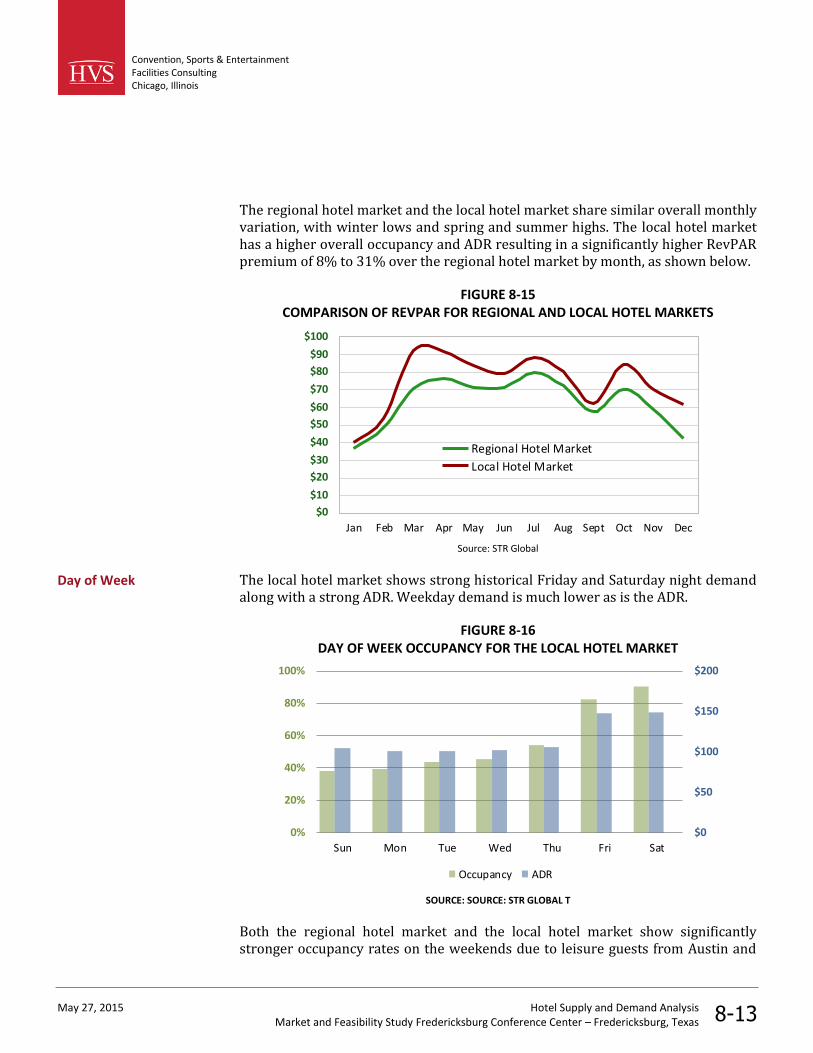
Convention, Sports & Entertainment Facilities Consulting Chicago, Illinois
May 27, 2015 Hotel Supply and Demand Analysis Market and Feasibility Study Fredericksburg Conference Center – Fredericksburg, Texas 8-13
The regional hotel market and the local hotel market share similar overall monthly variation, with winter lows and spring and summer highs. The local hotel market has a higher overall occupancy and ADR resulting in a significantly higher RevPAR premium of 8% to 31% over the regional hotel market by month, as shown below.
FIGURE 8-15 COMPARISON OF REVPAR FOR REGIONAL AND LOCAL HOTEL MARKETS
$0
$10
$20
$30
$40
$50
$60
$70
$80
$90
$100
Jan Feb Mar Apr May Jun Jul Aug Sept Oct Nov Dec
Regional Hotel Market
Local Hotel Market
Source: STR Global
The local hotel market shows strong historical Friday and Saturday night demand along with a strong ADR. Weekday demand is much lower as is the ADR.
FIGURE 8-16 DAY OF WEEK OCCUPANCY FOR THE LOCAL HOTEL MARKET
$0
$50
$100
$150
$200
0%
20%
40%
60%
80%
100%
Sun Mon Tue Wed Thu Fri Sat
Occupancy ADR
SOURCE: SOURCE: STR GLOBAL T
Both the regional hotel market and the local hotel market show significantly stronger occupancy rates on the weekends due to leisure guests from Austin and
Day of Week
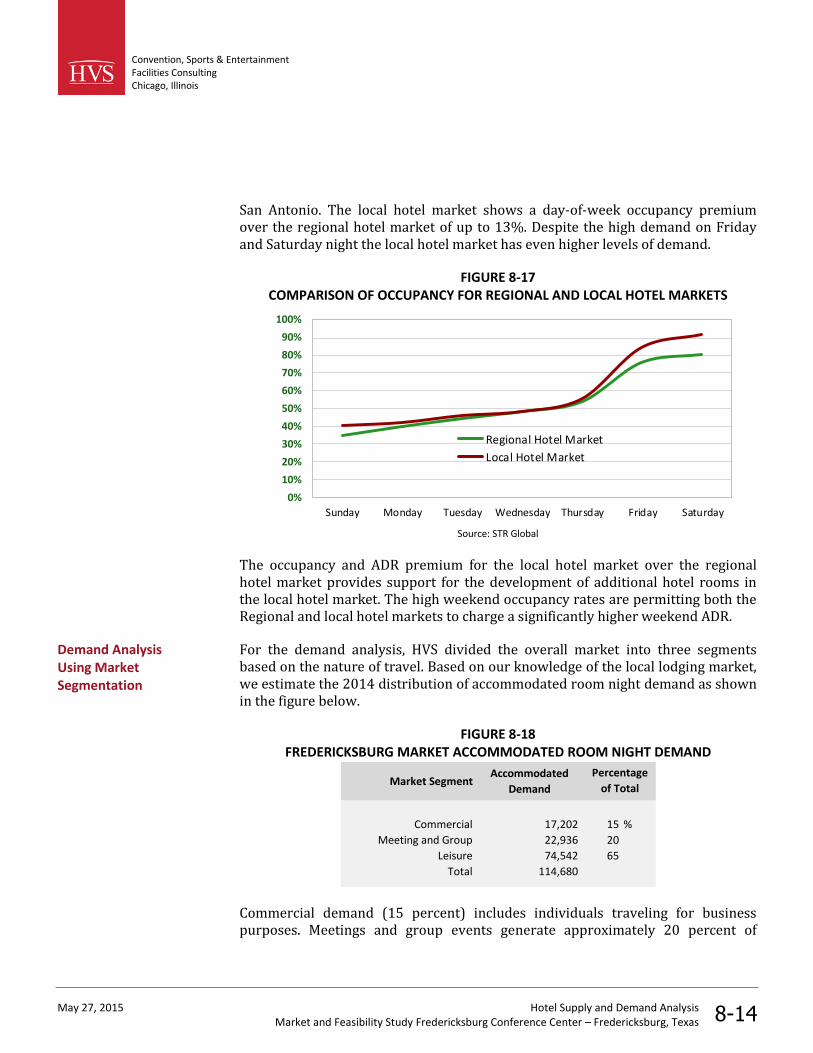
Convention, Sports & Entertainment Facilities Consulting Chicago, Illinois
May 27, 2015 Hotel Supply and Demand Analysis Market and Feasibility Study Fredericksburg Conference Center – Fredericksburg, Texas 8-14
San Antonio. The local hotel market shows a day-of-week occupancy premium over the regional hotel market of up to 13%. Despite the high demand on Friday and Saturday night the local hotel market has even higher levels of demand.
FIGURE 8-17 COMPARISON OF OCCUPANCY FOR REGIONAL AND LOCAL HOTEL MARKETS
0%
10%
20%
30%
40%
50%
60%
70%
80%
90%
100%
Sunday Monday Tuesday Wednesday Thursday Friday Saturday
Regional Hotel Market
Local Hotel Market
Source: STR Global
The occupancy and ADR premium for the local hotel market over the regional hotel market provides support for the development of additional hotel rooms in the local hotel market. The high weekend occupancy rates are permitting both the Regional and local hotel markets to charge a significantly higher weekend ADR.
For the demand analysis, HVS divided the overall market into three segments based on the nature of travel. Based on our knowledge of the local lodging market, we estimate the 2014 distribution of accommodated room night demand as shown in the figure below.
FIGURE 8-18 FREDERICKSBURG MARKET ACCOMMODATED ROOM NIGHT DEMAND
Market SegmentAccommodated
Demand
Commercial 17,202 15 %
Meeting and Group 22,936 20
Leisure 74,542 65
Total 114,680
Percentage
of Total
Commercial demand (15 percent) includes individuals traveling for business purposes. Meetings and group events generate approximately 20 percent of
Demand Analysis Using Market Segmentation
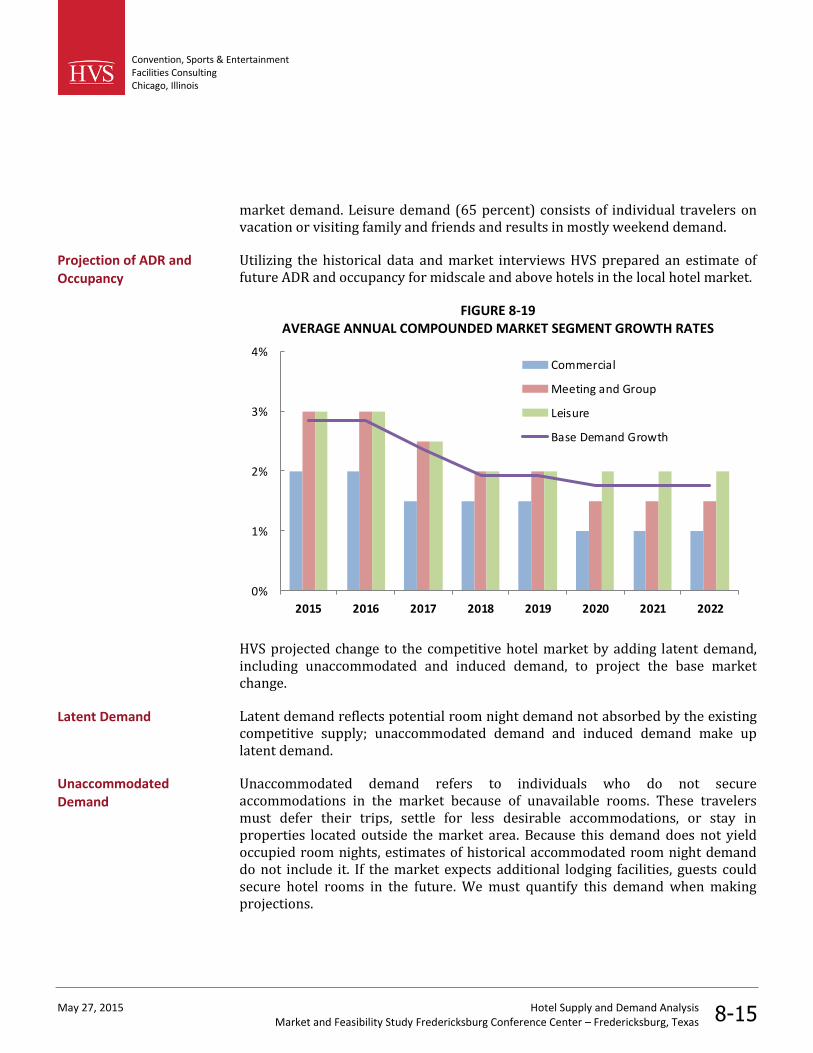
Convention, Sports & Entertainment Facilities Consulting Chicago, Illinois
May 27, 2015 Hotel Supply and Demand Analysis Market and Feasibility Study Fredericksburg Conference Center – Fredericksburg, Texas 8-15
market demand. Leisure demand (65 percent) consists of individual travelers on vacation or visiting family and friends and results in mostly weekend demand.
Utilizing the historical data and market interviews HVS prepared an estimate of future ADR and occupancy for midscale and above hotels in the local hotel market.
FIGURE 8-19 AVERAGE ANNUAL COMPOUNDED MARKET SEGMENT GROWTH RATES
0%
1%
2%
3%
4%
2015 2016 2017 2018 2019 2020 2021 2022
Commercial
Meeting and Group
Leisure
Base Demand Growth
HVS projected change to the competitive hotel market by adding latent demand, including unaccommodated and induced demand, to project the base market change.
Latent demand reflects potential room night demand not absorbed by the existing competitive supply; unaccommodated demand and induced demand make up latent demand.
Unaccommodated demand refers to individuals who do not secure accommodations in the market because of unavailable rooms. These travelers must defer their trips, settle for less desirable accommodations, or stay in properties located outside the market area. Because this demand does not yield occupied room nights, estimates of historical accommodated room night demand do not include it. If the market expects additional lodging facilities, guests could secure hotel rooms in the future. We must quantify this demand when making projections.
Projection of ADR and Occupancy
Latent Demand
Unaccommodated Demand
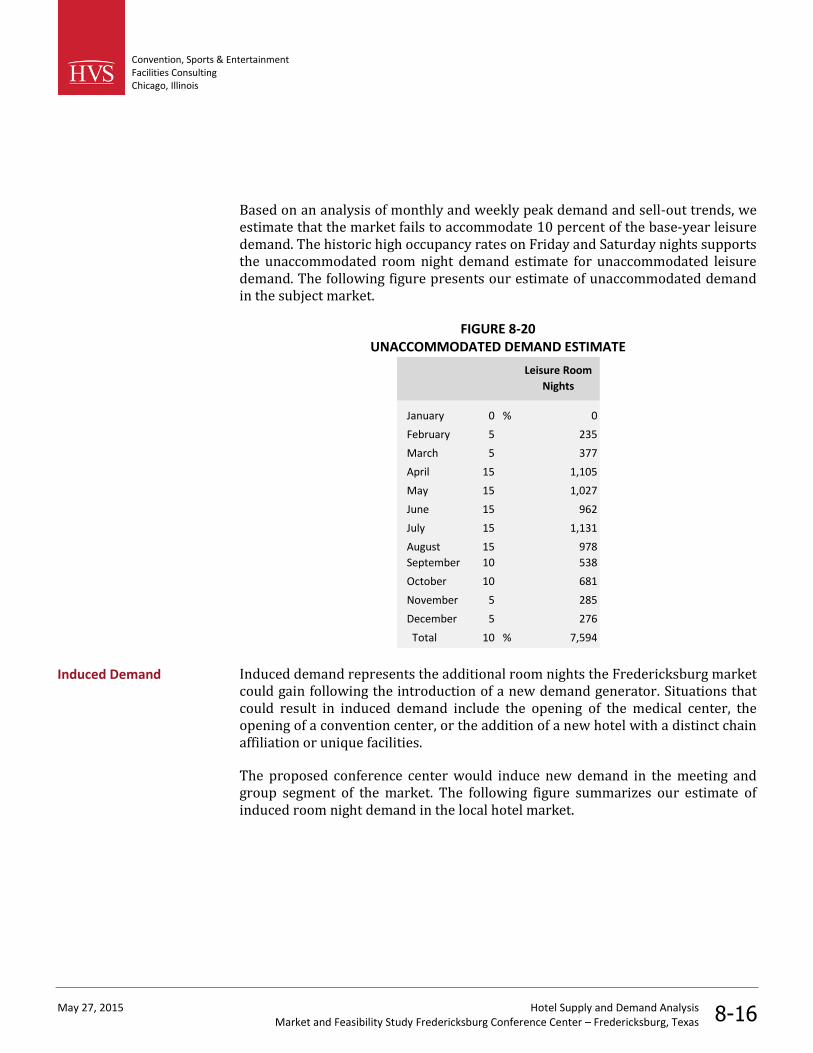
Convention, Sports & Entertainment Facilities Consulting Chicago, Illinois
May 27, 2015 Hotel Supply and Demand Analysis Market and Feasibility Study Fredericksburg Conference Center – Fredericksburg, Texas 8-16
Based on an analysis of monthly and weekly peak demand and sell-out trends, we estimate that the market fails to accommodate 10 percent of the base-year leisure demand. The historic high occupancy rates on Friday and Saturday nights supports the unaccommodated room night demand estimate for unaccommodated leisure demand. The following figure presents our estimate of unaccommodated demand in the subject market.
FIGURE 8-20 UNACCOMMODATED DEMAND ESTIMATE
January 0 % 0
February 5 235
March 5 377
April 15 1,105
May 15 1,027
June 15 962
July 15 1,131
August 15 978
September 10 538
October 10 681
November 5 285
December 5 276
Total 10 % 7,594
Leisure Room
Nights
Induced demand represents the additional room nights the Fredericksburg market could gain following the introduction of a new demand generator. Situations that could result in induced demand include the opening of the medical center, the opening of a convention center, or the addition of a new hotel with a distinct chain affiliation or unique facilities.
The proposed conference center would induce new demand in the meeting and group segment of the market. The following figure summarizes our estimate of induced room night demand in the local hotel market.
Induced Demand

Convention, Sports & Entertainment Facilities Consulting Chicago, Illinois
May 27, 2015 Hotel Supply and Demand Analysis Market and Feasibility Study Fredericksburg Conference Center – Fredericksburg, Texas 8-17
FIGURE 8-21 INDUCED DEMAND CALCULATION
Calendar YearMeeting &
Groups
2018 9,800
2019 12,900
2020 15,100
2021 16,600
2022 16,600
Accordingly, we incorporated approximately 17,000 room nights into our analysis, phased in over a four-year ramp-up period from the opening of the conference center.
Based on historical growth rates and our understanding of the local market, HVS assumed growth rates in room night demand for each market segment as shown in the figure below.
FIGURE 8-22 AVERAGE ANNUAL COMPOUNDED MARKET SEGMENT GROWTH RATES
Segment 2014 through 2024 CAGR*
Commercial 17,000 20,000 1.5%
Meeting and Group 23,000 43,000 5.9%
Leisure 67,000 103,000 4.0%
Total 107,000 166,000 4.1%
Based on information provided by the local officials, STR Global, local news sources, and the internal HVS database, HVS assumes that 385 new rooms would enter the local market. The figure below shows the new hotels that may enter the market over the next few years.
FIGURE 8-23 PROJECTED FREDERICKSBURG HOTEL MARKET NEW SUPPLY
Year Proposed PropertyCompetitive
Weight
Proposed
Rooms
Weighted
Room Count
Cumulative New
Weighted Room Count
2015 Fairfield Inn & Suites 65% 77 50 50
2016 East Main Hotel 65% 63 41 91
2017 Ufer Street Hotel 65% 120 78 169
2019 Future Hotel 65% 125 81 250
Total Project Increase in Demand
Supply Changes

Convention, Sports & Entertainment Facilities Consulting Chicago, Illinois
May 27, 2015 Hotel Supply and Demand Analysis Market and Feasibility Study Fredericksburg Conference Center – Fredericksburg, Texas 8-18
We have included four new hotels in our analysis of the local hotel market including a 77-room Fairfield Inn & Suites that recently opened at 513 Friendship Lane in Fredericksburg. The second property is a 63-room hotel under development near the National Museum of the Pacific War in Fredericksburg, which is expected to open mid 2016. The third property will be a 4-star, 120-room hotel facing Barons Creek from Ufer Street opening in 2017. Amenities will include a restaurant, indoor pool, 3,000 square feet of meeting space, and a pedestrian bridge to Main Street.
Due to significant increases in demand, we added a future 125-room property that would be 65% competitive with the local hotel market, as defined. The market may be able increase supply at a faster rate if the new projects induced demand into the market from new demand generators such as a spa, a water park, extensive meeting space, or recreational facilities.
We considered three other properties but excluded them from the analysis based on the early stage of development. The first property is proposed hotel development at a 173-acre site on Hwy 290. The long-term development plan calls for up to two upscale hotels, a restaurant, and a wedding event center. Most of the local wineries are located near the site. The second property is a resort spa on 183 acre site. Initial development will be a 30-unit hotel, which may be expanded to over 100 rooms if demand is sufficient. The third property, a former tennis club located north of Fredericksburg on 87 north, may be redeveloped into a 140-150 room resort and sites for future retail development. The developer plans to retain the existing tennis courts and swimming pool for resort guests.
The following figure details our projection of lodging demand growth for the local hotel market. It includes the total number of occupied room nights and any residual unaccommodated demand in the market, assuming the impact of the proposed conference center.
Accommodated Demand and Market-wide Occupancy
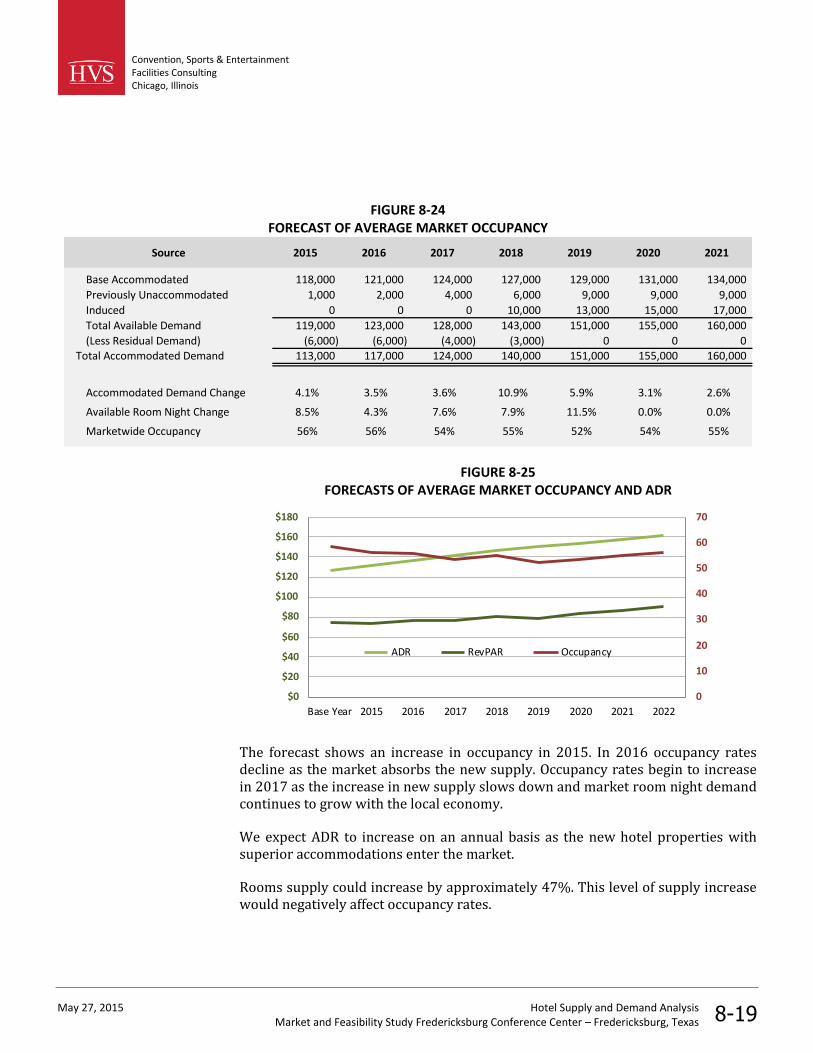
Convention, Sports & Entertainment Facilities Consulting Chicago, Illinois
May 27, 2015 Hotel Supply and Demand Analysis Market and Feasibility Study Fredericksburg Conference Center – Fredericksburg, Texas 8-19
FIGURE 8-24 FORECAST OF AVERAGE MARKET OCCUPANCY
Source 2015 2016 2017 2018 2019 2020 2021
Base Accommodated 118,000 121,000 124,000 127,000 129,000 131,000 134,000
Previously Unaccommodated 1,000 2,000 4,000 6,000 9,000 9,000 9,000
Induced 0 0 0 10,000 13,000 15,000 17,000
Total Available Demand 119,000 123,000 128,000 143,000 151,000 155,000 160,000
(Less Residual Demand) (6,000) (6,000) (4,000) (3,000) 0 0 0Total Accommodated Demand 113,000 117,000 124,000 140,000 151,000 155,000 160,000
Accommodated Demand Change 4.1% 3.5% 3.6% 10.9% 5.9% 3.1% 2.6%
Available Room Night Change 8.5% 4.3% 7.6% 7.9% 11.5% 0.0% 0.0%
Marketwide Occupancy 56% 56% 54% 55% 52% 54% 55%
FIGURE 8-25 FORECASTS OF AVERAGE MARKET OCCUPANCY AND ADR
0
10
20
30
40
50
60
70
$0
$20
$40
$60
$80
$100
$120
$140
$160
$180
Base Year 2015 2016 2017 2018 2019 2020 2021 2022
ADR RevPAR Occupancy
The forecast shows an increase in occupancy in 2015. In 2016 occupancy rates decline as the market absorbs the new supply. Occupancy rates begin to increase in 2017 as the increase in new supply slows down and market room night demand continues to grow with the local economy.
We expect ADR to increase on an annual basis as the new hotel properties with superior accommodations enter the market.
Rooms supply could increase by approximately 47%. This level of supply increase would negatively affect occupancy rates.
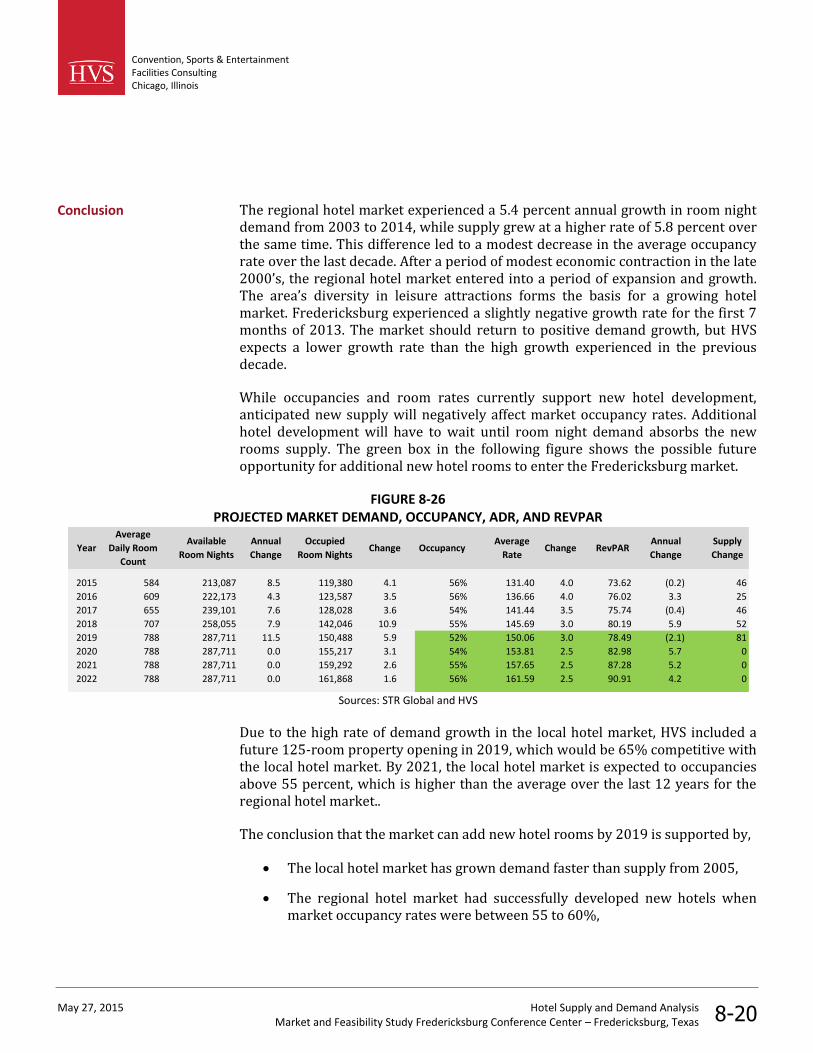
Convention, Sports & Entertainment Facilities Consulting Chicago, Illinois
May 27, 2015 Hotel Supply and Demand Analysis Market and Feasibility Study Fredericksburg Conference Center – Fredericksburg, Texas 8-20
The regional hotel market experienced a 5.4 percent annual growth in room night demand from 2003 to 2014, while supply grew at a higher rate of 5.8 percent over the same time. This difference led to a modest decrease in the average occupancy rate over the last decade. After a period of modest economic contraction in the late 2000’s, the regional hotel market entered into a period of expansion and growth. The area’s diversity in leisure attractions forms the basis for a growing hotel market. Fredericksburg experienced a slightly negative growth rate for the first 7 months of 2013. The market should return to positive demand growth, but HVS expects a lower growth rate than the high growth experienced in the previous decade.
While occupancies and room rates currently support new hotel development, anticipated new supply will negatively affect market occupancy rates. Additional hotel development will have to wait until room night demand absorbs the new rooms supply. The green box in the following figure shows the possible future opportunity for additional new hotel rooms to enter the Fredericksburg market.
FIGURE 8-26 PROJECTED MARKET DEMAND, OCCUPANCY, ADR, AND REVPAR
Year
Average
Daily Room
Count
Available
Room Nights
Annual
Change
Occupied
Room NightsChange Occupancy
Average
RateChange RevPAR
Annual
Change
Supply
Change
2015 584 213,087 8.5 119,380 4.1 56% 131.40 4.0 73.62 (0.2) 46
2016 609 222,173 4.3 123,587 3.5 56% 136.66 4.0 76.02 3.3 25
2017 655 239,101 7.6 128,028 3.6 54% 141.44 3.5 75.74 (0.4) 46
2018 707 258,055 7.9 142,046 10.9 55% 145.69 3.0 80.19 5.9 52
2019 788 287,711 11.5 150,488 5.9 52% 150.06 3.0 78.49 (2.1) 81
2020 788 287,711 0.0 155,217 3.1 54% 153.81 2.5 82.98 5.7 0
2021 788 287,711 0.0 159,292 2.6 55% 157.65 2.5 87.28 5.2 0
2022 788 287,711 0.0 161,868 1.6 56% 161.59 2.5 90.91 4.2 0
Sources: STR Global and HVS
Due to the high rate of demand growth in the local hotel market, HVS included a future 125-room property opening in 2019, which would be 65% competitive with the local hotel market. By 2021, the local hotel market is expected to occupancies above 55 percent, which is higher than the average over the last 12 years for the regional hotel market..
The conclusion that the market can add new hotel rooms by 2019 is supported by,
The local hotel market has grown demand faster than supply from 2005,
The regional hotel market had successfully developed new hotels when market occupancy rates were between 55 to 60%,
Conclusion
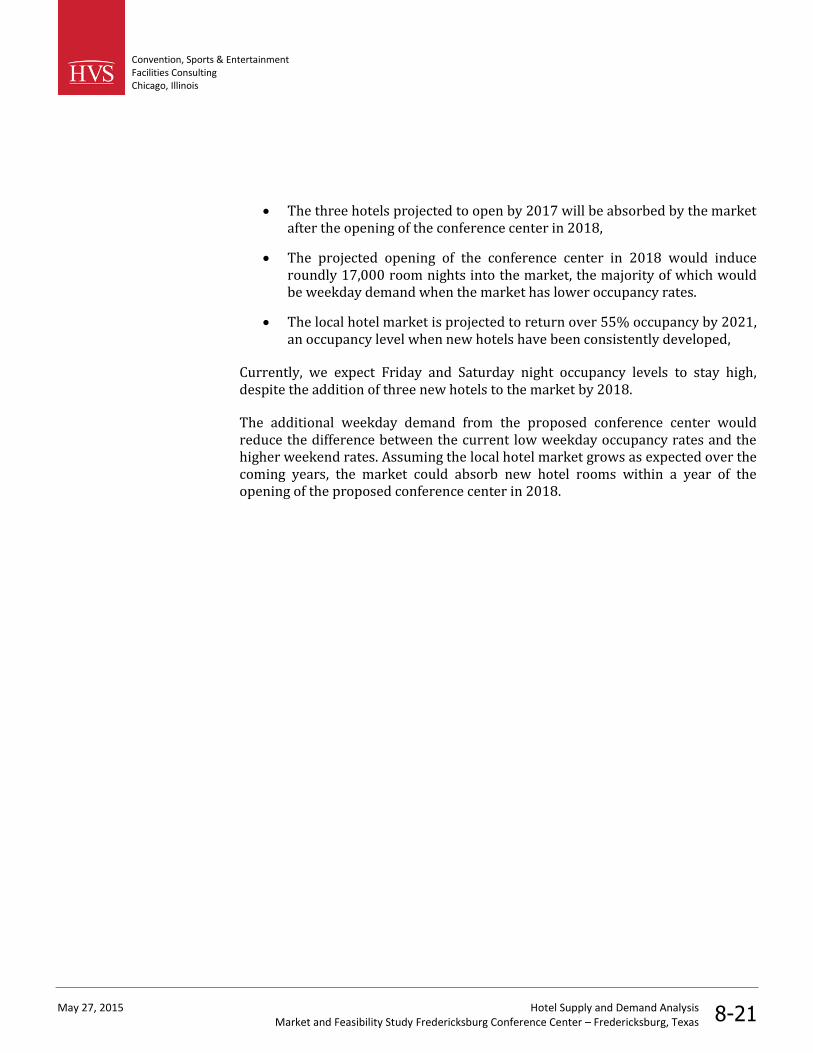
Convention, Sports & Entertainment Facilities Consulting Chicago, Illinois
May 27, 2015 Hotel Supply and Demand Analysis Market and Feasibility Study Fredericksburg Conference Center – Fredericksburg, Texas 8-21
The three hotels projected to open by 2017 will be absorbed by the market after the opening of the conference center in 2018,
The projected opening of the conference center in 2018 would induce roundly 17,000 room nights into the market, the majority of which would be weekday demand when the market has lower occupancy rates.
The local hotel market is projected to return over 55% occupancy by 2021, an occupancy level when new hotels have been consistently developed,
Currently, we expect Friday and Saturday night occupancy levels to stay high, despite the addition of three new hotels to the market by 2018.
The additional weekday demand from the proposed conference center would reduce the difference between the current low weekday occupancy rates and the higher weekend rates. Assuming the local hotel market grows as expected over the coming years, the market could absorb new hotel rooms within a year of the opening of the proposed conference center in 2018.

Convention, Sports & EntertainmentFacilities ConsultingChicago, Illinois
May 27, 2015 Site EvaluationMarket and Feasibility Study Fredericksburg Conference Center – Fredericksburg, Texas
9-1
9. Site Evaluation
The suitability of a site for the development of a conference center is an importantconsideration affecting the economic viability of a facility and its ultimatemarketability. Factors such as size, accessibility, visibility, and the proximity otheramenities have a direct impact on the suitability of a particular site. Therelationship between a conference venue and other nearby existing or plannedland uses can also play an important role in selecting a site. Other factors, such asthe cost of obtaining the site, infrastructure needs, and costs of improving a siteshould also be considered.
Destination appeal is a critical factor in event planner choice. In a highlycompetitive convention center industry in which most cities offer comparablevenues, facility improvement alone does not create a competitive advantage. Theevent planner survey presented in Section 5 demonstrates that event planners arehighly motivated to maximize attendance and choose destinations with this goal inmind. The vitality of the neighborhood surrounding a conference center createsdestination appeal.
In this section, HVS compares the suitability of eight potential locations withinFredericksburg and its surrounding county. With the assistance of the FCVB, HVSidentified and toured these sites which represent a range of existing land uses andownership. They include undeveloped land and vacant, existing structures whichwould require renovation or demolition. Some sites are currently owned byprivate developers and slated for future hotel and other development. Other siteswould require acquisition by the city or other development group. The followingfigure provides a map of the location of the eight sites in relation toFredericksburg. A brief description and detailed aerial view of each potentialconference center site follows.
Potential Sites

Convention, Sports & EntertainmentFacilities ConsultingChicago, Illinois
May 27, 2015 Site EvaluationMarket and Feasibility Study Fredericksburg Conference Center – Fredericksburg, Texas
9-2
FIGURE 9-1MAP OF POTENTIAL SITES
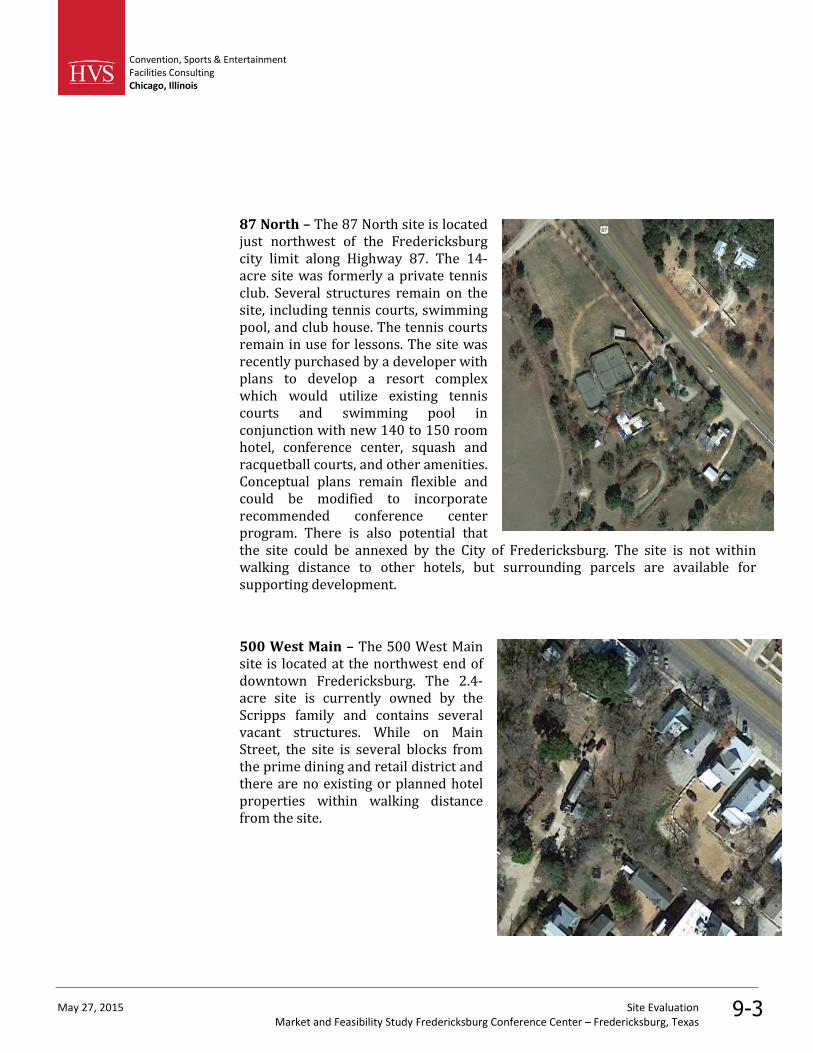
Convention, Sports & EntertainmentFacilities ConsultingChicago, Illinois
May 27, 2015 Site EvaluationMarket and Feasibility Study Fredericksburg Conference Center – Fredericksburg, Texas
9-3
87 North – The 87 North site is locatedjust northwest of the Fredericksburgcity limit along Highway 87. The 14-acre site was formerly a private tennisclub. Several structures remain on thesite, including tennis courts, swimmingpool, and club house. The tennis courtsremain in use for lessons. The site wasrecently purchased by a developer withplans to develop a resort complexwhich would utilize existing tenniscourts and swimming pool inconjunction with new 140 to 150 roomhotel, conference center, squash andracquetball courts, and other amenities.Conceptual plans remain flexible andcould be modified to incorporaterecommended conference centerprogram. There is also potential thatthe site could be annexed by the City of Fredericksburg. The site is not withinwalking distance to other hotels, but surrounding parcels are available forsupporting development.
500 West Main – The 500 West Mainsite is located at the northwest end ofdowntown Fredericksburg. The 2.4-acre site is currently owned by theScripps family and contains severalvacant structures. While on MainStreet, the site is several blocks fromthe prime dining and retail district andthere are no existing or planned hotelproperties within walking distancefrom the site.
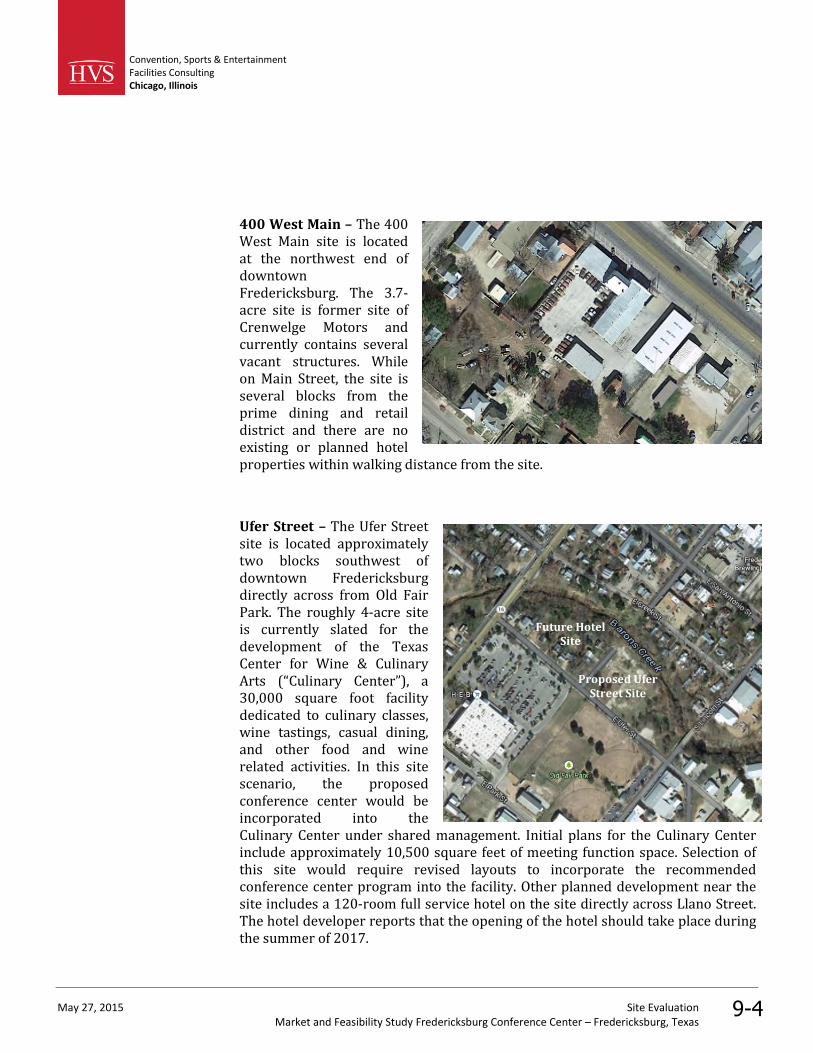
Convention, Sports & EntertainmentFacilities ConsultingChicago, Illinois
May 27, 2015 Site EvaluationMarket and Feasibility Study Fredericksburg Conference Center – Fredericksburg, Texas
9-4
400 West Main – The 400West Main site is locatedat the northwest end ofdowntownFredericksburg. The 3.7-acre site is former site ofCrenwelge Motors andcurrently contains severalvacant structures. Whileon Main Street, the site isseveral blocks from theprime dining and retaildistrict and there are noexisting or planned hotelproperties within walking distance from the site.
Ufer Street – The Ufer Streetsite is located approximatelytwo blocks southwest ofdowntown Fredericksburgdirectly across from Old FairPark. The roughly 4-acre siteis currently slated for thedevelopment of the TexasCenter for Wine & CulinaryArts (“Culinary Center”), a30,000 square foot facilitydedicated to culinary classes,wine tastings, casual dining,and other food and winerelated activities. In this sitescenario, the proposedconference center would beincorporated into theCulinary Center under shared management. Initial plans for the Culinary Centerinclude approximately 10,500 square feet of meeting function space. Selection ofthis site would require revised layouts to incorporate the recommendedconference center program into the facility. Other planned development near thesite includes a 120-room full service hotel on the site directly across Llano Street.The hotel developer reports that the opening of the hotel should take place duringthe summer of 2017.
Proposed UferStreet Site
Future HotelSite
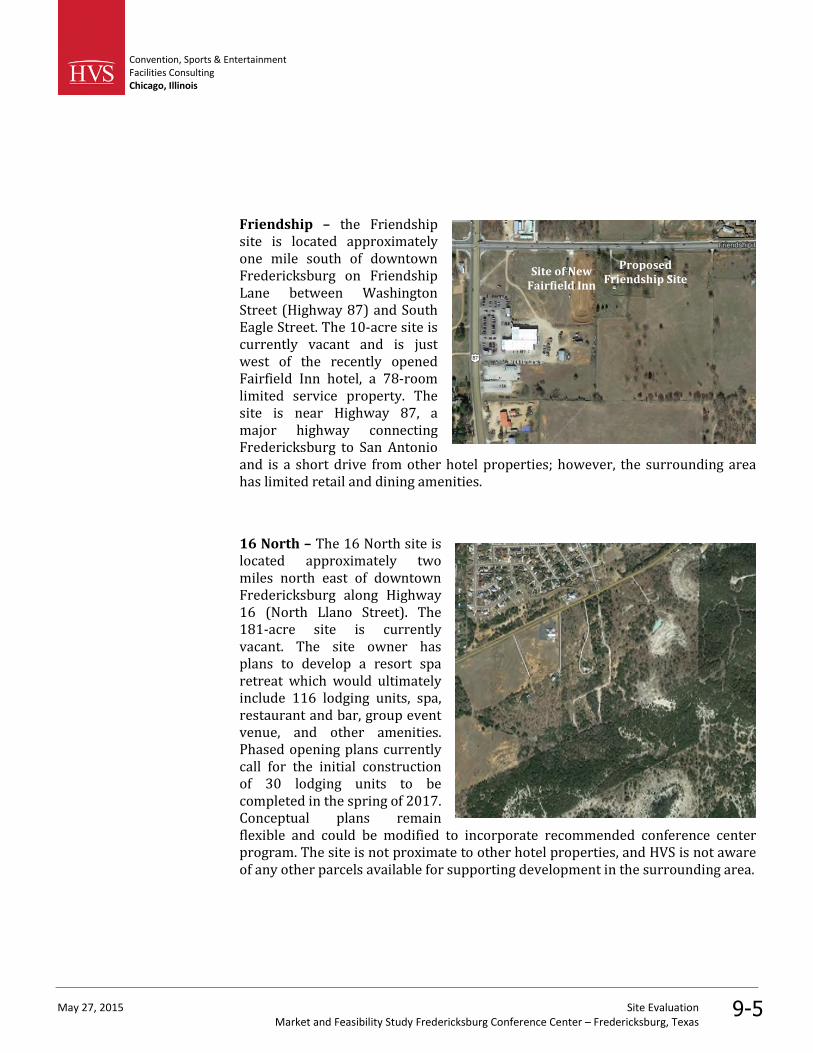
Convention, Sports & EntertainmentFacilities ConsultingChicago, Illinois
May 27, 2015 Site EvaluationMarket and Feasibility Study Fredericksburg Conference Center – Fredericksburg, Texas
9-5
Friendship – the Friendshipsite is located approximatelyone mile south of downtownFredericksburg on FriendshipLane between WashingtonStreet (Highway 87) and SouthEagle Street. The 10-acre site iscurrently vacant and is justwest of the recently openedFairfield Inn hotel, a 78-roomlimited service property. Thesite is near Highway 87, amajor highway connectingFredericksburg to San Antonioand is a short drive from other hotel properties; however, the surrounding areahas limited retail and dining amenities.
16 North – The 16 North site islocated approximately twomiles north east of downtownFredericksburg along Highway16 (North Llano Street). The181-acre site is currentlyvacant. The site owner hasplans to develop a resort sparetreat which would ultimatelyinclude 116 lodging units, spa,restaurant and bar, group eventvenue, and other amenities.Phased opening plans currentlycall for the initial constructionof 30 lodging units to becompleted in the spring of 2017.Conceptual plans remainflexible and could be modified to incorporate recommended conference centerprogram. The site is not proximate to other hotel properties, and HVS is not awareof any other parcels available for supporting development in the surrounding area.
ProposedFriendship Site
Site of NewFairfield Inn
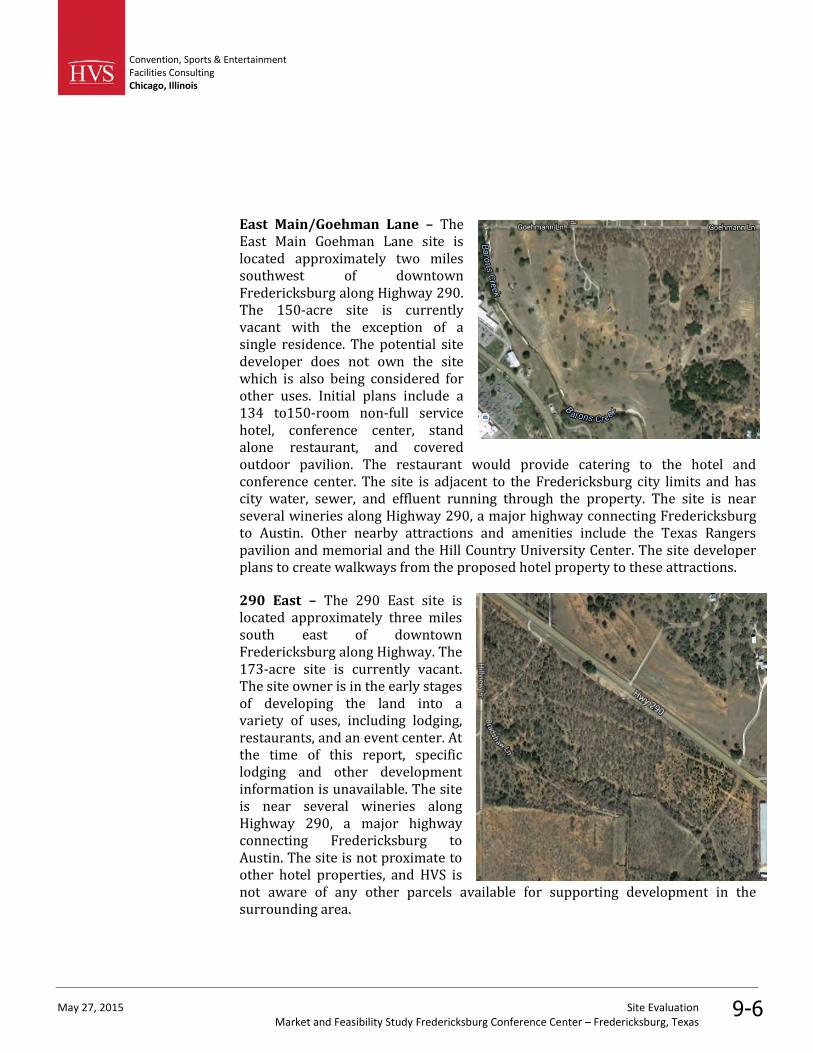
Convention, Sports & EntertainmentFacilities ConsultingChicago, Illinois
May 27, 2015 Site EvaluationMarket and Feasibility Study Fredericksburg Conference Center – Fredericksburg, Texas
9-6
East Main/Goehman Lane – TheEast Main Goehman Lane site islocated approximately two milessouthwest of downtownFredericksburg along Highway 290.The 150-acre site is currentlyvacant with the exception of asingle residence. The potential sitedeveloper does not own the sitewhich is also being considered forother uses. Initial plans include a134 to150-room non-full servicehotel, conference center, standalone restaurant, and coveredoutdoor pavilion. The restaurant would provide catering to the hotel andconference center. The site is adjacent to the Fredericksburg city limits and hascity water, sewer, and effluent running through the property. The site is nearseveral wineries along Highway 290, a major highway connecting Fredericksburgto Austin. Other nearby attractions and amenities include the Texas Rangerspavilion and memorial and the Hill Country University Center. The site developerplans to create walkways from the proposed hotel property to these attractions.
290 East – The 290 East site islocated approximately three milessouth east of downtownFredericksburg along Highway. The173-acre site is currently vacant.The site owner is in the early stagesof developing the land into avariety of uses, including lodging,restaurants, and an event center. Atthe time of this report, specificlodging and other developmentinformation is unavailable. The siteis near several wineries alongHighway 290, a major highwayconnecting Fredericksburg toAustin. The site is not proximate toother hotel properties, and HVS isnot aware of any other parcels available for supporting development in thesurrounding area.
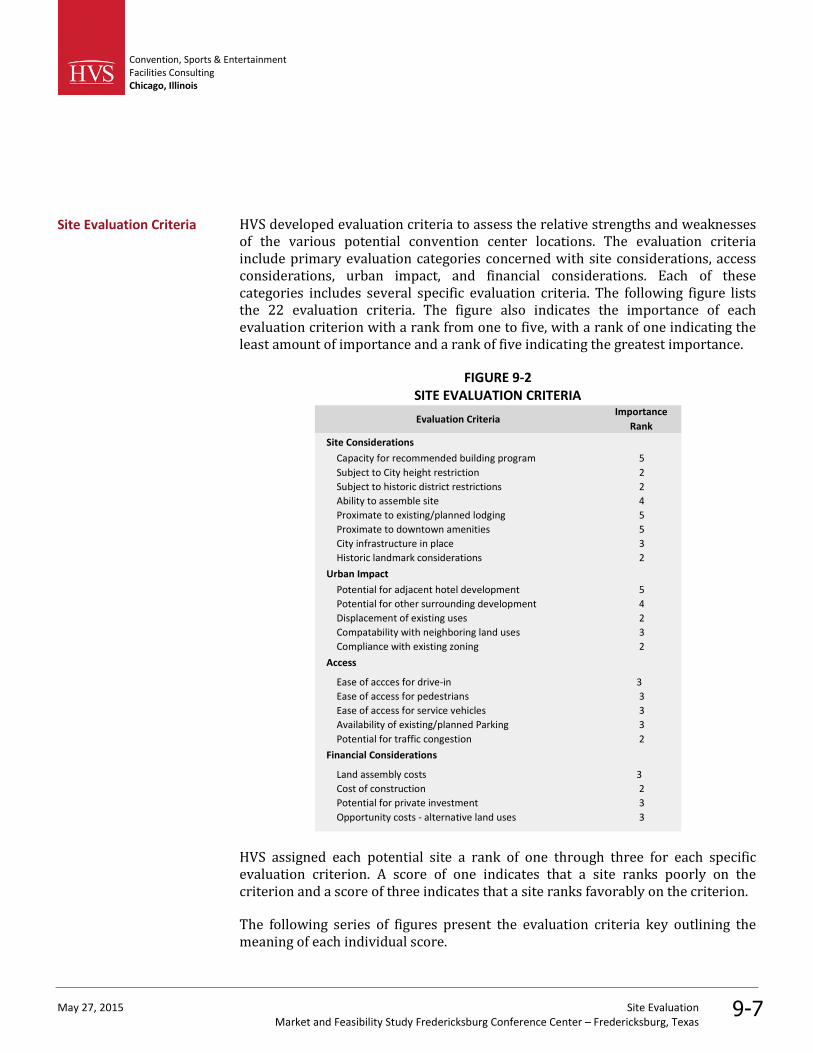
Convention, Sports & EntertainmentFacilities ConsultingChicago, Illinois
May 27, 2015 Site EvaluationMarket and Feasibility Study Fredericksburg Conference Center – Fredericksburg, Texas
9-7
HVS developed evaluation criteria to assess the relative strengths and weaknessesof the various potential convention center locations. The evaluation criteriainclude primary evaluation categories concerned with site considerations, accessconsiderations, urban impact, and financial considerations. Each of thesecategories includes several specific evaluation criteria. The following figure liststhe 22 evaluation criteria. The figure also indicates the importance of eachevaluation criterion with a rank from one to five, with a rank of one indicating theleast amount of importance and a rank of five indicating the greatest importance.
FIGURE 9-2SITE EVALUATION CRITERIA
Evaluation CriteriaImportance
Rank
Site Considerations
Capacity for recommended building program 5
Subject to City height restriction 2
Subject to historic district restrictions 2
Ability to assemble site 4
Proximate to existing/planned lodging 5
Proximate to downtown amenities 5
City infrastructure in place 3
Historic landmark considerations 2
Urban Impact
Potential for adjacent hotel development 5
Potential for other surrounding development 4
Displacement of existing uses 2
Compatability with neighboring land uses 3
Compliance with existing zoning 2
Access
Ease of accces for drive-in 3
Ease of access for pedestrians 3
Ease of access for service vehicles 3
Availability of existing/planned Parking 3
Potential for traffic congestion 2
Financial Considerations
Land assembly costs 3
Cost of construction 2
Potential for private investment 3
Opportunity costs - alternative land uses 3
HVS assigned each potential site a rank of one through three for each specificevaluation criterion. A score of one indicates that a site ranks poorly on thecriterion and a score of three indicates that a site ranks favorably on the criterion.
The following series of figures present the evaluation criteria key outlining themeaning of each individual score.
Site Evaluation Criteria
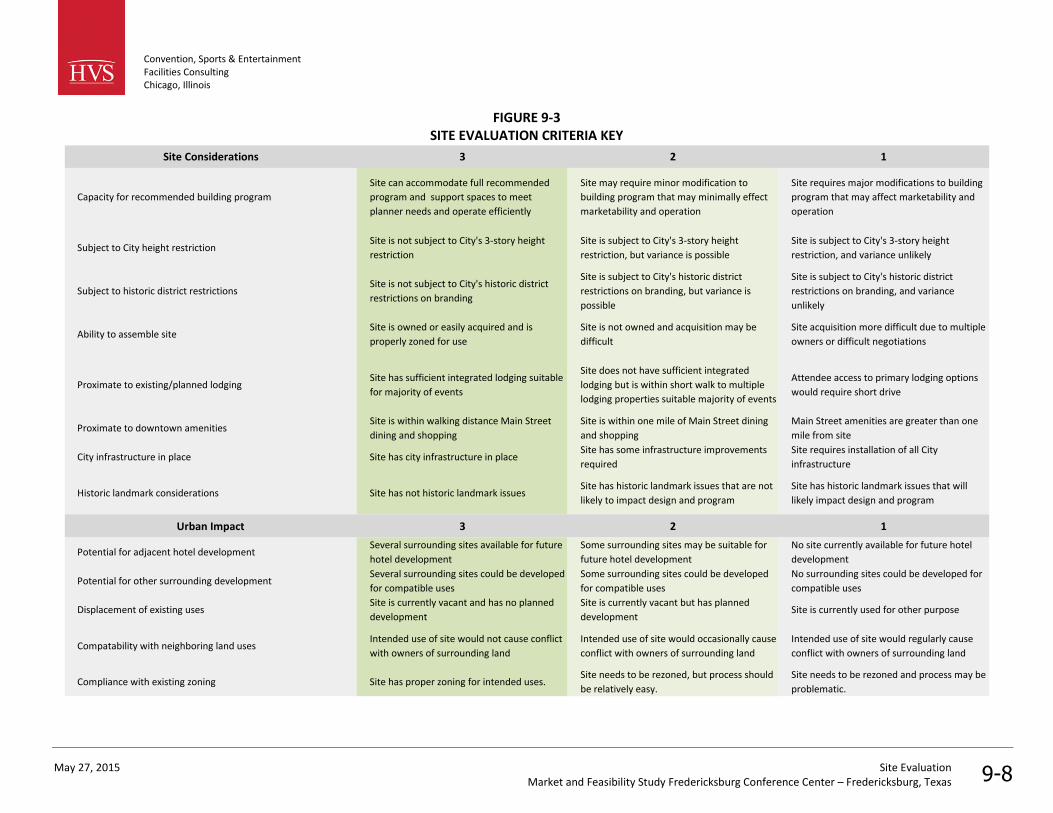
Convention, Sports & EntertainmentFacilities ConsultingChicago, Illinois
May 27, 2015 Site EvaluationMarket and Feasibility Study Fredericksburg Conference Center – Fredericksburg, Texas 9-8
FIGURE 9-3SITE EVALUATION CRITERIA KEY
Site Considerations 3 2 1
Capacity for recommended building program
Site can accommodate full recommended
program and support spaces to meet
planner needs and operate efficiently
Site may require minor modification to
building program that may minimally effect
marketability and operation
Site requires major modifications to building
program that may affect marketability and
operation
Subject to City height restrictionSite is not subject to City's 3-story height
restriction
Site is subject to City's 3-story height
restriction, but variance is possible
Site is subject to City's 3-story height
restriction, and variance unlikely
Subject to historic district restrictionsSite is not subject to City's historic district
restrictions on branding
Site is subject to City's historic district
restrictions on branding, but variance is
possible
Site is subject to City's historic district
restrictions on branding, and variance
unlikely
Ability to assemble siteSite is owned or easily acquired and is
properly zoned for use
Site is not owned and acquisition may be
difficult
Site acquisition more difficult due to multiple
owners or difficult negotiations
Proximate to existing/planned lodgingSite has sufficient integrated lodging suitable
for majority of events
Site does not have sufficient integrated
lodging but is within short walk to multiple
lodging properties suitable majority of events
Attendee access to primary lodging options
would require short drive
Proximate to downtown amenitiesSite is within walking distance Main Street
dining and shopping
Site is within one mile of Main Street dining
and shopping
Main Street amenities are greater than one
mile from site
City infrastructure in place Site has city infrastructure in placeSite has some infrastructure improvements
required
Site requires installation of all City
infrastructure
Historic landmark considerations Site has not historic landmark issuesSite has historic landmark issues that are not
likely to impact design and program
Site has historic landmark issues that will
likely impact design and program
Urban Impact 3 2 1
Potential for adjacent hotel developmentSeveral surrounding sites available for future
hotel development
Some surrounding sites may be suitable for
future hotel development
No site currently available for future hotel
development
Potential for other surrounding developmentSeveral surrounding sites could be developed
for compatible uses
Some surrounding sites could be developed
for compatible uses
No surrounding sites could be developed for
compatible uses
Displacement of existing usesSite is currently vacant and has no planned
development
Site is currently vacant but has planned
developmentSite is currently used for other purpose
Compatability with neighboring land usesIntended use of site would not cause conflict
with owners of surrounding land
Intended use of site would occasionally cause
conflict with owners of surrounding land
Intended use of site would regularly cause
conflict with owners of surrounding land
Compliance with existing zoning Site has proper zoning for intended uses.Site needs to be rezoned, but process should
be relatively easy.
Site needs to be rezoned and process may be
problematic.
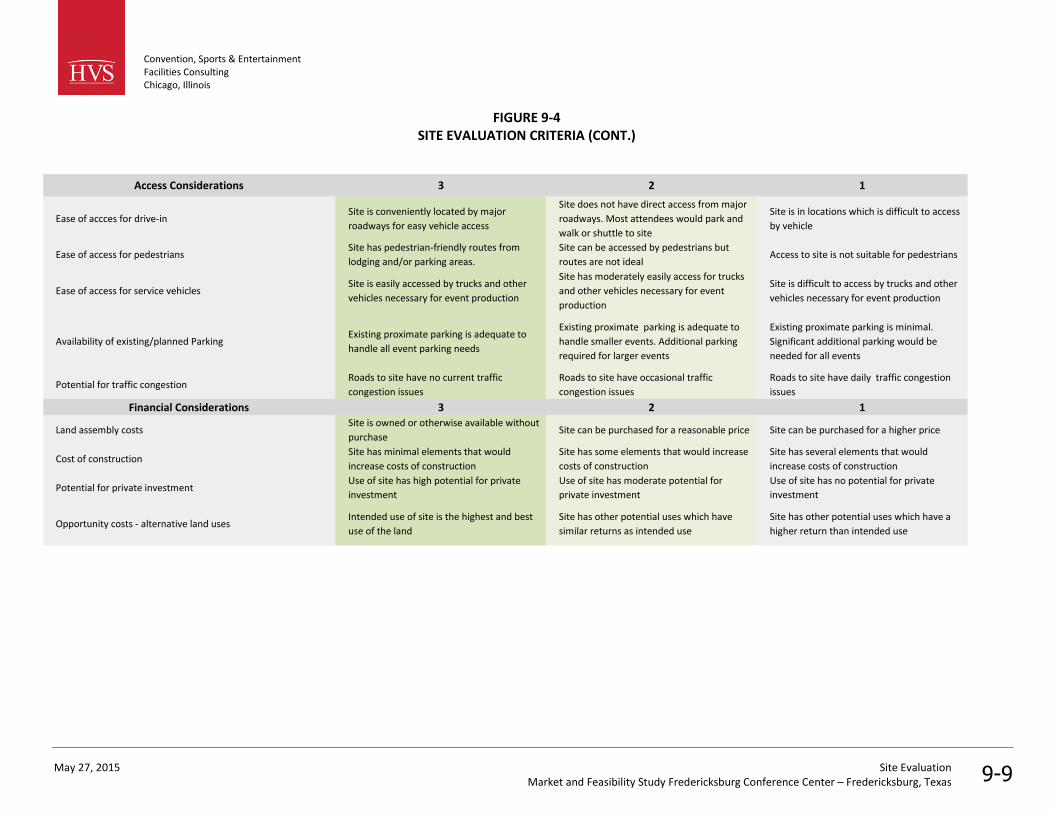
Convention, Sports & EntertainmentFacilities ConsultingChicago, Illinois
May 27, 2015 Site EvaluationMarket and Feasibility Study Fredericksburg Conference Center – Fredericksburg, Texas 9-9
FIGURE 9-4SITE EVALUATION CRITERIA (CONT.)
Access Considerations 3 2 1
Ease of accces for drive-inSite is conveniently located by major
roadways for easy vehicle access
Site does not have direct access from major
roadways. Most attendees would park and
walk or shuttle to site
Site is in locations which is difficult to access
by vehicle
Ease of access for pedestriansSite has pedestrian-friendly routes from
lodging and/or parking areas.
Site can be accessed by pedestrians but
routes are not idealAccess to site is not suitable for pedestrians
Ease of access for service vehiclesSite is easily accessed by trucks and other
vehicles necessary for event production
Site has moderately easily access for trucks
and other vehicles necessary for event
production
Site is difficult to access by trucks and other
vehicles necessary for event production
Availability of existing/planned ParkingExisting proximate parking is adequate to
handle all event parking needs
Existing proximate parking is adequate to
handle smaller events. Additional parking
required for larger events
Existing proximate parking is minimal.
Significant additional parking would be
needed for all events
Potential for traffic congestionRoads to site have no current traffic
congestion issues
Roads to site have occasional traffic
congestion issues
Roads to site have daily traffic congestion
issues
Financial Considerations 3 2 1
Land assembly costsSite is owned or otherwise available without
purchaseSite can be purchased for a reasonable price Site can be purchased for a higher price
Cost of constructionSite has minimal elements that would
increase costs of construction
Site has some elements that would increase
costs of construction
Site has several elements that would
increase costs of construction
Potential for private investmentUse of site has high potential for private
investment
Use of site has moderate potential for
private investment
Use of site has no potential for private
investment
Opportunity costs - alternative land usesIntended use of site is the highest and best
use of the land
Site has other potential uses which have
similar returns as intended use
Site has other potential uses which have a
higher return than intended use
Convention, Sports & EntertainmentFacilities ConsultingChicago, Illinois
May 27, 2015 Site EvaluationMarket and Feasibility Study Fredericksburg Conference Center – Fredericksburg, Texas 9-10
HVS rated the eight potential sites on 22 evaluation criteria. The rating of eachsite, combined with the relative importance of each criteria results in a weightedscore for each potential location and a summary of the primary pros and cons foreach site. This process identified preferred sites which would likely be the mostsuitable for the proposed conference center.
Final site selection of a specific land parcel for the facility would depend onevaluating multiple factors which are outside the scope of this study, includingnegotiations with land owners, specific legal and financing requirements, andenvironmental and geologic investigations. As a result, a suitable site in thepreferred location may not be suitable for development.
The following figure provides a summary of this evaluation.
Site EvaluationSummary

Convention, Sports & EntertainmentFacilities ConsultingChicago, Illinois
May 27, 2015 Site EvaluationMarket and Feasibility Study Fredericksburg Conference Center – Fredericksburg, Texas 9-11
FIGURE 9-5SITE EVALUATION SUMMARY
Criteria Weight2
87N
orth
500
Wes
tM
ain
400
Wes
tM
ain
Ufe
rSt
reet
Frie
ndsh
ip
16N
orth
East
Mai
n/G
oehm
anLa
ne
290
East
Capacity for recommended building program 5 3 1 1 2 3 3 3 3
Subject to City height restriction 2 3 1 1 1 1 3 3 3
Subject to historic district restrictions 2 3 1 1 3 3 3 3 3
Ability to assemble site 4 3 2 2 3 3 3 2 3
Proximate to existing/planned lodging 5 3 1 1 2 1 1 3 3
Proximate to downtown amenities 5 1 2 2 3 1 1 1 1
City infrastructure in place 3 2 3 3 3 3 1 3 1
Historic landmark considerations 2 3 2 2 3 3 3 3 3
Sub-Total Site Considerations 23 16 15 22 20 20 23 22
Potential for adjacent hotel development 5 2 1 1 2 2 1 2 2
Potential for other surrounding development 4 3 3 3 3 3 2 2 2
Displacement of existing uses 2 3 2 3 3 1 3 3 3
Compatibility with neighboring land uses 3 3 2 2 2 3 3 3 3
Compliance with existing zoning 2 3 2 2 2 1 3 3 3
Sub-Total Urban Impact 14 10 11 12 10 12 13 13
Ease of access for drive-in 3 3 2 2 2 3 3 3 3
Ease of access for pedestrians 3 1 2 2 3 1 1 1 1
Ease of access for service vehicles 3 3 2 2 2 3 3 3 3
Availability of existing/planned Parking 3 3 2 2 2 3 3 3 3
Potential for traffic congestion 2 2 2 1 2 3 3 3 3
Sub-Total Access 18 15 15 18 19 19 19 19
Land assembly costs 3 3 2 2 2 2 3 3 3
Cost of construction 2 2 2 2 2 2 2 2 2
Potential for private investment 3 3 2 2 2 3 3 3 3
Opportunity costs - alternative land uses 3 2 2 2 3 2 2 2 2
Sub-Total Financial Considerations 11 10 10 11 10 11 11 11
Total All Criteria 66 51 51 63 59 62 66 65
Site
Urb
anA
cce
ssFi
nan
ce
Weighted Scores3 MAX
87N
ort
h
500
Wes
tM
ain
400
Wes
tM
ain
Ufe
rSt
reet
Frie
nd
ship
16N
ort
h
East
Mai
n/
Go
ehm
anLa
ne
290
East
Site 84 71 45 45 70 60 58 70 68
Urban 48 43 31 33 38 35 34 39 39
Access 42 34 28 26 31 36 36 36 36
Finance 33 28 22 22 25 25 28 28 28
Total 207 176 126 126 164 156 156 173 171
Percent of Maximum 85% 61% 61% 79% 75% 75% 84% 83%
1) Each criteria scored on a 1 to 3 scale based on site evaluation criteria described in Figures 9-3 and 9-4.
2) Rank of the importance of the criteria on a scale of 1 to 5 with five being most important and 1 being least important.
3) The importance of the criteria (weight) X the conformance score = the weighted score.
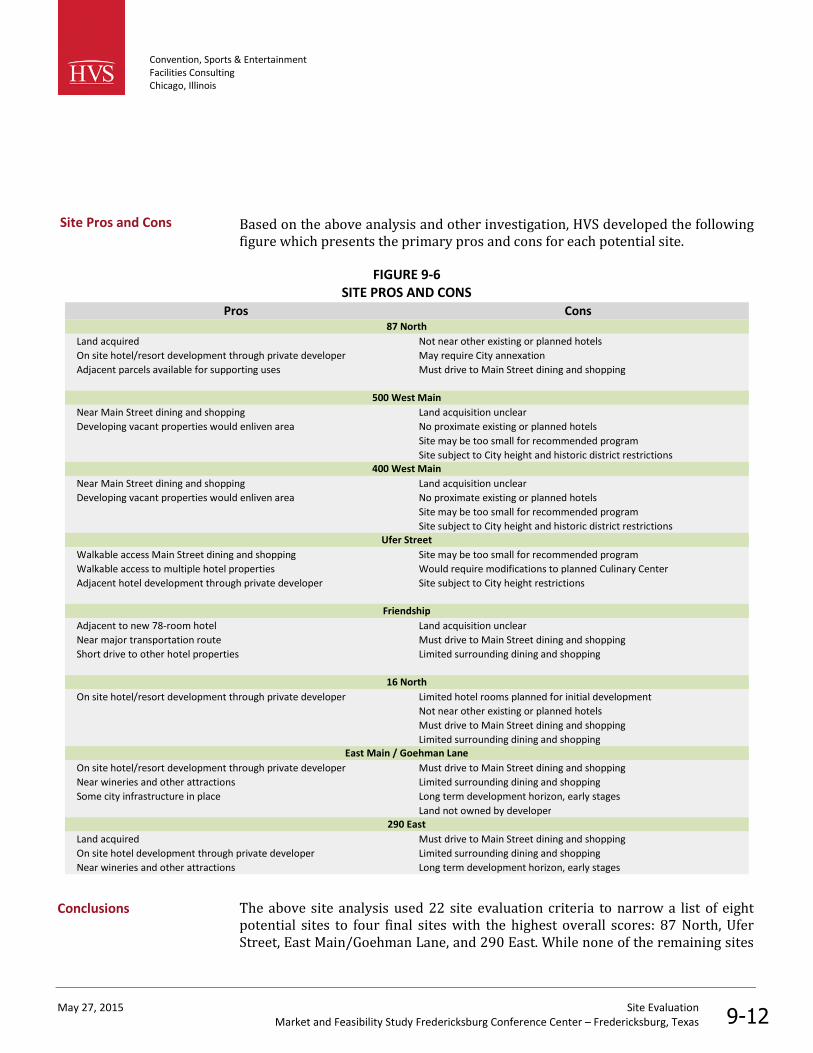
Convention, Sports & EntertainmentFacilities ConsultingChicago, Illinois
May 27, 2015 Site EvaluationMarket and Feasibility Study Fredericksburg Conference Center – Fredericksburg, Texas 9-12
Based on the above analysis and other investigation, HVS developed the followingfigure which presents the primary pros and cons for each potential site.
FIGURE 9-6SITE PROS AND CONS
Pros Cons
Land acquired Not near other existing or planned hotels
On site hotel/resort development through private developer May require City annexation
Adjacent parcels available for supporting uses Must drive to Main Street dining and shopping
Near Main Street dining and shopping Land acquisition unclear
Developing vacant properties would enliven area No proximate existing or planned hotels
Site may be too small for recommended program
Site subject to City height and historic district restrictions
Near Main Street dining and shopping Land acquisition unclear
Developing vacant properties would enliven area No proximate existing or planned hotels
Site may be too small for recommended program
Site subject to City height and historic district restrictions
Walkable access Main Street dining and shopping Site may be too small for recommended program
Walkable access to multiple hotel properties Would require modifications to planned Culinary Center
Adjacent hotel development through private developer Site subject to City height restrictions
Adjacent to new 78-room hotel Land acquisition unclear
Near major transportation route Must drive to Main Street dining and shopping
Short drive to other hotel properties Limited surrounding dining and shopping
On site hotel/resort development through private developer Limited hotel rooms planned for initial development
Not near other existing or planned hotels
Must drive to Main Street dining and shopping
Limited surrounding dining and shopping
On site hotel/resort development through private developer Must drive to Main Street dining and shopping
Near wineries and other attractions Limited surrounding dining and shopping
Some city infrastructure in place Long term development horizon, early stages
Land not owned by developer
Land acquired Must drive to Main Street dining and shopping
On site hotel development through private developer Limited surrounding dining and shopping
Near wineries and other attractions Long term development horizon, early stages
290 East
87 North
500 West Main
400 West Main
Ufer Street
Friendship
16 North
East Main / Goehman Lane
The above site analysis used 22 site evaluation criteria to narrow a list of eightpotential sites to four final sites with the highest overall scores: 87 North, UferStreet, East Main/Goehman Lane, and 290 East. While none of the remaining sites
Site Pros and Cons
Conclusions
Convention, Sports & EntertainmentFacilities ConsultingChicago, Illinois
May 27, 2015 Site EvaluationMarket and Feasibility Study Fredericksburg Conference Center – Fredericksburg, Texas 9-13
possess a fatal flaw that would preclude them from consideration, they are not aswell suited for the recommended conference center program.
HVS recommends further investigation into the four highest scoring sites,including the following.
Preparation of concept plans and preliminary cost estimate for the proposedconference center by a design firm,
Initial discussions with land owners of the 87 North and 290 East sites tounderstand ability to incorporate conference center program into currentconceptual plans and the timing of anticipated developments,
Discussions with potential developer of East Main/Goehman Lane site tounderstand status of land acquisition process, ability to incorporateconference center program plans, and the timing of anticipated developments,
Discussions with all developers to assess their willingness to reserves parcelsof land for future complementary development surrounding the conferencecenter,
Assess the need and potential for each site to attract private operators toprovide transportation for event attendees to restaurants, museums, andother points of interest in Fredericksburg, and
Reevaluation of the initial plans for Texas Center for Wine and Culinary Artson the Ufer Street site to assess ability to incorporate conference centerprogram into the current plans.
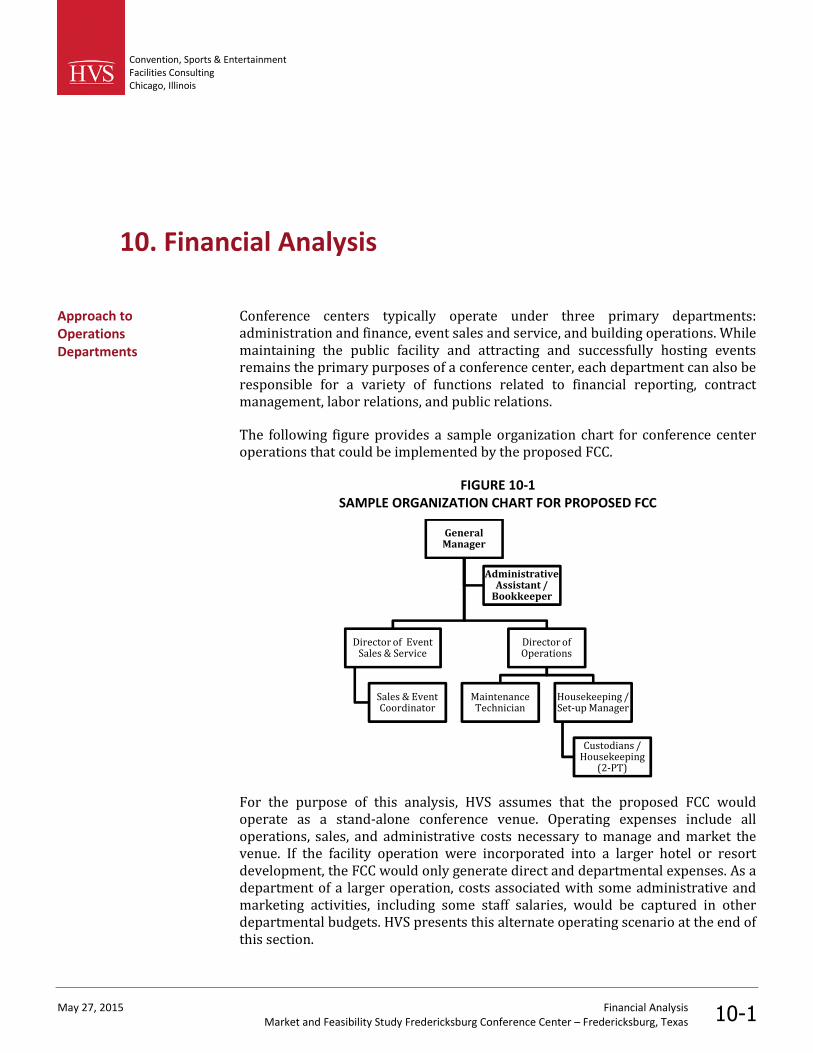
Convention, Sports & EntertainmentFacilities ConsultingChicago, Illinois
May 27, 2015 Financial AnalysisMarket and Feasibility Study Fredericksburg Conference Center – Fredericksburg, Texas 10-1
10. Financial Analysis
Conference centers typically operate under three primary departments:administration and finance, event sales and service, and building operations. Whilemaintaining the public facility and attracting and successfully hosting eventsremains the primary purposes of a conference center, each department can also beresponsible for a variety of functions related to financial reporting, contractmanagement, labor relations, and public relations.
The following figure provides a sample organization chart for conference centeroperations that could be implemented by the proposed FCC.
FIGURE 10-1SAMPLE ORGANIZATION CHART FOR PROPOSED FCC
For the purpose of this analysis, HVS assumes that the proposed FCC wouldoperate as a stand-alone conference venue. Operating expenses include alloperations, sales, and administrative costs necessary to manage and market thevenue. If the facility operation were incorporated into a larger hotel or resortdevelopment, the FCC would only generate direct and departmental expenses. As adepartment of a larger operation, costs associated with some administrative andmarketing activities, including some staff salaries, would be captured in otherdepartmental budgets. HVS presents this alternate operating scenario at the end ofthis section.
GeneralManager
Director of EventSales & Service
Sales & EventCoordinator
Director ofOperations
MaintenanceTechnician
Housekeeping /Set-up Manager
Custodians /Housekeeping
(2-PT)
AdministrativeAssistant /
Bookkeeper
Approach toOperationsDepartments
Convention, Sports & EntertainmentFacilities ConsultingChicago, Illinois
May 27, 2015 Financial AnalysisMarket and Feasibility Study Fredericksburg Conference Center – Fredericksburg, Texas 10-2
Outsourcing a conference center’s food and beverage service to a third party likelyresults in the loss of potential revenue for the facility. However, it also represents asignificant reduction in the need for food service staff and operating expensesrelated to food and beverage services. HVS assumes that, regardless of facilitymanagement structure, the proposed FCC would contract with third party foodservice providers in one of two basic forms.
First, the FCC could contract with a single food service provider who would beresponsible for all catering and concessions needs of the facility. In thisscenario, the food service provider would place a permanent staff at the venue,including sales personnel, event management, and kitchen staff. Eventorganizers would contract directly with the food service company, and the FCCwould receive a commission based on food and beverage sales. The mainbenefits to this option would be the consistency of product, quality, and serviceand the ability of facility and food service staffs to work together in bringingevents to the venue.
The second option would be to develop a list of pre-approved caterers fromwhich an event organizer could select. This list would typically contain localrestaurants and catering companies, allowing for greater local participation inevents, a primary benefit of this option. In order to be on the pre-approved list,companies would agree to pay the FCC a commission based on an event’s grossfood and beverage sales.
Regardless of management approach, communication is critical between the cityofficials, day‐to‐day managers of the facility, and the general public. It is common practice for facility managers to provide annual reports to officials in charge ofguiding public policy decisions related to conference centers.
HVS recommends that an annual report prepared by facility management shouldinclude, at a minimum, a description of events and attendance at the FCC, as wellas a description of operating revenues and expenses associated with managing thevenue. At least two years of historical annual data should be included in the annualreport for comparison purposes. Based on our knowledge of industry standards,HVS suggests that the most common types of information typically available to amunicipal owner of a conference center include the following items:
• Aggregated data on historical events and attendance, organized by event type,
• Historical operating revenues and expenses associated with the venue,organized by year,
• Organizational chart depicting staffing structure for the venue,
Reporting Policies
Convention, Sports & EntertainmentFacilities ConsultingChicago, Illinois
May 27, 2015 Financial AnalysisMarket and Feasibility Study Fredericksburg Conference Center – Fredericksburg, Texas 10-3
• Strategic plan, expressing marketing strategies, future booking and operationalgoals, and an approach to achieve those goals,
• Annual estimates of room nights and the economic and fiscal impactsgenerated by the venue’s events, and
• An overview of positive impacts on the Fredericksburg community includingdata on charitable and community service events.
Facility managers typically collect most of this data, with the exception of roomnight and economic impact estimates which may require input from FCVB records.
HVS recommends presenting summaries of all the preceding data points in anannual report document that can be distributed to city officials. Implementation ofthis annual comprehensive reporting process may enable the City to communicatebetter the overall success and importance of the FCC to the general public. In mostcommunities, this is a collaborative process that helps to ensure continued publicsupport of the meetings and conference industry and public investment inconference related assets and marketing organizations
The FCVB would serve as the primary sales and marketing organization for theproposed FCC. The FCVB’s most basic sales efforts would involve educating eventplanners about Fredericksburg and the FCC. These efforts would includeadvertising campaigns, participation in tradeshows and conferences that targetevent planners, sales presentations, and coordinating familiarization tours forevent planners. The FCVB currently leads similar efforts in these areas for the localhotels and other venues.
If event planners consider Fredericksburg as a site for their events, the FCVB alsoplays the role of event facilitator in two critical areas. First, the FCVB staff matchesevent planners’ facility requirements with the most suitable event space in themarket. Second, FCVB staff matches event planners’ hotel requirements with themost suitable lodging properties in the community.
A CVB provides a centralized organization that can serve as an entry point orinformation hub for visitors from all segments, including the group segment,business transient travelers, and leisure travelers. Hotels located in the samecommunity often organize and agree to tax their revenues with the goal of fundingsuch an organization. The arrangement places the funding burden on those whomost benefit. In the case of conference and visitors bureaus like the FCVB, hotelsprimarily benefit from the marketing organization’s efforts. To a lesser extent,restaurants, retail stores, visitor attractions, service providers, and car rentalcompanies benefit. For this reason, hotel taxes (and sometimes restaurant taxes
Sales & Marketing
Convention, Sports & EntertainmentFacilities ConsultingChicago, Illinois
May 27, 2015 Financial AnalysisMarket and Feasibility Study Fredericksburg Conference Center – Fredericksburg, Texas 10-4
and car rental taxes) place among the most common sources of funding for theseorganizations in the United States.
In the greater Fredericksburg area, local hotel tax revenues are the primarysources of funding for the FCVB’s $2 million dollar operating budget. The FCVB is a501(c)(6) nonprofit corporation, a common organizational structure fordestination marketing organizations. The FCVB staff consists of fifteen full andpart-time professional positions. The FCVB dedicates two staff members tomeeting sales and services. Other staff is responsible for visitor sales and services,tourism sales, marketing, public relations, and administration.
The FCVB’s current staffing level and staff functions are consistent with otherregional and state markets without a primary conference venue. However, thefuture development of the proposed FCC should coordinate with the creation of atleast one additional conference sales and service position well in advance of theopening of the proposed FCC. Additional staff dedicated to meetings andconferences would allow conference marketing to operate independently oftourism and destination marketing. This organizational structure is typical of mostindependent CVBs around the country.
HVS recommends that the proposed FCC’s governing body and the FCVB formalizetheir working relationship to give the FCVB booking priority at the proposed FCCfor dates at least 12 to 18 months in the future and beyond. Any dates within the12 to 18‐month booking window would be open to any potential user groups on a first‐come, first‐served basis. This sort of arrangement between conference centers and conference bureaus exists in many locations throughout the country.Such a booking policy maximizes the likelihood of attracting high‐impact conferences and meetings from out of town groups by giving them bookingpriority. Opening up the schedule inside the 12 to 18-month booking window,however, allows a facility to fill in empty dates with lower‐impact events to maximize revenue for the facility and serve as a valuable resource to thecommunity for charitable and other civic events.
HVS uses a proprietary financial operating model to estimate revenues andexpenses at conference centers. This model quantifies the key variables andoperating ratios that determine revenue potential and expenses levels. Unlessotherwise indicated, the model assumes an annual inflation rate of 2.5% applies toboth revenues and expenses.
Operating FCC revenue line items include facility rental, food and beverage sales,and event services. The model uses a series of revenue assumptions based onattendance, floor area utilization, or occupied days. Attendance is measured indelegate-days, the average daily attendance times the number of event days. Floor
Estimates of FinancialOperations
Convention, Sports & EntertainmentFacilities ConsultingChicago, Illinois
May 27, 2015 Financial AnalysisMarket and Feasibility Study Fredericksburg Conference Center – Fredericksburg, Texas 10-5
area utilization is measured in Gross Square Foot Days (“GSFD”)—the amount offloor area rented times the number of days it is rented including move-in andmove-out days. Occupied days only include those days in which attendees arepresent.
To formulate the revenue assumptions, HVS relied on historical operations datafrom comparable venues, industry information, and information on price levelsfrom local area sources. We adjusted the assumptions for inflation and otheranticipated trends in price levels.
The figure below summarizes the operating income assumptions for the proposedFCC by type of event. A brief description of the each revenue item follows.
FIGURE 10-2REVENUE ASSUMPTIONS
Facility RentalEvent Services
(Gross)
Food & Beverage
(Gross)per per per
GSFD GSFD Attendee
Conferences $0.15 $0.08 $75.00
Meetings 0.20 0.08 30.00
Local Meetings 0.12 0.05 10.00
Banquets 0.10 0.08 35.00
Consumer Shows/Fairs 0.15 0.10 4.50
Other 0.08 0.03 0.00
Type
Facility Rental—Facility rental revenue includes the revenue the proposed FCCwould receive from clients that reserve one or more function areas in the facility.Despite having published rates, conference centers typically charge rental feesbased on negotiated daily rental fees. Not all events incur a facility rental fee. Afacility may reduce or waive the room rental charges in order to book an eventthat has a strong economic impact on the local market. The above rates are basedon the number of gross square foot days consistent with industry averages andcomparable venues in Texas.
Event Services—Event Services include the fees charged to tenants for servicesthat could include business services, audio and video technical assistance, set-upand take down of function spaces, cleaning services, security services, electricityand other utilities, commissions from decorators and other services provided bythird-party contractors at events. Many events also require audio, video,communications and internet services. Banquets and other upscale events canrequire elaborate decorating services. Almost all events require cleaning services;cleaning of common areas may be complimentary for most events while cleaning
Revenue Assumptions
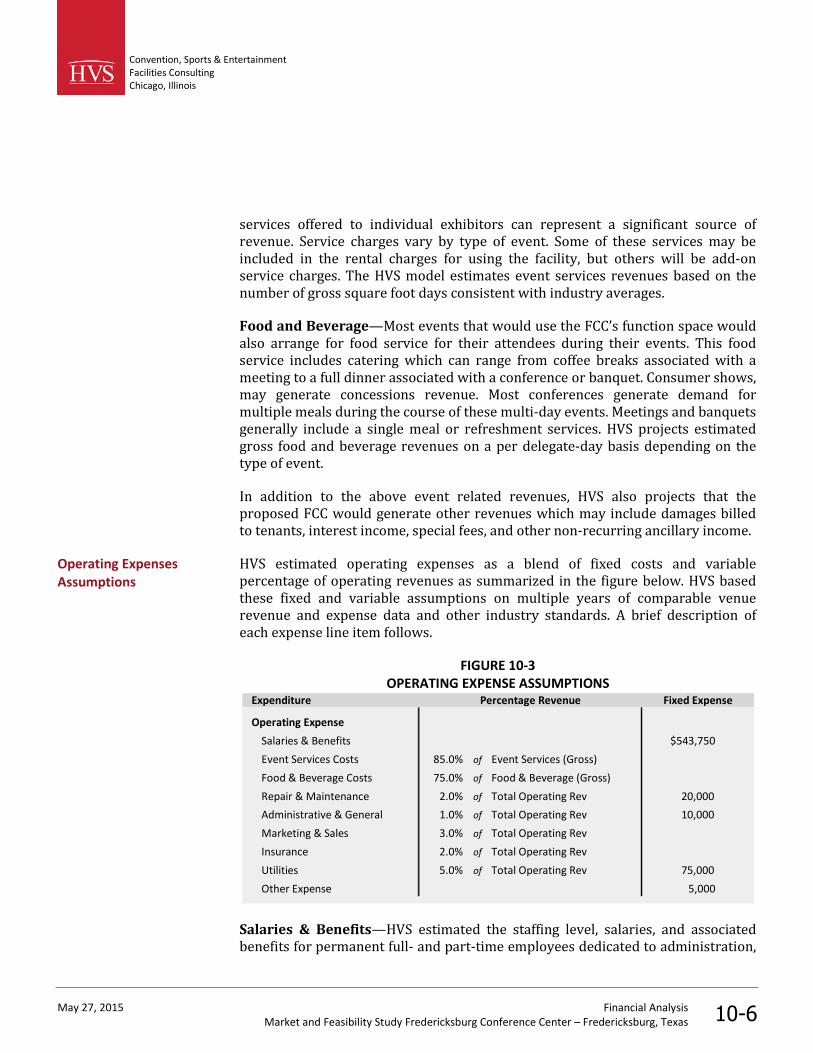
Convention, Sports & EntertainmentFacilities ConsultingChicago, Illinois
May 27, 2015 Financial AnalysisMarket and Feasibility Study Fredericksburg Conference Center – Fredericksburg, Texas 10-6
services offered to individual exhibitors can represent a significant source ofrevenue. Service charges vary by type of event. Some of these services may beincluded in the rental charges for using the facility, but others will be add-onservice charges. The HVS model estimates event services revenues based on thenumber of gross square foot days consistent with industry averages.
Food and Beverage—Most events that would use the FCC’s function space wouldalso arrange for food service for their attendees during their events. This foodservice includes catering which can range from coffee breaks associated with ameeting to a full dinner associated with a conference or banquet. Consumer shows,may generate concessions revenue. Most conferences generate demand formultiple meals during the course of these multi-day events. Meetings and banquetsgenerally include a single meal or refreshment services. HVS projects estimatedgross food and beverage revenues on a per delegate-day basis depending on thetype of event.
In addition to the above event related revenues, HVS also projects that theproposed FCC would generate other revenues which may include damages billedto tenants, interest income, special fees, and other non-recurring ancillary income.
HVS estimated operating expenses as a blend of fixed costs and variablepercentage of operating revenues as summarized in the figure below. HVS basedthese fixed and variable assumptions on multiple years of comparable venuerevenue and expense data and other industry standards. A brief description ofeach expense line item follows.
FIGURE 10-3OPERATING EXPENSE ASSUMPTIONS
Expenditure Percentage Revenue Fixed Expense
Operating Expense
Salaries & Benefits 0.0% ### $0 $543,750
Event Services Costs 85.0% of Event Services (Gross) 0
Food & Beverage Costs 75.0% of Food & Beverage (Gross) 0
Repair & Maintenance 2.0% of Total Operating Rev 20,000
Administrative & General 1.0% of Total Operating Rev 10,000
Marketing & Sales 3.0% of Total Operating Rev 0
Insurance 2.0% of Total Operating Rev 0
Utilities 5.0% of Total Operating Rev 75,000
Other Expense 0.0% ### $0 5,000
Salaries & Benefits—HVS estimated the staffing level, salaries, and associatedbenefits for permanent full- and part-time employees dedicated to administration,
Operating ExpensesAssumptions

Convention, Sports & EntertainmentFacilities ConsultingChicago, Illinois
May 27, 2015 Financial AnalysisMarket and Feasibility Study Fredericksburg Conference Center – Fredericksburg, Texas 10-7
marketing, building operations, and other functions. This category does notinclude part time food & beverage staffing, which is included in vendor costs. Thefollowing figure provides a summary of the staff positions and associated salaries.
FIGURE 10-4PROPOSED VENUE STAFFING
Position Number Salary Total Salary
ADMINISTRATION/FINANCEGeneral Manager 1 80,000 80,000Administrative Assistant/Bookkeeper 1 40,000 40,000
SALES & MARKETINGDirector of Event Sales & Service 1 60,000 60,000Sales/Event Coordinator 1 35,000 35,000
BUILDING OPERATIONSDirector of Operations 1 55,000 55,000Maintenance Technician 1 35,000 35,000Housekeeping/Set-up Manager 1 40,000 40,000Custodians/Housekeeping (PT) 2 20,000 40,000
TOTALS 9 385,000Benefits 25% 96,250
TOTAL SALARY & BENEFITS 481,250
Event Services Costs—Event services costs are the costs incurred by the facilityfor client reimbursed expenses such as audio visual set-up, security, cleaning, andevent set-up. HVS estimated event services costs as a percentage of gross eventservice revenue based on industry standards.
Food & Beverage Costs—HVS assumes that the food and beverage services wouldbe operated by a third party food service operator. This operator may be a singleentity that contracts with the facility to provide all catering and concessionsservices or a list of approved caterers that would contract directly with eventorganizers. HVS assumes the average commission paid by food service operatorsat 25 percent of gross sales. Food service operators would be responsible for allcosts, including sales staff, event labor, raw materials, and other supplies.
Repair & Maintenance—This category includes both routine and one-timefacility maintenance expenses that are primarily the responsibility of in-housefacility operations personnel. It also includes more specialized activities, such asHVAC system maintenance, electrical work, and maintenance of other mechanicalsystems often contracted out to third parties.

Convention, Sports & EntertainmentFacilities ConsultingChicago, Illinois
May 27, 2015 Financial AnalysisMarket and Feasibility Study Fredericksburg Conference Center – Fredericksburg, Texas 10-8
Administrative & General—Office and administrative operations incur day-to-day facility expenses. Such expenses typically include travel, telephone, printing,permits, and other miscellaneous services.
Marketing & Sales—This category includes production of event marketingmaterials, travel, advertising, other costs associated with event sales.
Insurance—Insurance costs include property insurance and other liabilityinsurance required for facility operations.
Utilities—Utilities, including electricity, gas, water, and other charges oftenrepresent one of the largest expenses incurred by facility operators.
Other Expenses—Other expenses could include expenses such as miscellaneousoperations costs, legal costs, special training expenses, collection costs, creditlosses, bank fees, and other small miscellaneous expenses.
Capital Maintenance Reserve—HVS assumes the establishment of a capitalmaintenance reserve equal to 3 percent of operating revenues. This reserve wouldfund the long-term maintenance and replacement of facility furnishings andsystems.
The figure below presents the five-year financial projections for the proposed FCCincluding the multi-purpose ballroom and meeting spaces. The projections are ininflated dollars beginning January 1, 2018, the assumed opening of the proposedFCC.
Operating Pro Forma
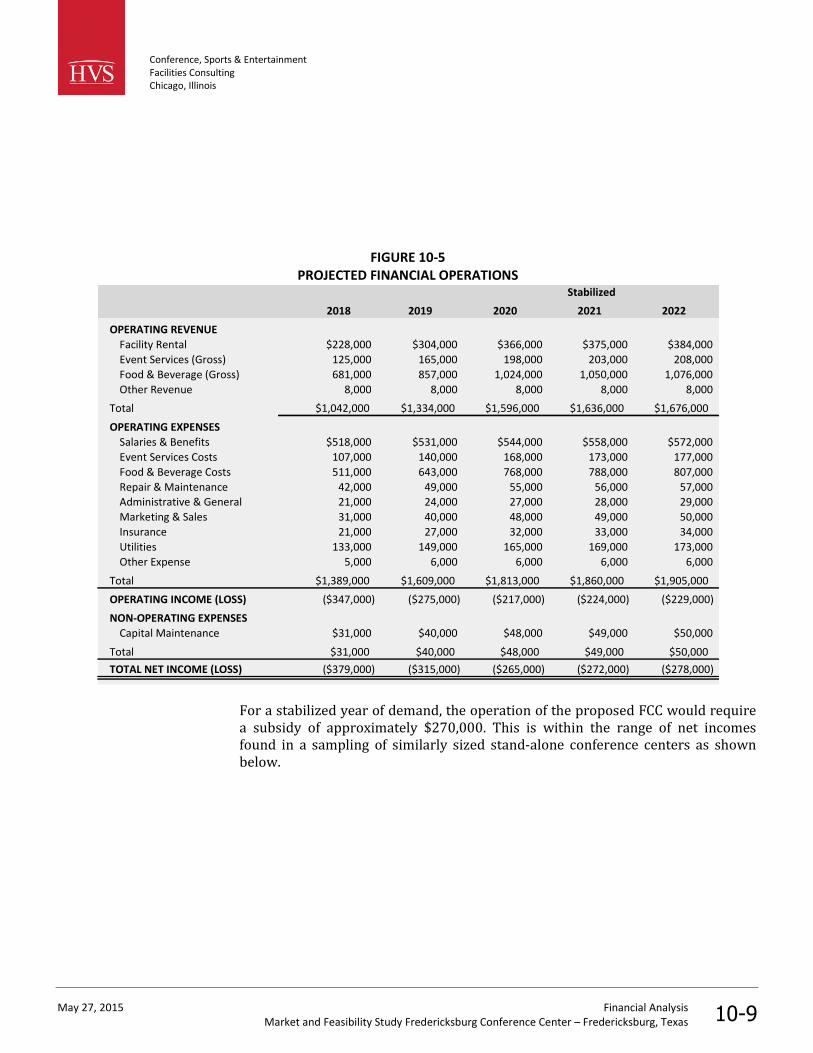
Conference, Sports & EntertainmentFacilities ConsultingChicago, Illinois
May 27, 2015 Financial AnalysisMarket and Feasibility Study Fredericksburg Conference Center – Fredericksburg, Texas 10-9
FIGURE 10-5PROJECTED FINANCIAL OPERATIONS
Stabilized
2018 2019 2020 2021 2022
OPERATING REVENUE
Facility Rental $228,000 $304,000 $366,000 $375,000 $384,000
Event Services (Gross) 125,000 165,000 198,000 203,000 208,000
Food & Beverage (Gross) 681,000 857,000 1,024,000 1,050,000 1,076,000
Other Revenue 8,000 8,000 8,000 8,000 8,000
Total $1,042,000 $1,334,000 $1,596,000 $1,636,000 $1,676,000
OPERATING EXPENSES
Salaries & Benefits $518,000 $531,000 $544,000 $558,000 $572,000
Event Services Costs 107,000 140,000 168,000 173,000 177,000
Food & Beverage Costs 511,000 643,000 768,000 788,000 807,000
Repair & Maintenance 42,000 49,000 55,000 56,000 57,000Administrative & General 21,000 24,000 27,000 28,000 29,000
Marketing & Sales 31,000 40,000 48,000 49,000 50,000
Insurance 21,000 27,000 32,000 33,000 34,000
Utilities 133,000 149,000 165,000 169,000 173,000
Other Expense 5,000 6,000 6,000 6,000 6,000
Total $1,389,000 $1,609,000 $1,813,000 $1,860,000 $1,905,000
OPERATING INCOME (LOSS) ($347,000) ($275,000) ($217,000) ($224,000) ($229,000)
NON-OPERATING EXPENSES
Capital Maintenance $31,000 $40,000 $48,000 $49,000 $50,000
Total $31,000 $40,000 $48,000 $49,000 $50,000
TOTAL NET INCOME (LOSS) ($379,000) ($315,000) ($265,000) ($272,000) ($278,000)
For a stabilized year of demand, the operation of the proposed FCC would requirea subsidy of approximately $270,000. This is within the range of net incomesfound in a sampling of similarly sized stand-alone conference centers as shownbelow.
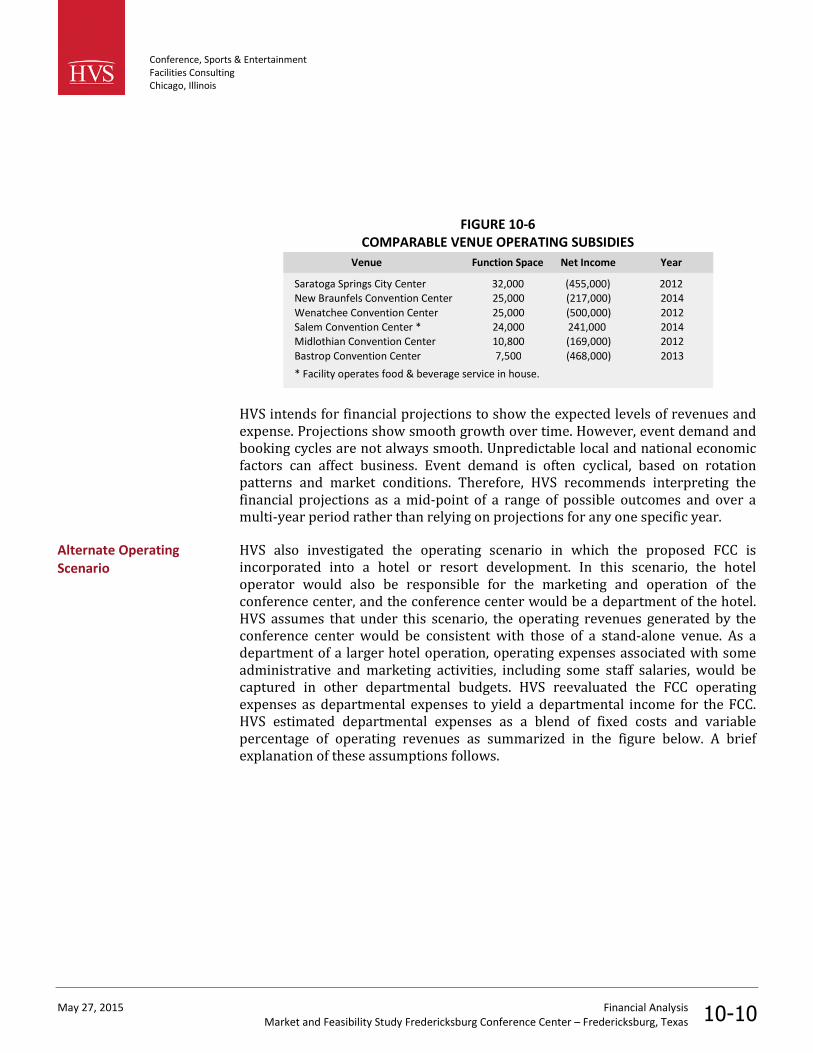
Conference, Sports & EntertainmentFacilities ConsultingChicago, Illinois
May 27, 2015 Financial AnalysisMarket and Feasibility Study Fredericksburg Conference Center – Fredericksburg, Texas 10-10
FIGURE 10-6COMPARABLE VENUE OPERATING SUBSIDIES
Venue Function Space Net Income Year
Saratoga Springs City Center 32,000 (455,000) 2012New Braunfels Convention Center 25,000 (217,000) 2014
Wenatchee Convention Center 25,000 (500,000) 2012Salem Convention Center * 24,000 241,000 2014Midlothian Convention Center 10,800 (169,000) 2012
Bastrop Convention Center 7,500 (468,000) 2013
* Facility operates food & beverage service in house.
HVS intends for financial projections to show the expected levels of revenues andexpense. Projections show smooth growth over time. However, event demand andbooking cycles are not always smooth. Unpredictable local and national economicfactors can affect business. Event demand is often cyclical, based on rotationpatterns and market conditions. Therefore, HVS recommends interpreting thefinancial projections as a mid-point of a range of possible outcomes and over amulti-year period rather than relying on projections for any one specific year.
HVS also investigated the operating scenario in which the proposed FCC isincorporated into a hotel or resort development. In this scenario, the hoteloperator would also be responsible for the marketing and operation of theconference center, and the conference center would be a department of the hotel.HVS assumes that under this scenario, the operating revenues generated by theconference center would be consistent with those of a stand-alone venue. As adepartment of a larger hotel operation, operating expenses associated with someadministrative and marketing activities, including some staff salaries, would becaptured in other departmental budgets. HVS reevaluated the FCC operatingexpenses as departmental expenses to yield a departmental income for the FCC.HVS estimated departmental expenses as a blend of fixed costs and variablepercentage of operating revenues as summarized in the figure below. A briefexplanation of these assumptions follows.
Alternate OperatingScenario
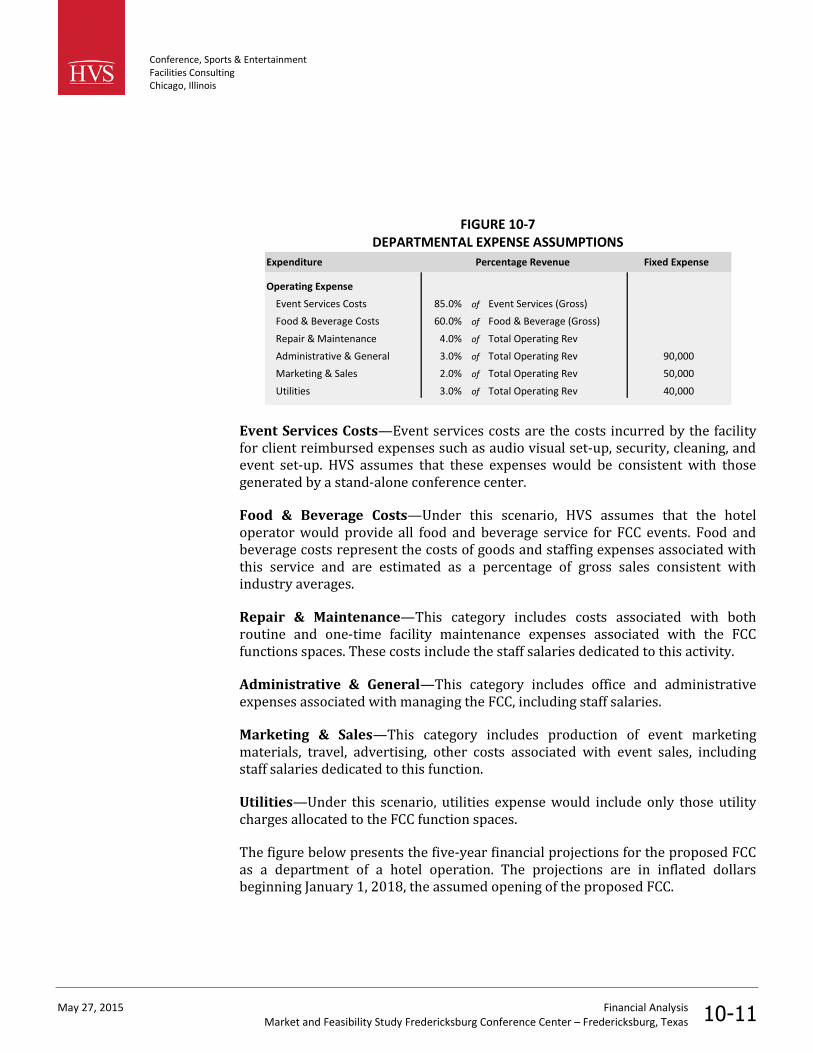
Conference, Sports & EntertainmentFacilities ConsultingChicago, Illinois
May 27, 2015 Financial AnalysisMarket and Feasibility Study Fredericksburg Conference Center – Fredericksburg, Texas 10-11
FIGURE 10-7DEPARTMENTAL EXPENSE ASSUMPTIONS
Expenditure Percentage Revenue Fixed Expense
Operating Expense
Event Services Costs 85.0% of Event Services (Gross) $0
Food & Beverage Costs 60.0% of Food & Beverage (Gross) 0
Repair & Maintenance 4.0% of Total Operating Rev 0
Administrative & General 3.0% of Total Operating Rev 90,000
Marketing & Sales 2.0% of Total Operating Rev 50,000
Utilities 3.0% of Total Operating Rev 40,000
Event Services Costs—Event services costs are the costs incurred by the facilityfor client reimbursed expenses such as audio visual set-up, security, cleaning, andevent set-up. HVS assumes that these expenses would be consistent with thosegenerated by a stand-alone conference center.
Food & Beverage Costs—Under this scenario, HVS assumes that the hoteloperator would provide all food and beverage service for FCC events. Food andbeverage costs represent the costs of goods and staffing expenses associated withthis service and are estimated as a percentage of gross sales consistent withindustry averages.
Repair & Maintenance—This category includes costs associated with bothroutine and one-time facility maintenance expenses associated with the FCCfunctions spaces. These costs include the staff salaries dedicated to this activity.
Administrative & General—This category includes office and administrativeexpenses associated with managing the FCC, including staff salaries.
Marketing & Sales—This category includes production of event marketingmaterials, travel, advertising, other costs associated with event sales, includingstaff salaries dedicated to this function.
Utilities—Under this scenario, utilities expense would include only those utilitycharges allocated to the FCC function spaces.
The figure below presents the five-year financial projections for the proposed FCCas a department of a hotel operation. The projections are in inflated dollarsbeginning January 1, 2018, the assumed opening of the proposed FCC.
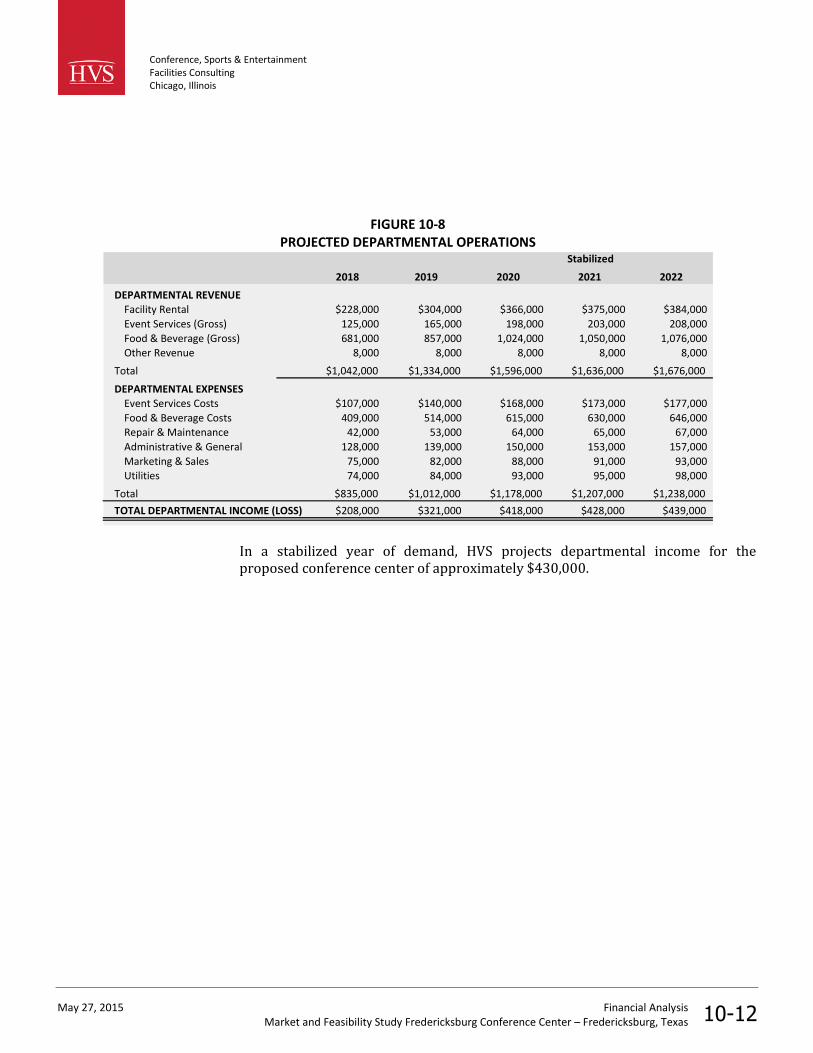
Conference, Sports & EntertainmentFacilities ConsultingChicago, Illinois
May 27, 2015 Financial AnalysisMarket and Feasibility Study Fredericksburg Conference Center – Fredericksburg, Texas 10-12
FIGURE 10-8PROJECTED DEPARTMENTAL OPERATIONS
Stabilized
2018 2019 2020 2021 2022
DEPARTMENTAL REVENUE
Facility Rental $228,000 $304,000 $366,000 $375,000 $384,000
Event Services (Gross) 125,000 165,000 198,000 203,000 208,000
Food & Beverage (Gross) 681,000 857,000 1,024,000 1,050,000 1,076,000
Other Revenue 8,000 8,000 8,000 8,000 8,000
Total $1,042,000 $1,334,000 $1,596,000 $1,636,000 $1,676,000
DEPARTMENTAL EXPENSES
Event Services Costs $107,000 $140,000 $168,000 $173,000 $177,000
Food & Beverage Costs 409,000 514,000 615,000 630,000 646,000
Repair & Maintenance 42,000 53,000 64,000 65,000 67,000
Administrative & General 128,000 139,000 150,000 153,000 157,000
Marketing & Sales 75,000 82,000 88,000 91,000 93,000
Utilities 74,000 84,000 93,000 95,000 98,000
Total $835,000 $1,012,000 $1,178,000 $1,207,000 $1,238,000
TOTAL DEPARTMENTAL INCOME (LOSS) $208,000 $321,000 $418,000 $428,000 $439,000
In a stabilized year of demand, HVS projects departmental income for theproposed conference center of approximately $430,000.
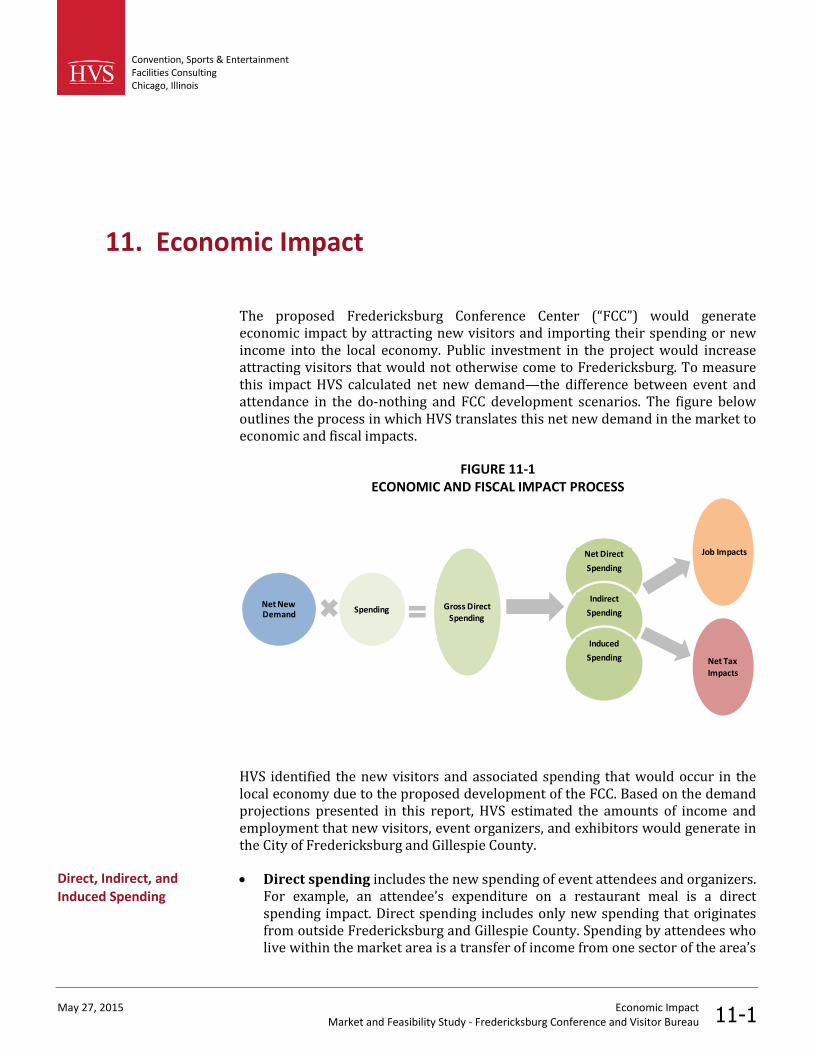
Convention, Sports & EntertainmentFacilities ConsultingChicago, Illinois
May 27, 2015 Economic ImpactMarket and Feasibility Study - Fredericksburg Conference and Visitor Bureau 11-1
11. Economic Impact
The proposed Fredericksburg Conference Center (“FCC”) would generateeconomic impact by attracting new visitors and importing their spending or newincome into the local economy. Public investment in the project would increaseattracting visitors that would not otherwise come to Fredericksburg. To measurethis impact HVS calculated net new demand—the difference between event andattendance in the do-nothing and FCC development scenarios. The figure belowoutlines the process in which HVS translates this net new demand in the market toeconomic and fiscal impacts.
FIGURE 11-1ECONOMIC AND FISCAL IMPACT PROCESS
HVS identified the new visitors and associated spending that would occur in thelocal economy due to the proposed development of the FCC. Based on the demandprojections presented in this report, HVS estimated the amounts of income andemployment that new visitors, event organizers, and exhibitors would generate inthe City of Fredericksburg and Gillespie County.
Direct spending includes the new spending of event attendees and organizers.For example, an attendee’s expenditure on a restaurant meal is a directspending impact. Direct spending includes only new spending that originatesfrom outside Fredericksburg and Gillespie County. Spending by attendees wholive within the market area is a transfer of income from one sector of the area’s
Gross DirectSpending
Net Direct
Spending
Indirect
Spending
Induced
Spending
Job Impacts
Spending
Net Tax
Impacts
Net NewDemand
Direct, Indirect, andInduced Spending
Convention, Sports & EntertainmentFacilities ConsultingChicago, Illinois
May 27, 2015 Economic ImpactMarket and Feasibility Study - Fredericksburg Conference and Visitor Bureau 11-2
economy to another; therefore, this analysis does not count spending by localresidents as a new economic impact.
Indirect spending follows from the business spending resulting from theinitial direct spending. For example, an event attendee’s direct expenditure ona restaurant meal causes the restaurant to purchase food and other items fromsuppliers. The portion of these restaurant purchases that remain within countas indirect impacts.
Induced spending represents the change in local consumption due to thepersonal spending by employees whose incomes change from direct andindirect spending. For example, a waiter at a local restaurant may have morepersonal income as a result of an event attendee dining at the restaurant. Theamount of the increased income that the waiter spends in the local economy isan induced impact.
To generate direct spending estimates, HVS applied assumptions about theamounts of new spending generated by FCC events. HVS used the IMPLAN input-output model of the local economy to estimate indirect and induced spending. Thesum of direct, indirect, and induced spending estimates make up the totalestimated spending impact of the proposed development of the FCC.
Some refer to indirect and induced impacts as multiplier effects. The relationshipbetween direct spending and the multiplier effects vary based upon the specificsize and characteristics of a local area’s economy.
The following figure
HVS identified four sources of new direct spending impacts:
Overnight Guests: Visitors to Fredericksburg who require overnight lodging,including conference delegates, meeting attendees, and attendees at other FCCevents. Overnight delegate spending includes the spending on hotel catering byexhibitors and event organizers in addition to the personal spending ofindividual guests.
Daytrip Attendees: Visitors to the FCC who do not require paid lodging. Inmost markets, day-trippers typically spend money on meals, shopping, localtransportation, recreation and entertainment, and other goods and serviceswhile in town.
Event Organizers: Individuals, associations, or other organizations that plan,sponsor, organize, and coordinate events that take place at FCC facilities. Inaddition to facility spending, event organizers also spend on lodging, meals,
Sources of DirectSpending

Convention, Sports & EntertainmentFacilities ConsultingChicago, Illinois
May 27, 2015 Economic ImpactMarket and Feasibility Study - Fredericksburg Conference and Visitor Bureau 11-3
local transportation, facility rentals, equipment rentals, and other goods andservices required to plan and organize a successful event.
Estimation of new spending of each of these sources involves three sets ofassumptions: 1) the number of new visitors to the market, 2) the geographiclocation of their spending, and 3) the amounts typically spent by each of thesources.
HVS estimated the percentage of each visitor type that would come from outsidethe market rather than from the local area. The spending estimates only includenew visitor spending because non-residents import income, whereas residentstransfer income already in the market area.
Overnight Guests – HVS assumes that 90% of overnight guests attending FCCevents would require hotel or motel lodging in the local market. Someovernight guests may stay with friends and family or outside the market.
Day Trips – Estimates are based on the percentage of the population for themarket area as a percentage of the total drive time population defined as thetwo-hour drive time.
Exhibitor/Organizer spending on Attendees/Delegates – HVS based estimateson the percentage of attendees by events organized and exhibited bycompanies that would otherwise not hold or participate in an event inFredericksburg.
The product of the visitor forecasts and the percent of demand new to the marketyields an estimate of the sources of impact shown in the table below. That is:
Total Overnight Guests X Percent New = New Overnight Stays
Total Day Trips X Percent New = New Day Trips
Total Delegate Days X Percent New = New Delegate Days
The figure below shows the number of new visitors to Fredericksburg andGillespie County that generate new spending.
New Visitors
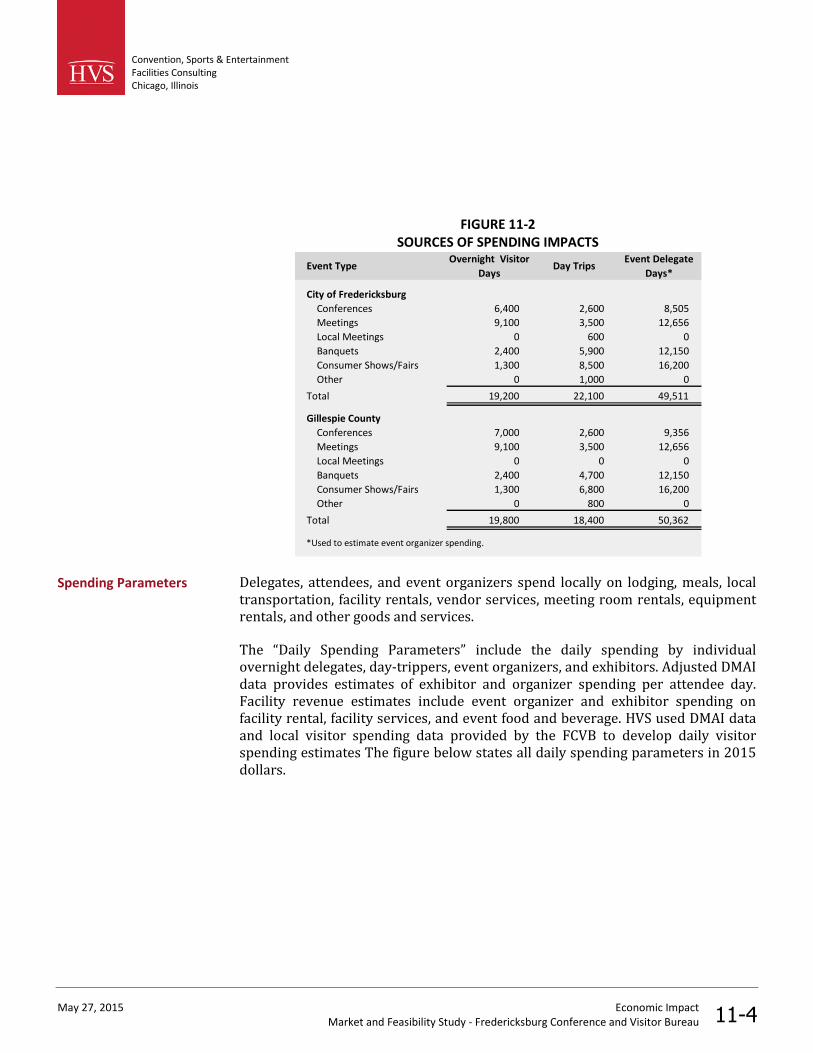
Convention, Sports & EntertainmentFacilities ConsultingChicago, Illinois
May 27, 2015 Economic ImpactMarket and Feasibility Study - Fredericksburg Conference and Visitor Bureau 11-4
FIGURE 11-2SOURCES OF SPENDING IMPACTS
Event TypeOvernight Visitor
DaysDay Trips
Event Delegate
Days*
City of Fredericksburg
Conferences 6,400 2,600 8,505
Meetings 9,100 3,500 12,656
Local Meetings 0 600 0
Banquets 2,400 5,900 12,150
Consumer Shows/Fairs 1,300 8,500 16,200
Other 0 1,000 0
Total 19,200 22,100 49,511
Gillespie County
Conferences 7,000 2,600 9,356
Meetings 9,100 3,500 12,656
Local Meetings 0 0 0
Banquets 2,400 4,700 12,150
Consumer Shows/Fairs 1,300 6,800 16,200
Other 0 800 0
Total 19,800 18,400 50,362
*Used to estimate event organizer spending.
Delegates, attendees, and event organizers spend locally on lodging, meals, localtransportation, facility rentals, vendor services, meeting room rentals, equipmentrentals, and other goods and services.
The “Daily Spending Parameters” include the daily spending by individualovernight delegates, day-trippers, event organizers, and exhibitors. Adjusted DMAIdata provides estimates of exhibitor and organizer spending per attendee day.Facility revenue estimates include event organizer and exhibitor spending onfacility rental, facility services, and event food and beverage. HVS used DMAI dataand local visitor spending data provided by the FCVB to develop daily visitorspending estimates The figure below states all daily spending parameters in 2015dollars.
Spending Parameters
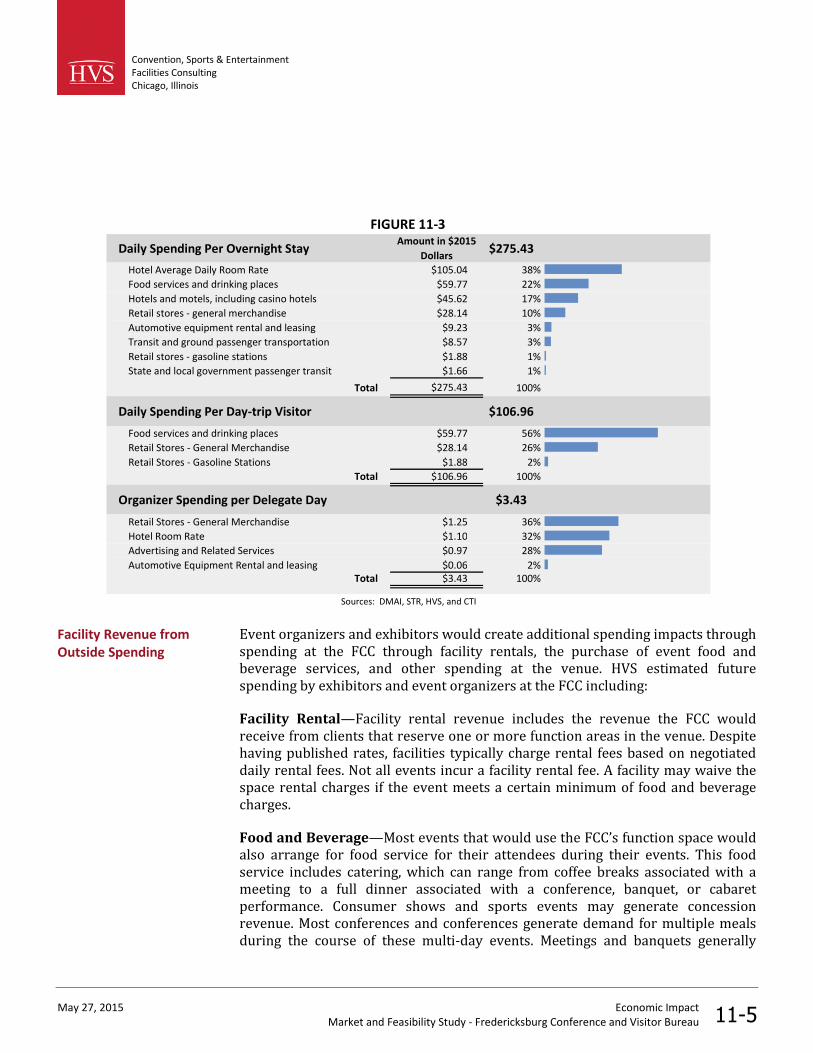
Convention, Sports & EntertainmentFacilities ConsultingChicago, Illinois
May 27, 2015 Economic ImpactMarket and Feasibility Study - Fredericksburg Conference and Visitor Bureau 11-5
FIGURE 11-3
Daily Spending Per Overnight StayAmount in $2015
Dollars$275.43
Hotel Average Daily Room Rate $105.04 38%
Food services and drinking places $59.77 22%
Hotels and motels, including casino hotels $45.62 17%
Retail stores - general merchandise $28.14 10%
Automotive equipment rental and leasing $9.23 3%
Transit and ground passenger transportation $8.57 3%
Retail stores - gasoline stations $1.88 1%
State and local government passenger transit $1.66 1%
Total $275.43 100%
Daily Spending Per Day-trip Visitor $106.96
Food services and drinking places $59.77 56%
Retail Stores - General Merchandise $28.14 26%
Retail Stores - Gasoline Stations $1.88 2%
Total $106.96 100%
Organizer Spending per Delegate Day $3.43
Retail Stores - General Merchandise $1.25 36%
Hotel Room Rate $1.10 32%
Advertising and Related Services $0.97 28%
Automotive Equipment Rental and leasing $0.06 2%Total $3.43 100%
Sources: DMAI, STR, HVS, and CTI
Event organizers and exhibitors would create additional spending impacts throughspending at the FCC through facility rentals, the purchase of event food andbeverage services, and other spending at the venue. HVS estimated futurespending by exhibitors and event organizers at the FCC including:
Facility Rental—Facility rental revenue includes the revenue the FCC wouldreceive from clients that reserve one or more function areas in the venue. Despitehaving published rates, facilities typically charge rental fees based on negotiateddaily rental fees. Not all events incur a facility rental fee. A facility may waive thespace rental charges if the event meets a certain minimum of food and beveragecharges.
Food and Beverage—Most events that would use the FCC’s function space wouldalso arrange for food service for their attendees during their events. This foodservice includes catering, which can range from coffee breaks associated with ameeting to a full dinner associated with a conference, banquet, or cabaretperformance. Consumer shows and sports events may generate concessionrevenue. Most conferences and conferences generate demand for multiple mealsduring the course of these multi-day events. Meetings and banquets generally
Facility Revenue fromOutside Spending
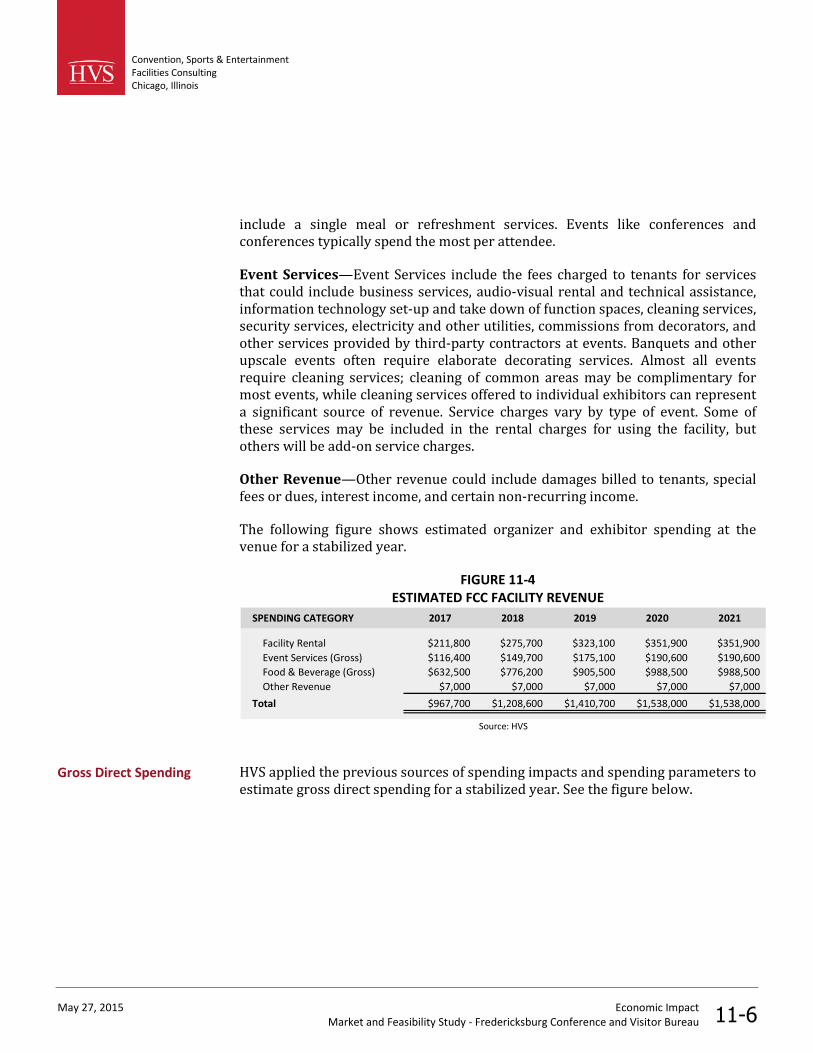
Convention, Sports & EntertainmentFacilities ConsultingChicago, Illinois
May 27, 2015 Economic ImpactMarket and Feasibility Study - Fredericksburg Conference and Visitor Bureau 11-6
include a single meal or refreshment services. Events like conferences andconferences typically spend the most per attendee.
Event Services—Event Services include the fees charged to tenants for servicesthat could include business services, audio-visual rental and technical assistance,information technology set-up and take down of function spaces, cleaning services,security services, electricity and other utilities, commissions from decorators, andother services provided by third-party contractors at events. Banquets and otherupscale events often require elaborate decorating services. Almost all eventsrequire cleaning services; cleaning of common areas may be complimentary formost events, while cleaning services offered to individual exhibitors can representa significant source of revenue. Service charges vary by type of event. Some ofthese services may be included in the rental charges for using the facility, butothers will be add-on service charges.
Other Revenue—Other revenue could include damages billed to tenants, specialfees or dues, interest income, and certain non-recurring income.
The following figure shows estimated organizer and exhibitor spending at thevenue for a stabilized year.
FIGURE 11-4ESTIMATED FCC FACILITY REVENUE
SPENDING CATEGORY 2017 2018 2019 2020 2021
Facility Rental $211,800 $275,700 $323,100 $351,900 $351,900
Event Services (Gross) $116,400 $149,700 $175,100 $190,600 $190,600
Food & Beverage (Gross) $632,500 $776,200 $905,500 $988,500 $988,500
Other Revenue $7,000 $7,000 $7,000 $7,000 $7,000
Total $967,700 $1,208,600 $1,410,700 $1,538,000 $1,538,000
Source: HVS
HVS applied the previous sources of spending impacts and spending parameters toestimate gross direct spending for a stabilized year. See the figure below.
Gross Direct Spending

Convention, Sports & EntertainmentFacilities ConsultingChicago, Illinois
May 27, 2015 Economic ImpactMarket and Feasibility Study - Fredericksburg Conference and Visitor Bureau 11-7
FIGURE 11-5GROSS DIRECT SPENDING
City of Fredericksburg
Direct overnight visitor spending = 19,200 overnight visitors x $275.62 = $5.3 M
Direct day trip spending = 22,100 daytrip visitors x $106.96 = $2.4
Organizer Spending = 49,511 attendees x $3.43 = $0.2
Facility Revenue * = $1.4
Total Gross Direct Spending = $9.2 M
Gillespie County
Direct overnight visitor spending = 19,800 overnight visitors x $275.62 = $5.5 M
Direct day trip spending = 18,400 daytrip visitors x $106.96 = $2.0
Organizer Spending = 50,362 attendees x $3.43 = $0.2
Facility Revenue * = $1.4
Total Gross Direct Spending = $9.0 M
For the stablized year of 2021 and stated in 2015 dollars.
* Assumes 90% of facility revenue shown in Figure 10-4 would be new to the market
Sources: DMAI, STR, HVS, and CTI
The figure below shows the annual gross direct spending generated by thedevelopment of the FCC over a five-year period beginning in the first year ofoperation.
FIGURE 11-6GROSS DIRECT SPENDING BY SOURCE
2017 2018 2019 2020 2021
City of Fredericksburg
Delegate Overnight Spending 3,159,000 4,132,100 4,855,800 5,296,700 5,296,700
Daily Delegate Spending 1,538,200 1,904,300 2,167,700 2,370,200 2,370,200
Organizer Spending 108,400 136,000 155,700 170,100 170,100
Facility Revenue 870,800 1,087,700 1,269,600 1,384,100 1,384,100
Total 5,676,400 7,260,100 8,448,800 9,221,100 9,221,100
Gillespie County
Delegate Overnight Spending 3,252,800 4,261,000 5,019,900 5,472,500 5,472,500
Daily Delegate Spending 1,279,400 1,586,000 1,807,700 1,975,600 1,975,600
Organizer Spending 110,000 138,100 158,400 173,000 173,000
Facility Revenue 870,800 1,087,700 1,269,600 1,384,100 1,384,100
Total 5,513,000 7,072,800 8,255,600 9,005,200 9,005,200
Convention, Sports & EntertainmentFacilities ConsultingChicago, Illinois
May 27, 2015 Economic ImpactMarket and Feasibility Study - Fredericksburg Conference and Visitor Bureau 11-8
HVS uses the IMPLAN input-output model to estimate indirect and inducedspending and employment impacts. IMPLAN is a nationally recognized modeldeveloped at the University of Minnesota and commonly used to estimateeconomic impacts. An input-output model generally describes the commoditiesand income that normally flow through the various sectors of a given economy.The indirect and induced spending and employment effects represent theestimated changes in the flow of income, goods, and services caused by theestimated direct spending. The IMPLAN model accounts for the specificcharacteristics of the local area economy and estimates the share of indirect andinduced spending that it would retain.
HVS categorized new direct expenditures into spending categories that we provideinputs into the IMPLAN model. Specifically, the IMPLAN model relies on spendingcategories defined by the U.S. Census according to the NAICS. Because thespending data from the spending surveys used by HVS do not match the NAICSspending categories, HVS translates the spending categories into the NAICSspending categories that most closely match.
Not all of the gross direct spending counts as an economic impact because some ofthe spending does not generate income within the market. HVS adjusts grossdirect spending to account for income that leaks out of the local economy byestimating retail margins and local purchase parentages. As a result, the realizeddirect spending (“net direct spending”) is lower than the gross direct spending inthe market area.
Spending at retailers creates a smaller economic impact compared to spending inother industries. Retailers add value equal to the margin or price increase of thegood above the original price paid to obtain the good. The IMPLAN model isproduct based, so HVS uses IMPLAN margin numbers to account for thediscrepancy between retail purchaser prices and producer prices.
To accurately measure spending impacts, HVS counts spending on products andservices located in the market area. Some of the direct spending demand in themarket area cannot be accommodated. For example, an event organizer may needto buy novelty items for all attendees, but find that the market area does notproduce these items. This effect occurs for direct, indirect, and induced spending.HVS uses the IMPLAN SAM model values to track the percentage of a goodpurchased within the market area.
The relationship between direct spending and the multiplier effects can vary basedon the specific size and characteristics of a local area’s economy. HVS enters thegross direct spending estimate into the IMPLAN input output model of the localeconomy to estimate the net direct, indirect and induced spending. HVS obtained
IMPLAN ImpactModeling
Annual Net DirectSpending
Retail Margins
Local PurchasePercentage
Indirect and InducedSpending
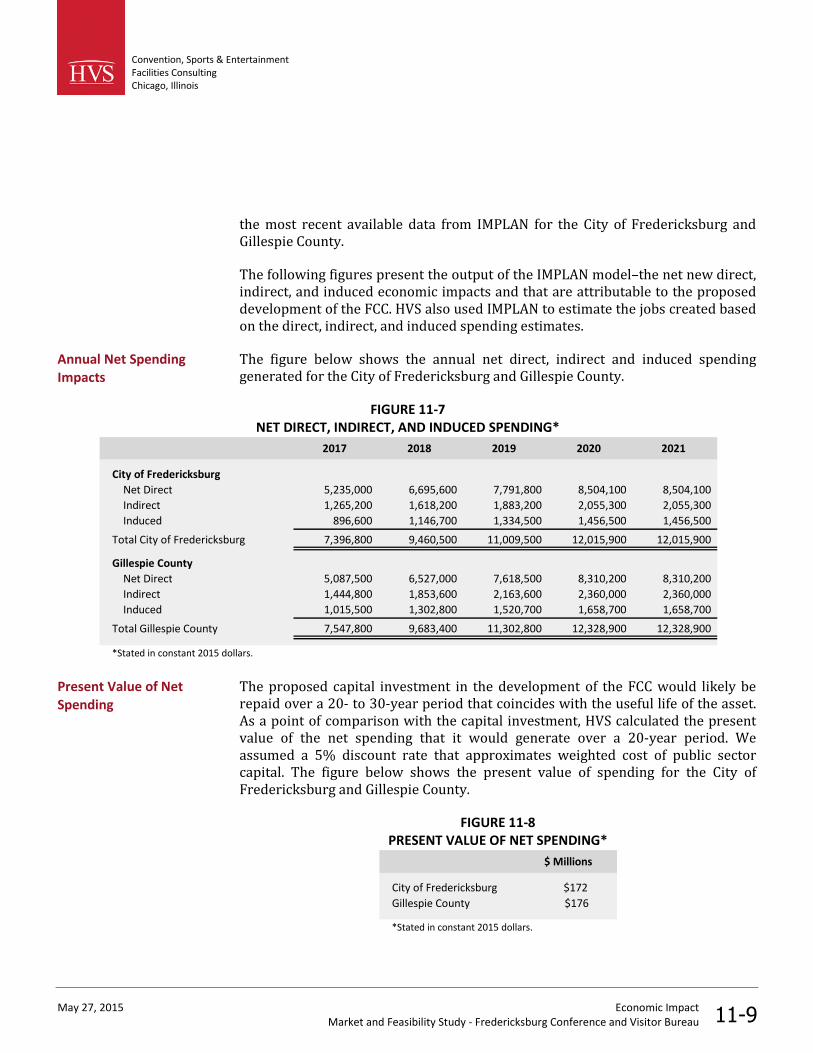
Convention, Sports & EntertainmentFacilities ConsultingChicago, Illinois
May 27, 2015 Economic ImpactMarket and Feasibility Study - Fredericksburg Conference and Visitor Bureau 11-9
the most recent available data from IMPLAN for the City of Fredericksburg andGillespie County.
The following figures present the output of the IMPLAN model–the net new direct,indirect, and induced economic impacts and that are attributable to the proposeddevelopment of the FCC. HVS also used IMPLAN to estimate the jobs created basedon the direct, indirect, and induced spending estimates.
The figure below shows the annual net direct, indirect and induced spendinggenerated for the City of Fredericksburg and Gillespie County.
FIGURE 11-7NET DIRECT, INDIRECT, AND INDUCED SPENDING*
2017 2018 2019 2020 2021
City of Fredericksburg
Net Direct 5,235,000 6,695,600 7,791,800 8,504,100 8,504,100
Indirect 1,265,200 1,618,200 1,883,200 2,055,300 2,055,300
Induced 896,600 1,146,700 1,334,500 1,456,500 1,456,500
Total City of Fredericksburg 7,396,800 9,460,500 11,009,500 12,015,900 12,015,900
Gillespie County
Net Direct 5,087,500 6,527,000 7,618,500 8,310,200 8,310,200
Indirect 1,444,800 1,853,600 2,163,600 2,360,000 2,360,000
Induced 1,015,500 1,302,800 1,520,700 1,658,700 1,658,700
Total Gillespie County 7,547,800 9,683,400 11,302,800 12,328,900 12,328,900
*Stated in constant 2015 dollars.
The proposed capital investment in the development of the FCC would likely berepaid over a 20- to 30-year period that coincides with the useful life of the asset.As a point of comparison with the capital investment, HVS calculated the presentvalue of the net spending that it would generate over a 20-year period. Weassumed a 5% discount rate that approximates weighted cost of public sectorcapital. The figure below shows the present value of spending for the City ofFredericksburg and Gillespie County.
FIGURE 11-8PRESENT VALUE OF NET SPENDING*
$ Millions
City of Fredericksburg $172
Gillespie County $176
*Stated in constant 2015 dollars.
Annual Net SpendingImpacts
Present Value of NetSpending
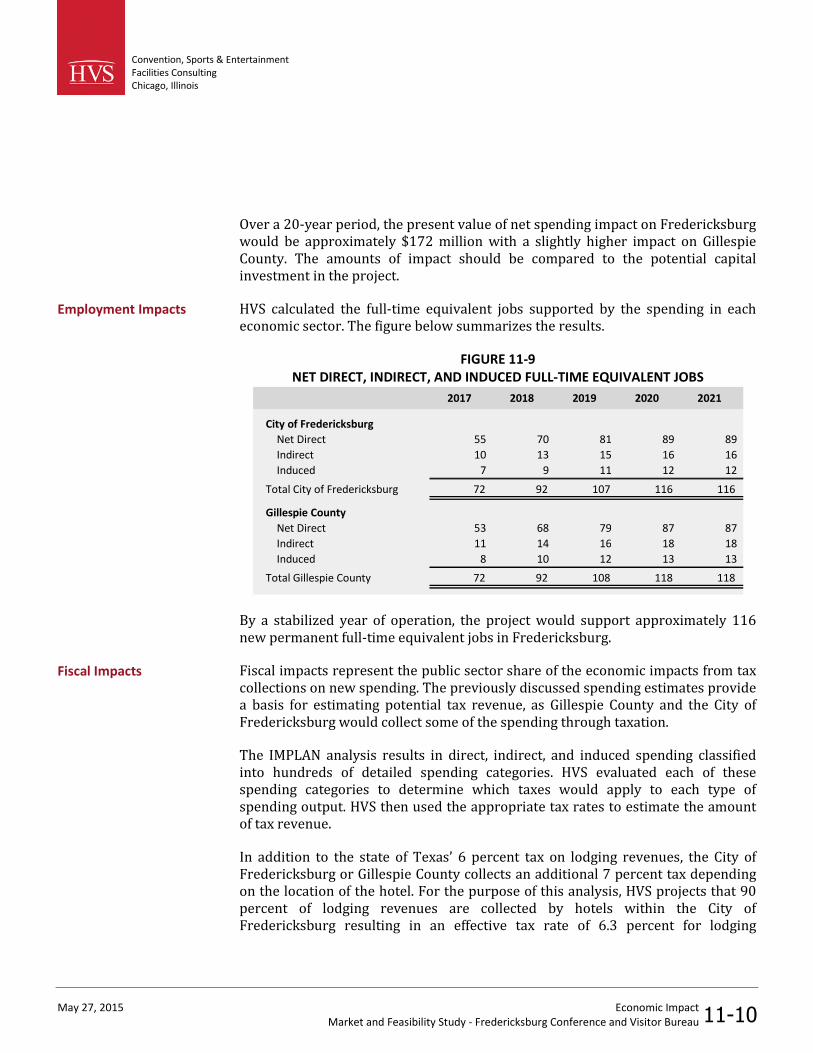
Convention, Sports & EntertainmentFacilities ConsultingChicago, Illinois
May 27, 2015 Economic ImpactMarket and Feasibility Study - Fredericksburg Conference and Visitor Bureau 11-10
Over a 20-year period, the present value of net spending impact on Fredericksburgwould be approximately $172 million with a slightly higher impact on GillespieCounty. The amounts of impact should be compared to the potential capitalinvestment in the project.
HVS calculated the full-time equivalent jobs supported by the spending in eacheconomic sector. The figure below summarizes the results.
FIGURE 11-9NET DIRECT, INDIRECT, AND INDUCED FULL-TIME EQUIVALENT JOBS
2017 2018 2019 2020 2021
City of Fredericksburg
Net Direct 55 70 81 89 89
Indirect 10 13 15 16 16
Induced 7 9 11 12 12
Total City of Fredericksburg 72 92 107 116 116
Gillespie County
Net Direct 53 68 79 87 87
Indirect 11 14 16 18 18
Induced 8 10 12 13 13
Total Gillespie County 72 92 108 118 118
By a stabilized year of operation, the project would support approximately 116new permanent full-time equivalent jobs in Fredericksburg.
Fiscal impacts represent the public sector share of the economic impacts from taxcollections on new spending. The previously discussed spending estimates providea basis for estimating potential tax revenue, as Gillespie County and the City ofFredericksburg would collect some of the spending through taxation.
The IMPLAN analysis results in direct, indirect, and induced spending classifiedinto hundreds of detailed spending categories. HVS evaluated each of thesespending categories to determine which taxes would apply to each type ofspending output. HVS then used the appropriate tax rates to estimate the amountof tax revenue.
In addition to the state of Texas’ 6 percent tax on lodging revenues, the City ofFredericksburg or Gillespie County collects an additional 7 percent tax dependingon the location of the hotel. For the purpose of this analysis, HVS projects that 90percent of lodging revenues are collected by hotels within the City ofFredericksburg resulting in an effective tax rate of 6.3 percent for lodging
Employment Impacts
Fiscal Impacts
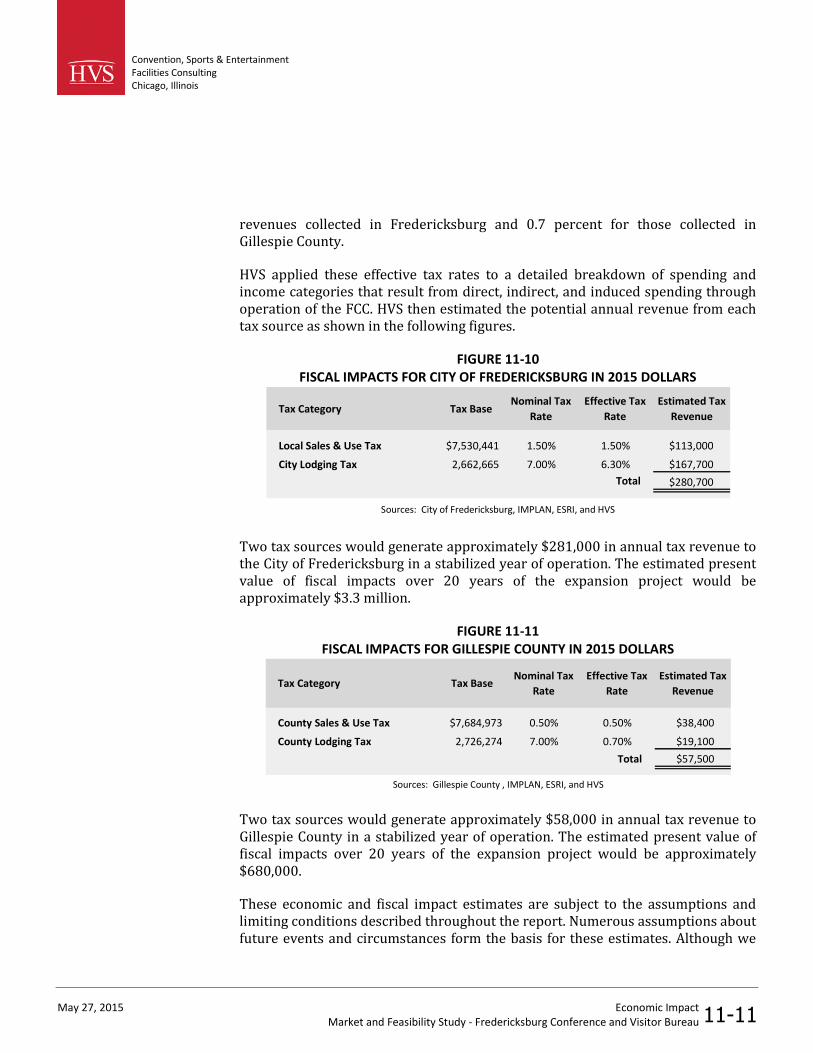
Convention, Sports & EntertainmentFacilities ConsultingChicago, Illinois
May 27, 2015 Economic ImpactMarket and Feasibility Study - Fredericksburg Conference and Visitor Bureau 11-11
revenues collected in Fredericksburg and 0.7 percent for those collected inGillespie County.
HVS applied these effective tax rates to a detailed breakdown of spending andincome categories that result from direct, indirect, and induced spending throughoperation of the FCC. HVS then estimated the potential annual revenue from eachtax source as shown in the following figures.
FIGURE 11-10FISCAL IMPACTS FOR CITY OF FREDERICKSBURG IN 2015 DOLLARS
Tax Category Tax BaseNominal Tax
Rate
Effective Tax
Rate
Estimated Tax
Revenue
Local Sales & Use Tax $7,530,441 1.50% 1.50% $113,000
City Lodging Tax 2,662,665 7.00% 6.30% $167,700
Total $280,700
Sources: City of Fredericksburg, IMPLAN, ESRI, and HVS
Two tax sources would generate approximately $281,000 in annual tax revenue tothe City of Fredericksburg in a stabilized year of operation. The estimated presentvalue of fiscal impacts over 20 years of the expansion project would beapproximately $3.3 million.
FIGURE 11-11FISCAL IMPACTS FOR GILLESPIE COUNTY IN 2015 DOLLARS
Tax Category Tax BaseNominal Tax
Rate
Effective Tax
Rate
Estimated Tax
Revenue
County Sales & Use Tax $7,684,973 0.50% 0.50% $38,400
County Lodging Tax 2,726,274 7.00% 0.70% $19,100
Total $57,500
Sources: Gillespie County , IMPLAN, ESRI, and HVS
Two tax sources would generate approximately $58,000 in annual tax revenue toGillespie County in a stabilized year of operation. The estimated present value offiscal impacts over 20 years of the expansion project would be approximately$680,000.
These economic and fiscal impact estimates are subject to the assumptions andlimiting conditions described throughout the report. Numerous assumptions aboutfuture events and circumstances form the basis for these estimates. Although we
Convention, Sports & EntertainmentFacilities ConsultingChicago, Illinois
May 27, 2015 Economic ImpactMarket and Feasibility Study - Fredericksburg Conference and Visitor Bureau 11-12
consider these assumptions reasonable, we cannot provide assurances that theproject will achieve the forecasted results. Actual events and circumstances arelikely to differ from the assumptions in this report and some of those differencesmay be material. The readers should consider these estimates as a mid-point in arange or potential outcomes.
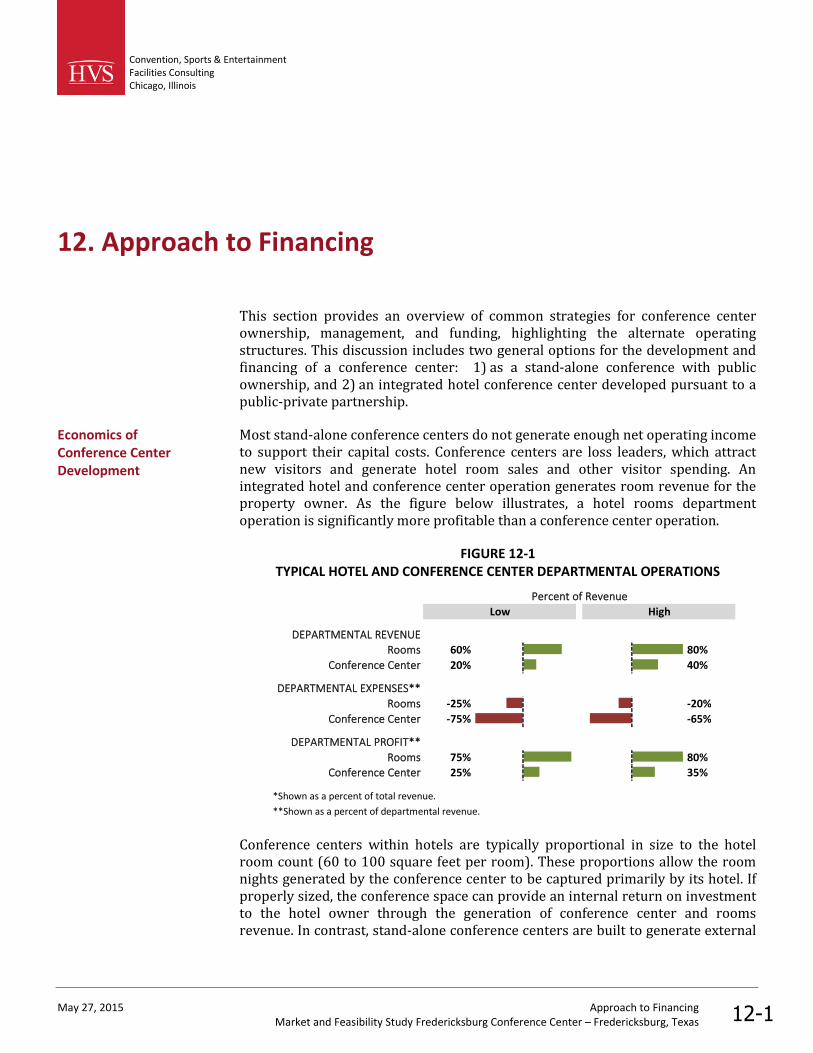
Convention, Sports & EntertainmentFacilities ConsultingChicago, Illinois
May 27, 2015 Approach to FinancingMarket and Feasibility Study Fredericksburg Conference Center – Fredericksburg, Texas 12-1
12. Approach to Financing
This section provides an overview of common strategies for conference centerownership, management, and funding, highlighting the alternate operatingstructures. This discussion includes two general options for the development andfinancing of a conference center: 1) as a stand-alone conference with publicownership, and 2) an integrated hotel conference center developed pursuant to apublic-private partnership.
Most stand-alone conference centers do not generate enough net operating incometo support their capital costs. Conference centers are loss leaders, which attractnew visitors and generate hotel room sales and other visitor spending. Anintegrated hotel and conference center operation generates room revenue for theproperty owner. As the figure below illustrates, a hotel rooms departmentoperation is significantly more profitable than a conference center operation.
FIGURE 12-1TYPICAL HOTEL AND CONFERENCE CENTER DEPARTMENTAL OPERATIONS
Percent of Revenue
Low High
DEPARTMENTAL REVENUE
Rooms 60% 80%
Conference Center 20% 40%
DEPARTMENTAL EXPENSES**
Rooms -25% -20%
Conference Center -75% -65%
DEPARTMENTAL PROFIT**
Rooms 75% 80%
Conference Center 25% 35%
*Shown as a percent of total revenue.
**Shown as a percent of departmental revenue.
Conference centers within hotels are typically proportional in size to the hotelroom count (60 to 100 square feet per room). These proportions allow the roomnights generated by the conference center to be captured primarily by its hotel. Ifproperly sized, the conference space can provide an internal return on investmentto the hotel owner through the generation of conference center and roomsrevenue. In contrast, stand-alone conference centers are built to generate external
Economics ofConference CenterDevelopment
Convention, Sports & EntertainmentFacilities ConsultingChicago, Illinois
May 27, 2015 Approach to FinancingMarket and Feasibility Study Fredericksburg Conference Center – Fredericksburg, Texas 12-2
benefits to multiple hotels, restaurants, and other local businesses, which are notcaptured by the conference center owner.
The City of Fredericksburg is considering investment in a conference center that iseither stand-alone or connected to a hotel but “oversized” such that it will generateexternal benefits to other hotels and businesses that support the tourism market.
Many stand-alone conference centers in the United States are publicly owned.Municipal or county ownership is the most common ownership arrangement forthese facilities. Many communities have established quasi‐governmental or non‐profit authorities to own their conference facilities on behalf of the local and/or state governments. Regardless of ownership structure, a conference centerboard of directors or other advisory committee is typically responsible for theoperation and long-term maintenance of the facility.
The primary benefits of a public ownership arrangement are public control of thedevelopment and operation and access to low cost tax exempt debt which isfrequently used to finance the project. The primary risks associated withMunicipal ownership concerns the initial and ongoing investments in theconference center. To remain competitive, the facility would likely require ongoingcapital improvements. Moreover, a public owner would bear the risk associatedwith operating losses at the facility.
Most privately-owned conference centers are operated as departments of largerdevelopments, including hotels, resorts, corporate headquarters, and universities.Privately-owned stand-alone centers are often located in larger metropolitanareas, primarily serving local businesses and corporations for off-site daymeetings.
Conference center management of a publicly-owned facility can take one of twoprimary forms. First, the governing authority, district, or local governmentdepartment can directly employ an in-house staff to manage and operate thevenue. With this arrangement, the venue owner maintains control over decisionsrelated to the following activities:
Financial reporting,
Staffing levels and qualifications,
Training and customer service requirements,
Marketing priorities,
Booking policies,
Repair and maintenance schedules, and
Conference CenterOwnership
Conference CenterManagement underPublic Ownership
Convention, Sports & EntertainmentFacilities ConsultingChicago, Illinois
May 27, 2015 Approach to FinancingMarket and Feasibility Study Fredericksburg Conference Center – Fredericksburg, Texas 12-3
Long-term capital improvements.
The primary risks of this management arrangement include:
Locating the necessary experience and talent to manage a facility successfully,
Replacing expert management if key personnel leave,
Financial operating risks associated with operating losses, and
Inability to incentivize the sales team due to public employee compensationrules.
Some Texas cities with conference or convention centers operating under themanagement of a governing authority or local government include New Braunfels,Bastrop, and Waco.
The most common alternative to an in-house management staff is to engage aprivate facility management company to operate a venue. The privatemanagement company is responsible for operating a facility with a complete staffemployed directly by the management company. Financial reporting and otheroperational procedures are typically governed by the standards established by themanagement company.
There is no correlation between a facility’s financial performance and publicversus private contract management. The experience and talent level of specificpersonnel within a conference center’s management team is more important thanwhether the management is a public agency or a private company.
The most appropriate reason to consider private management of a conferencecenter is that the public owner may not have the necessary experience, talent, orexpertise available to manage the facility successfully. A private manager oftenprovides a more professional and efficient operation.
Private management involves some disadvantages and risks. The requirement topay management fees presents the clearest financial drawback. Management feesat conference centers are roughly three percent of gross revenue with additionalincentive fees based on performance. If public management staff is eithernonprofessional or when expenses are excessive, a change from publicmanagement to private management can improve the financial performance of aconference center. In such cases, the management fees may be well worth theinvestment.
One potential risk associated with using a private management firm is that afacility owner may not be able to monitor staff training and maintenance decisions

Convention, Sports & EntertainmentFacilities ConsultingChicago, Illinois
May 27, 2015 Approach to FinancingMarket and Feasibility Study Fredericksburg Conference Center – Fredericksburg, Texas 12-4
as closely as it would as an in-house operation. If a venue owner decides to engagea private management firm, HVS recommends the careful implementation of anevaluation process that focuses on both customer service satisfaction levels andfacility maintenance procedures.
Another important risk associated with using a private management firm is thatthe host municipality may not have much control over the selection of topmanagement positions at the conference center. The level of experience and talenta private management firm can bring to a public facility can vary substantiallydepending on whom the firm recruits for key positions, such as General Managerand Sales Director. Although the managers working for private management firmsare among the world’s best, each City must consider the likelihood of attractingthis top tier of talent to its facility.
Some Texas cities with conference or convention centers operating under a privatemanagement contract include Corpus Christi, El Paso, and Beaumont.
In the United States, counties and cities usually finance the construction ofconference facilities with public debt, which is repaid over a 20- to 30-year period.Municipalities justify public investment either on the basis of the potentialeconomic impact of a project or because it represents the development of acommunity asset with broad support that would not be developed without publicspending.
Projects that are relatively small or in municipalities with rapidly growing taxbases are sometimes paid for directly out of appropriated funds. This type of pay-as-you-go financing is not often used for large projects. In Fredericksburg, as inmost cities, the difficulty of providing sufficient revenues to pay for the entireproject during the construction period effectively eliminates the pay-as-you-gooption. The majority of conference centers are financed with long-term debt sothat the payment of capital costs corresponds to the period over which the facilityis used and its economic and public benefits are realized. Counties and citiestypically structure the debt in the form of long-term tax-exempt bonds secured byone or more specific revenue source.
Municipalities sell two primary types of tax-exempt bonds, General ObligationBonds or Revenues Bonds, to finance projects such as conference centers.
One possible revenue source to repay bonds would be general fund revenue,backed by the full faith and credit of the government, to make scheduled paymentsover the life of the bonds. These general obligation bonds (“GO bonds”) primarilyrely on real property taxes for repayment. This type of debt would provide astrong credit and relatively low borrowing costs for the project.
Conference CenterFunding Models
General ObligationBonds
Convention, Sports & EntertainmentFacilities ConsultingChicago, Illinois
May 27, 2015 Approach to FinancingMarket and Feasibility Study Fredericksburg Conference Center – Fredericksburg, Texas 12-5
GO bonds typically fund projects perceived to benefit the population as a whole,such as educational, environmental, transportation, or correctional facilities.Because conference centers have a narrower group of users and people whobenefit from these projects, GO bonds are seldom used as a funding source. Basedon; 1) the lack of historical precedent in other cities, 2) the availability ofalternative financing methods, HVS does not recommend the use of GO debt tofinance the FCC.
Some alternative uses of GO debt might include;
restricting it to a portion of the project costs such as site preparation,transportation improvements, and utilities;
creating a short-term means of paying for some or all construction costs untilrevenues triggered by the new facility are realized; and/or,
providing a guarantee to back-stop a new revenue source that is not initiallycreditworthy on its own or results in a lower bond rating without the backingof the gross receipts tax.
Municipal governments can pledge revenue from existing or projected taxes andfees to support the repayment of tax-exempt debt on conference center projects.Bonds that are backed by such sources are called “revenue bonds” because therevenue from these taxes and fees provide the ability to repay debt. The interestrates paid on revenue bonds would vary depending on the reliability of the chosenrevenue source. Interest rates also vary from one municipality to anotherdepending on their credit ratings.
Counties and cities often target taxes or fees derived from the activities orbusinesses that are most likely to use or otherwise benefit from the facility. Hotelroom occupancy taxes, sales taxes, car rental fees, parking taxes, food andbeverage taxes, airport access fees, and development fees are the revenue sourcesmost commonly used to repay debt service for conference center revenue bonds.In addition, municipalities frequently use these tax sources to finance the ongoingoperating and marketing needs of their facilities. Most of the recent conferencecenter projects throughout the U.S. have used this financing structure, which canbe tailored to fit the specific requirements and debt structure of state and localgovernments.
The types of bonds used to fund particular projects depend on the size of theinvestment, lending rates, the creditworthiness of the borrowing entity, and theavailability of revenue sources to repay the debt. The mix of revenue sourcesselected for particular projects depends on the comparative level of existing taxes
Revenue Bonds
Convention, Sports & EntertainmentFacilities ConsultingChicago, Illinois
May 27, 2015 Approach to FinancingMarket and Feasibility Study Fredericksburg Conference Center – Fredericksburg, Texas 12-6
or fees, as well as what is considered to be both fair and feasible under the uniquepolitical and economic circumstances of each development.
As discussed earlier in this section, an integrated hotel and conference centerdevelopment can generate positive cash flows and thereby create potential forprivate investment. But the amounts of private investment in the form of debt andequity that could be attracted to the project are unlikely to be sufficient to financethe entire project.
In a public-private partnership (“PPP”), the hotel and conference center could beowned and developed by the private partner. The conference center may bepublicly owned and financed but is usually leased to the hotel owner who becomesresponsible for the operation of the entire project. Public involvement may takethe form of a public subsidy that “bridges the gap” between the cost ofconstructing and financing the project and the debt and equity that a privatedeveloper is able to secure.
Traditionally, full-service hotels have supported conference centers, butincreasingly high quality select-service hotels have been developed adjacent toconference centers. Select-service hotels offer a more cost effective design andoperation and may be more feasible in lower rated or tertiary markets.
PPPs in hotel development are more frequently used in mid-sized, full-servicehotel projects (200 to 500 rooms) in which a reasonable amount of public equityinvestment can make the difference between a feasible and infeasible project. Formany smaller projects the potential benefit of new economic and fiscal impacts aremodest and only justify a limited investment on the part of the sponsoringmunicipality. In other communities, a PPP is the only politically acceptable form ofgovernment support. Often other local hotel owners demand limits on governmentsupport of potentially competitive products. This is particularly true in stressedhotel markets where the proposed property would not induce significant amountsof new demand.
To assess trends and current industry practices in hotel and conference centerPPPs, HVS analyzed 51 existing and planned projects. These projects includedhotels with 100 to 400 rooms and an associated conference or convention center.We included some projects that have not yet opened. While these projects maychange in scope, size, timing, or level of public participation, they provide insightinto the current state of industry practices.
Integrated HotelConference CenterDevelopment
Trends in PPPs forHotel ConferenceCenter Development
Convention, Sports & EntertainmentFacilities ConsultingChicago, Illinois
May 27, 2015 Approach to FinancingMarket and Feasibility Study Fredericksburg Conference Center – Fredericksburg, Texas 12-7
To perform our research HVS relied on the following data sources:
1. An HVS proprietary data base that tracks hotel sales transactions andoperating histories,
2. HVS data base of prior hotel research reports that contains information onsome hotel transactions that involved public financing or PPPs,
3. Publicly available offering statements and other prospectuses on hoteltransactions,
4. Third party information on projects including industry and general mediasources, and
5. First-hand knowledge of certain projects based on prior involvement inconsulting activities related to the project.
HVS collected and analyzed all information contained in this report. HVS soughtout reliable sources and HVS deemed information obtained from third parties tobe accurate.
The properties included in this comparative analysis are shown in the table below.
Data Sources
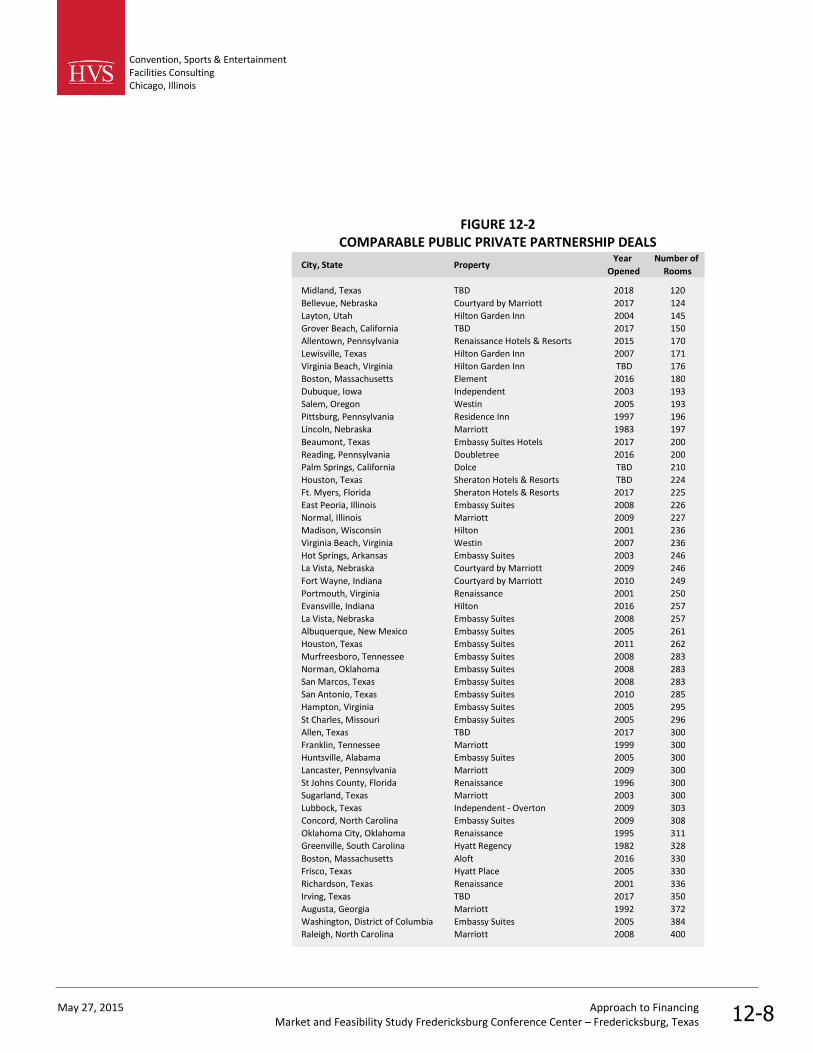
Convention, Sports & EntertainmentFacilities ConsultingChicago, Illinois
May 27, 2015 Approach to FinancingMarket and Feasibility Study Fredericksburg Conference Center – Fredericksburg, Texas 12-8
FIGURE 12-2COMPARABLE PUBLIC PRIVATE PARTNERSHIP DEALS
City, State PropertyYear
Opened
Number of
Rooms
Midland, Texas TBD 2018 120
Bellevue, Nebraska Courtyard by Marriott 2017 124
Layton, Utah Hilton Garden Inn 2004 145
Grover Beach, California TBD 2017 150
Allentown, Pennsylvania Renaissance Hotels & Resorts 2015 170
Lewisville, Texas Hilton Garden Inn 2007 171
Virginia Beach, Virginia Hilton Garden Inn TBD 176
Boston, Massachusetts Element 2016 180
Dubuque, Iowa Independent 2003 193
Salem, Oregon Westin 2005 193
Pittsburg, Pennsylvania Residence Inn 1997 196
Lincoln, Nebraska Marriott 1983 197
Beaumont, Texas Embassy Suites Hotels 2017 200
Reading, Pennsylvania Doubletree 2016 200
Palm Springs, California Dolce TBD 210
Houston, Texas Sheraton Hotels & Resorts TBD 224
Ft. Myers, Florida Sheraton Hotels & Resorts 2017 225
East Peoria, Illinois Embassy Suites 2008 226
Normal, Illinois Marriott 2009 227
Madison, Wisconsin Hilton 2001 236
Virginia Beach, Virginia Westin 2007 236
Hot Springs, Arkansas Embassy Suites 2003 246
La Vista, Nebraska Courtyard by Marriott 2009 246
Fort Wayne, Indiana Courtyard by Marriott 2010 249
Portmouth, Virginia Renaissance 2001 250
Evansville, Indiana Hilton 2016 257
La Vista, Nebraska Embassy Suites 2008 257
Albuquerque, New Mexico Embassy Suites 2005 261
Houston, Texas Embassy Suites 2011 262
Murfreesboro, Tennessee Embassy Suites 2008 283
Norman, Oklahoma Embassy Suites 2008 283
San Marcos, Texas Embassy Suites 2008 283
San Antonio, Texas Embassy Suites 2010 285
Hampton, Virginia Embassy Suites 2005 295
St Charles, Missouri Embassy Suites 2005 296
Allen, Texas TBD 2017 300
Franklin, Tennessee Marriott 1999 300
Huntsville, Alabama Embassy Suites 2005 300
Lancaster, Pennsylvania Marriott 2009 300
St Johns County, Florida Renaissance 1996 300
Sugarland, Texas Marriott 2003 300
Lubbock, Texas Independent - Overton 2009 303
Concord, North Carolina Embassy Suites 2009 308
Oklahoma City, Oklahoma Renaissance 1995 311
Greenville, South Carolina Hyatt Regency 1982 328
Boston, Massachusetts Aloft 2016 330
Frisco, Texas Hyatt Place 2005 330
Richardson, Texas Renaissance 2001 336
Irving, Texas TBD 2017 350
Augusta, Georgia Marriott 1992 372
Washington, District of Columbia Embassy Suites 2005 384
Raleigh, North Carolina Marriott 2008 400
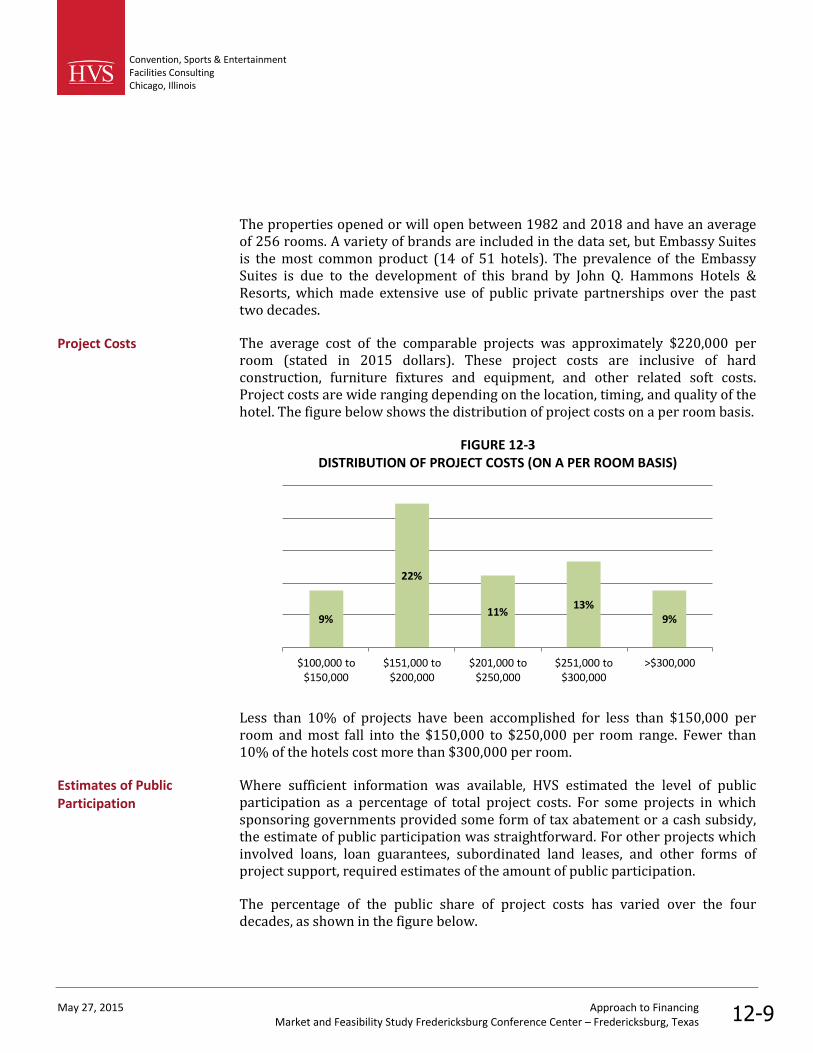
Convention, Sports & EntertainmentFacilities ConsultingChicago, Illinois
May 27, 2015 Approach to FinancingMarket and Feasibility Study Fredericksburg Conference Center – Fredericksburg, Texas 12-9
The properties opened or will open between 1982 and 2018 and have an averageof 256 rooms. A variety of brands are included in the data set, but Embassy Suitesis the most common product (14 of 51 hotels). The prevalence of the EmbassySuites is due to the development of this brand by John Q. Hammons Hotels &Resorts, which made extensive use of public private partnerships over the pasttwo decades.
The average cost of the comparable projects was approximately $220,000 perroom (stated in 2015 dollars). These project costs are inclusive of hardconstruction, furniture fixtures and equipment, and other related soft costs.Project costs are wide ranging depending on the location, timing, and quality of thehotel. The figure below shows the distribution of project costs on a per room basis.
FIGURE 12-3DISTRIBUTION OF PROJECT COSTS (ON A PER ROOM BASIS)
9%
22%
11%13%
9%
$100,000 to$150,000
$151,000 to$200,000
$201,000 to$250,000
$251,000 to$300,000
>$300,000
Less than 10% of projects have been accomplished for less than $150,000 perroom and most fall into the $150,000 to $250,000 per room range. Fewer than10% of the hotels cost more than $300,000 per room.
Where sufficient information was available, HVS estimated the level of publicparticipation as a percentage of total project costs. For some projects in whichsponsoring governments provided some form of tax abatement or a cash subsidy,the estimate of public participation was straightforward. For other projects whichinvolved loans, loan guarantees, subordinated land leases, and other forms ofproject support, required estimates of the amount of public participation.
The percentage of the public share of project costs has varied over the fourdecades, as shown in the figure below.
Project Costs
Estimates of PublicParticipation

Convention, Sports & EntertainmentFacilities ConsultingChicago, Illinois
May 27, 2015 Approach to FinancingMarket and Feasibility Study Fredericksburg Conference Center – Fredericksburg, Texas 12-10
FIGURE 12-4TRENDS IN PUBLIC PARTICIPATION IN PPP HOTEL PROJECTS
40%
24%
16%
23%
1980-1989 1990-1999 2000-2009 2010-2015
The 1980's saw the growth in use of industrial revenue bonds to finance projectsbut a 1986 law limited the availability of tax exempt financing for some projects. Inthe late 1990’s, an IRS ruling expanded the use of tax exempt financing for publiclyowned hotels. During the next decade, recessions and lack of governmentresources limited public participation in projects. In the current decade, newmarket tax credits, EB5 funding, and an improving economy have contributed toan increase in the level of public participation in hotel projects.
In 48 of the comparable projects analyzed in this report, HVS obtained enoughinformation to estimate the level of public participation.
Public Participation inthe Most ComparableProjects

Convention, Sports & EntertainmentFacilities ConsultingChicago, Illinois
May 27, 2015 Approach to FinancingMarket and Feasibility Study Fredericksburg Conference Center – Fredericksburg, Texas 12-11
FIGURE 12-5DISTRIBUTION OF PERCENTAGE OF PUBLIC PARTICIPATION
13% 6%
50%
19%10% 2%
Less than 10% 10% to lessthan 20%
20% to lessthan 30%
30% to lessthan 40%
40% to lessthan 50%
Greater than50%
Fifty percent of the projects received a public participation between 20% to 30%and twenty-nine percent of projects received between 30% and 50% publicparticipation. The overall average level of public participation is approximately 24percent.
State law often dictates the forms of allowable public participation except in citieswith home rule governments that have broad taxing powers. The most frequentlyused methods of public subsidy include:
Abatement of property taxes or subordination of the property taxes to returnon equity investment.
Abatement of hotel lodging taxes collected on property or redirection of thosetaxes to the project.
A pledge of city-wide or special district lodging taxes to support a publiclyfinanced component of the project.
Less frequently, public entities fund their contribution to the project using:
Food and beverage tax revenues generated by the property or from a specialdistrict.
General sales taxes or sales taxes from a special district.
Cash subsidies or proceeds of debt may be provided to support infrastructuredevelopment or to finance the conference center component of the project.Governments rarely use general obligation debt to support hotel projects as this
Forms of PublicParticipation
Convention, Sports & EntertainmentFacilities ConsultingChicago, Illinois
May 27, 2015 Approach to FinancingMarket and Feasibility Study Fredericksburg Conference Center – Fredericksburg, Texas 12-12
entails potential increases in real estate taxes, sales taxes, or other sources ofpublic funds that are not generated by or related to the project.
When a hotel and conference center is separately run and the local government isinvesting in the hotel, a room block commitment agreement can support theconference center’s ability of book business. The level of public involvement inhotel projects may also be influenced by room block commitment agreementswhich require the hotel operator to make blocks of hotel rooms available forconference center events at acceptable room rates. These agreements help toassure that one of the primary public purposes of the project—generating newout-of-town visitation—can be achieved. However, under certain marketconditions a room block commitment agreement may limit the hotel manager’sability to maximize revenue and income. For example, the advance commitment ofroom blocks to conference attendees may limit a hotel operator’s ability to reserveroom inventory for more profitable in-house groups or transient guests thatgenerate higher room rates and more food and beverage revenues. The operatingrisk for a publicly supported hotel with a room block commitment may be higherthan for a conventionally financed property. Consequently, the amounts of privateequity placed at risk may be less for a property with a room block commitmentagreement.
Determining the optimal approach to financing the conference center developmentin Fredericksburg would require:
Making a final decision on the development of the Texas Center for Wine andCulinary Arts,
Selecting the optimal site,
Creating a development plan,
Estimating project costs,
Determining the amount of available private investment, and
Estimating the required public participation and identifying public resourcesto dedicate to the project.
Most of these issues could be address through a request for proposal process thatsolicits the participation of developers in the proposed project.
Room BlockCommitmentAgreements
Conclusion

Convention, Sports & EntertainmentFacilities ConsultingChicago, Illinois
May 27, 2015 Statement of Assumptions and Limiting ConditionsMarket and Feasibility Study Fredericksburg Conference Center – Fredericksburg, Texas 13-1
13. Statement of Assumptions and Limiting Conditions
1. This report is to be used in whole and not in part.
2. All information, financial operating statements, estimates, and opinionsobtained from parties not employed by HVS are assumed to be true andcorrect. We can assume no liability resulting from misinformation.
3. Unless noted, we assume that there are no encroachments, zoningviolations, or building violations encumbering the proposed subjectproperty.
4. The proposed facility is assumed to be in full compliance with allapplicable federal, state, local, and private codes, laws, consents, licenses,and regulations (including a liquor license where appropriate), and that alllicenses, permits, certificates, franchises, and so forth can be freelyrenewed or transferred to a purchaser.
5. We are not required to give testimony or attendance in court by reason ofthis analysis without previous arrangements, and only when our standardper-diem fees and travel costs are paid prior to the appearance.
6. If the reader is making a fiduciary or individual investment decision andhas any questions concerning the material presented in this report, it isrecommended that the reader contact us.
7. We take no responsibility for any events or circumstances that take placesubsequent to the date of our report.
8. The quality of a facility's on-site management has a direct effect on aproperty's economic performance. The demand and financial forecastspresented in this analysis assume responsible ownership and competentmanagement. Any departure from this assumption may have a significantimpact on the projected operating results.
9. The impact analysis presented in this report is based upon assumptions,estimates, and evaluations of the market conditions in the local andnational economy, which may be subject to sharp rises and declines. Overthe projection period considered in our analysis, wages and otheroperating expenses may increase or decrease due to market volatility andeconomic forces outside the control of the facility’s management.
Convention, Sports & EntertainmentFacilities ConsultingChicago, Illinois
May 27, 2015 Statement of Assumptions and Limiting ConditionsMarket and Feasibility Study Fredericksburg Conference Center – Fredericksburg, Texas 13-2
10. We do not warrant that our estimates will be attained, but they have beendeveloped on the basis of information obtained during the course of ourmarket research and are intended to reflect reasonable expectations.
11. Many of the figures presented in this report were generated usingsophisticated computer models that make calculations based on numberscarried out to three or more decimal places. In the interest of simplicity,most numbers have been rounded. Thus, these figures may be subject tosmall rounding errors.
12. It is agreed that our liability to the client is limited to the amount of the feepaid as liquidated damages. Our responsibility is limited to the client, anduse of this report by third parties shall be solely at the risk of the clientand/or third parties. The use of this report is also subject to the terms andconditions set forth in our engagement letter with the client.
13. Although this analysis employs various mathematical calculations, the finalestimates are subjective and may be influenced by our experience andother factors not specifically set forth in this report.
14. This report was prepared by HVS Convention, Sports & EntertainmentFacilities Consulting. All opinions, recommendations, and conclusionsexpressed during the course of this assignment are rendered by the staff ofthis organization, as employees, rather than as individuals.
15. This report is set forth as a market and feasibiity study of the proposedsubject project; this is not an appraisal report.
Convention, Sports & EntertainmentFacilities ConsultingChicago, Illinois
May 27, 2015 CertificationMarket and Feasibility Study Fredericksburg Conference Center – Fredericksburg, Texas 14-1
14. Certification
The undersigned hereby certify that, to the best of our knowledge and belief:
1. the statements of fact presented in this report are true and correct;
1. the reported analyses, opinions, and conclusions are limited only by thereported assumptions and limiting conditions, and are our personal,impartial, and unbiased professional analyses, opinions, and conclusions;
2. we have no present or prospective financial or personal interest withrespect to the parties involved;
3. HVS is not a municipal advisor and is not subject to the fiduciary duty setforth in section 15B(c)(1) of the Act (15 U.S.C. 78o-4(c)(1)) with respect tothe municipal financial product or issuance of municipal securities;
4. we have no bias with respect to the subject of this report or to the partiesinvolved with this assignment;
5. our engagement in this assignment was not contingent upon developing orreporting predetermined results;
6. our compensation for completing this assignment is not contingent uponthe development or reporting of a predetermined result that favors thecause of the client, the amount of the value opinion, the attainment of astipulated result, or the occurrence of a subsequent event directly relatedto the intended use of this appraisal;
7. Thomas A Hazinski and Catherine Sarrett personally inspected the marketdescribed in this report.
Thomas HazinskiManaging Director
Catherine SarrettSenior Project Manager