latest corporate presentation
TRANSCRIPT
12 Jan 18 WF12310
Lundin Petroleum
January 2018
Corporate Presentation
WF12310 p14 08.17
2015 2016 2017
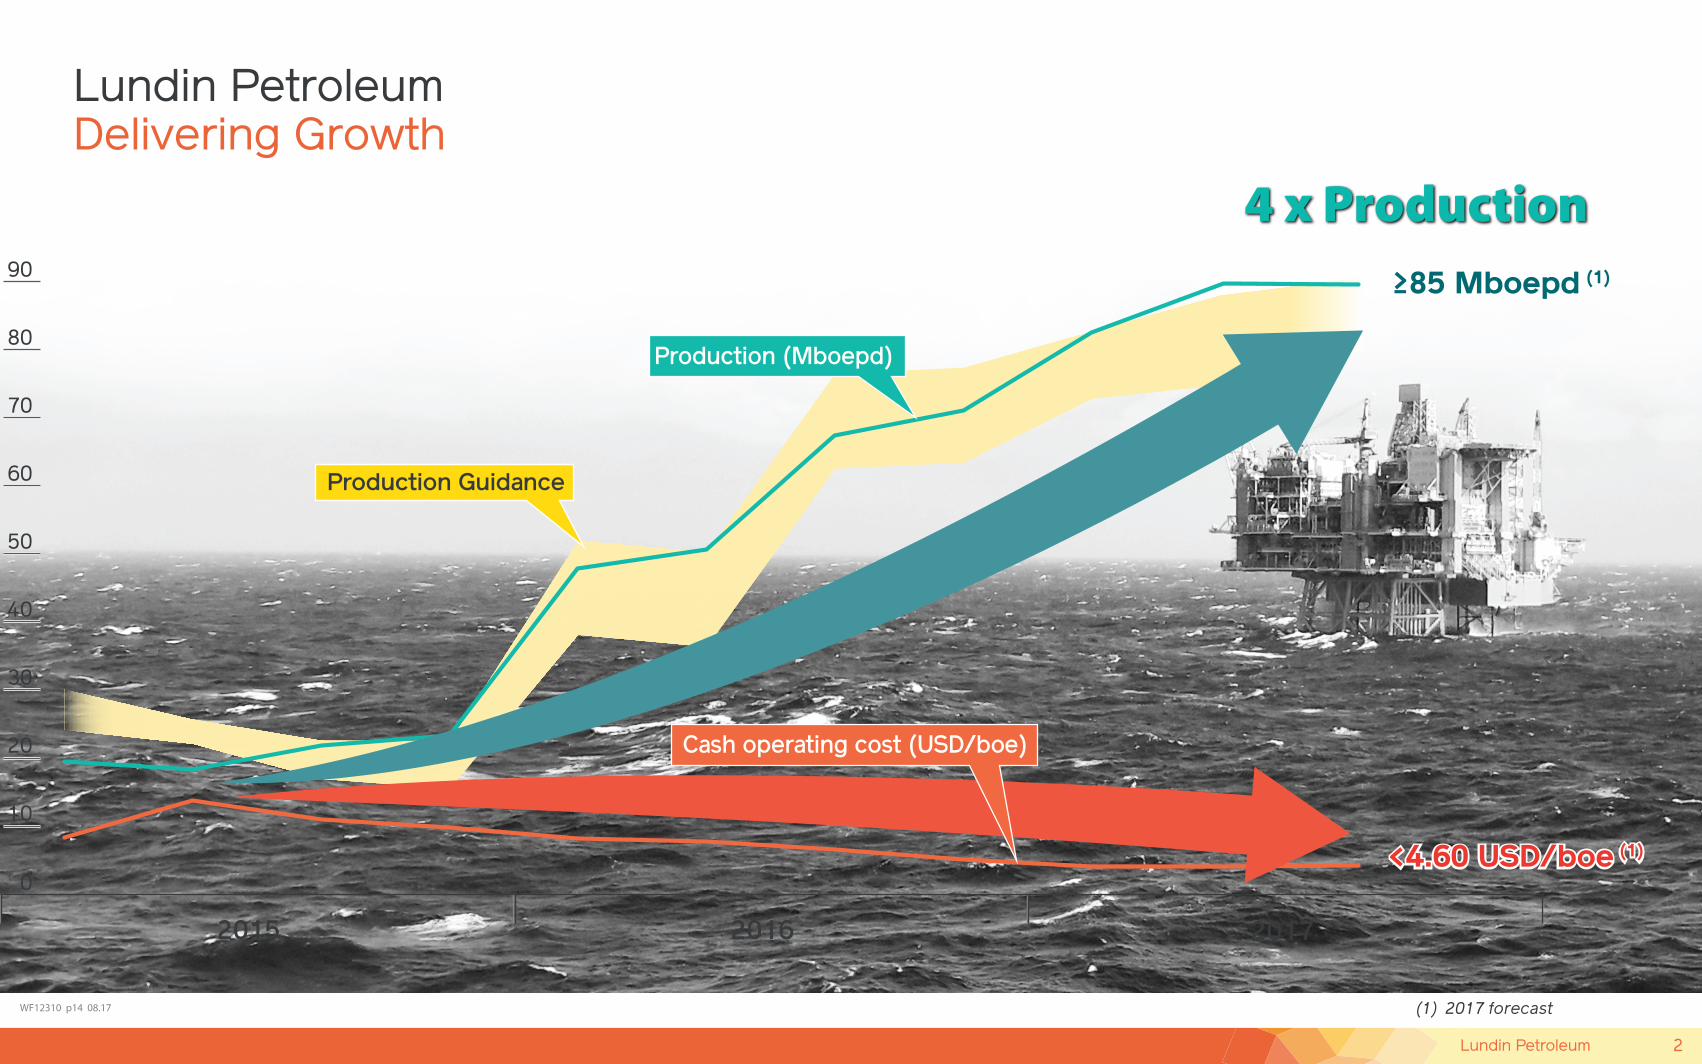
Cash operating cost (USD/boe)
Production (Mboepd)
<4.60 USD/boe (1)
>85 Mboepd (1)
<4.60 USD/boe (1)
4 x Production
10
0
20
30
40
50
60
70
80
90
Delivering GrowthLundin Petroleum
(1) 2017 forecast
Production Guidance
2Lundin Petroleum
WF1
2310
p01
02.
17
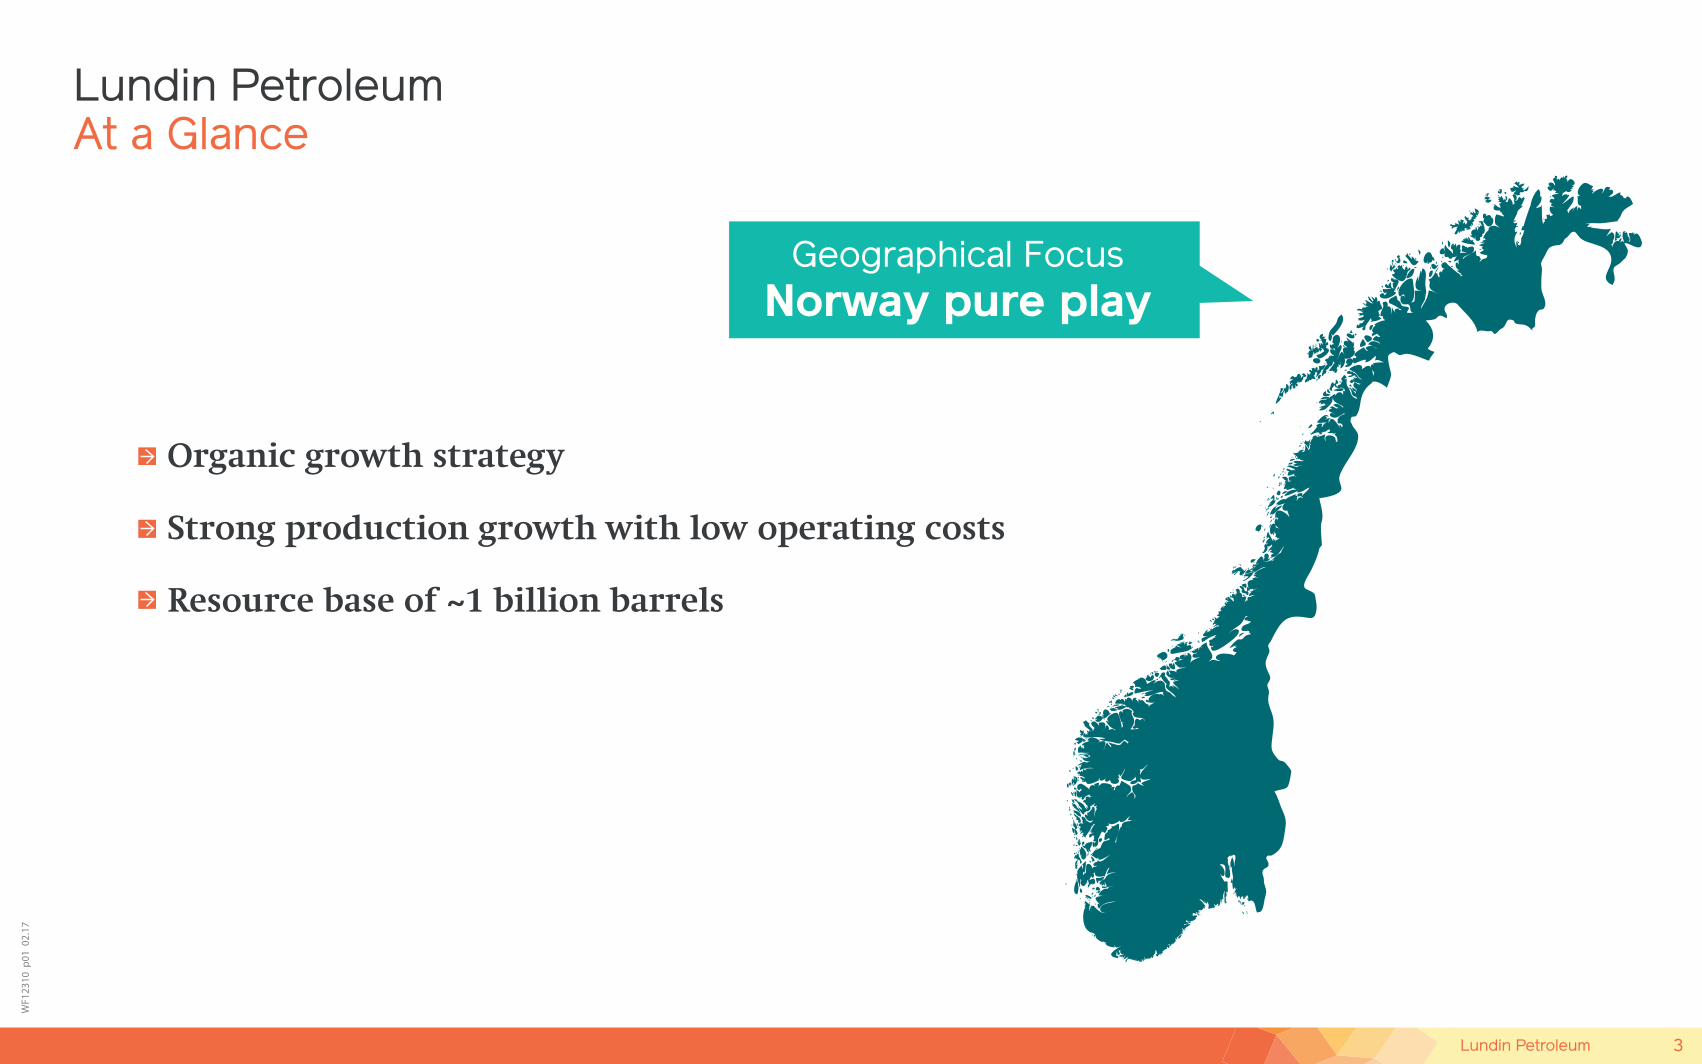
Organic growth strategy
Strong production growth with low operating costs Resource base of ~1 billion barrels
Lundin PetroleumAt a Glance
Geographical FocusNorway pure play
3Lundin Petroleum
WF1
2310
p03
02.
17
Lundin PetroleumKey Metrics
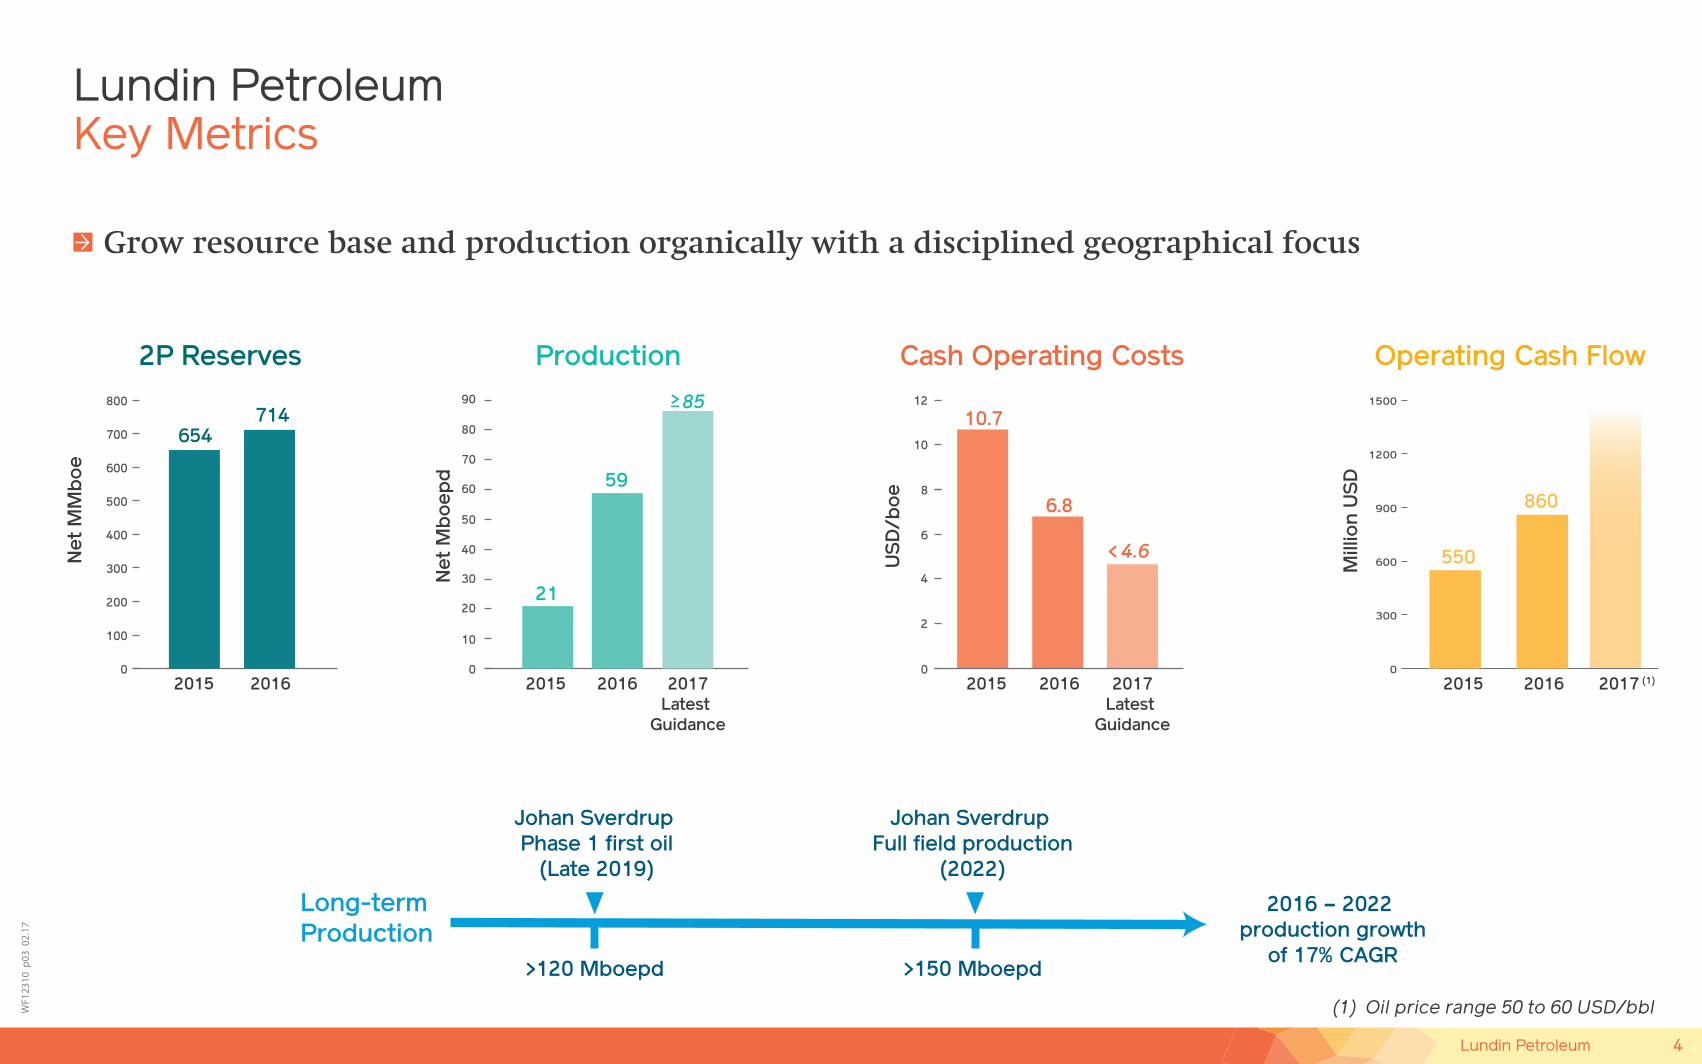
2P Reserves Production Cash Operating Costs
Grow resource base and production organically with a disciplined geographical focus
0
100
200
300
400
500
600
700
800
0
10
20
30
40
50
60
70
80
90
0
Net
MM
bo
e
Net
Mb
oep
d
US
D/b
oe
2015 2016 2015 2016 2015 2016
654714
21
59
2017Latest
Guidance
8510.7
6.8
2017Latest
Guidance
4.6
Operating Cash Flow
Mill
ion
US
D
2015 2016 2017 (1)
550
860
(1) Oil price range 50 to 60 USD/bbl
>120 Mboepd >150 Mboepd
Johan Sverdrup Phase 1 first oil
(Late 2019)
Long-termProduction
Johan Sverdrup Full field production
(2022)
4
8
6
10
12
2
0
300
600
900
1200
1500
2016 – 2022 production growth
of 17% CAGR
<
4Lundin Petroleum
WF1
2380
Q3
p11
10.
17
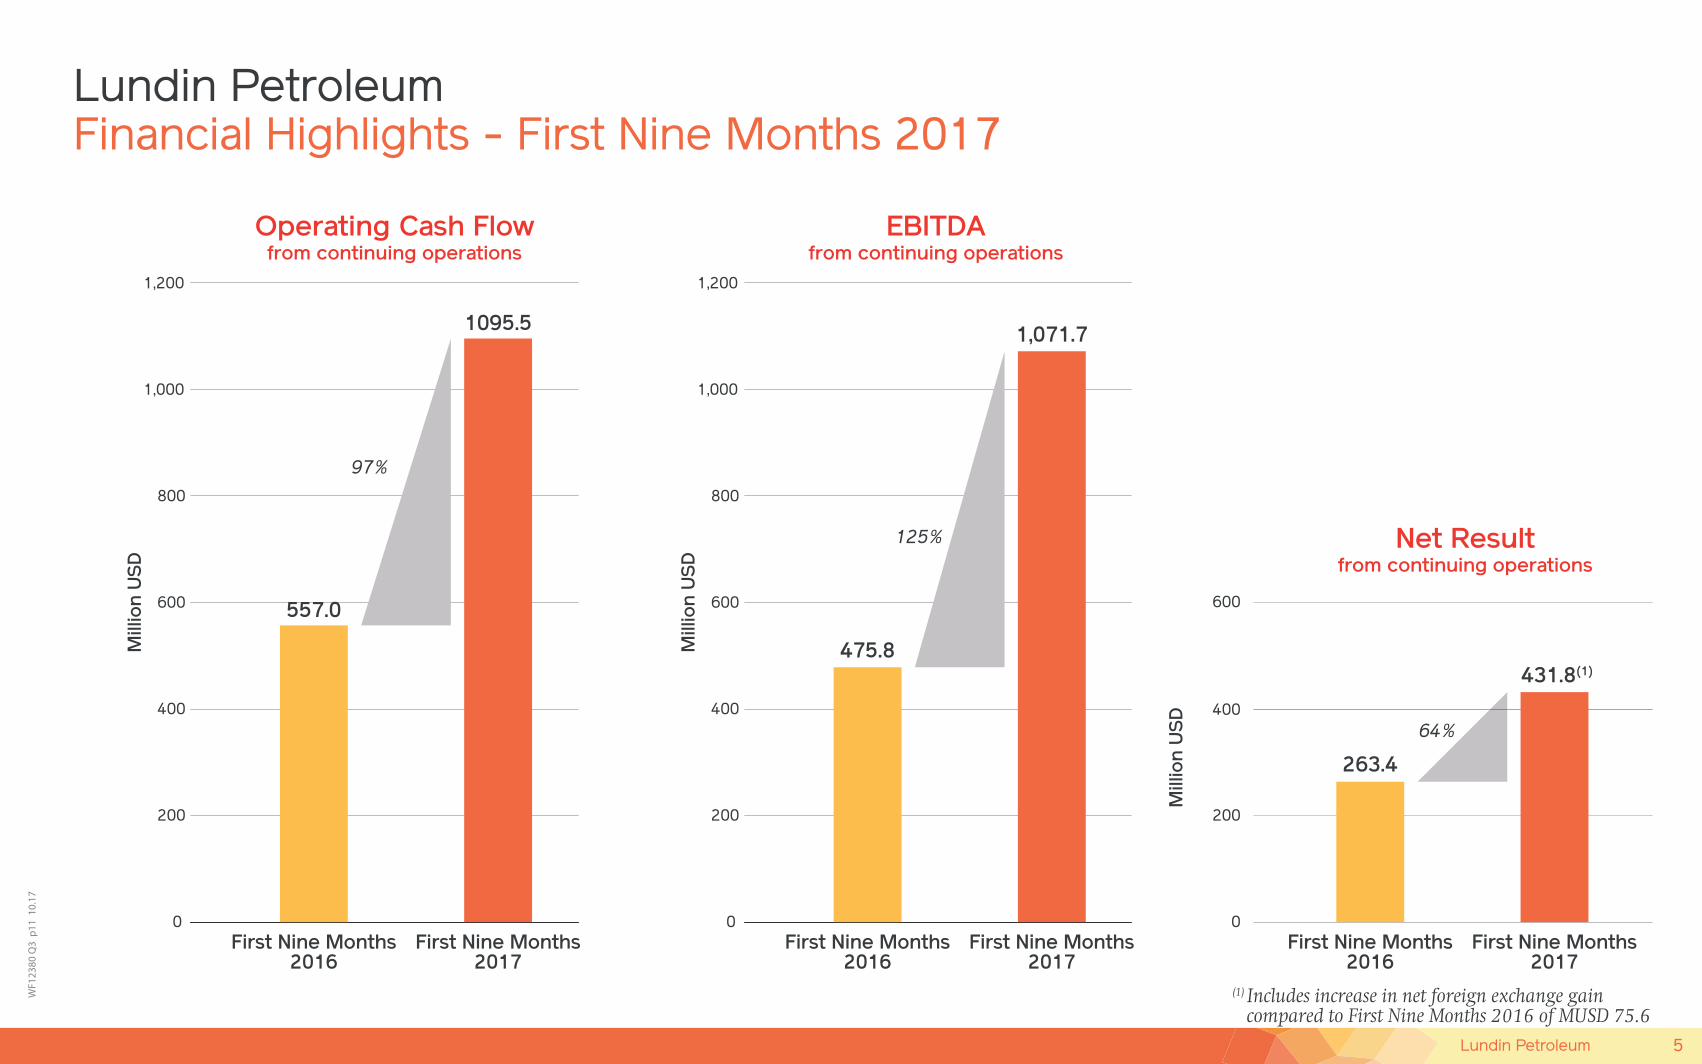
Lundin PetroleumFinancial Highlights - First Nine Months 2017
Operating Cash Flowfrom continuing operations
EBITDAfrom continuing operations
Net Resultfrom continuing operations
200
0
400
600
800
1,000
1,200
475.8
1,071.7
125%
First Nine Months2016
First Nine Months2017
Mill
ion
US
D
200
0
400
600
800
1,000
1,200
First Nine Months2016
First Nine Months2017
Mill
ion
US
D
64%
First Nine Months2016
First Nine Months2017
(1) Includes increase in net foreign exchange gain compared to First Nine Months 2016 of MUSD 75.6
Mill
ion
US
D
0
200
400
600
263.4
431.8(1)
557.0
1095.5
97%
5Lundin Petroleum
WF1
2168
p20
02
.17
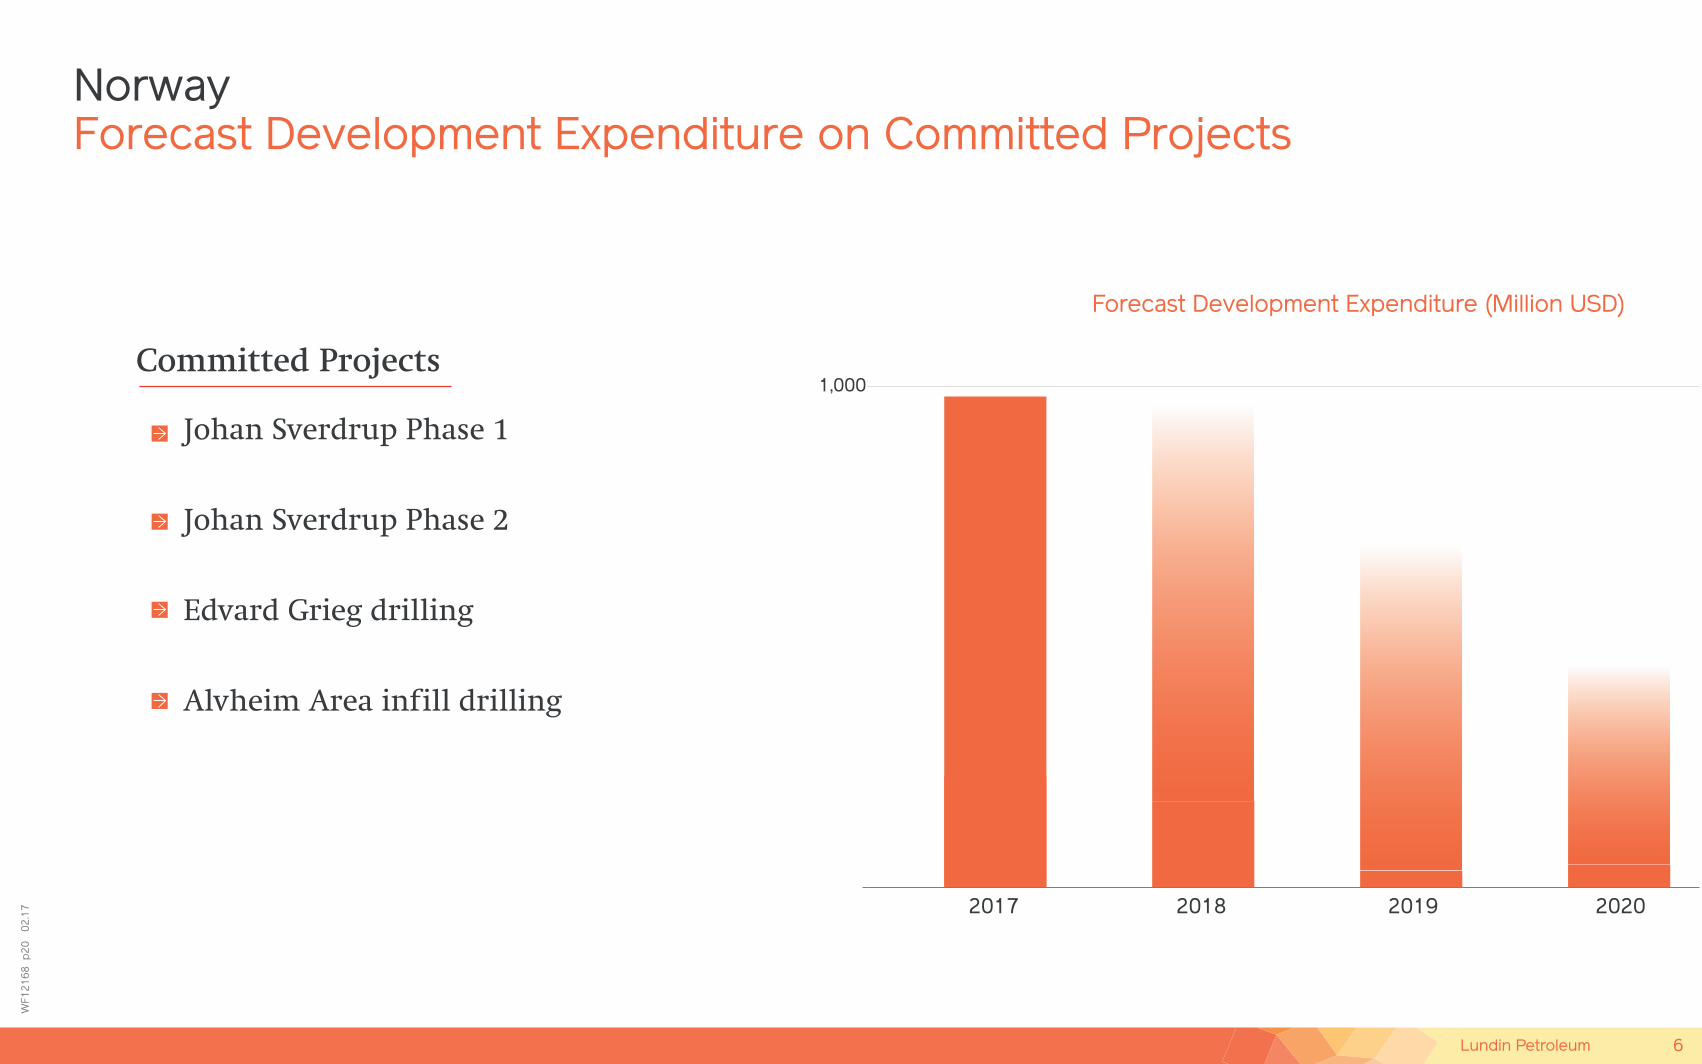
NorwayForecast Development Expenditure on Committed Projects
1,000
2017 2018 2019 2020
Forecast Development Expenditure (Million USD)
Johan Sverdrup Phase 1
Johan Sverdrup Phase 2
Edvard Grieg drilling
Alvheim Area infill drilling
Committed Projects
6Lundin Petroleum
WF1
2310
p07
05.
17
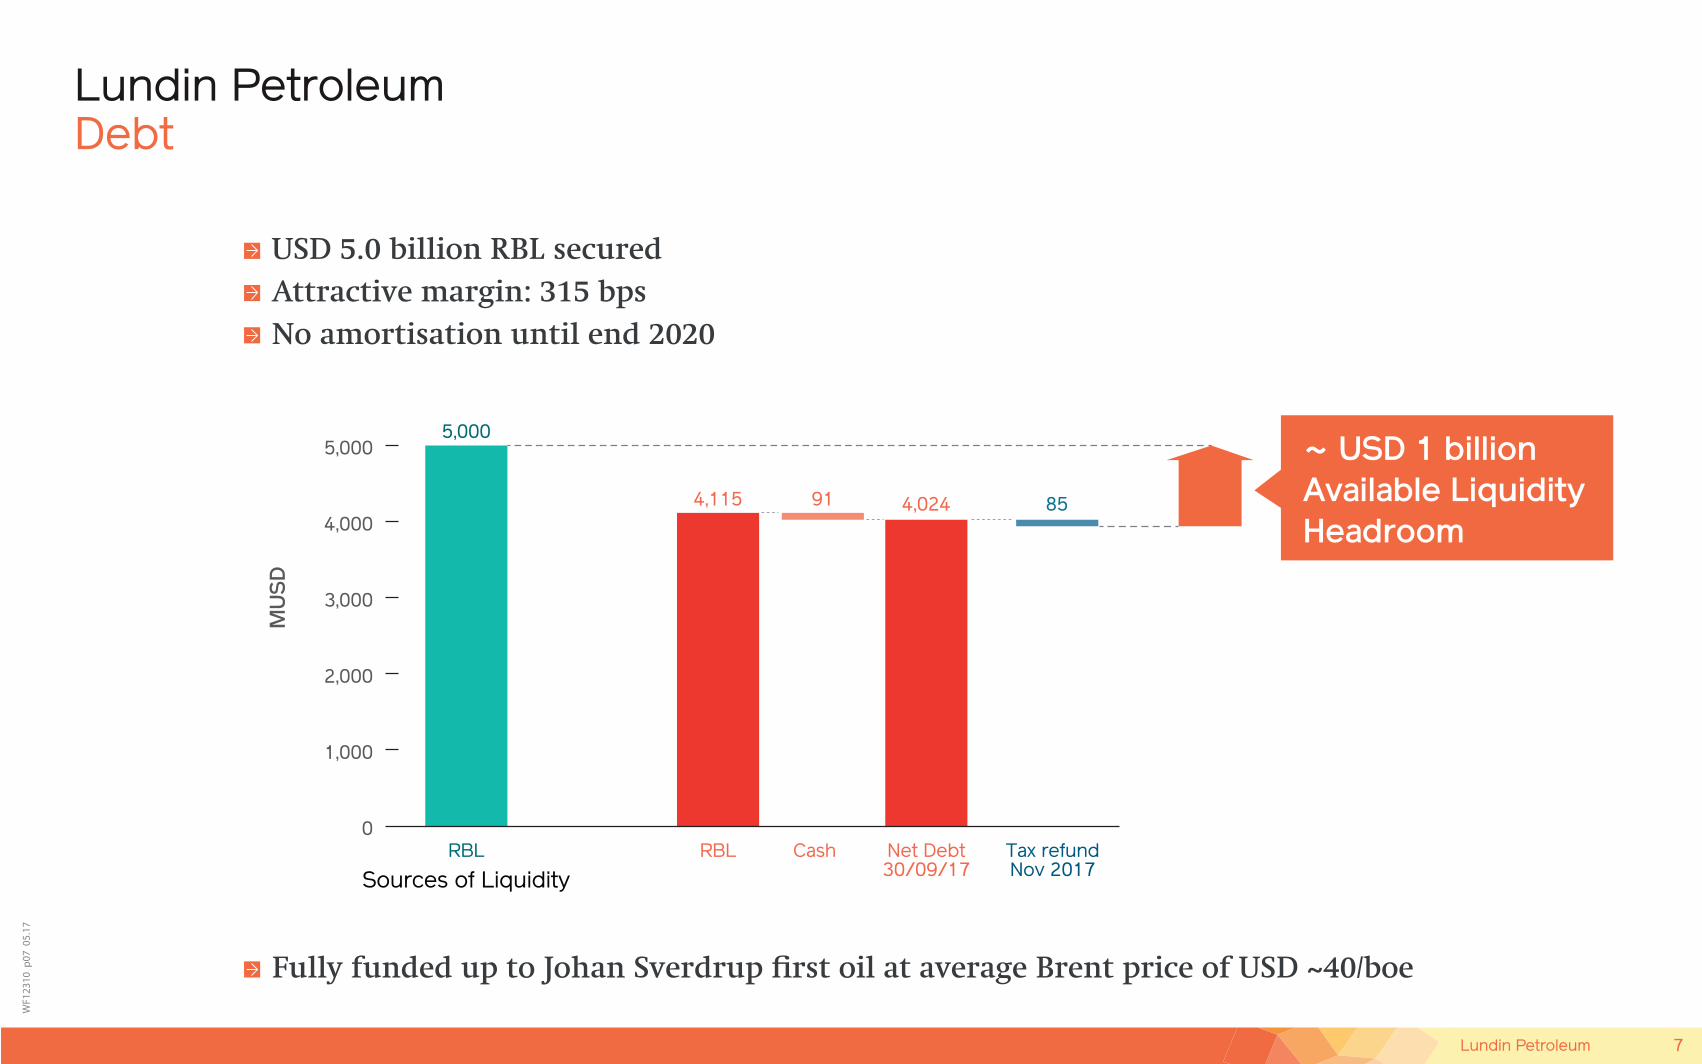
Lundin PetroleumDebt
~ USD 1 billionAvailable LiquidityHeadroom
USD 5.0 billion RBL secured Attractive margin: 315 bpsNo amortisation until end 2020
Fully funded up to Johan Sverdrup first oil at average Brent price of USD ~40/boe
4,115 4,02491 85
RBL RBL Cash Net Debt30/09/17
Tax refundNov 2017Sources of Liquidity
0
1,000
2,000
3,000
4,000
5,000
MU
SD
5,000
7Lundin Petroleum
WF1
2310
p04
08.
17
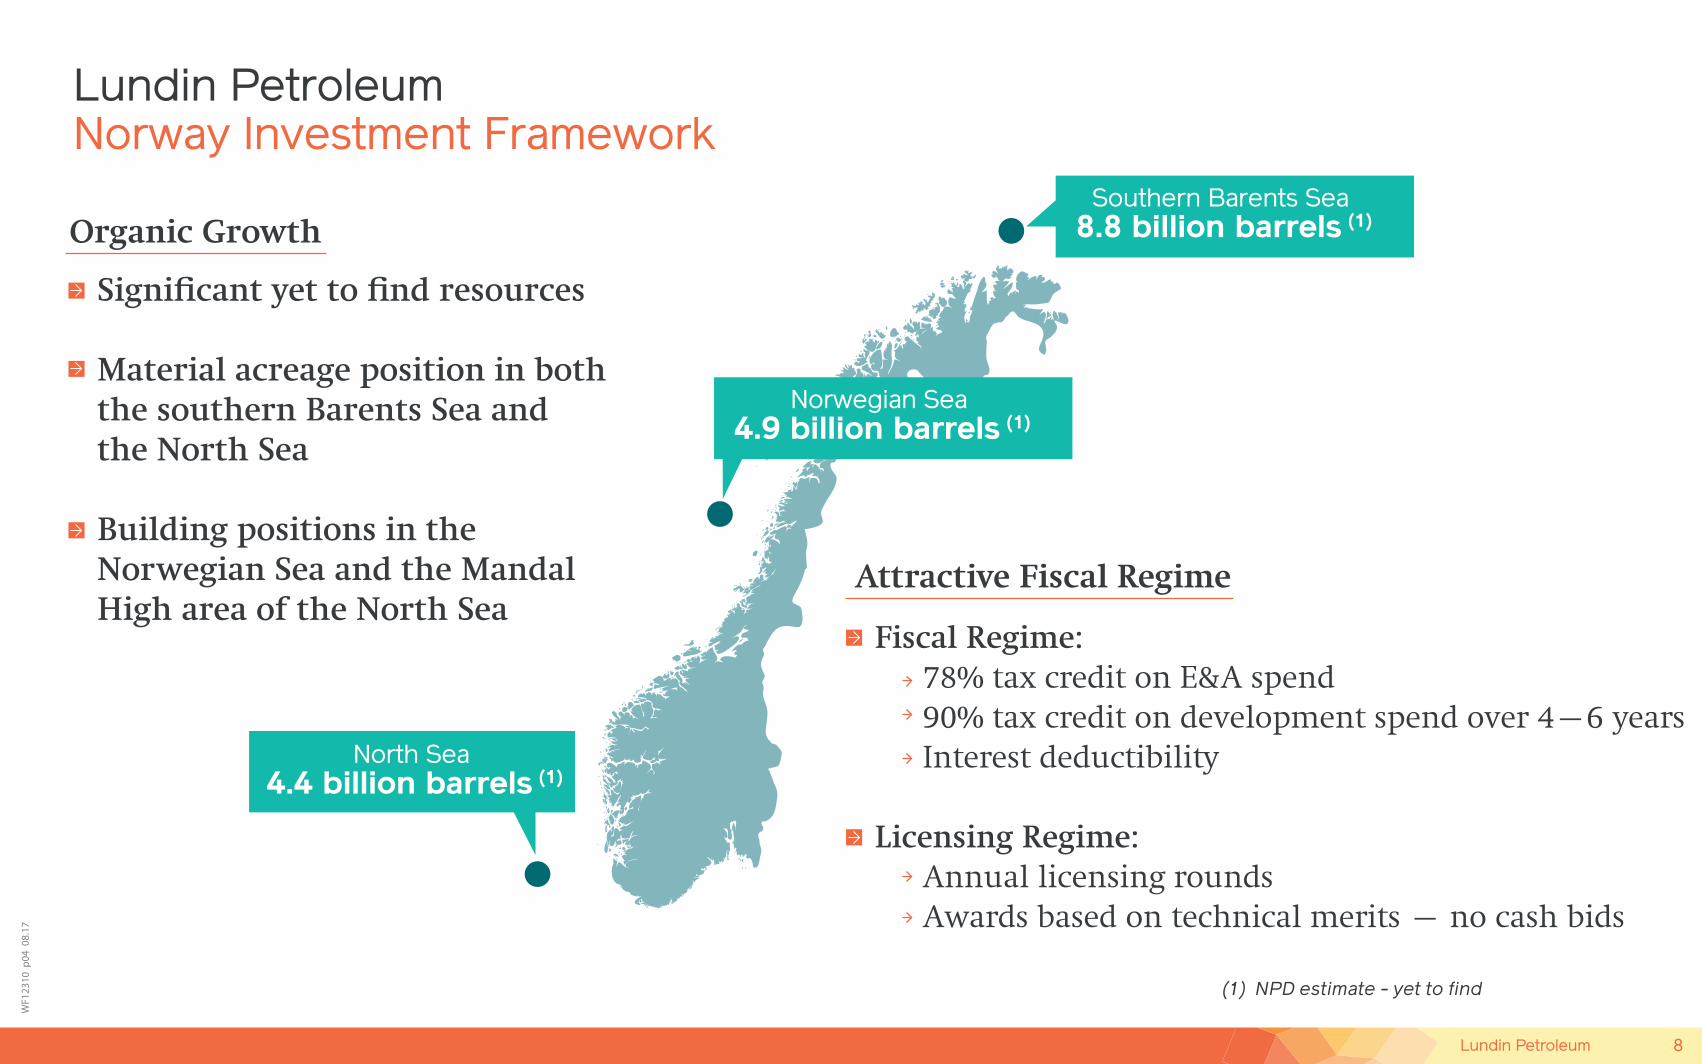
Norway Investment FrameworkLundin Petroleum
Fiscal Regime: 78% tax credit on E&A spend 90% tax credit on development spend over 4–6 years Interest deductibility
Licensing Regime: Annual licensing rounds Awards based on technical merits – no cash bids
(1) NPD estimate - yet to find
Southern Barents Sea 8.8 billion barrels (1)
Significant yet to find resources
Material acreage position in both the southern Barents Sea and the North Sea
Building positions in the Norwegian Sea and the Mandal High area of the North Sea
Attractive Fiscal Regime
Organic Growth
North Sea 4.4 billion barrels (1)
Norwegian Sea 4.9 billion barrels (1)
8Lundin Petroleum

WF1
2303
p05
06.
17
PDO
Gross Edvard Grieg Estimated Ultimate Recovery (MMboe)
Cumulative Production3P Reserves
Remaining 2P Reserves
186
2016
223
Lundin PetroleumEdvard Grieg Platform
Luno II(WI 50%)
SW Area
310
Luno II North (WI 50%) Rolvsnes
(WI 50%)
Apollo(WI 65%)
Gas Export to SAGE
Edvard Grieg (WI 65%)onstream Q4 2015
Ivar Aasen (WI 1.385%)onstream Q4 2016
Oil Export to Grane
potential future tie-back to Edvard Grieg
Lundin operated
2P reserves: 223 MMboe
Increased facilities capacity: 145,000 bopd (1) gross
Reservoir performance better than expected – significant reserve increase anticipated end 2017
Development drilling ongoing
Ivar Aasen processing at Edvard Grieg
OPEX4.15 USD/boe including tariff netting (2)
4.85 USD/boe (2)
(2) 2017 forecast
(1) Combined for Edvard Grieg and Ivar Aasen
Key Production Asset – Edvard Grieg
9Lundin Petroleum
WF1
2303
p14
09.
17
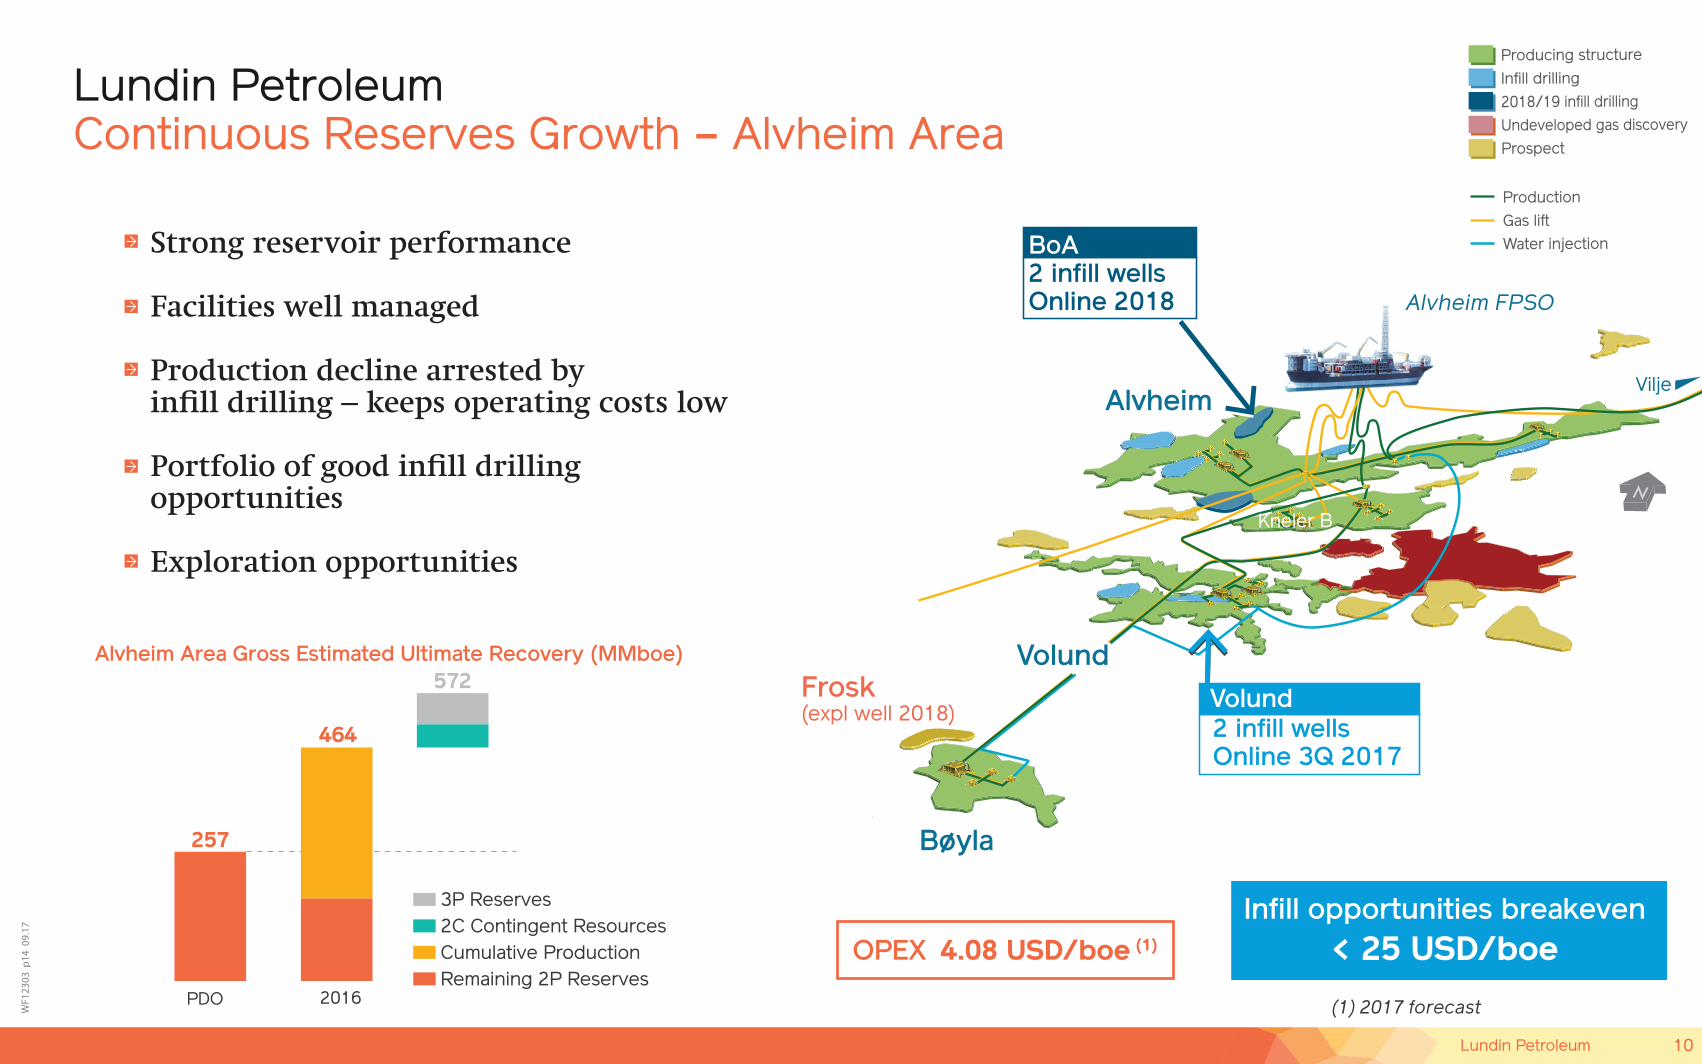
Lundin PetroleumContinuous Reserves Growth – Alvheim Area
Strong reservoir performance
Facilities well managed
Production decline arrested by infill drilling – keeps operating costs low
Portfolio of good infill drilling opportunities
Exploration opportunities
PDO
2C Contingent ResourcesCumulative Production
3P Reserves
Remaining 2P Reserves2016
Alvheim Area Gross Estimated Ultimate Recovery (MMboe)
257
464
572
(1) 2017 forecast
Bøyla
Vilje
Kneler B
ProductionGas liftWater injection
Producing structure
Infill drilling
2018/19 infill drilling
Undeveloped gas discovery
Prospect
BoA2 infill wellsOnline 2018
Alvheim
2 infill wellsOnline 3Q 2017
Volund
VolundFrosk(expl well 2018)
OPEX 4.08 USD/boe (1)
Infill opportunities breakeven< 25 USD/boe
Alvheim FPSO
10Lundin Petroleum

WF1
2298
p40
01.
18
Gross Resources: 2.0 - 3.0 billion boe
Processing platform 1
Living Quarters
Riser platform Processing platform 2
Wellhead & Drillingplatform
Largest Phase 1 development on NCS
Phase 1 progressing to schedule > 60% complete Project metrics continue to get better
Statoil
Lundin
Petoro
Aker BP
Maersk
40.0267%
22.6000%
17.3600%
11.5733%
8.4400%
Working Interest – Johan Sverdrup Unit
Lundin PetroleumJohan Sverdrup
Full FieldBreak Even Price
Investment CostReserves EstimateCapacity
11Lundin Petroleum

WF1
2378
p13
07.
17
Johan SverdrupPhase 1 – Key Milestones Being Delivered on Schedule
Riser platform jacket installed - July 2017
Drilling Platform Topsides assembled - September 2017
Norway
Drilling PlatformTopsides
Riser Platform Jacket
Oslo
Johan Sverdrup
Haugesund
12Lundin Petroleum
WF1
2298
p09
09.
17
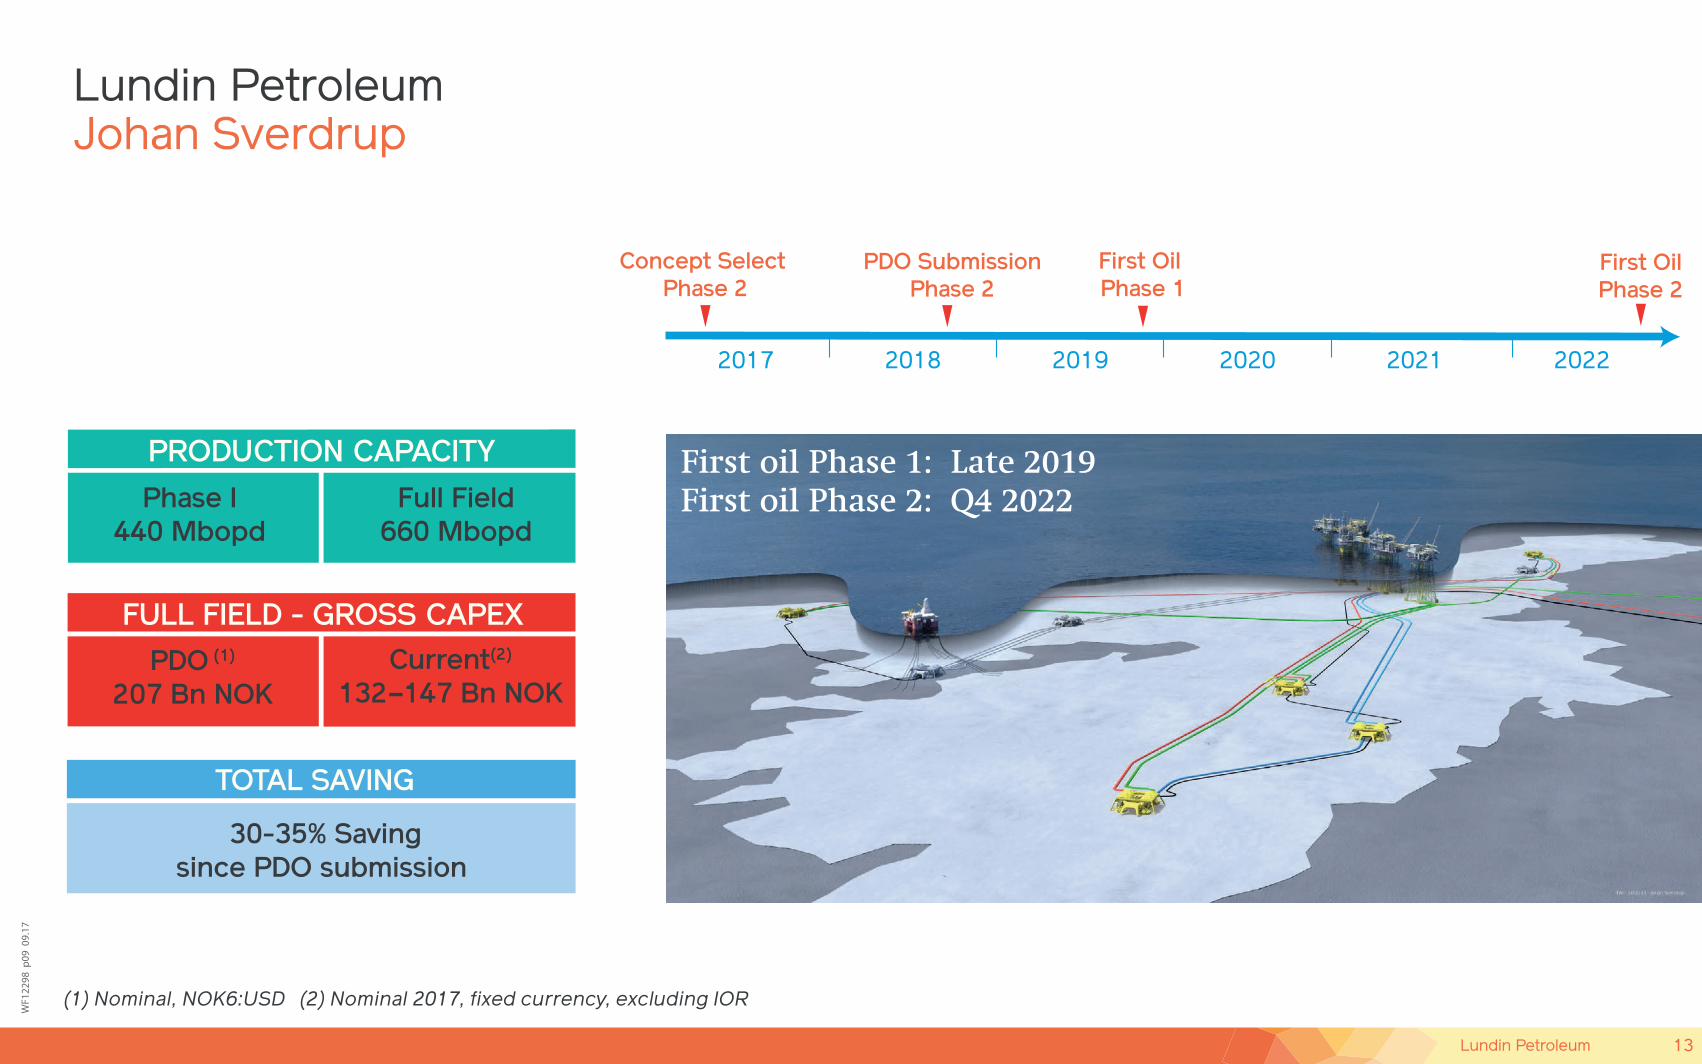
Johan SverdrupLundin Petroleum
PDO (1)
207 Bn NOKCurrent(2)
132–147 Bn NOK
Phase I440 Mbopd
Full Field660 Mbopd
FULL FIELD - GROSS CAPEX
TOTAL SAVING
PRODUCTION CAPACITY
(1) Nominal, NOK6:USD (2) Nominal 2017, fixed currency, excluding IOR
30-35% Savingsince PDO submission
2017 2018 2019 2020 2021 2022
PDO SubmissionPhase 2
First Oil Phase 1
First OilPhase 2
Concept Select Phase 2
First oil Phase 1: Late 2019First oil Phase 2: Q4 2022
13Lundin Petroleum

WF1
2297
p08
08.
17
Lundin Petroleum Big Fields Get Bigger
2C Contingent Resources
3P Reserves
Cumulative Production
2P Reserves
600
400
100
500
300
200
0
2,200
2,400
2,600
2,800
3,000
3,200
Gro
ss M
Mb
oe
Alvheim AreaPDO End 2016
98%
Edvard GriegPDO End 2016
EG South West36%
Johan SverdrupPDO End 2016
16%
Gross ultimate reserves and resources
14Lundin Petroleum
WF1
2310
p05
01.
18
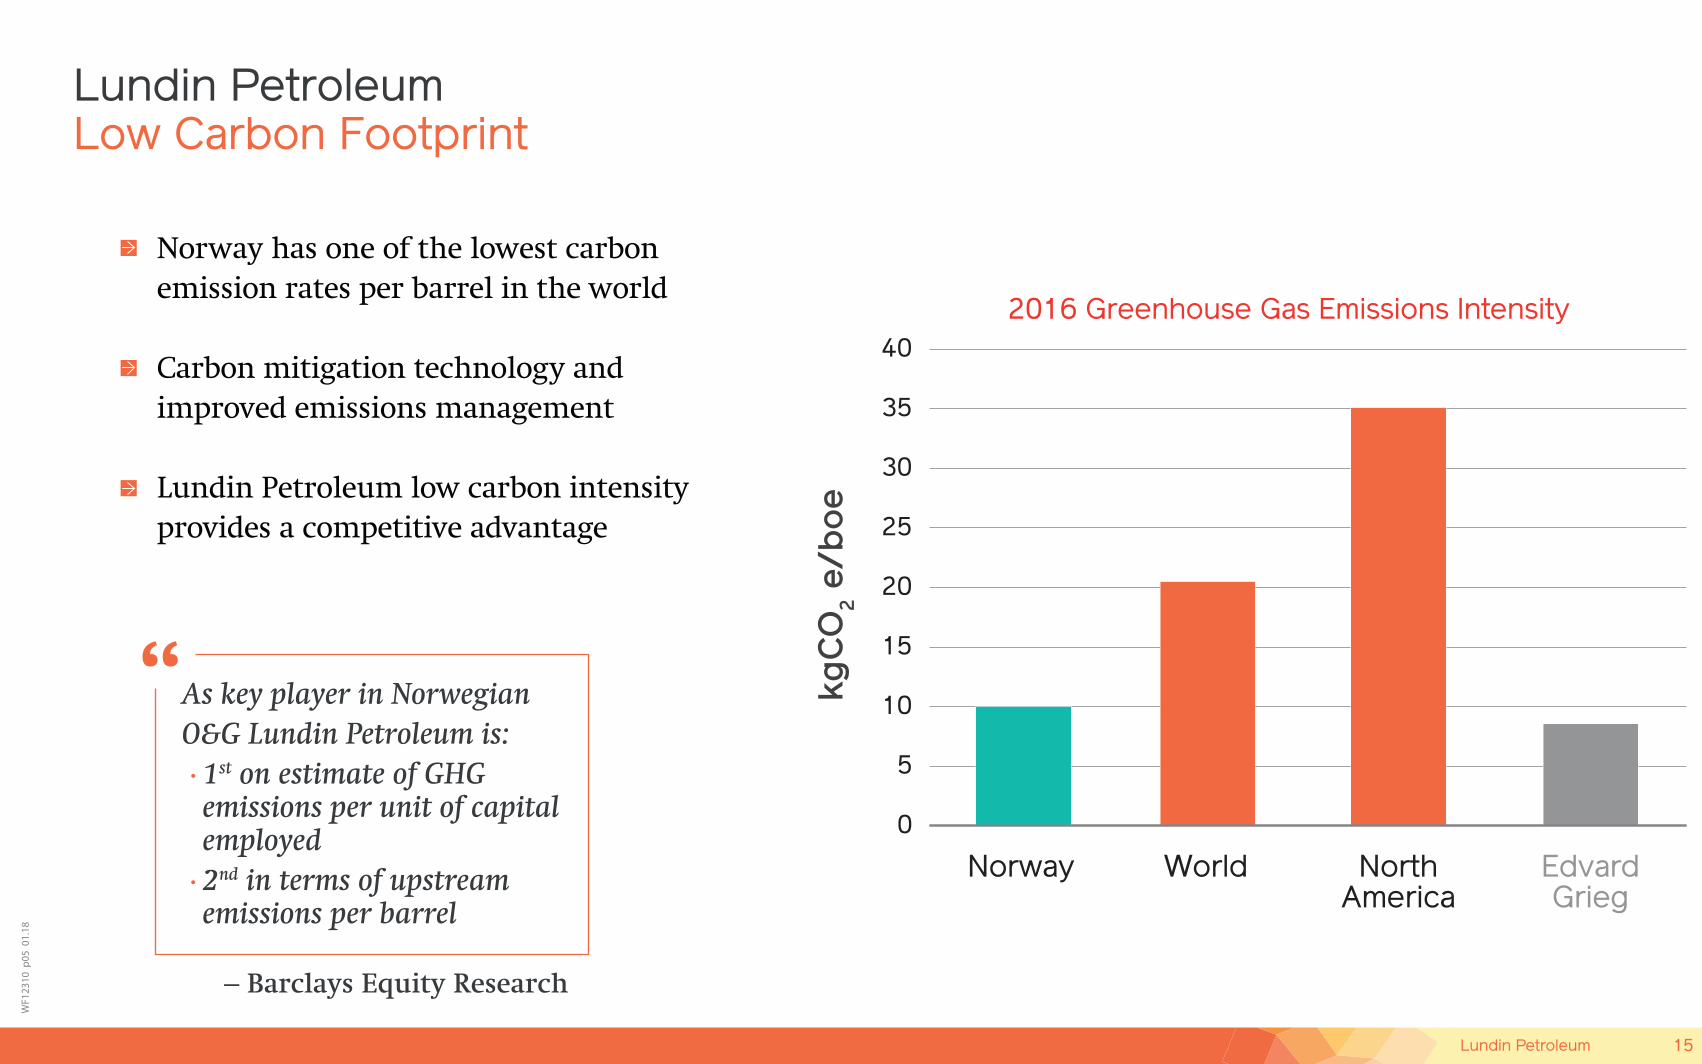
Lundin PetroleumLow Carbon Footprint
Norway World NorthAmerica
0
5
10
15
20
25
30
35
40
kgC
O2 e
/bo
e
2016 Greenhouse Gas Emissions Intensity
Norway has one of the lowest carbon emission rates per barrel in the world
Carbon mitigation technology and improved emissions management
Lundin Petroleum low carbon intensity provides a competitive advantage
EdvardGrieg
“ As key player in Norwegian O&G Lundin Petroleum is: · 1st on estimate of GHG emissions per unit of capital employed · 2nd in terms of upstream emissions per barrel
– Barclays Equity Research
15Lundin Petroleum
WF1
2378
Q
3 p
26 0
1.18
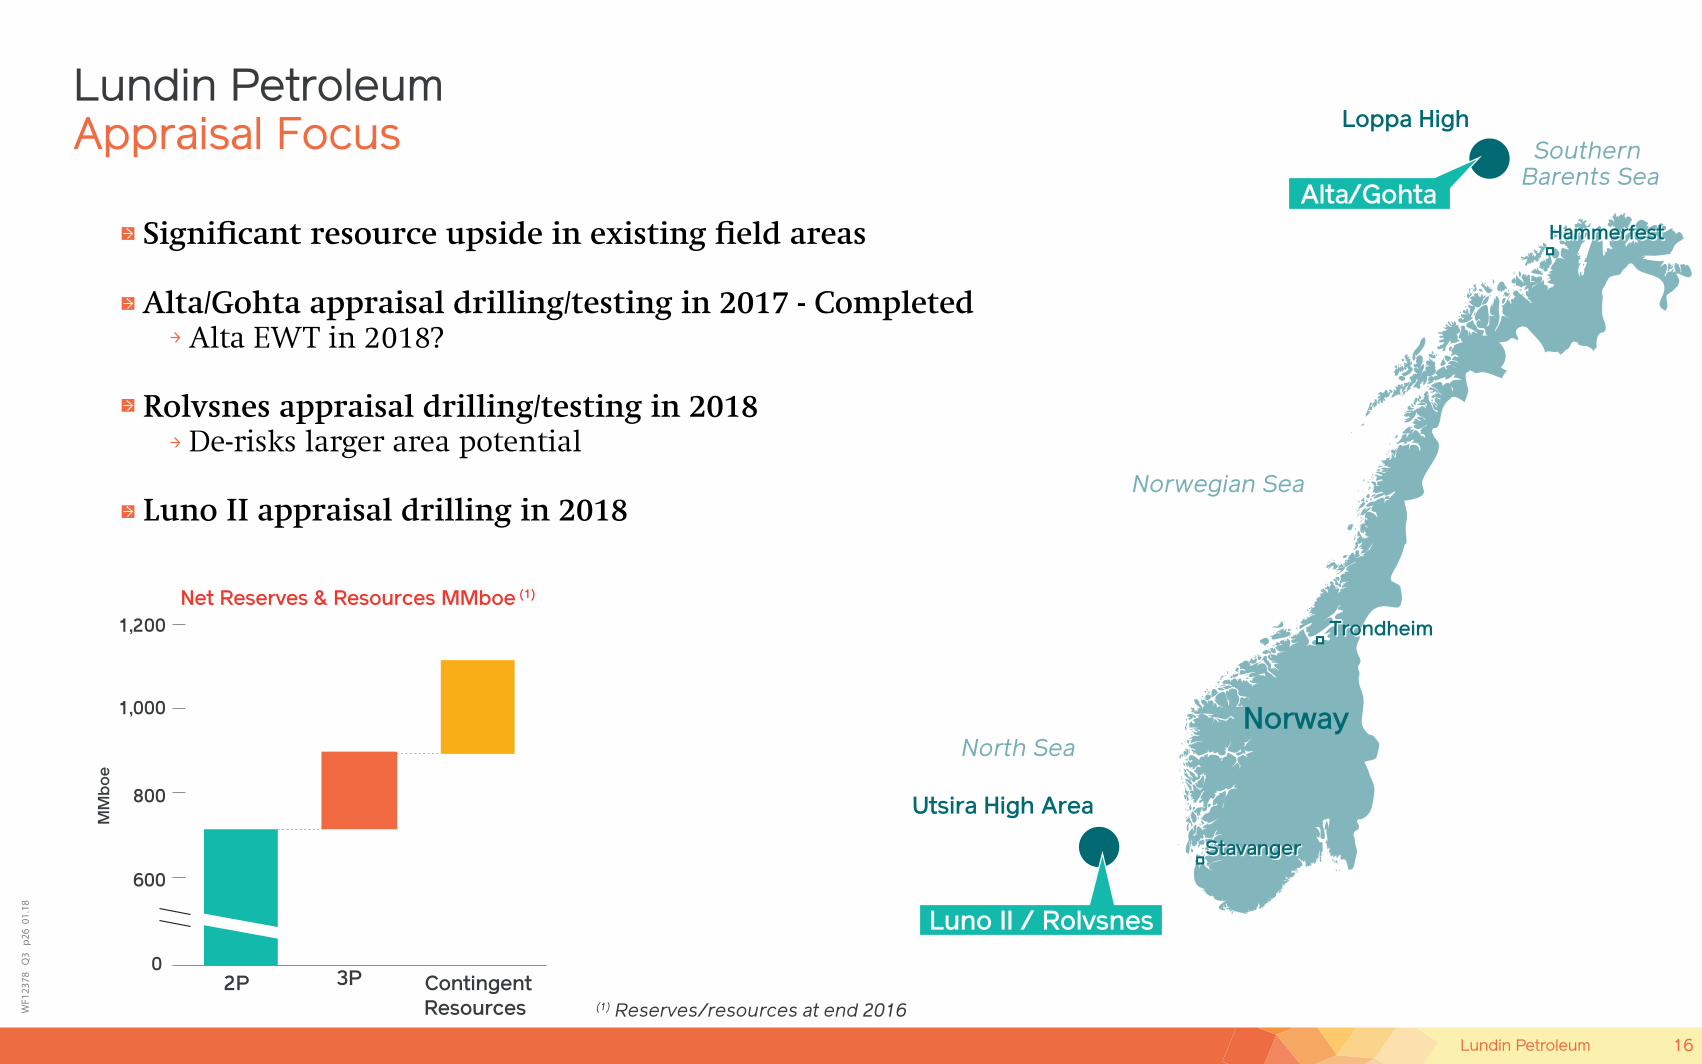
Appraisal FocusLundin Petroleum
Significant resource upside in existing field areas
Alta/Gohta appraisal drilling/testing in 2017 - Completed Alta EWT in 2018?
Rolvsnes appraisal drilling/testing in 2018 De-risks larger area potential
Luno II appraisal drilling in 2018
NorwayNorth Sea
Norwegian Sea
Southern Barents Sea
HammerfestHammerfest
StavangerStavanger
Trondheim Trondheim
Luno II / Rolvsnes
Alta/Gohta
Utsira High Area
Loppa High
(1) Reserves/resources at end 2016
MM
bo
e
ContingentResources
2P 3P
Net Reserves & Resources MMboe (1)
0
600
800
1,000
1,200
16Lundin Petroleum
WF1
2378
Q
3 p
09 0
1.18
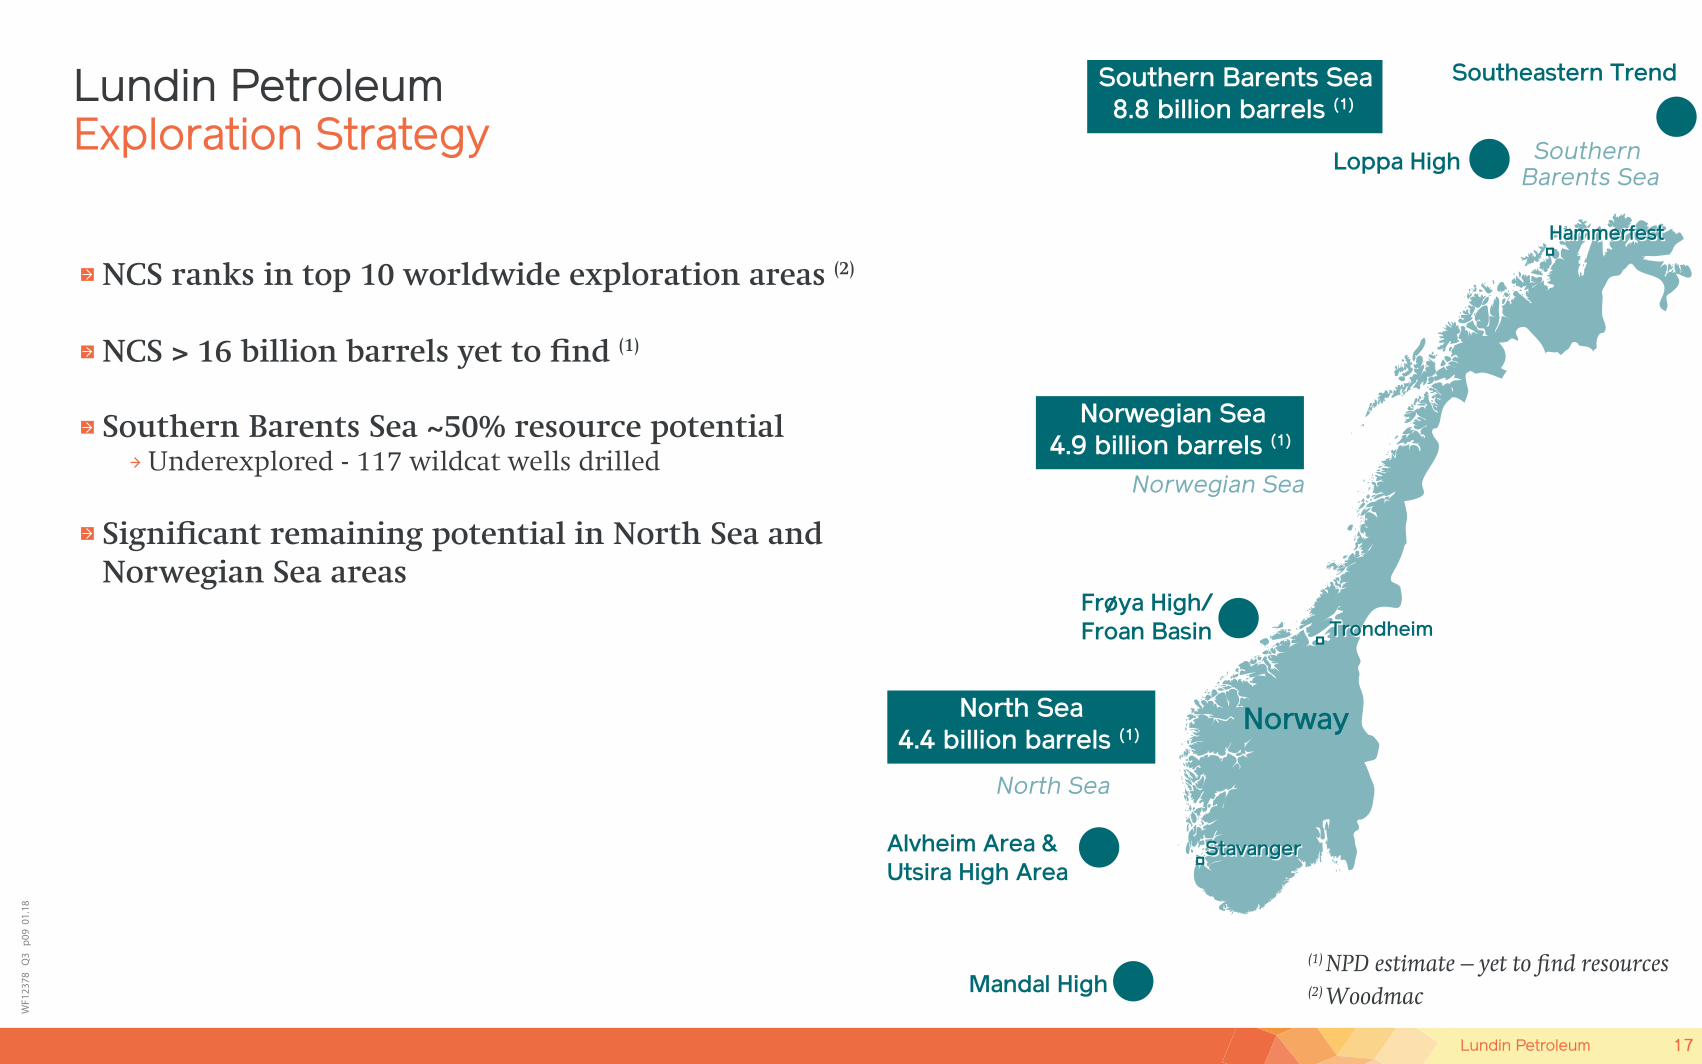
Exploration StrategyLundin Petroleum
NCS ranks in top 10 worldwide exploration areas (2)
NCS > 16 billion barrels yet to find (1)
Southern Barents Sea ~50% resource potential Underexplored - 117 wildcat wells drilled
Significant remaining potential in North Sea andNorwegian Sea areas
Norway
North Sea
Norwegian Sea
Southern Barents Sea
HammerfestHammerfest
StavangerStavanger
Trondheim Trondheim
Alvheim Area &Utsira High Area
Mandal High
Frøya High/Froan Basin
Loppa High
Southeastern Trend
(2) Woodmac
(1) NPD estimate – yet to find resources
Southern Barents Sea8.8 billion barrels (1)
Norwegian Sea4.9 billion barrels (1)
North Sea4.4 billion barrels (1)
17Lundin Petroleum
WF1
2392
p06
01.
18
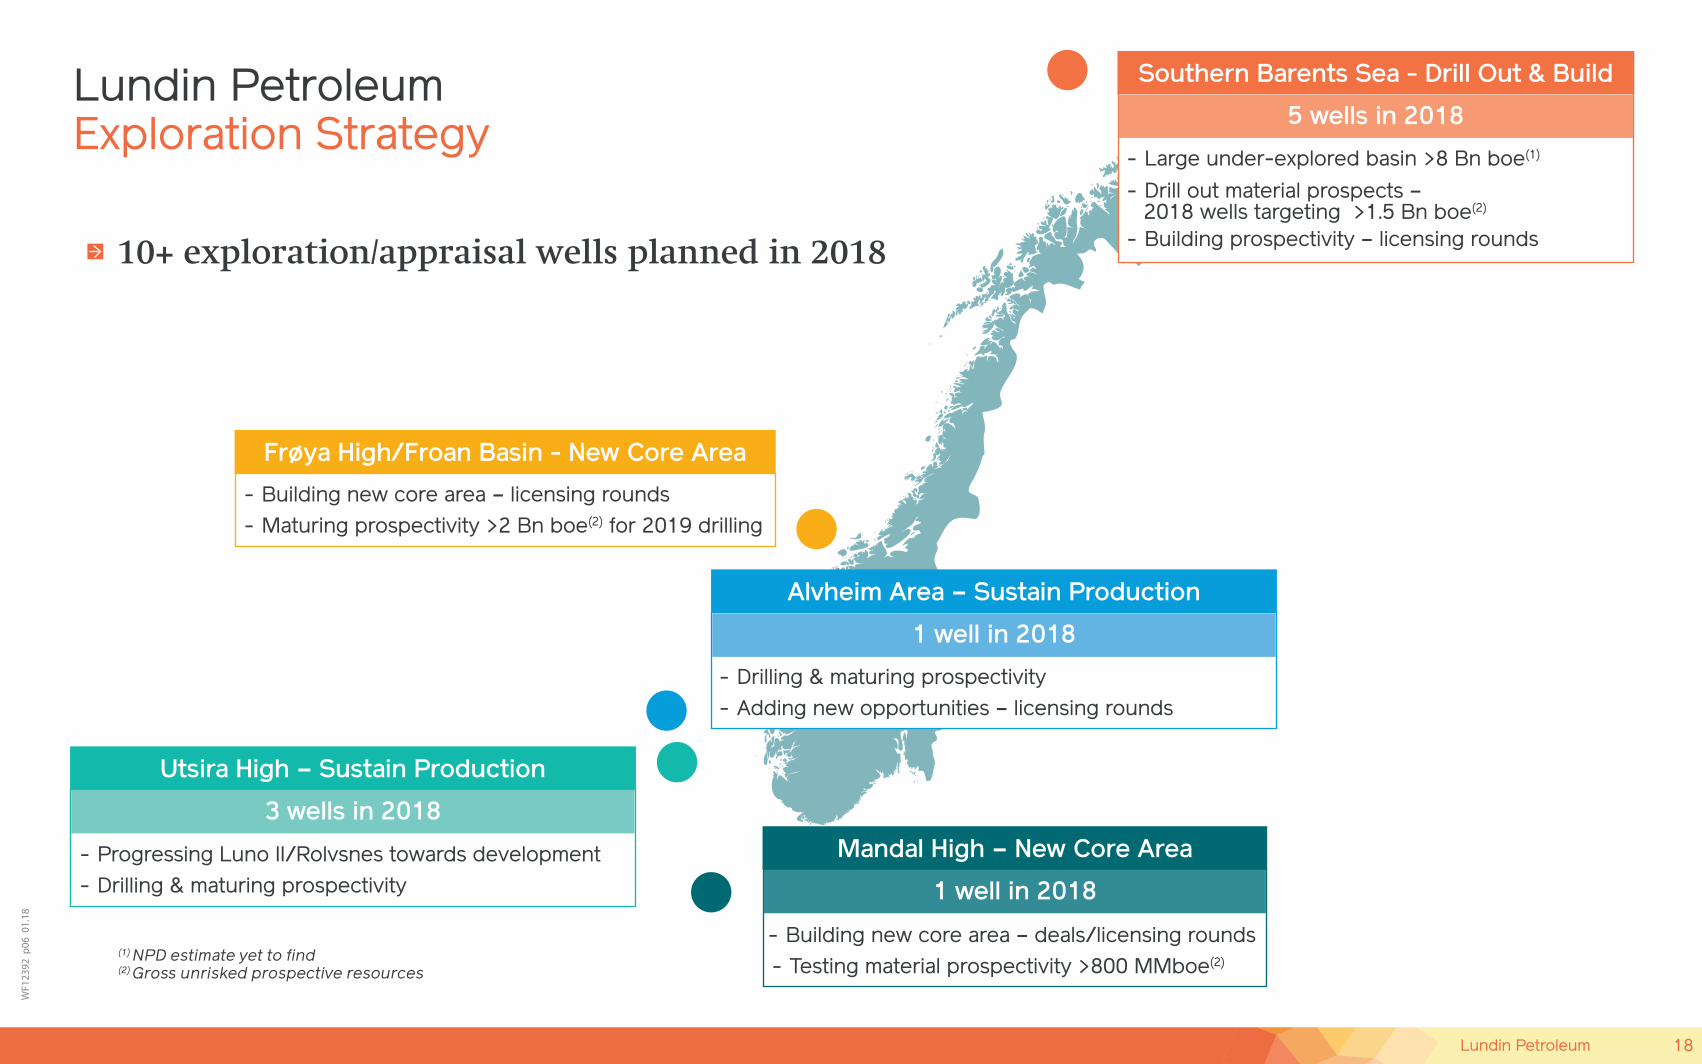
Exploration StrategyLundin Petroleum
Frøya High/Froan Basin - New Core Area
- Building new core area – licensing rounds- Maturing prospectivity >2 Bn boe(2) for 2019 drilling
Mandal High – New Core Area
- Building new core area – deals/licensing rounds- Testing material prospectivity >800 MMboe(2)
Utsira High – Sustain Production
- Progressing Luno II/Rolvsnes towards development- Drilling & maturing prospectivity
Southern Barents Sea - Drill Out & Build
- Large under-explored basin >8 Bn boe(1)
- Drill out material prospects – 2018 wells targeting >1.5 Bn boe(2) - Building prospectivity – licensing rounds
5 wells in 2018
Alvheim Area – Sustain Production
- Drilling & maturing prospectivity- Adding new opportunities – licensing rounds
1 well in 2018
3 wells in 2018
1 well in 2018
(1) NPD estimate yet to find(2) Gross unrisked prospective resources
10+ exploration/appraisal wells planned in 2018
18Lundin Petroleum
WF1
2310
p15
01.
18
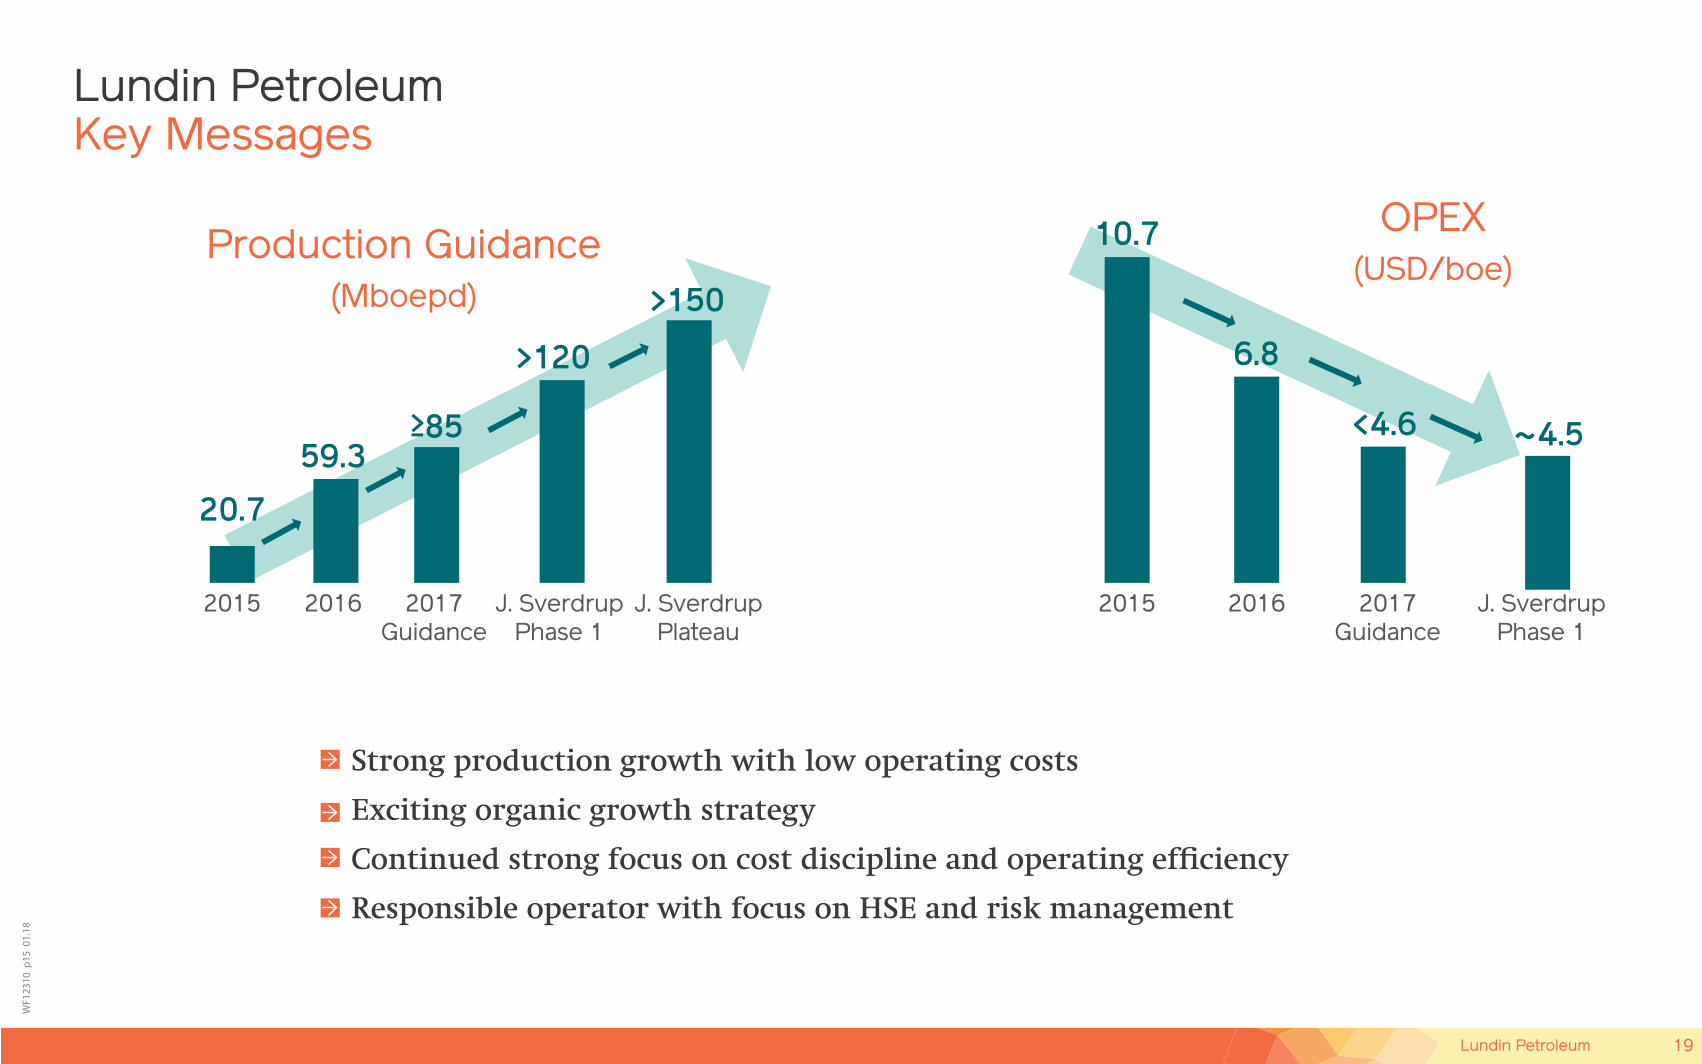
Lundin PetroleumKey Messages
Strong production growth with low operating costs
Exciting organic growth strategy
Continued strong focus on cost discipline and operating efficiency
Responsible operator with focus on HSE and risk management
2015 2016
Production Guidance(Mboepd)
59.3
2017Guidance
20.7
>150
>120
2015 2016 2017Guidance
J. SverdrupPhase 1
OPEX(USD/boe)
32
6.8
~4.5<4.6
10.7
J. SverdrupPlateau
J. SverdrupPhase 1
>85
19Lundin Petroleum
WF1
2310
p15
01.
18
Lundin PetroleumKey Messages
Strong production growth with low operating costs
Exciting organic growth strategy
Continued strong focus on cost discipline and operating efficiency
Responsible operator with focus on HSE and risk management
2015 2016
Production Guidance(Mboepd)
59.3
2017Guidance
20.7
>150
>120
2015 2016 2017Guidance
J. SverdrupPhase 1
OPEX(USD/boe)
32
6.8
~4.5<4.6
10.7
J. SverdrupPlateau
J. SverdrupPhase 1
>85
20Lundin Petroleum
Lundin Petroleum
Appendix

WF1
1543
p5
01.1
7
FinancialPerformance
Operating Cash FlowEBITDA Total Capex
0
200
400
600
800
1,000
1,200
1,400
1,600
1,800
2,000
2010 2011
MU
SD
2012 2013 2014 2015 2016
Production (boepd)
Average Brent oil price (USD/boe)
Cost of operations (USD/boe)
EBITDA (MUSD)
Operating cash flow (MUSD)
Full Year2015
384.7
699.6
32,300
52.39
10.27
Full Year2016
902.6
1010.8
72,600
43.73
6.25
21Lundin Petroleum
WF1
2310
p10
02.
17
0
5
10
15
20
25
30Ye
ars
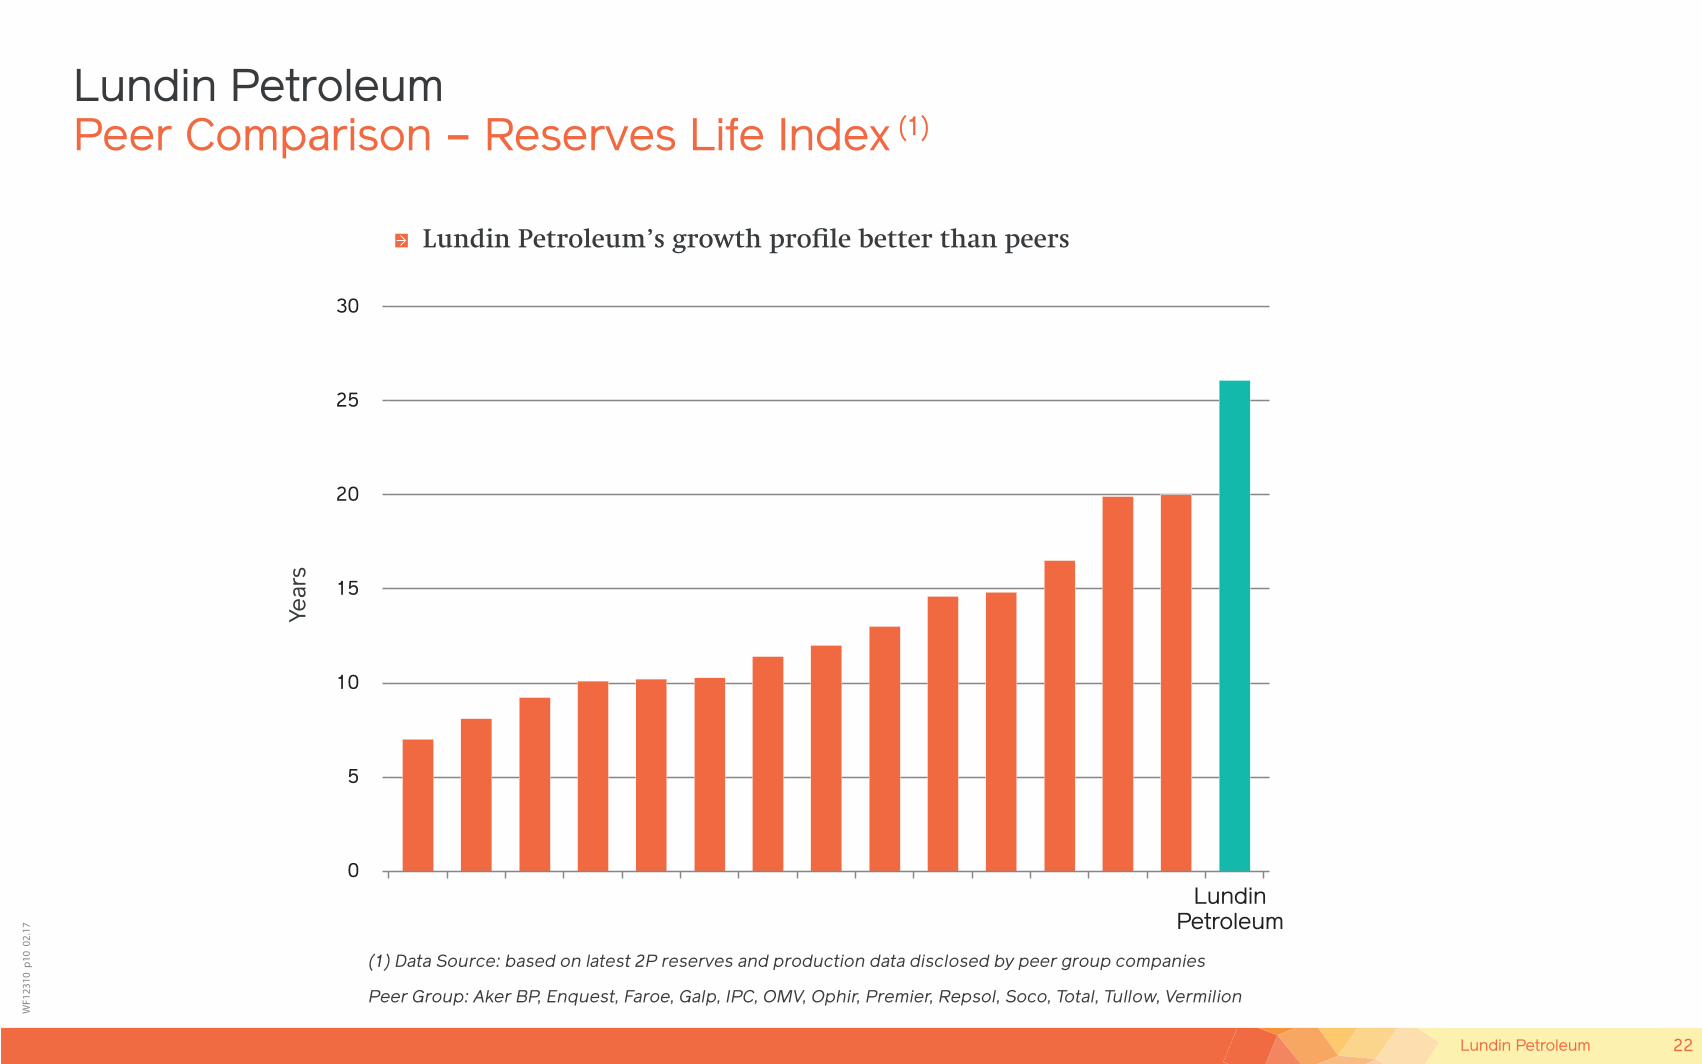
Lundin PetroleumPeer Comparison – Reserves Life Index (1)
(1) Data Source: based on latest 2P reserves and production data disclosed by peer group companies
Peer Group: Aker BP, Enquest, Faroe, Galp, IPC, OMV, Ophir, Premier, Repsol, Soco, Total, Tullow, Vermilion
LundinPetroleum
Lundin Petroleum’s growth profile better than peers
22Lundin Petroleum
WF1
2378
p
02 0
7.17
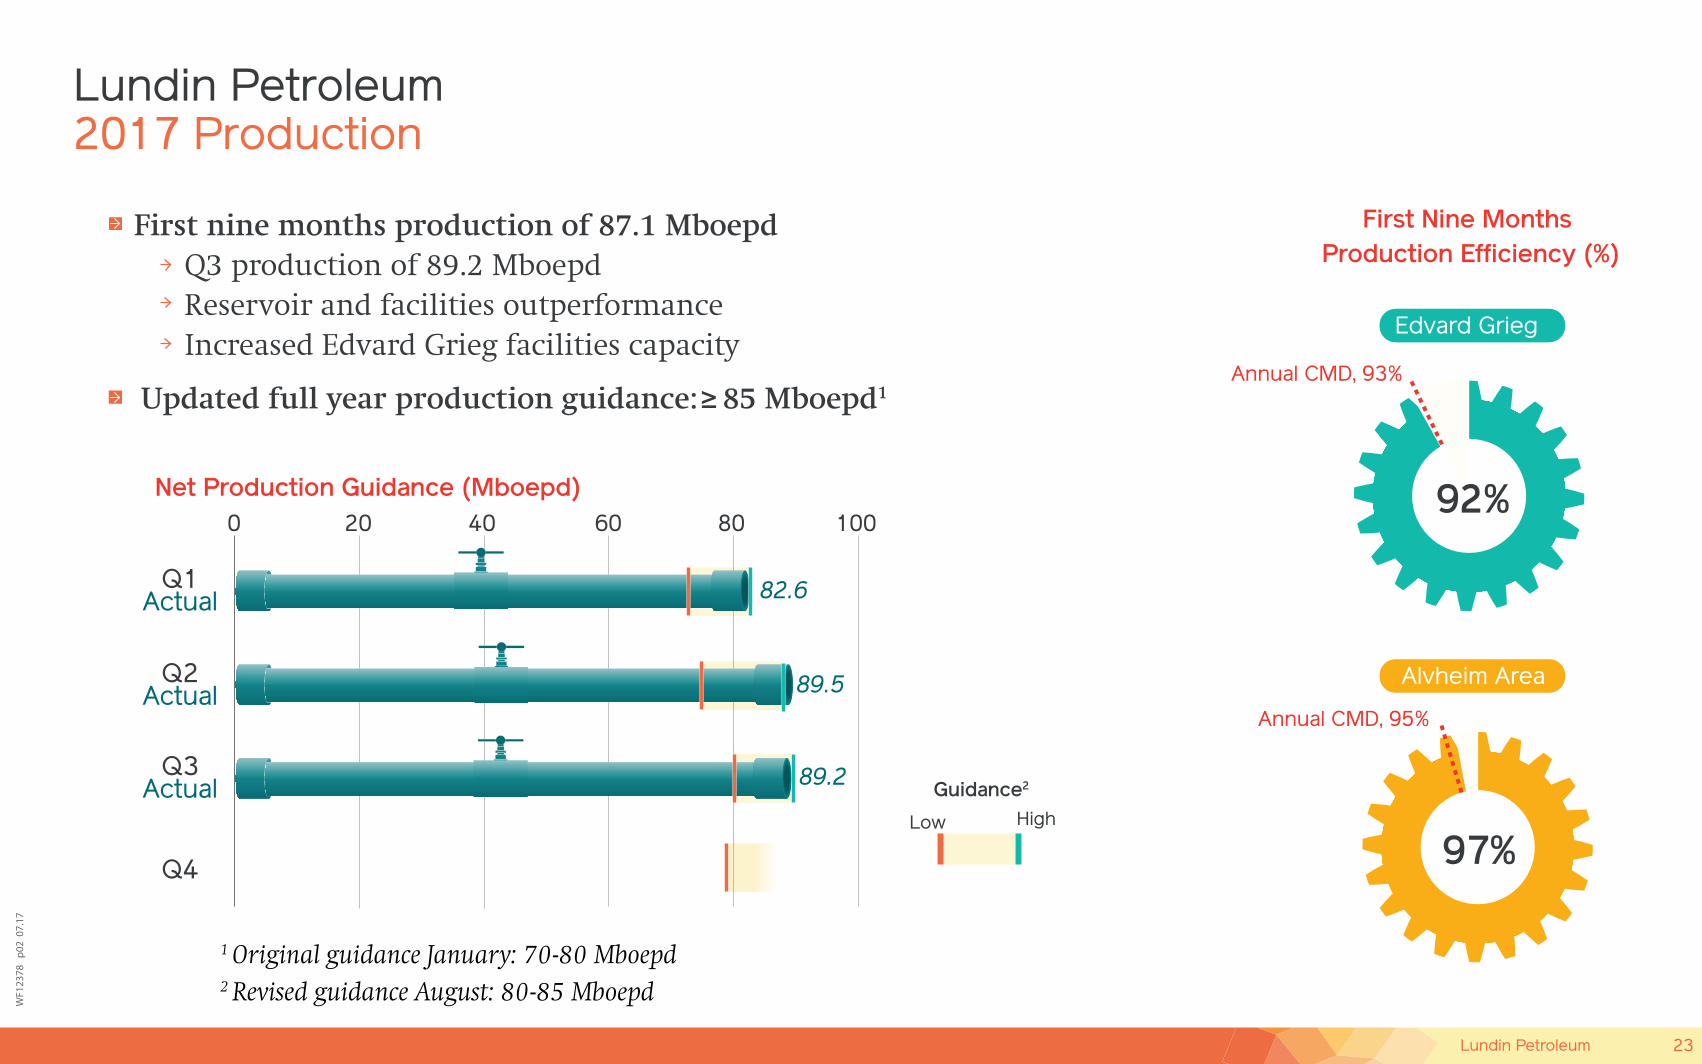
Edvard Grieg
92%
2017 ProductionLundin Petroleum
First Nine Months Production Efficiency (%)
Alvheim Area
97%
Annual CMD, 93%
Annual CMD, 95%
First nine months production of 87.1 Mboepd Q3 production of 89.2 Mboepd Reservoir and facilities outperformance Increased Edvard Grieg facilities capacity
Updated full year production guidance: 85 Mboepd1
0 4020 10060
Net Production Guidance (Mboepd)80
Q1Actual 82.6
89.5
89.2
Q2Actual
Q3Actual
Q4
High
Guidance2
Low
1 Original guidance January: 70-80 Mboepd2 Revised guidance August: 80-85 Mboepd
23Lundin Petroleum
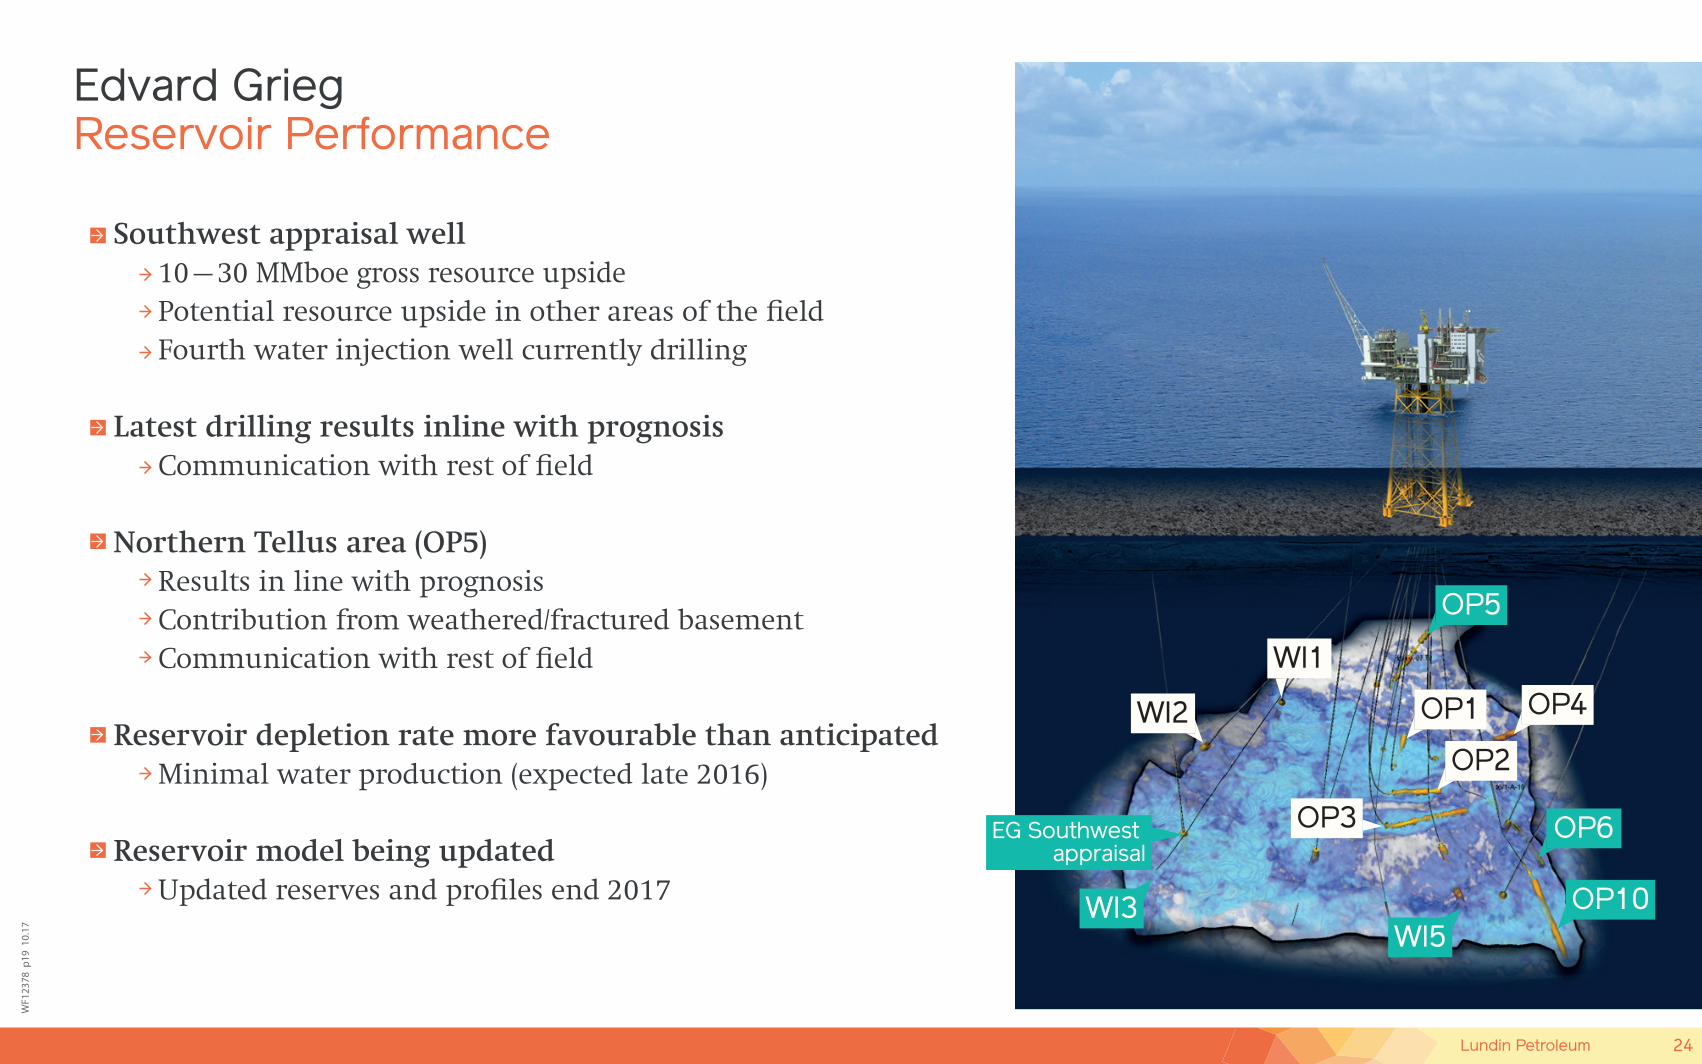
Southwest appraisal well 10–30 MMboe gross resource upside Potential resource upside in other areas of the field Fourth water injection well currently drilling
Latest drilling results inline with prognosis Communication with rest of field
Northern Tellus area (OP5) Results in line with prognosis Contribution from weathered/fractured basement Communication with rest of field
Reservoir depletion rate more favourable than anticipated Minimal water production (expected late 2016)
Reservoir model being updated Updated reserves and profiles end 2017
WF1
2378
p19
10.
17
Edvard GriegReservoir Performance
WI2
WI3WI5
WI1
OP2
OP1 OP4
OP5
OP10
EG Southwest appraisal
OP6OP3
24Lundin Petroleum
WF1
2302
p03
06.
17
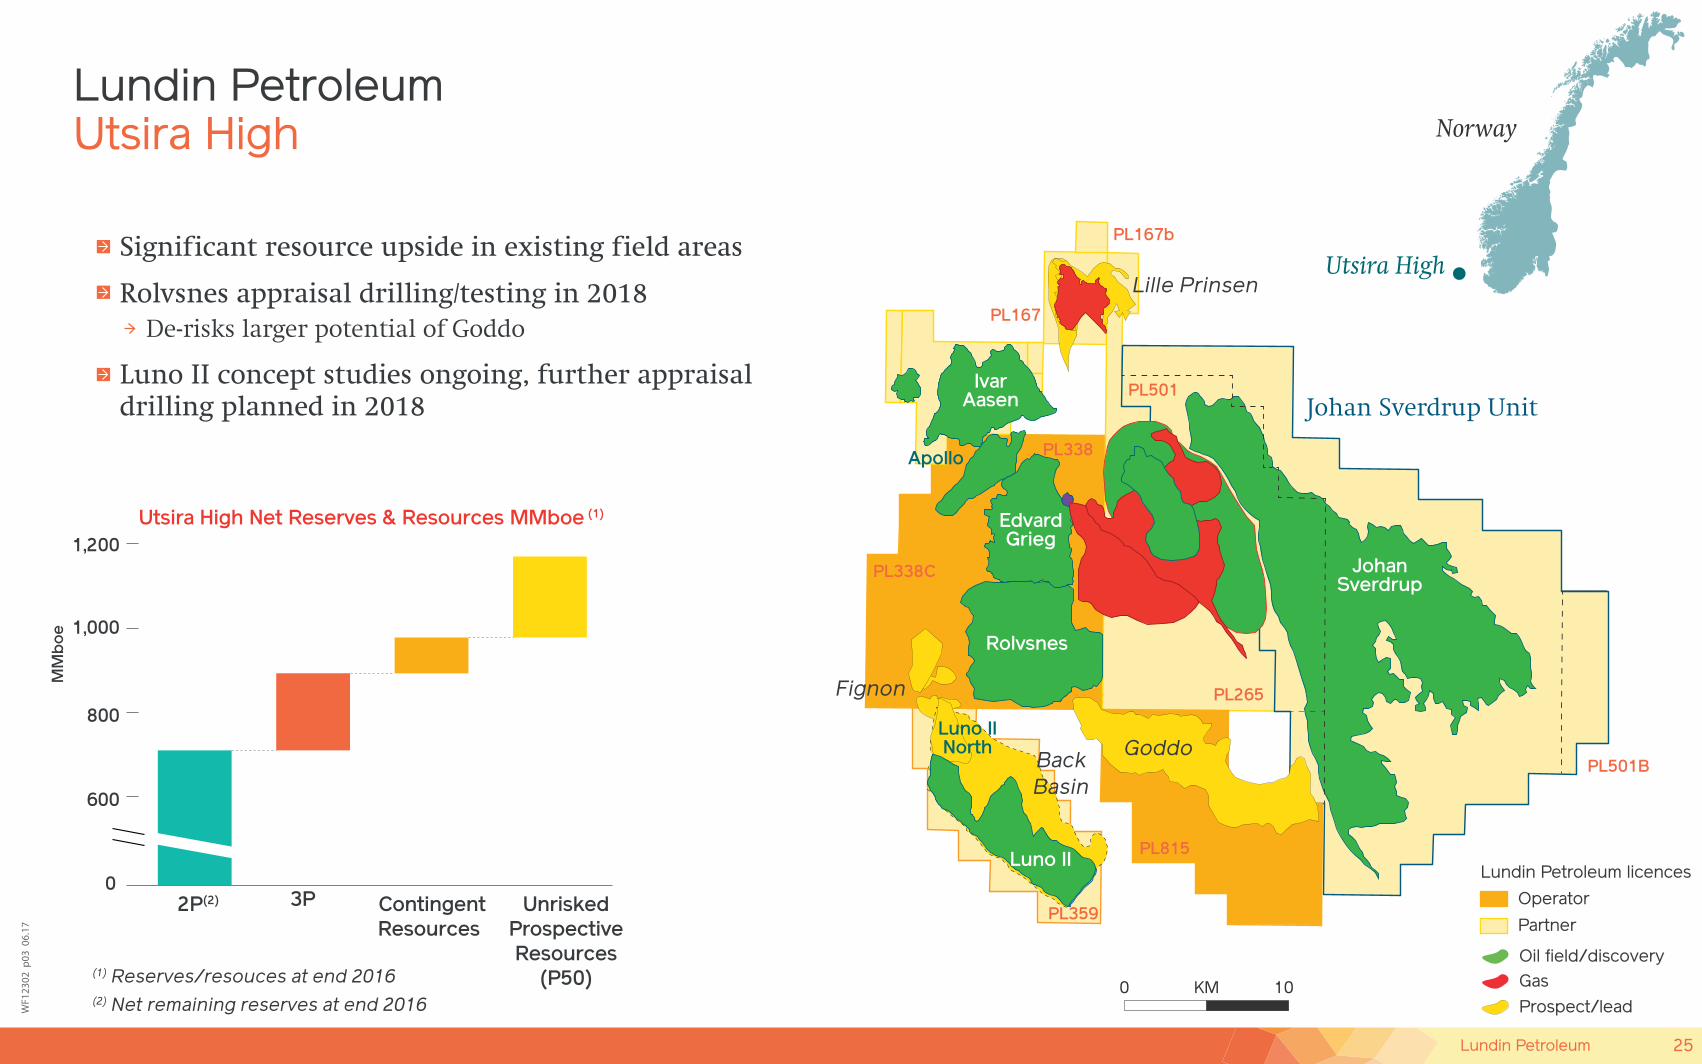
Utsira HighLundin Petroleum
Norway
Utsira High
Operator
Lundin Petroleum licences
Partner
Oil field/discoveryGas
Prospect/lead
Goddo
Lille Prinsen
Fignon
Apollo
Luno IINorth
Luno II
IvarAasen
EdvardGrieg
Rolvsnes
BackBasin
JohanSverdrup
PL359
PL338C
PL338
PL501
PL167
PL167b
PL501B
Johan Sverdrup Unit
PL265
PL815
0 KM 10(2) Net remaining reserves at end 2016
(1) Reserves/resouces at end 2016
MM
bo
e
ContingentResources
2P(2) UnriskedProspectiveResources
(P50)
3P
Utsira High Net Reserves & Resources MMboe (1)
0
600
800
1,000
1,200
Significant resource upside in existing field areas
Rolvsnes appraisal drilling/testing in 2018 De-risks larger potential of Goddo
Luno II concept studies ongoing, further appraisal drilling planned in 2018
25Lundin Petroleum
WF1
2346
p01
07.
17
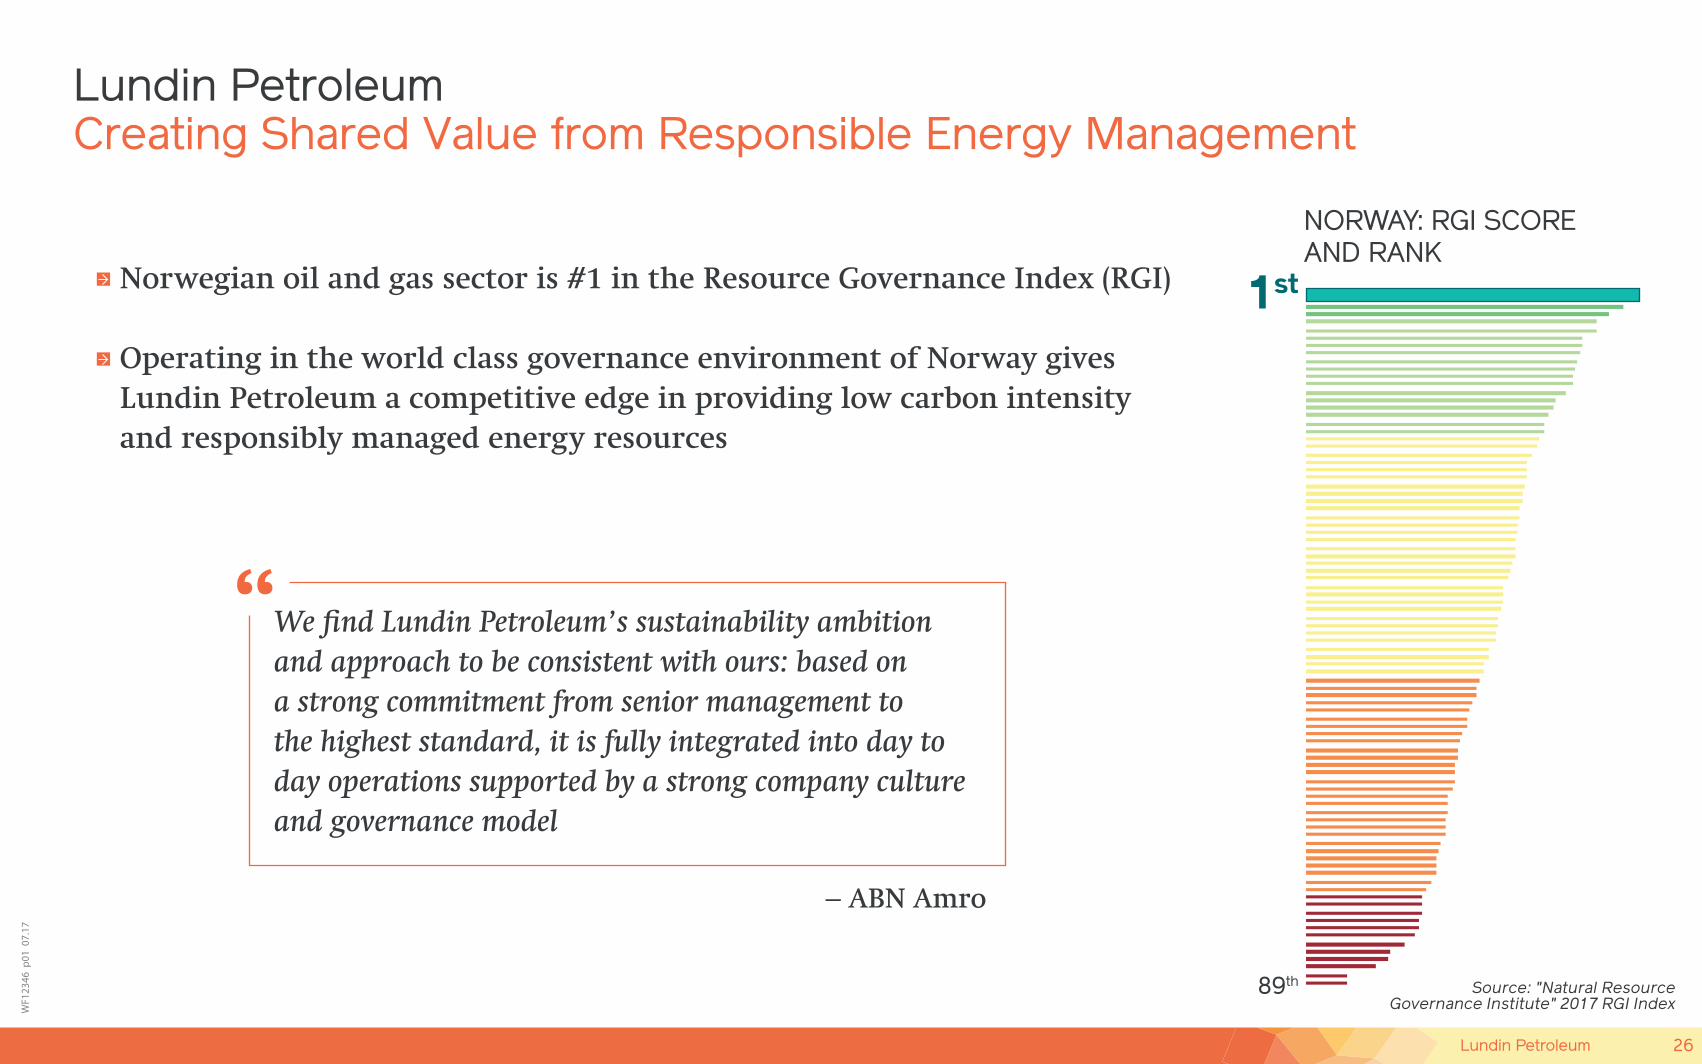
Creating Shared Value from Responsible Energy ManagementLundin Petroleum
Norwegian oil and gas sector is #1 in the Resource Governance Index (RGI) Operating in the world class governance environment of Norway givesLundin Petroleum a competitive edge in providing low carbon intensityand responsibly managed energy resources
NORWAY: RGI SCOREAND RANK
1st
89th Source: "Natural ResourceGovernance Institute" 2017 RGI Index
“We find Lundin Petroleum’s sustainability ambition and approach to be consistent with ours: based on a strong commitment from senior management to the highest standard, it is fully integrated into day today operations supported by a strong company culture and governance model
– ABN Amro
26Lundin Petroleum
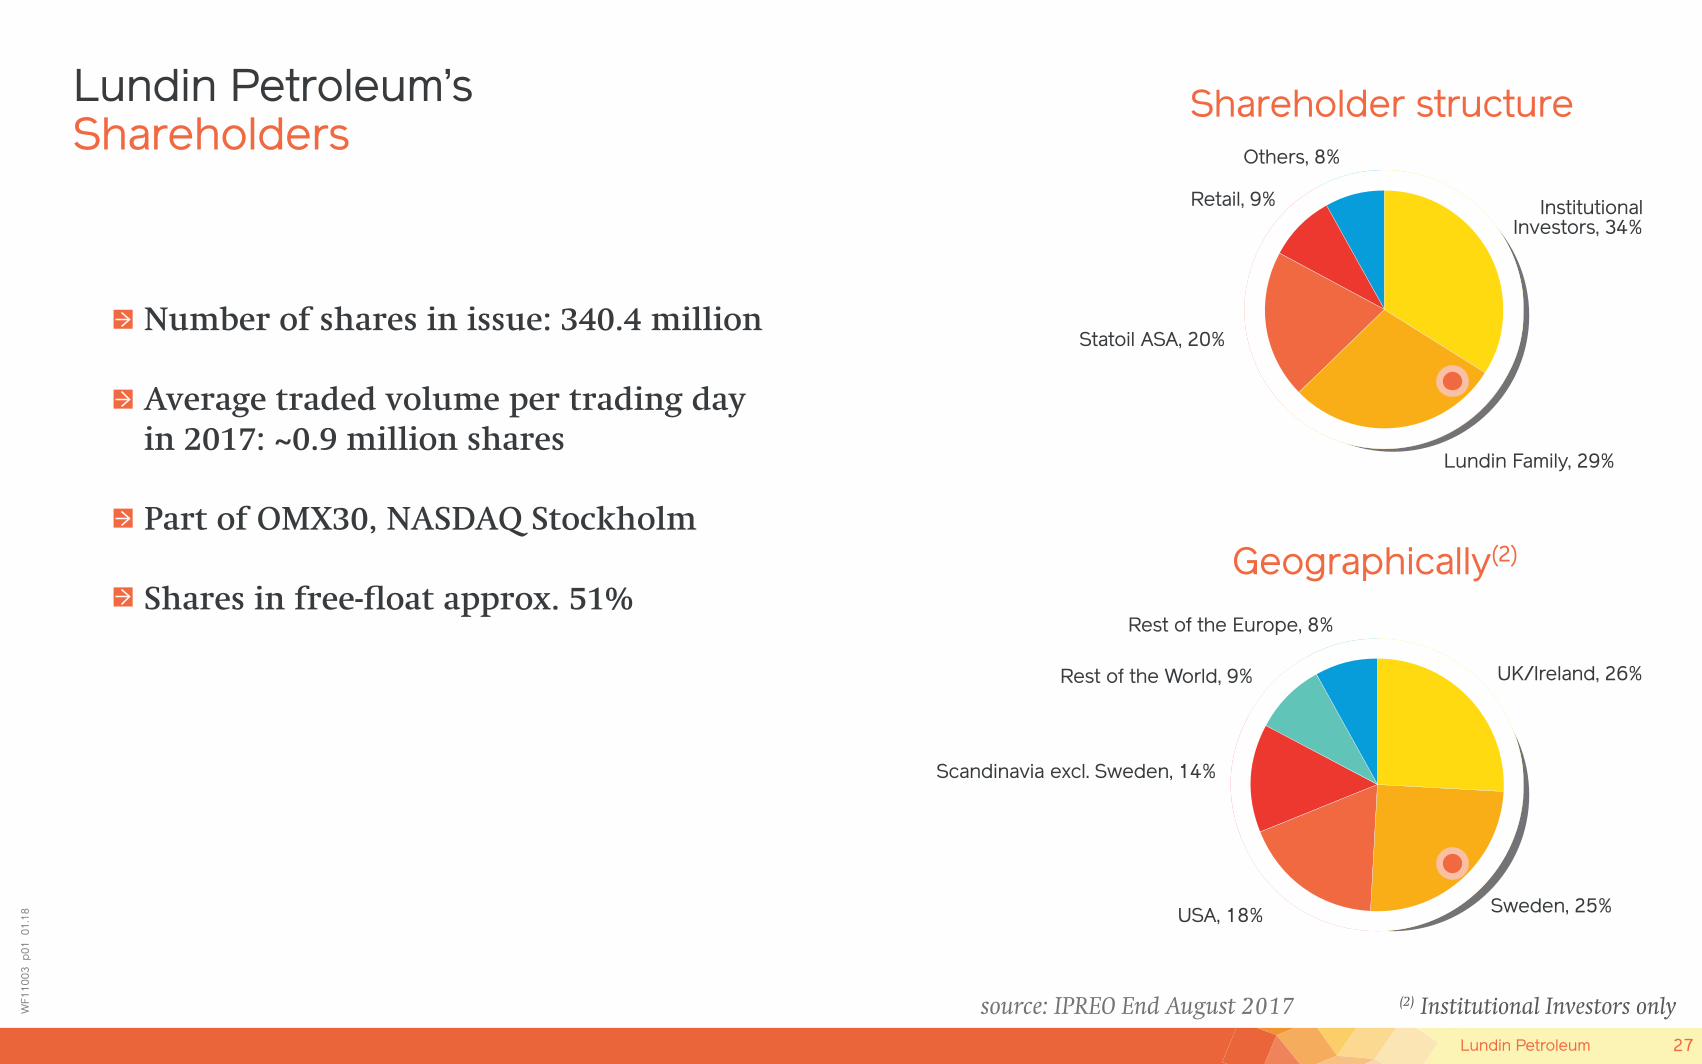
Lundin Petroleum’sShareholders
WF1
1003
p01
01.
18
Number of shares in issue: 340.4 million
Average traded volume per trading day in 2017: ~0.9 million shares (1)
Part of OMX30, NASDAQ Stockholm
Shares in free-float approx. 51%
(2) Institutional Investors onlysource: IPREO End August 2017
InstitutionalInvestors, 34%
Others, 8%
Retail, 9%
Statoil ASA, 20%
Shareholder structure
Lundin Family, 29%
Sweden, 25%USA, 18%
Scandinavia excl. Sweden, 14%
UK/Ireland, 26%Rest of the World, 9%
Rest of the Europe, 8%
Geographically(2)
27Lundin Petroleum
WF8
278
p1
06.
17
Disclaimer
Forward-Looking Statements Certain statements made and information contained herein constitute "forward-looking information" (within the meaning of applicable securities legislation). Such statements and information (together, "forward-looking statements") relate to future events, including the Company's future performance, business prospects or opportunities. Forward-looking statements include, but are not limited to, statements with respect to estimates of reserves and/or resources, future production levels, future capital expenditures and their allocation to exploration and development activities, future drilling and other exploration and development activities. Ultimate recovery of reserves or resources are based on forecasts of future results, estimates of amounts not yet determinable and assumptions of management.
All statements other than statements of historical fact may be forward-looking statements. Statements concerning proven and probable reserves and resource estimates may also be deemed to constitute forward-looking statements and reflect conclusions that are based on certain assumptions that the reserves and resources can be economically exploited. Any statements that express or involve discussions with respect to predictions, expectations, beliefs, plans, projections, objectives, assumptions or future events or performance (often, but not always, using words or phrases such as "seek", "anticipate", "plan", "continue", "estimate", "expect", "may", "will", "project", "predict", "potential", "targeting", "intend", "could", "might", "should", "believe" and similar expressions) are not statements of historical fact and may be "forward-looking statements". Forward-looking statements involve known and unknown risks, uncertainties and other factors that may cause actual results or events to differ materially from those anticipated in such forward-looking statements. No assurance can be given that these expectations and assumptions will prove to be correct and such forward-looking statements should not be relied upon. These statements speak only as on the date of the information and the Company does not intend, and does not assume any obligation, to update these forward-looking statements, except as required by applicable laws. These forward-looking statements involve risks and uncertainties relating to, among other things, operational risks (including exploration and development risks), productions costs, availability of drilling equipment, reliance on key personnel, reserve estimates, health, safety and environmental issues, legal risks and regulatory changes, competition, geopolitical risk, and financial risks. These risks and uncertainties are described in more detail under the heading “Risks and Risk Management” and elsewhere in the Company’s annual report. Readers are cautioned that the foregoing list of risk factors should not be construed as exhaustive. Actual results may differ materially from those expressed or implied by such forward-looking statements. Forward-looking statements are expressly qualified by this cautionary statement.
NP
www.lundin-petroleum.com