land allocation dynamics in china among five top …ageconsearch.umn.edu/bitstream/162539/2/land...
TRANSCRIPT

Land Allocation Dynamics in China among Five Top Staple Crops:
Corn, Soybeans, Wheat, Rice, and Cotton from 1985-2009
Author: Ekaterina Vorotnikova
PhD Candidate
Food and Resource Economics Department
University of Florida
G1120 MCCB
P.O. Box 110240 IFAS
Gainesville, FL 32611-0240
Phone: (352) 575-5248
Email: [email protected]
Co-Author: James Seale, Jr.
Professor
Food and Resource Economics Department
University of Florida
G125 MCCB
P.O. Box 110240 IFAS
Gainesville, FL 32611-0240
Phone: (352) 294-7684
Email: [email protected]
Keywords: agricultural land allocation in China, differential model, Rotterdam, price
responsiveness

Introduction
In 2012 20% of the world’s population live in China (Population Reference Bureau, 2012),
however, the nation’s arable farmland is only 7.8% that of the world’s (FAO, 2012). Amidst population
growth and rising food demand by the people of China in the past 30 years, cultivable land in China has
not kept up with such growth (Ghatak and Seale, 2001). While the trend of decreased crop-specific
growth rates in grains was especially noticeable during 1996-2000 (Zhang, 2003), some crops like corn,
for instance, continued to expand its land share significantly. This interesting dynamic of China’s critical
demand for corn can be traced even in popular press. For example, Kilman and Spegele in the Wall Street
journal article, named “Chinese Hunger for Corn Stretches Farm Belt,” detail China’s struggle to fulfill
fast growing demand for corn (Killman and Spegele, 2011).
The objective of this study is to investigate the dynamics of land allocation in China among five
top staple crops: corn, soybeans, wheat, rice, and cotton in the past 24 years. As of 2009, 90% of all
arable land in China is under cultivation of these crops. Specifically, for this time frame we investigate
how each crop’s relative price changes affect the land share allocation to other staple crops for the above
mentioned five-staple crop “basket.”
Significant policy changes in agriculture occurred in China in 1979-1978 that moved agriculture
away from the government driven commune system to a more market oriented one. Policy changes
included introduction of price reforms and family production responsibility system (Lin, 1992). Although
governmental policy in regards to price levels indirectly continued to prevail until 1993, these changes did
give greater freedom of agricultural production to the farmers by freeing crops from the governmental
control and allowing prices to adjust upwardly (Zhang, 2003). Thus, this study is interesting in the sense
that it can yield evidence to the question of the extent to which farmers have become price responsive to
crops’ price changes when it comes to allocation of land from 1985-2009. This study also fits well within
an important on-going debate about productivity of land in China (Brandt et al. 2002).

Data shows that total arable land in China has expanded slightly from 1985 to 1992, but contacted
rapidly from 1992 to 2009, decreasing in total by 9% from 1985 to 2009 (Figure 1).
Figure 1. Total Arable Land in China 1985-2009
Source: FAOSTAT, 2013
The total land for the five staple crops in China remains relatively steady during these periods
displayed on the secondary axis of Figure 2; however, some crops like corn have experienced a steady
land expansion displayed on the primary axis of Figure 2. Thus, there is a reason to believe that the
expansion of land share of some crops may be happening at the expense of the land of other crops.
106.00
108.00
110.00
112.00
114.00
116.00
118.00
120.00
122.00
124.00
126.00
1985 1987 1989 1991 1993 1995 1997 1999 2001 2003 2005 2007 2009
Mill
ion
Ha

Figure 2. Land under Cultivation of the Five Top Grains 1985-2009
Source: USDA-ERS, 2012
The study is intriguing because it allows to answer two questions: 1) which crops compete the
most for the newly available cultivable land in China and 2) how sensitive acreages of other crops are to
the price changes of the crops whose acreage expand. In this study, a differential land allocation model
determines how crop output prices affect farmer’s land allocation decisions among these crops and by
what magnitude.
Furthermore, since demand for food is inelastic (Seale et al. 2003), prices for the grains that are in
most demand go up more than those of other crops. Production theory suggests that if the output price
of a specific crop increases, land allocated to a particular crop is expected to increase. This
would indicate farmer’s price responsiveness. Figure 3 demonstrate that prices for all crops have
increased steadily, but most significant increase has happened for soybean prices. Thus, for
example, establishing whether high soybean prices result in the expansion of the land dedicated
to soybeans will indicate the degree to which farmers are becoming price-responsive.
0
20
40
60
80
100
120
0
5
10
15
20
25
30
35
40
1985 1987 1989 1991 1993 1995 1997 1999 2001 2003 2005 2007 2009
Tota
l Lan
d, H
ect
are
s (M
illio
n)
He
ctar
es
(Mill
ion
) Corn
Rice
Wheat
Soybeans
Cotton
Total
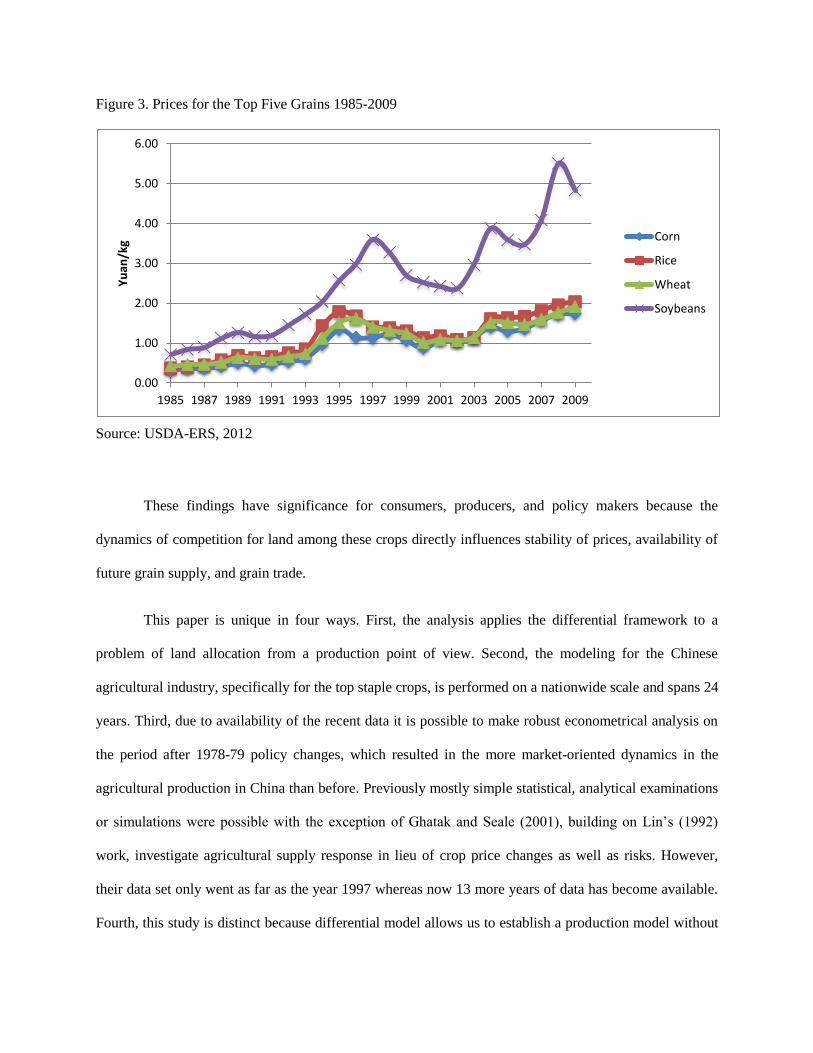
Figure 3. Prices for the Top Five Grains 1985-2009
Source: USDA-ERS, 2012
These findings have significance for consumers, producers, and policy makers because the
dynamics of competition for land among these crops directly influences stability of prices, availability of
future grain supply, and grain trade.
This paper is unique in four ways. First, the analysis applies the differential framework to a
problem of land allocation from a production point of view. Second, the modeling for the Chinese
agricultural industry, specifically for the top staple crops, is performed on a nationwide scale and spans 24
years. Third, due to availability of the recent data it is possible to make robust econometrical analysis on
the period after 1978-79 policy changes, which resulted in the more market-oriented dynamics in the
agricultural production in China than before. Previously mostly simple statistical, analytical examinations
or simulations were possible with the exception of Ghatak and Seale (2001), building on Lin’s (1992)
work, investigate agricultural supply response in lieu of crop price changes as well as risks. However,
their data set only went as far as the year 1997 whereas now 13 more years of data has become available.
Fourth, this study is distinct because differential model allows us to establish a production model without
0.00
1.00
2.00
3.00
4.00
5.00
6.00
1985 1987 1989 1991 1993 1995 1997 1999 2001 2003 2005 2007 2009
Yu
an/k
g Corn
Rice
Wheat
Soybeans

controlling for technological changes occurring during the investigated period such. Differential approach
allows avoiding restrictions on the econometric analysis due to this technological change. Therefore, the
methodological choice of the differential model allows us to accomplish the main goal of the study:
assessing the effect of relative price changes on the farm land allocation over the 24-year study period.
Data
Data span from the year 1985 to 2009 and was obtained from the Economic Research Service
(ERS) at the United States Department of Agriculture (USDA), namely, the ERS China agricultural and
economic database, which is a collection of agricultural-related data from official statistical publications
of the People’s Republic of China. The data set includes the following: national level prices in Yuan,
quantities in kilograms, and acreage in hectares for each of the five crops. Based on acreage data land
shares were also calculated.
Methodology
To find the effect of relative price changes of top crops on land allocation amongst these crops in
China, Rotterdam parameterization of the differential model is used. Originally, differential models are
developed by Barten (1964) and Theil (1965), and later are modified by Theil (1977) for
production theory. This approach is extended to a perfectly competitive multiproduct firm by
Laitenen and Theil (1978), then modified under the assumptions of homotheticity and input
independence of a cost-minimizing firm by Theil (1979). More recently, Vorotnikova, Asci, and
Seale (2013) developed a land allocation model based on the differential approach to producer
theory for the multiproduct firm. We fit a variant of this model to Chinese agricultural data from
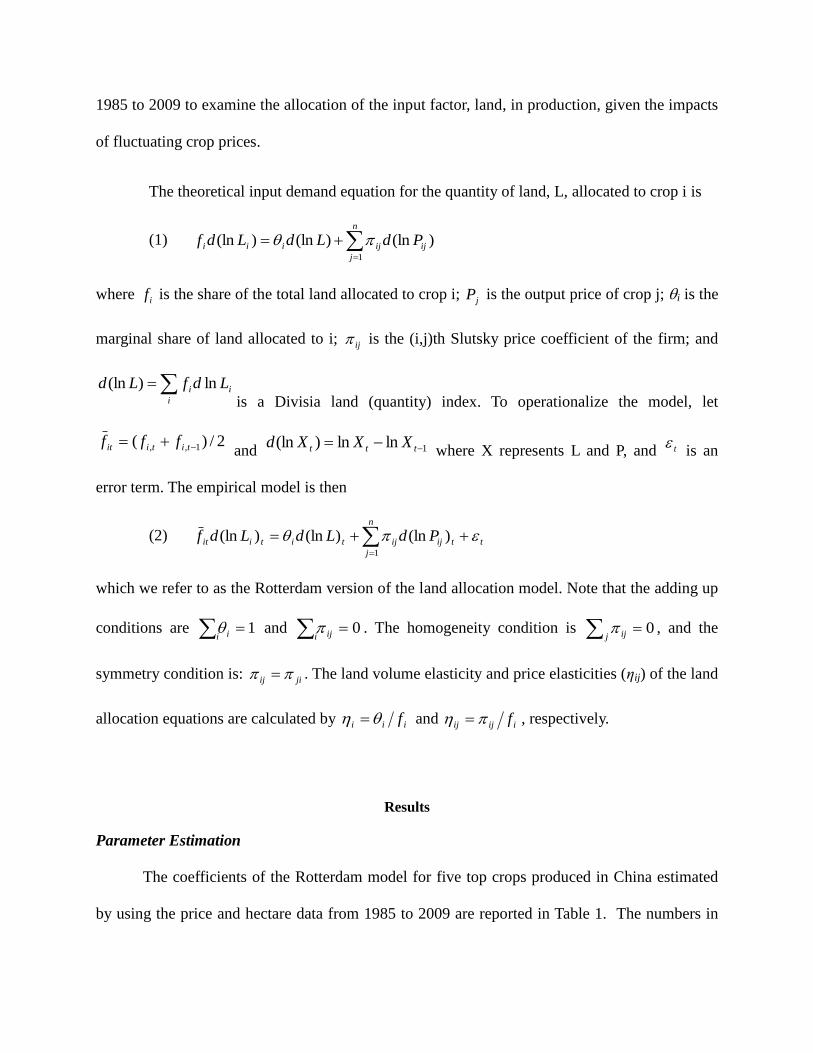
1985 to 2009 to examine the allocation of the input factor, land, in production, given the impacts
of fluctuating crop prices.
The theoretical input demand equation for the quantity of land, L, allocated to crop i is
(1)
n
j
ijijiii PdLdLdf1
)(ln)(ln)(ln
where if is the share of the total land allocated to crop i; jP is the output price of crop j; i is the
marginal share of land allocated to i; ij is the (i,j)th Slutsky price coefficient of the firm; and
i
ii LdfLd ln)(ln
is a Divisia land (quantity) index. To operationalize the model, let
2/)( 1,, titiit fff and 1lnln)(ln ttt XXXd
where X represents L and P, and t is an
error term. The empirical model is then
(2) t
n
j
tijijtitiit PdLdLdf 1
)(ln)(ln)(ln
which we refer to as the Rotterdam version of the land allocation model. Note that the adding up
conditions are i i 1 and
i ij 0 . The homogeneity condition is j ij 0 , and the
symmetry condition is: jiij . The land volume elasticity and price elasticities (ηij) of the land
allocation equations are calculated by iii f and iijij f , respectively.
Results
Parameter Estimation
The coefficients of the Rotterdam model for five top crops produced in China estimated
by using the price and hectare data from 1985 to 2009 are reported in Table 1. The numbers in

the parentheses, below the coefficients, indicate their asymptotic standard errors. Land
elasticities will be presented and discussed further below.
Marginal land shares indicate the change in the quantity of land allocated to crop when
total land increase by one unit. The θi for corn, soybeans, and wheat are positive and significant
at the 0.001 level, but for rice it is negative and significant at 0.05 level. These results suggest
that for one unit increase (decrease) in total land, the hectares of corn, wheat, and soybean
increase (decrease) by 0.46, 0.35, and 0.33 units, respectively, while hectares of rice decrease
(increase) by 0.13 units. Note that corn hectares would increase the most, followed by wheat and
soybeans hectares.
All own-price coefficients are positive as expected for the exception of wheat. However,
wheat’s own price coefficient is not statistically significant. This phenomena can be caused by
several issues, but one of the most probable is the absence of category “other” that can aggregate
other crops produced in smaller quantities than the top five throughout China such as potatoes,
rapeseed, millet, oats, and so on. The top five crops are grown on the 90% of arable land in
China, thus including category that would represent the remaining 10% other would make the
model perform better.
Soybeans and rice own-price coefficients are statistically significant at the 0.01 and 0.001
levels, respectively. These results indicate that land allocation decisions are in part determined by
the output crop prices for these crops. Out of the 15 cross-price coefficients, six are statistically
significant. Corn-wheat, corn-rice, soybean-cotton, rice-cotton are negative and significant at
0.01, 0.01, 0.05, 0.001 levels, which indicates these crops behave as substitutes. Wheat-soybean
and wheat-cotton coefficients are positive and significant at 0.001 level, which suggests that
these crops behave as compliments when it comes to land allocation decision of the farmer.

Table 1: Output Price and Land Coefficients
Output Price Coefficients (πij)
Marginal
Coefficients
(θi) Crop Corn Soybeans Wheat Rice Cotton
Corn
0.011 0.001 -0.014** -0.005** 0.007 0.461***
(0.024) (0.011) (0.005) (0.002) (0.010) (0.095)
Soybeans 0.034** 0.053*** -0.008 -0.012* 0.329***
(0.011) (0.012) (0.008) (0.006) (0.049)
Wheat -0.064 0.0004 0.025** 0.346***
(0.049) (0.009) (0.009) (0.086)
Rice 0.036*** -0.023*** -0.125*
(0.011) (0.007) (0.039)
Cotton 0.003 0.01
(0.009) (0.086)
Note: figures in parenthesis are standard deviations.
* - significant at 0.05 level; ** - significant at 0.01 level; and *** - significant at 0.001 level.
Elasticity Estimation
Land and price elasticities are provided in Table 2. Land elasticities are a measure of how
much the quantity of land changes for each crop when total land increases by 1%. All elasticities
are computed from their respective coefficients at the sample mean for the entire sample. First,
the land elasticities for four out of five crops (i.e., corn, wheat, soybeans, and rice) are
statistically significant at the 0.001 level. The results indicate that if land expands (contracts) by
1%, then the land quantity for corn, wheat, and soybeans goes up (down) respectively by 2.04%,
1.17%, and 0.91%, while land quantity for rice goes down (up) by 1.44%. In summary, the
results show that the quantities of land allocated to corn and wheat are most responsive to
changes in total land. The quantity of rice is also responsive, but expansion in total land
coincides with the decrease in that of rice.
This corresponds well with the dynamics observed in Figure 2. For example, corn and
wheat follow the trend in total land quantity, while soybeans do not follow as closely. Rice goes

in the opposite direction, losing land share when total land increases, which warrants the
negative and significant sign of the land elasticity.
Table 2: Output Price and Land Elasticities
Crops
Crop Prices
Land Corn Soybeans Wheat Rice Cotton
1985-2009
Corn 0.091 -0.05 -0.038** -0.022** 0.023 2.036***
(0.090) (0.048) (0.015) (0.009) (0.034) (0.334)
Soybeans -0.038 0.04 0.133** -0.026 -0.028 0.908***
(0.036) (0.043) (0.043) (0.022) (0.017) (0.144)
Wheat -0.045** 0.148** -0.204 0.028 0.073** 1.167***
(0.017) (0.050) (0.167) (0.149) (0.028) (0.245)
Rice -0.06** -0.094 0.066 0.29** -0.202** -1.443***
(0.023) (0.079) (0.094) (0.105) (0.070) (0.617)
Cotton 0.106 -0.166 0.391** -0.337** 0.006* 0.029
(0.163) (0.102) (0.150) (0.110) (0.159) (1.364)
Note: figures in parenthesis are standard deviations.
* - significant at 0.05 level; ** - significant at 0.01 level; and *** - significant at 0.001 level.
Second, own-price elasticities are displayed along the diagonal in Table 2. They provide a
measure of the responsiveness of land quantity to changes in the own-price of the particular crop.
The own-price elasticities are significant for rice and cotton at the 0.05 level. Own price
elasticity of wheat is negative, but not significant. The results indicate that if the price of rice and
cotton goes up (down) by 1%, the land quantity for these crops goes up (down) by 0.29% and
0.01%, respectively. For the remaining crops, their elasticities are small, positive, and
insignificant indicating the quantity of land allocated to these crops is not own-price responsive.
Third, cross-price elasticities measure the land quantity responsiveness to the price
changes in competing crops. The cross-price elasticities for corn-wheat, corn-rice, and rice-
cotton combinations are negative and statistically significant at the 0.01 level. This indicates that

these crops behave as substitutes to each other in the pair-wise combinations when it comes to
allocation of land already in production. On the other hand, cross-price elasticities of wheat-
cotton and wheat-soybeans combinations are positive and significant at 0.05 level suggesting that
these crops behave as compliments.
Finally, the important aspect of the analysis is that the model allows the comparison of
the price change effect in one crop on the land quantities of another to that of the vice versa
combination. The model identifies which crop price has more influence on hectares of land of the
other in pairwise comparisons. For two crops behaving as substitutes when it comes to land
allocation, the model shows that the order of magnitude in the percent change of land quantity of
the second crop with respect to 1% change in price of the first crop in a two-crop combination.
For example, for a 1% upward (downward) movement in corn price, land allocated to wheat
decreases/increases by 0.045%, but for a 1% price change in wheat, the land share of corn
changes only by 0.038%. This means that corn price has more influence on land allocated to
wheat than wheat price changes on the hectares of corn. In turn, a change in corn price has more
influence on rice hectares than the other way around. If the price of corn increases (decreases) by
1%, corn hectares go down (up) by 0.06% (compared to 0.022% in the reverse case). If the price
of rice goes up (down) by 1%, then the land quantity allocated to sunflower decreases (increases)
by 0.337% (compared to 0.202% in the reverse combination).
Discussion and Conclusions
A schematic diagram in Figure 4 graphically demonstrates the findings of the analysis.
The responsiveness of crop-specific hectares to additional available total land is important. The
model shows that the order of magnitude in percent change relative to 1% change in total land is

1) corn, 2) wheat, 3) soybeans, and 6) rice (with a negative sign). Also, crop hectares’
responsiveness to own prices is important. Responsiveness of each crop to its own price changes
is captured by the own-price elasticity measure. Thus, most price responsive crop-specific
hectares by magnitude are 1) rice, and 2) cotton.
Price effects of each crop onto acreages of other crops are represented by cross-price
elasticities. The dotted lines represent cross-price elasticity for crops behaving as substitutes
when it comes to farmer’s land allocation decision. The solid lines distinguish crops that behave
as compliments. The direction of the lines represents the crop whose price is more influential on
the hectares of the other in a given two-crop combination, and only the highest magnitude of the
two possible elasticities is displayed. For example, corn price changes are more influential on
wheat and rice hectares than the other way around; thus, the direction of the dotted line is from
corn to wheat and rice, respectively, and the corn-wheat price elasticity is displayed instead of
that of wheat-corn. As can be seen from Figure 4, while corn price changes have a significant
influence on rice hectares, in other words corn competes for land with rice, and in turn, rice
competes with cotton. Wheat and soybeans and wheat and cotton combinations behave as
complements when it comes to the land allocation.

Figure 18.7. Elasticities Diagram
Source: The figure is constructed from the elasticities calculated by authors.
Interestingly, these results make sense considering geographical planting overlap of the
competing crops out of these five. For example, while corn is most intensively cultivated in the north-east
of China in such provinces as Jilin, Shandong, Heilognjian, Hubei, Henan, Liaoning, and Inner Mongolia
(in descending order by percentage of land dedicated to corn), the most profitable corn production
provinces are Shandong, Xiajiang, and Inner Mongolia. Wheat is cultivated most intensely on the North
China plain, in provinces like Jiangsu, Hubei, and Shandong, and the last two happen to be major corn
producing provinces as well. Thus, a competition for land between corn and wheat that is suggested by
the results of our study seems to be quite realistic.
Next, rice production is concentrated in the South, specifically, in Yunnan, Guizhou, Jiangsu, and
Sichuan provinces, however, rice is also grown in the Heilognjian, Jilin, and Liaoning provinces (listed in
descending order of production levels). Yet these three provinces significantly overlap with corn
production. It would be interesting to understand whether corn competition for land affects the northern or
southern provinces’ rice production. Unfortunately, the limitation of the study is that the model is not set
up to measure regional effects; however, some recent news might provide an intuition to answer such

question. Apparently, in the recent years, by employing newly emerging innovations, farmers in the south
have made it possible to extend corn production onto previously predominantly rice growing areas, and
corn production has reached all the way to the south into provinces like Yunnan and Guangxi. The choice
to expand corn in to the south instead of increasing it in the north mostly likely have to do with the
national procurement policy, also known as annual delivery quotas. The policy is still, to a smaller degree
than before, in effect for the farming sector, especially for rice and wheat. Thus, even if the farmers prefer
to grow more corn in the already intensely corn cultivating Northeast regions, the quotas skew them to
allocate a certain portion of land to other fine grains such as rice and wheat in order to meet the quota. Yet
in the south region production of rice is high enough, and, therefore, it is possible to introduce corn
without a risk of missing the annual quota.
Next, the results indicate that rice competes for land with cotton, and such results are also
supported by geographical distribution of rice and cotton production. Although, most intensive cotton
cultivating province is Xinjiang, cotton and rice production overlaps in the following provinces: Jiangsu,
Anhui, Hubei, Hunnan, and to a smaller degree in Shandong. It would be interesting to see future studies
with the regional focus that could yield results as to exactly which provinces are seeing the most
competition between these crops.
Overall, the results for corn, wheat, and rice suggest that farmers in China exhibit price
responsive behavior when it comes to land allocation among the these crops even in the face of the
remaining but less persistent national agricultural policies. The only mixed result remains for soybeans.
Despite its rising prices, its acreage remains relatively stable and no competition is observed with any
other crop. The geographical distribution of soybean production supports the study’s result that soybeans
behave as a compliment to wheat. Specifically, soybeans are mostly cultivated in the northeast and in the
central plain of China, province Sinchuan, but wheat is grown mostly in the eastern part of China. What is
surprising is that soybeans production overlaps with that of corn in many northeast provinces, yet a
competition between the two is not observed. In fact, no statistically significant relationship between the
effect of prices of one on the acreage of the other is established by the model: neither competing nor

complimentary. The complimentary behavior of wheat and cotton is less surprising. Even though in some
eastern provinces the production of wheat and cotton overlap, for example, in Shandong and Hunan,
cotton’s most intensive cultivation is in the northwestern province, Xiajiang, and that of wheat being on
the east.
In the further studies, I would like to include a category other, which can include an aggregate of
crops of smaller production like potatoes, various beans, millet, or/and possibly include some of the oil
seeds like rapeseed. Recently updated data would also allow to extend the study to 2012 or 2013 years,
which would make the analysis even more robust.
In conclusion, the study seems to support the idea that in the past 24 years, 1985 to 2009, the
farmers in China have become more price responsive when it comes to land allocation decisions.
However, the extent to which the allocation dynamics are driven by market prices maybe not be yet at full
100%. This suggests that there are still opportunities for China to reach its full potential when it comes to
a fully efficient, market oriented, agriculture.

References
Barten, A.P. (1964). Consumer demand functions under conditions of almost additive
preferences. Econometrica 32, 1–38.
Brandt, L., Huang, J., Li, G., Rozelle, S., 2002. Land rights in China: facts, fictions and issues.
The China Journal 47, 67–100.
Ghatak, S. and Seale, J., 2001. Supply response and risk in Chinese agriculture. The Journal of
Development Studies, 37 (5) (2001), pp. 141–150
FAO Statistical Year Book 2012. Food and Agricultural Organization of the United Nations, 2012
http://faostat3.fao.org/home/index.html#DOWNLOAD Retrieved on 1/12/2013
Killman, S. and B. Spegele, 2011. “Chinese Hunger for Corn Stretches Farm Belt” Wall Street Journal,
available at
http://online.wsj.com/news/articles/SB10001424053111903554904576460300155681760
Accessed on 01/13/2014
Laitenen, K., and Theil, H. (1978). Supply and demand of the multiproduct firm. European
Economic Review 11, 107–154.
Lin, J.F., 1992, “Rural Reforms and Agricultural Growth in China,” American Economic Review 82. Pp.
34-51.
World Population Data Sheet, Population Reference Bureau, 2012
http://www.prb.org/Publications/Datasheets/2012/world-population-data-sheet/data-sheet.aspx
Retrieved on 1/11/2013
Zhang, LX. 2003. “Agricultural and Rural Development in China.” Agricultural Development and the
Opportunities for Aquatic Resources Research in China, WorldFish Center.
Theil, H. (1965). The information approach to demand analysis. Econometrica 33, 67–87.
Theil, H. (1977). The independent inputs of production. Econometrica 45, 1303–1328.

Theil, H. (1979). A differential approach to input-output analysis. Economic Letters 3, 381–385.
Vorotnikova, E., Asci, S., and Seale, Jr., J.L. (2013). Effect of relative price changes of top
principal crops on US farm land allocation. Proceedings of the Southern Agricultural
Economics Association, Orlando, FL.