land use and land cover dynamics in the …
TRANSCRIPT
International Journal of Remote Sensing & Geoscience (IJRSG)
www.ijrsg.com
ISSN No: 2319-3484 Volume 3, Issue 5, Sept. 2014 1
LAND USE AND LAND COVER DYNAMICS IN THE
STUDY AREA OF KALYANDURG, BRAHMASAMUDRAM
AND SETTURU MANDALS OF ANANTAPUR DISTRICT,
AP, INDIA: USING REMOTE SENSING AND GIS
TECHNIQUES
K. Rghuveer Naidu1 R.Nagaraja2 Y.V.Ramanaiah3.
Email:[email protected], Department of Geography, Sri Krishnadevaraya University, Anantapur, Andhra Pradesh-
515003, NRSC, Hyderabad
Abstract The present study area comprising three Mandals Namely
Kalyandurg, Brahmasamudram and Setturu Mandals of
Ananthapur district of Andhra Pradesh. It is located in the
middle of the peninsular region and is confined to southwes-
tern part of Andhra Pradesh and it is located in the drought
prone area of Rayalaseema region; the total geographical area of the study area is 1101.25 Sq Km. The present paper
examines the Land use and Land cover changes from 2000
to 2012 period in the study area of kalyandurg. The land use
pattern in the study area has undergone considerable changes
in the last 12 years i.e. from 2000 to 2012. The land use
Maps for the period April 2000 and the Feb 2012 were pre-
pared based on Resolution merged data of LISS-III and PAN
(2000), LISS-IV and Cartosat-1 (2012).The area under the
built-up land increased from 1468.90 ha (1.33%) to 1510.47
ha (1.37%), 41.57 ha increased, The area under agricultural
crop land slightly decreased from 83617.17 ha (75.93 %) to 83524.32 ha (75.85 %), 92.85 ha increased, Agriculture
Plantation slightly increase from 1274.48 ha. to 1514.69 ha.,
wastelands increased from 14588.53 ha (13.25 %) to
14646.20 ha (13.30 %) 57.67 ha of the area has been de-
creased and water bodies increased from 3297.96 ha (2.99%)
to 3291.66 ha (2.99 %) 6.3 ha of the area has been decreased
from April 2000 to Feb 2012 period.
Key Words: Land Use/Land Cover, Remote Sensing, GIS,
Dynamics, Study Area.
Introduction
Land is the most important natural endowment on
which all the human activities are based. Water and other
resources culminate in the development of land use. A se-
quential development of land use with time results in differ-
ent land utilization patterns and trends. Among the major
resources available in the country, the most important is land
comprising soil, water and associated plant and animals in-volving the total eco-system. The community‟s demand for
food, energy and many other needs has to depend on the
preservation and improvement of the productivity of this
natural resource.
The concept of land use has been defined in various
ways by many geographers. Sauer (1919, p.47) defined land
use as “the use to which the entire land surface is put”.
Stamp (1962,p.426) stated that „the land as a whole must be
so used as to satisfy as many as possible of the needs and
legitimate desires of the people, the nation as a whole”. Vink
(1975, p.1) explained land use as “any kind of permanent or
cyclic human intervention to satisfy human needs, either material or spiritual or both, from the complex of natural or
artificial resources which together are called land….its use is
the result of a continuous field of tension created between
available resources and human needs and acted upon by hu-
man efforts”. The form and function of land use is a human
enterprise, while the development of landscape is the conti-
nuous efforts of man for his needs and sustenance under
every possible combinations of climatic, vegetative and soil
conditions.“Land use data are needed in the analysis of envi-
ronmental processes and problems that must be understood
if living conditions and standards are to be improved or maintained at current levels” ( Anderson et al 1971)
Objectives of the Study
For providing a comprehensive micro-plan to de-
velop land and water resource base of the region, it is imper-ative to gain insights into various aspects of the research
theme. To be more explicit, the present theme includes. To
classify the land use/ cover, for two points of time, namely
2000 and 2012 and evaluate the stock of land resources base
of the region and examine the spatial patterns and differenc-
es and to analyze the dynamics of land use/ cover during the
period of 2000 and 2012.
Study Area
The present Study area of Kalyandurg, consisting
of Kalyandurg, Brahmasamudram and Setturu Mandals of

International Journal of Remote Sensing & Geoscience (IJRSG)
www.ijrsg.com
ISSN No: 2319-3484 Volume 3, Issue 5, Sept. 2014 2
Ananthapur district of Andhra Pradesh, India, Lies between
140 17' and 140 40' North Latitude and 760 50' and 770 24' East Longitude. It is located in the middle of the peninsular
region and is confined to southwestern part of Andhra Pra-
desh. It is bounded by Gummagatta, Beluguppa, Atmakur,
Kanaganapalli and Kambadur Kundurphi mandals of the same district and western side bounded by Karnataka state.
The total geographical area of the study area is 1101.25 Sq
Km. According to 2011 census the total population is 1,
76,297 of which urban population is 32,335 (18 %), with
literacy rate of 60.92 % and the sex ratio of total population
is 964.The Hagiri River flowing in Northern side and Penna
River flowing in Eastern side of the study area of Kalyan-
durg, Bhairavanitippa Reservoir constructed across the Hagi-
ri river in Brahmasamudram Mandal. Soil cover in the study
area is predominantly red loamy soils followed by black
soils and alluvial soils. Natural vegetation is very thin and
scanty and mostly thorn scrub jungle type. The terrain is largely undulating and closely disclosing the characteristic
feature of plateau topography.
Fig.1. Location Map of the Study Area of Kalyandurg in-
cluded Base features.
Database and Methodology In the present study on Application of
Geospatial Technologies likes Remote Sensing and GIS
techniques is vigorous for evaluation of land resources in the
present study Area. ERDAS Imagine 9.6 and Arc GIS 10.1
Software were used for the preparation of all thematic layers
and Maps.
Satellite data: Satellite data is which is available in a raster
form need to be geo-referenced to a map coordinate system
so as to generate spatial information and subsequent use in a
GIS environment. The processes of Ortho rectification in-volves assigning a coordinate system and transform the ras-
ter to the input coordinate system that enable viewing, que-
rying and analyzing the geographic data. For better interpre-
tation, high resolution capability of PAN data and multi-
spectral advantage of LISS-III for 2000 and Cartosat-1 and
LISS-IV data for 2012 were fused using ERDAS imagine
and Bilinear Interpolation resampling algorithm to generate
the merged image. This merged image was used for interpre-
tation/ analysis with a band combination of 3, 2 & 1 on
1:10,000 scales as shown in Fig.2 Fig.2 Different Satellite data used for Land Use and Land
Cover Analysis of the Study Area of Kalyandurg.
Topographic maps: Survey of India Topographic
maps on 1: 50000 scales has been used for preparation of
base features such as Settlements, Transportation, Forest
boundaries Drainage features and other Resource maps. The
drainage, Canal and Water body layers were initially derived
from SOI top sheet and subsequently updated using IRS
FCC data. The study area falls under Survey of India topo
sheet No D43 K14, K15, L2, L3, L6 and L7 of 1: 50,000 scale (latest series).
Land Use Land Cover Interpretation Satellite remote sensing techniques and geotechnic-
al elements such as tone, texture, size, shape, association,
pattern, drainage, erosion etc. are used to map the structure
and dynamics of land use /land cover on 1:10,000 scale.
1. Using the interpretation key prepared, land use
land cover classes have to be delineated by using onscreen
interpretation procedure.
2. Relevant satellite image(s) has to be displayed on
the computer screen at 1:10,000 scales.
3. Shape file has been generated and used for a con-
tinuous interpretation. 4. Onscreen interpretation has to be carried out in a
separate layer (in shape file format) after opening the grid
tiles onto the image. Conventional method of interpretation
in vector format (line format) requires rigorous and time
taking editing to eliminate dangles, label errors etc. Shape
files are easier in use for interpretation and it eliminates the
post interpretation editing work. Further this can be used

International Journal of Remote Sensing & Geoscience (IJRSG)
www.ijrsg.com
ISSN No: 2319-3484 Volume 3, Issue 5, Sept. 2014 3
with most GIS / image processing suites available and it also
complies to OGIS (white paper on shape file) specifications.
5. Land Use / Land Cover class codes has been
used for labeling using the specific codes (Table 1 ) Textual
errors while manually entering in label would require addi-
tional but avoidable effort to rectify them. Preferably, a tool may be a customized GUI having drop down list of the la-
bels which may appear along with text. Such tool may be
incorporated as add-in in to commercial suites available.
6. Integration of layers such as base, village and
watershed has to be carried out.
Ground Truthing: Ground truth/ field verification is
an important component in mapping and its validation exer-
cise. Utmost care and planning is required for collecting
ground data and verification. To facilitate a good ground
truthing exercise the following steps need to be followed:
a. Identify and list all the doubtful areas for the
ground verification and refer all such areas with respect to the top sheet to know their geographical location and acces-
sibility on the ground.
b. Prepare field traverse plan to cover maximum
doubtful areas in the field. Ensure that each traverse covers,
as many land use / land cover classes as possible, apart from
the doubtful areas.
Results and Discussions The spatial distribution of different land Use and
Land Cover for April 2000 and Feb.2012 were interpreted
based on Resolution merged data of Cartosat -1 and LISS IV
(Multispectral) data and shown in figure: 2.
Total 19 land use classes are identified in kalyandurg,
Brahmasamudram and Setturu mandals of the study area, accordingly Level-1 classification 5 classes are identified
namely Built-up Land occupied about 1.33 percent in 2000
and 1.37 percent in 2012, Agricultural lands occupied about
75.93 percent in 2000 75.85 percent in 2012. Forest lands
occupy 6.49 percent in both periods, wastelands occupied
13.33 to 13.35 percent in 2000 and 2012 and water bodies
are also not changed. Different type of land use/cover
classes existing in the area are briefly discussed here in their
dimension over space and time Followed.
It is defined as „an area of human habitation developed due
to intensive non-agricultural use, where much of the land is covered by the infrastructures of residential, transportation,
institutional, Industrial, recreational and other utilities in
association with water, drainage and vegetation punctuated
by vacant lands. The built up land in the study area has been
sub divided into the following sub classes, they are:
a. Built up land-Rural: This is associated with the Village‟s
of the study area. Settlements are low density compared to
urban. It covers about 1245.72 ha. (1.13 %) for April 2000
and it is increased to 1251.46 ha. (1.14 %) in Feb 2012.
0.01% of the area has been increased from 2000 to 2012
period.
Fig.2. Land Use and Land Cover Map of the Study
area of Kalyandurg for 2000 and 2012
Built up land Urban: This is associated with the Kalyan-
durg Town of the study area. Settlements are high density
Compared to rural areas of the study area. It covers about
111.41 ha (0.10 %) in April 2000 and it is increased to
137.29 ha (0.12%) in February, 0.02 % of the area has been
increased from 2000 to 2012 as shown in the figure 3 and 4 (Urban Sprawl map).
Built-up Land-Mine/ Quarry: It is described as an area of
Quarry, it covered about 111.76 ha (0.10 %) in April 2000
and it is increased to 121.72 ha. (0.11%) in February 2012,
0.01 % of the area only increased from 2000 to 2012 period.
Mining area shown in the Fig.5 mine and quarry observed
near Buradkunta village in southern part of Kalyandurg
mandal.

International Journal of Remote Sensing & Geoscience (IJRSG)
www.ijrsg.com
ISSN No: 2319-3484 Volume 3, Issue 5, Sept. 2014 4
Table: 1. Area under different Land Use and Land Cover categories in the Study area-2000-2012
S.No Land Use/ Cover
Category
April-2000
Area
hectares
Area
Percentage
Feb-2012
Area hectares
Area
Percentage
LULC
Changes
Between
2000 to 2012
1 Built-up Land-Rural 1245.72 1.13 1251.46 1.14 +0.01
2 Built-up Land-Urban 111.41 0.10 137.29 0.12 +0.02
3 Built-up Land-Mine/Quarry 111.76 0.10 121.72 0.11 +0.01
4 Single Crop 71572.77 64.99 71395.76 64.83 -0.16
5 Double Crop 10528.90 0.56 10366.28 9.41 -0.15
6 Agricultural Plantation 1274.48 1.16 1514.69 1.38 +0.22
7 Fallow Land 241.03 0.22 247.59 0.22 +0.01
8 Forest-Deciduous (Dry/Moist/Thorn)-Open 1488.91 1.35 1235.66 1.12 0.23
9 Forest-Scrub Forest 4776.08 4.34 5269.14 4.78 +0.45
10 Forest-Forest Blank 887.30 0.81 647.40 0.59 -0.22
11 Wastelands-Barren Rocky/Stony waste 2149.17 1.95 2198.18 2.00 +0.04
12 Wastelands-Dense scrub 498.68 0.45 469 0.43 +0.03
13 Wastelands-Open scrub 6314.05 5.73 6517.94 5.92 +0.19
14 Wastelands-Salt affected land 2094.91 1.90 2042.65 1.85 +0.05
15 Wastelands-Sandy area 2022.26 1.84 2120.94 1.93 +0.09
16 Wastelands-Sandy area-Riverine 1509.45 1.37 1297.49 1.18 -0.19
17 Water bodies Lake/Reservoir/Tank/Pond 2563.60 2.33 2563.58 2.33 -0.002
18 Water bodies-River/Canal/Drain/Creek 734.36 0.67 728.08 0.66 0
Total 110124.84 100 110124.84 100 0
Table.2. Level-1 Classification
Category April-2000
Area
hectares
Area
Percentage
Feb-2012
Area hectares
Area
Percentage
Built-up Land 1468.90 1.33 1510.47 1.37
Agricultural land 83617.17 75.93 83524.32 75.85
Forest land 7152.28 6.49 7152.28 6.49
Wasteland 14588.53 13.25 14646.20 13.30
Water bodies 3297.96 2.99 3291.66 2.99
Total 110124.84 100 110124.84 100

International Journal of Remote Sensing & Geoscience (IJRSG)
www.ijrsg.com
ISSN No: 2319-3484 Volume 3, Issue 5, Sept. 2014 5
Fig.3 Built-up Land Urban (Kalyandurg town) in the Study
Area
Agricultural land: It is described as the land used for produc-
tion of farm commodities, lands used for both food and
commercial crops, irrigated and un-irrigated crops, fallow
lands; plantation crops are included in this category. This
category is sub divided into the following sub classes
Agriculture Land-Single crop: This category comprises of
those lands where the crops such as groundnut, Jower, other
pulses etc. are being cultivated as dry crops in the study area.
Since the imagery belongs to late Rabi season most of the dry crops has been harvested and remains fallow. It covers
71572.77 ha (64.99 %) in April 2000 and it is decreased to
71395.77 ha. (64.83 %) in Feb 2012, only 0.16 % of the area
has been decreased from 2000 to 2012 period.
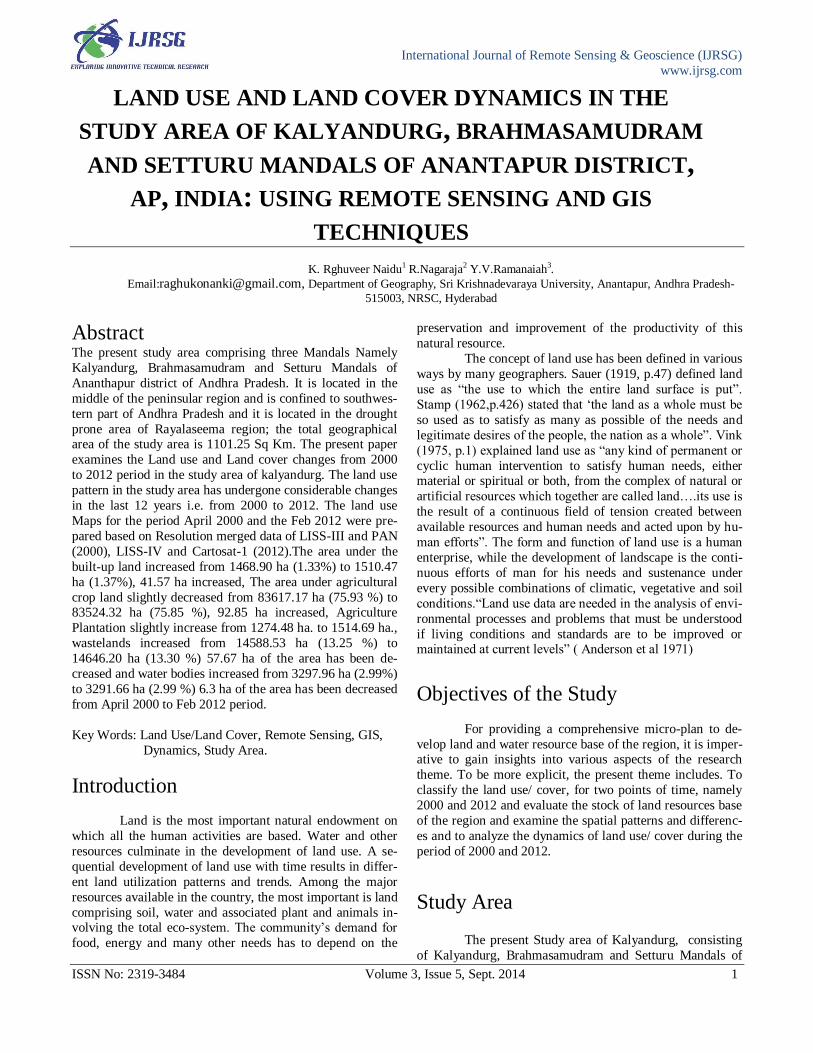
Agricultural Land-Double crop: This category comprises of
those lands with standing crops as on the date of the im-
agery, where the crops are grown by the artificial distribu-
tion and application of water to the land to stimulate, or
make possible. It includes standing cropped areas under re-
servoir (Bhairavanitippa project), tanks, dug wells, bore wells etc. Paddy Ground nut, jower and Ragi are the major
crops and Vegetables, fodder grass are also grown in this
land. It covers 10528.90 ha (9.56%) in April 2000 and it is
decreased to 10366.28 ha. (9.41 %) in Feb 2012, 0.15% of
the area has been decreased from 2000 to 2012 period. The
paddy cultivation at Nagireddy palli area Brahmasamudram
madal is shown in figure 6.
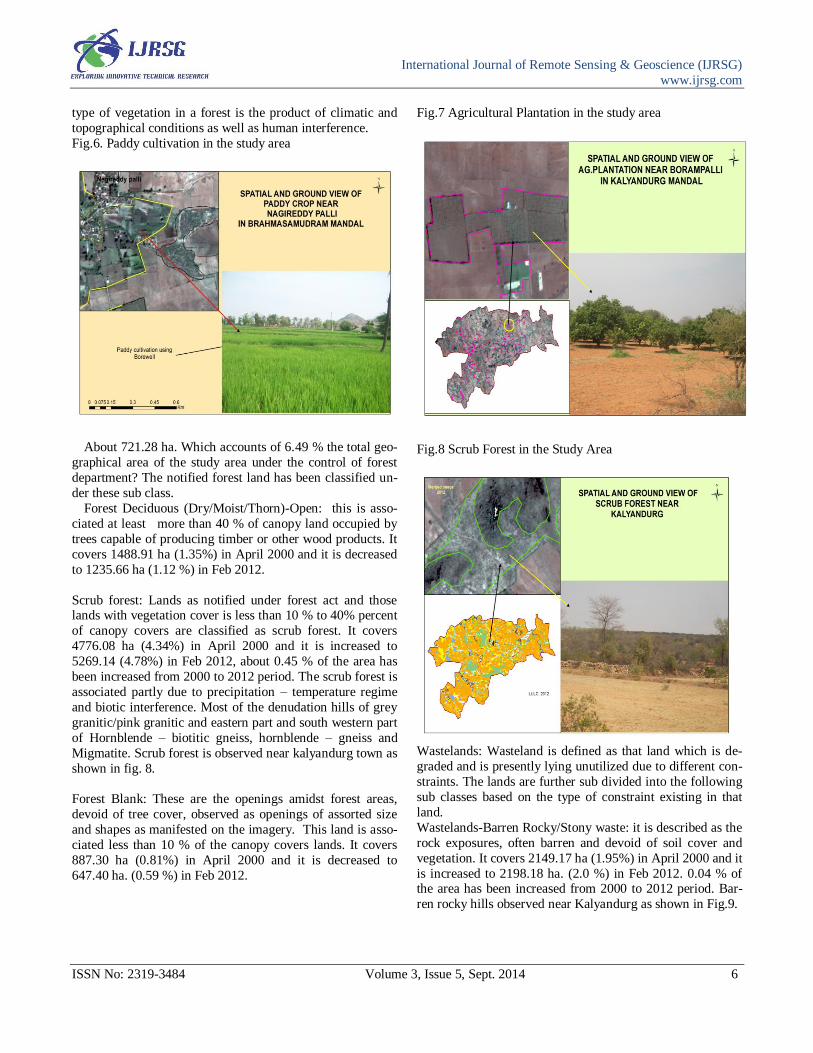
Agricultural Land-Plantation: Lands being used for crops of
longer duration for the purpose of large scale production of
cash crops like Mango, Citrus, Banana, flowers and other plantations. It covers 1274.48 ha (1.16%) in April 2000 and
it is increased to 1514.69 ha (1.38 %) in Feb 2012, from
2000 to 2012 period 02 % of the area has been increased.
Different types of Plantations are observed in the study area
and shown in the fig.7.
Fig.4 Urban sprawl Map of the Kalyandurg town in the
study area.
Fig.5 Mine/Quarry in the study area.
Agricultural Land –Fallow land: These lands are associated
both irrigated and un- irrigated agricultural lands or cropped
areas which are allowed to rest un-cropped for one or more
seasons. It covers 241.03 ha (0.22%) in April 2000 and it is
increased to 247.59 ha. (0.22, only 0.01 % of the area has
been increased from 2000 to 2012 period. Decreasing
Groundwater and dryness of the surface water bodies due to
lack of Rainfall is main caused for increasing fallow land in
the mandals of the study area.
Forest land: The term „forest‟ in India is defined as any land
classified or administered as a forest under any legal enact-ment. Forests form distinct ecosystems and the character and
International Journal of Remote Sensing & Geoscience (IJRSG)
www.ijrsg.com
ISSN No: 2319-3484 Volume 3, Issue 5, Sept. 2014 6
type of vegetation in a forest is the product of climatic and
topographical conditions as well as human interference.
Fig.6. Paddy cultivation in the study area
About 721.28 ha. Which accounts of 6.49 % the total geo-
graphical area of the study area under the control of forest
department? The notified forest land has been classified un-
der these sub class.
Forest Deciduous (Dry/Moist/Thorn)-Open: this is asso-
ciated at least more than 40 % of canopy land occupied by
trees capable of producing timber or other wood products. It
covers 1488.91 ha (1.35%) in April 2000 and it is decreased
to 1235.66 ha (1.12 %) in Feb 2012.
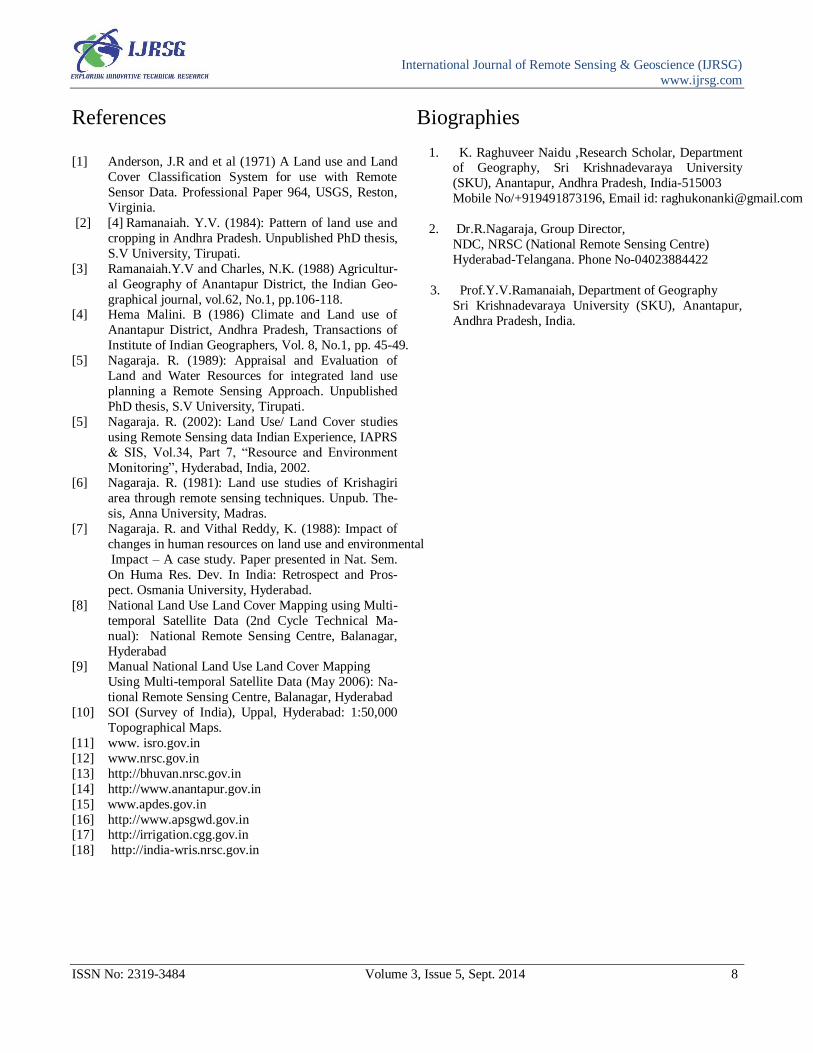
Scrub forest: Lands as notified under forest act and those lands with vegetation cover is less than 10 % to 40% percent
of canopy covers are classified as scrub forest. It covers
4776.08 ha (4.34%) in April 2000 and it is increased to
5269.14 (4.78%) in Feb 2012, about 0.45 % of the area has
been increased from 2000 to 2012 period. The scrub forest is
associated partly due to precipitation – temperature regime
and biotic interference. Most of the denudation hills of grey
granitic/pink granitic and eastern part and south western part
of Hornblende – biotitic gneiss, hornblende – gneiss and
Migmatite. Scrub forest is observed near kalyandurg town as
shown in fig. 8.
Forest Blank: These are the openings amidst forest areas,
devoid of tree cover, observed as openings of assorted size
and shapes as manifested on the imagery. This land is asso-
ciated less than 10 % of the canopy covers lands. It covers
887.30 ha (0.81%) in April 2000 and it is decreased to
647.40 ha. (0.59 %) in Feb 2012.
Fig.7 Agricultural Plantation in the study area
Fig.8 Scrub Forest in the Study Area
Wastelands: Wasteland is defined as that land which is de-
graded and is presently lying unutilized due to different con-
straints. The lands are further sub divided into the following
sub classes based on the type of constraint existing in that
land.
Wastelands-Barren Rocky/Stony waste: it is described as the
rock exposures, often barren and devoid of soil cover and
vegetation. It covers 2149.17 ha (1.95%) in April 2000 and it
is increased to 2198.18 ha. (2.0 %) in Feb 2012. 0.04 % of the area has been increased from 2000 to 2012 period. Bar-
ren rocky hills observed near Kalyandurg as shown in Fig.9.

International Journal of Remote Sensing & Geoscience (IJRSG)
www.ijrsg.com
ISSN No: 2319-3484 Volume 3, Issue 5, Sept. 2014 7
Fig.9 Barren rocky stony waste in the study area.
Wastelands-Open scrub: this is the major wasteland category covering 6314.05 ha (5.73%) in April 2000 and it is
increased to 6517.94 ha (5.92 %) in Feb 2012. 0.19 % of the
area has been increased from 2000 to 2012 period. Kalyan-
durg mandal cover maximum area under this category than
the Brahmasamudram and Setturu mandals.
Wastelands-Dense scrub: this is another wasteland category,
it covers 498.68 ha (0.45%) in April 2000 and it is decreased
to 469 ha. (0.43 %) in Feb 2012.
Wastelands-Salt affected land: the salt affected land is gen-
erally characterized as the land that has adverse effects on
the growth of most of the plants due to the action or pres-
ence of excess soluble or excess exchangeable sodium. It covers 2094.91 ha (1.90%) in April 2000 and it is decreased
to 2042.65 ha (1.85 %). The most salt affected area observed
in along the Hagiri River as shown in Fig 10.
Wastelands-Sandy area: These are the areas that have stabi-
lized accumulation of sand, in coastal, Riverine or inland
areas, that can be either desertic or coastal. It covers 2022.26
ha (1.84%) in April 2000 and it is increased to 2120.94 ha.
(1.93 %) in Feb 2012.
Wastelands-Sandy area-Riverine: Riverine sands are those
that are accumulated in the floodplain of the river as sheets,
or sandbars. It also includes inland sand which was accumu-lated along the abandoned river courses or by reworking of
sand deposits by wind action leading to long stretches of
sand dunes or sand cover areas. It covers 1509.45 ha (1.37
%) in April 2000 and it is decreased to 1297.49 ha.(1.18 %).
Water bodies: This category includes all Reservoirs, Tanks,
Ponds, Rivers, Canals, Drains and Creeks of the study area.
It covers 3297.96 ha (3.0 %) in April 2000 and it is de-
creased to 3291.66 ha. (2.99 %) in Feb 2012.
Fig.10 Salt affected land near Kannepalli in Brahmasamu-
dram mandal.
Conclusion The present analysis shows irrigated and unirrigated crop
land was decreased due to decreasing rainfall, ground water
and Reservoirs storage, Tanks could not full, example Bhai-
ravanithippa project (BT Project). Kalyandurg area is the
most drought prone area of the Rayalaseema region, Hagiri
valley is the second lowest rainfall recorded place in India
after Jaisalmir in Rajasthan.The spatial distribution of differ-
ent land use/cover classes and the changes in land use, both
positive and negative during the 12 years period i.e. 2000
and 2012, were identified and the causes for the same were
also analyzed in this paper. It was noticed that the Agricul-
tural crop land decreased from 83617.17 ha to 83524.32 ha during the 12 years period, Agricultural Plantation has been
increased from 1274.48 ha to 1514.69 ha. Due to decreasing
and uneven distribution of rainfall, farmers shift the crop-
ping pattern towards plantations like Banana, Mango, Sweet
lime and pomegranate using drip irrigation system. Reason
for slight increase in fallow land is some of the farmers of
Kalyandurg area leaves the agricultural crop land and mi-
grated to nearest city Bangalore, Hyderabad and Anantapur
for betterment life, because of low income in the agriculture
field. The area under wasteland has been increased from
14588.53 ha to 14646.20 ha. As per the satellite data about 75 % of the study area under cultivation (both irrigated and
unirrigated). Built-up land urban has been increased from
111.41 ha to 137.29 ha due to fast growing Kalyandurg
town.
International Journal of Remote Sensing & Geoscience (IJRSG)
www.ijrsg.com
ISSN No: 2319-3484 Volume 3, Issue 5, Sept. 2014 8
References
[1] Anderson, J.R and et al (1971) A Land use and Land
Cover Classification System for use with Remote
Sensor Data. Professional Paper 964, USGS, Reston,
Virginia.
[2] [4] Ramanaiah. Y.V. (1984): Pattern of land use and
cropping in Andhra Pradesh. Unpublished PhD thesis,
S.V University, Tirupati.
[3] Ramanaiah.Y.V and Charles, N.K. (1988) Agricultur-
al Geography of Anantapur District, the Indian Geo-
graphical journal, vol.62, No.1, pp.106-118. [4] Hema Malini. B (1986) Climate and Land use of
Anantapur District, Andhra Pradesh, Transactions of
Institute of Indian Geographers, Vol. 8, No.1, pp. 45-49.
[5] Nagaraja. R. (1989): Appraisal and Evaluation of
Land and Water Resources for integrated land use
planning a Remote Sensing Approach. Unpublished
PhD thesis, S.V University, Tirupati.
[5] Nagaraja. R. (2002): Land Use/ Land Cover studies
using Remote Sensing data Indian Experience, IAPRS
& SIS, Vol.34, Part 7, “Resource and Environment
Monitoring”, Hyderabad, India, 2002. [6] Nagaraja. R. (1981): Land use studies of Krishagiri
area through remote sensing techniques. Unpub. The-
sis, Anna University, Madras.
[7] Nagaraja. R. and Vithal Reddy, K. (1988): Impact of
changes in human resources on land use and environmental
Impact – A case study. Paper presented in Nat. Sem.
On Huma Res. Dev. In India: Retrospect and Pros-
pect. Osmania University, Hyderabad.
[8] National Land Use Land Cover Mapping using Multi-
temporal Satellite Data (2nd Cycle Technical Ma-
nual): National Remote Sensing Centre, Balanagar,
Hyderabad [9] Manual National Land Use Land Cover Mapping
Using Multi-temporal Satellite Data (May 2006): Na-
tional Remote Sensing Centre, Balanagar, Hyderabad
[10] SOI (Survey of India), Uppal, Hyderabad: 1:50,000
Topographical Maps.
[11] www. isro.gov.in
[12] www.nrsc.gov.in
[13] http://bhuvan.nrsc.gov.in
[14] http://www.anantapur.gov.in
[15] www.apdes.gov.in
[16] http://www.apsgwd.gov.in [17] http://irrigation.cgg.gov.in
[18] http://india-wris.nrsc.gov.in
Biographies
1. K. Raghuveer Naidu ,Research Scholar, Department of Geography, Sri Krishnadevaraya University
(SKU), Anantapur, Andhra Pradesh, India-515003
Mobile No/+919491873196, Email id: [email protected]
2. Dr.R.Nagaraja, Group Director,
NDC, NRSC (National Remote Sensing Centre)
Hyderabad-Telangana. Phone No-04023884422
3. Prof.Y.V.Ramanaiah, Department of Geography
Sri Krishnadevaraya University (SKU), Anantapur,
Andhra Pradesh, India.