land use and land cover change-induced landscape dynamics
TRANSCRIPT

Original Article 79
Patra, S., Gavsker, K. K. (2021): Land use and land cover change-induced landscape dynamics: a geospatial study of Durgapur Sub-Division, West Bengal (India). AUC Geographica 56(1), 79–94https://doi.org/10.14712/23361980.2021.3© 2021 The Authors. This is an open-access article distributed under the terms of the Creative Commons Attribution License (http://creativecommons.org/licenses/by/4.0).
Land use and land cover change-induced landscape dynamics: a geospatial study of Durgapur Sub-Division, West Bengal (India)Sribas Patra*, Kapil Kumar Gavsker
Ravenshaw University, School of Regional Studies and Earth Sciences, Department of Applied Geography, India* Corresponding author: [email protected]
ABSTRACTThis article examines the factors and process of change in the land use and land cover change-induced landscape dynamics in the Durgapur Sub-Division region of West Bengal in 1989, 2003, and 2018 by employing the satellite imageries of Landsat 5 (1989 and 2003) and Landsat 8 (2018). The images of the study area were categorized into seven specific land use classes with the help of Google Earth Pro. Based on the supervised classification methodology, the change detection analysis identified a significant increase in built-up land from 11% to 23% between 1989 and 2003 and from 23% to 29% in 2003 and 2018. The areas under fallow land and vegetation cover have mainly decreased, while the areas of industrial activities and urbanization expanded during the study period.
KEYWORDSchange detection; geospatial; landscape dynamics; land use and land cover
Received: 18 May 2020Accepted: 6 January 2021Published online: 8 March 2021
80 Sribas Patra, Kapil Kumar Gavsker
1. Introduction
Landscape of a region is subject to modifications and changes caused by various factors and processes occurring thereon. Almo Farina states that “[L]and-scape dynamics involve properties of the landscape, such as stability, persistence, resistance, resilience, and recovery, that operate along a broad range of temporal and spatial scales, such as shifting mosa-ic steady-state, and equilibrium spatial properties” (Oxford Bibliographies 2017). Studying earth’s sur-face and environment has been one of the central themes of geographical research. Dynamics in land-scape indicate to the fact that any land is not static forever; rather it is changeable at different scale and pace. Similarly, surface of the earth has been changing since its origin. Various types of external and inter-nal factors play their role in such a change. The land-scapes include the numerous features on the earth like forest land, water bodies, built-upland (all type of settlements, roads etc.), agricultural lands etc.
Land use and land cover are two separate terminol-ogies which are often used interchangeably (Dimyati et al. 1996). In particular, land use and land cover (LULC) changes in tropical regions are of major concern due to the widespread and rapid changes in the distribution and characteristics of tropical forests (Myers 1993; Houghton 1994). However, changes in land cover and in the way people use the land have become recog-nized over the last 15 years as important global envi-ronmental changes in their own right (Turner 2002).
Recent research on land use and land cover change detection has drawn attention of many researchers (Liang et al. 2002; Ayele et al. 2016). Change detection has emerged as a significant process in managing and monitoring natural resources and urban development mainly due to provision of quantitative analysis of the spatial distribution of the population of interest. There are a lot of available techniques that serve pur-pose of detecting and recording differences and might also be attributable to change (Singh 1989; Yuan et al. 1999).
The land use and land cover changes play an important role in the study and analysis of glob-al changed scenario today as the data available on such changes is essential for providing critical input
to decision-making of ecological management and environmental planning for future (Zhao et al. 2004; Dwivedi et al. 2005; Erle and Pontius 2007; Fan et al. 2007). The accurate and timely land use and land cov-er maps derived from remotely sensed images are the keys for monitoring and quantifying various aspects of global and local climate changes, hydrology, biodi-versity conservation, and air pollution (Sellers et al. 1995; Bonan 2008; Butchart et al. 2010; Schröter et al. 2010). Remote Sensing (RS) and Geographic Infor-mation System (GIS) are now providing new tools for advanced ecosystem management. The collection of remotely sensed data facilitates the synoptic analyses of Earth – system function, patterning, and change at local, regional and global scales over time; such data also provide an important link between intensive, localized ecological research and regional, national and international conservation and management of biological diversity (Wilkie and Finn 1996).
2. Objectives
The present study addresses the following major objectives: i) To study land use and land cover chang-es and their impact on landscape dynamics in the Dur-gapur Sub-Division by comparing three-time period of year 1989, 2003, and 2018; and ii) To examine and detect factors of change of land use and land cover during study period and resulting conditions in the Durgapur Sub-Division.
3. Study Area
The study area of Durgapur Sub-Division lies in the eastern part of the Paschim Barddhaman District of West Bengal (shown in Figure 1). It is lies between 23°26′ N to 23°48′ N and 87°8′ E to 87°32′ E. The area of Durgapur Sub-Division is 771.28 km2. The total population of the region is 1,209,372 as per the Cen-sus of India 2011. In this area the major city is Dur-gapur. This is an industrial city of eastern India and the second planned city (1955) of India after Chan-digarh. It consists of four Community Development Blocks: Durgapur–Faridpur; Kanksa; Andal; and
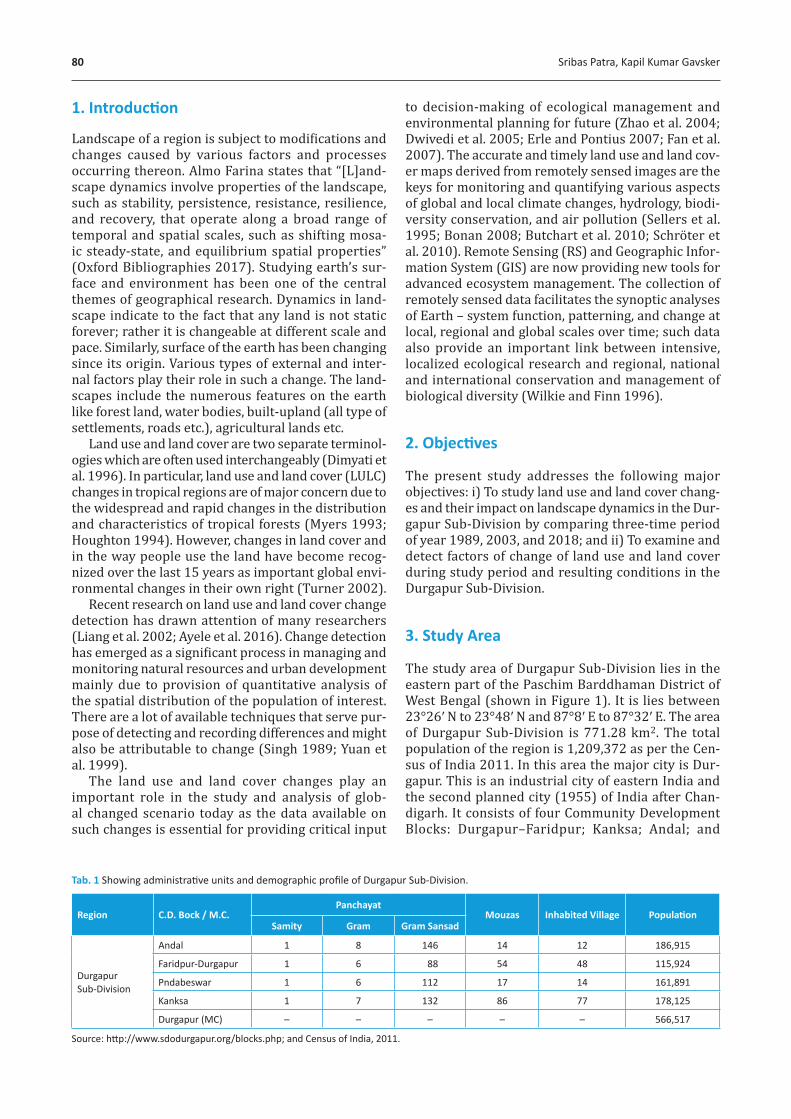
Tab. 1 Showing administrative units and demographic profile of Durgapur Sub-Division.
Region C.D. Bock / M.C.Panchayat
Mouzas Inhabited Village PopulationSamity Gram Gram Sansad
Durgapur Sub-Division
Andal 1 8 146 14 12 186,915
Faridpur-Durgapur 1 6 88 54 48 115,924
Pndabeswar 1 6 112 17 14 161,891
Kanksa 1 7 132 86 77 178,125
Durgapur (MC) – – – – – 566,517
Source: http://www.sdodurgapur.org/blocks.php; and Census of India, 2011.

Land use and land cover change-induced landscape dynamics 81
Fig 1 Location map of the study area.
Pandabeswar and a Durgapur Municipal Corporation as shown in the Table 1. In Durgapur Subdivision, Durgapur Municipal Corporation is the only statutory urban area that comes within the ambit of the Asan-sol-Durgapur Planning Area (ADPA).
4. Material and Methods
The present study is based on a secondary source of database. The research database here involves the use of various methods, techniques and tools for the study of land use and land cover to make a wider sense of landscape dynamics of the region. Geographic Infor-mation System and Remote Sensing tools are used to collect, organize and analyze the spatial data. Remote Sensing has greatly opened new vistas in deriving factual information on natural and human resources by virtue of its synoptic overview, multi-spectral and multi-temporal coverage of the earth’s surface. The Table 2 and Table 3 show the types of data, sources,
satellite imageries and data sensors used in the pres-ent research.
The matter of the fact is that remote sensing plat-forms is a system used for collecting and analyzing space features. It includes space-borne (satellite imagery), air-borne (aerial photographs, thermal, radar images, etc.) and ground-based techniques as tools for the location and identification of the
Tab. 2 Showing data types and sources for the study.
Category Data type Data source Time period
Seco
ndar
y Spati
al Satellite data USGS 1989, 2003, 2018
Administrativemap
Durgapur Sub-division website 2018
Attrib
ute
Statistical
District Census Handbook, A-series – General Population Table
2011
Source: Prepared by the authors, 2019.

82 Sribas Patra, Kapil Kumar Gavsker
biological, ecological and cultural characteristics of various features of the earth surface. In order to iden-tify the spatial pattern and the rate of change, it all requires data analysis over a considerable time period or of sometime junctures. For data analysis purpose the important software and tools used in the study include ARC-GIS and ERDAS imagine 14. The ARC-GIS software is used to complement the display and processing of the acquired data. The ERDAS Imagine 14 is used for ‘image processing’ (layer stack, subset, classification) purpose. For verification and accura-cy purposes of satellite images used in the research, the Google Earth system also has been very useful in the present study. Through this, images are used for location identification and classification. The method adopted in the present study for a detailed analysis of the land use and its mapping is given in the flow chart as shown in Figure 2. The methodology of the present study comprises the use of Landsat-5 (TM), Landsat-8 (OLI-TIRS) data from USGS (The United States Geological Survey, https://earthexplorer.usgs .gov). Here supervised classification method is used with maximum likelihood algorithm for Operation Image Classification. In the supervised classification approach, select groups of training pixels are adopt-ed to represent seven land use and land cover units of the study area. Supervised classification is more or
less controlled by the analyst. In this process, the ana-lyst selects training pixels that are representative of the desired land use classes. In the present study, for each class around 40 training samples are taken into account. SPSS 22 is also used for analysis particularly Pearson’s product-moment correlation coefficient (r) and Multiple Linear Regression to understand the relationship among the classes.
= (∑ ) (∑ )(∑ )[ ∑ (∑ ) ][ ∑ (∑ ) ]
(1)
yi = β0 + β1xi1 + β2xi2 + … +βpxip + ϵ (2)
where, for i = n observations,yi = dependent variable,xi = expanatory variables,β0 = y-intercept (constant term),βp = slope coefficients for each explanatory
variable,ϵ = the model’s error term (also known as the
residuals).
The description of classified seven land use and land cover categories and their properties are provid-ed in the below given Table 4. It provides a features description of the concerned classes.
The interpretation keys are chosen based on the classification of Landsat-5 and Landsat-8 images. Bhatta notes that “the criterion for identification of an object with interpretation elements is called an interpretation key” (Bhatta 2011). The seven major land use and land cover classes identified; the inter-pretation keys used for them are mentioned below in the Table 5.
Tab. 3 Showing satellites and sensors data acquired for the present study.
Sl. No Satellite Sensor Date
1 LANDSAT 5 Thematic Mapper (TM) Dec 17, 1989
2 LANNDSAT 5 TM Nov 15, 2003
3 LANDSAT 8 OLI-TIRS Nov 18, 2018
Source: Prepared by the authors, 2019.
Tab. 4 Land use and land cover classes of Durgapur Sub-Division.
Land use / Land cover classes
Features description (Based on National Remote Sensing Centre, India, 2019)
1. Built-up Land
Residential, Commercial and services, Industrial, Transportation, Communication and Utilities, Mining – Active, Mining – Abandoned, Quarry.
2. Crop LandThese are the areas with standing crop as on the date of Satellite overpass. Such as Cultivated Land, Plantation, Garden.
3. Fallow Land Without Crop Land which are taken up for cultivation but are temporarily allowed to rest.
4. VegetationDeciduous Forest Land, rivers in the buildings, in the agricultural fields and gardens, Mixed Forest Land, Shrubs vegetation along the roads.
5. Barren Land Gullied, Ravinous, Barren Rocky/Stony Waste
6. Water Bodies River/Stream/Canals, Ponds, Reservoirs
7. Sandy Areas
Riverine or inland areas. Riverine sands are those that are seen as accumulations in the flood plain as sheets which are the resultant.Due to river flooding.
Source: Prepared by the authors, 2019.
Collection of Data
Geo-referencing
Projected
Scan Map of DSD
Subset
Satellite Imageryof Landsat (1989,2003 and 2018)
Layer Stack
Selection of Training Sample
Supervised Classi�ication
LULC Map 1989, 2003 & 2018
Final Production of LULC Maps of (1989, 2003 & 2018)
Validation through Google Earth Pro
Spatio-temporal Pattern and Change Analysis
Fig. 2 Flowchart of methodology. Source: Prepared by the authors.

Land use and land cover change-induced landscape dynamics 83
Tab. 5 Showing interpretation keys for the study region.
Land use / Land cover classes
Characteristics of False Color Composite (FCC) of Landsat-5 Landsat-8
1. Built-up Land Bluish
2. Cropland Dull red and smooth appearance
3. Fallow Land Grey with smooth texture
4. Vegetation Dark red with rough texture, Dull red to Pinkish
5. Barren Land Bluish/greenish grey with smooth texture and yellowish
6. Water Bodies Dark blue to light blue, accordingly depth
7. Sandy Area White with smooth texture
Source: Prepared by the authors, 2019 (Based on Document Control Sheet, NRSC, India).
Fig. 3 Land use and land cover maps showing Built-up Land (A) 1989, (B) 2003, (C) 2018.
5. Results and Discussion
The study reveals that area is largely agrarian in char-acter except few urban centers and industrial clusters located in the Durgapur Sub-Division. There has been accelerated spatial change under two prominent land uses i.e. built-up land and cropland. This pinpoints to the fact that the region being agriculturally prom-inent, the cropland has increased drastically more than the built-up area in the region. Therefore, spatial changes including surface organization of the land use and land cover and their inter-relationship with a focus on direction and spread are well explained.

84 Sribas Patra, Kapil Kumar Gavsker
(i) Built-up land. It is covered 87.2302 km2, which constituted 11% of the total geographical area in the year 1989. What is importantly observed is that most of the built-up land area is found in the South Cen-tral and West, South–West portions in Figure 3. In the year 2003, in a span of fourteen years, the built-up land covered 174.5542 km2 which accounted for 23% of the total area. During this period major built-up land areas are Durgapur Municipal Corporation, Andal, and Pandabeswar mining clusters. By the year 2018, the built-up area further grew to 221.4387 km2 accounting for 29% of the total area of the region (Table 6). During this phase, major concentrations
are found in South Central and Western portions of the Sub-Division.
(ii) Crop Land. As seen from classification image cropland is found to be a dominant land use class in the area. It covered 203.3873 km2 constituting 27% of the total area in 1989. Cropland covered 189.2033 km2 constituting 24% of the total geograph-ical area in 2003 (Table 6). Rice, wheat, vegetables, etc. are the main crops of the region. By 2018 the cropland is found to increase to 36% of the area. The cropland is seen all over the region, mostly in Central and Northern, South-East parts. There is the pres-ence of a canal system in the Southern portion and along the Southern boundary flow the Damodar River
Fig. 4 Land use and land cover maps showing Crop Land (A) 1989, (B) 2003, (C) 2018 in Durgapur Sub-Division, West Bengal.

Land use and land cover change-induced landscape dynamics 85
Tab. 6 Showing area profile of different land use and land cover of the study region.
Sl. NoLand use / Land cover classes
1989 2003 2018
Area (km2) % Area (km2) % Area (km2) %
1 Built-up Land 87.2302 11 174.5547 23 221.4387 29
2 Crop Land 203.3870 27 189.2033 24 273.6386 36
3 Fallow Land 185.3955 24 195.9534 25 95.6295 12
4 Vegetation 207.3816 27 162.6660 21 119.0188 15
5 Barren Land 61.3674 8 27.9828 4 29.4435 4
6 Water Bodies 16.8129 2 15.6402 2 13.8159 2
7 Sandy Area 9.7254 1 5.3001 1 18.3150 2
Total 771.30 100 771.30 100 771.30 100
Source: Prepared by the authors, 2019 (Based on satellite imageries).
Fig. 5 Land use and land cover maps showing Fallow Land (A) 1989, (B) 2003, (C) 2018 in Durgapur Sub-Division, West Bengal.

86 Sribas Patra, Kapil Kumar Gavsker
which is the major source of irrigation in the region (Figure 4).
(iii) Fallow Land. In Durgapur Sub-Division the ‘fallow land’ is the area that is without any crops and it is mostly open land. It covered 185.3955 km2 which accounted for 24% of the total area in the year 1989 and in 2003 it grew to 195.9534 km2 accounting for 25% of the total geographical area. By 2018, the fal-low land has decreased to 95.6295 km2 area which is 12% of the total geographical area (Table 6). This sharp decline in the area is mainly observed in the middle portions along with agricultural land and
near the northern ends. Some patches are also seen in South-East, North-East parts, Western parts, and few dense patches are seen in the South- West, Cen-tral parts of the region (Figure 5).
(iv) Vegetation. Dense vegetation can be observed in the East, North-East, South-East parts of the region. Some patches of forest cover seen in the Cen-tral and North-West parts. The vegetation area was 207.3816 km2 constituting 27% of the total area in 1989. In 2003, this was 162.666 km2 which is 21% of the total geographical area. It is mainly found in North-East, East Central and some patches of North-West
Fig. 6 Land use and land cover maps showing Vegetation Cover (A) 1989, (B) 2003, (C) 2018 in Durgapur Sub-Division, West Bengal.

Land use and land cover change-induced landscape dynamics 87
and southern parts. By 2018 the vegetation cover is seen in North-East and Eastern parts of the regions where many plantation sectors coming along the riv-er and in Durgapur Municipal Corporation. Now this covers 119.0188 km2 areas which are 15% of the total geographical area (Figure 6).
(v) Barren Land. It is found in the Central and the North-Western parts of the region. Some patches are seen in the North-East portion of the study area. The area included in this category was reported about 61.3674 km2 which accounted for 8% of the total area of the region in 1989. In the year 2003, the Barren
Land covered 27.9828 km2 of the region which is half of that found in 1989. 2018, this land-use covers 4% of the total geographical area and largely found in the Central parts and rest is fragmented all over the region (Figure 7).
(vi) Water Bodies-In the study area water bodies mainly consists of rivers, canals, reservoirs, ponds, tanks, etc. Two major rivers flow in the region: one is on the northern side the Ajoy and the other is the Damodar towards the southern boundary. A canal is seen in the southeastern region. Many tanks and ponds are also found in the region (Figure 8). In 1989, the
Fig. 7 Land use and land cover maps showing Barren Land (A) 1989, (B) 2003, (C) 2018 in Durgapur Sub-Division, West Bengal.

88 Sribas Patra, Kapil Kumar Gavsker
Fig. 8 Land use and land cover maps showing Water Bodies and Sandy Areas (A) 1989, (B) 2003, (C) 2018 in Durgapur Sub-Division, West Bengal.
area included in this category was 16.8129 km2 which accounts for 2% of the total area and 15.6402 km2, in 2003 and 13.8159 km2 in 2018.
(vii) Sandy Area. Sandy area is mostly found in the northern side in the Ajoy river flood plain. Some patches are found in southern parts of the Damo-dar river basis. In 1989 sandy area consisted of 9.7254 km2 area which was 1% of the total area. In 2003, the water bodies covered about 15.6402 km2 area accounting for 2% of the total geographical area and sandy area 5.3001 km2 which is 1% of the total geographical area. In 2018, the water bodies covered 13.8159 km2 of the area of the region accounting for
2% and the sandy area was 18.3150 km2 with 2% of the total geographical area of the Durgapur Sub-Di-vision region (Table 6). By 2018 the sandy area is mostly seen in the northern region along the bank of the Ajay River. Few dense patches are also seen in the Southern region along the bank of the Damodar River (Figure 8).
Pearson’s Product Moment Correlation coeffi-cient (r) technique is applied here to exhibit the asso-ciation among the Land use/Land cover classes. The value of ‘r’ lies between ±1. A value of r = +1.0 indicates a perfectly direct or perfectly positive correlation, and a value of r = −1.0 indicates a perfectly inverse

Land use and land cover change-induced landscape dynamics 89
Tab. 7 Showing correlation coefficient (r) among the classified land use and land cover types of the Durgapur Sub-Division.
Pearson Product Moment Correlation Coefficient
Land use/Land cover classes Built-up Land Crop Land Fallow Land Vegetation Barren Land Water Bodies Sandy Area
Built-up Land
Pearson Correlation 1.000 .657 −.703 −.986 −.925 −.956 .509
Sig. (2-tailed) .543 .504 .105 .248 .189 .660
Crop LandPearson Correlation .657 1.000 −.998* −.772 −.322 −.849 .983
Sig. (2-tailed) .543 .039 .438 .792 .354 .117
Fallow Land
Pearson Correlation −.703 −.998* 1.000 .810 .379 .880 −.970
Sig. (2-tailed) .504 .039 .399 .752 .315 .156
VegetationPearson Correlation −.986 −.772 .810 1.000 .850 .991 −.644
Sig. (2-tailed) .105 .438 .399 .354 .084 .555
Barren Land
Pearson Correlation −.925 −.322 .379 .850 1.000 .773 −.143
Sig. (2-tailed) .248 .792 .752 .354 .437 .908
Water Bodies
Pearson Correlation −.956 −.849 .880 .991 .773 1.000 −.739
Sig. (2-tailed) .189 .354 .315 .084 .437 .471
Sandy Area
Pearson Correlation .509 .983 −.970 −.644 −.143 −.739 1.000
Sig. (2-tailed) .660 .117 .156 .555 .908 .471
* Correlation is significant at the 0.05 level (2-tailed). Source: Calculated by the authors.
or perfectly negative correlation (Sarkar 2015). The Table 7indicates the positive and negative relation-ship among the LU/LC classes of the study period. It reveals that Built-up Land positively associated with the Crop Land and Sandy Area. The calculated value of these two classes is 0.657 and 0.509 respectively, on the other hand, a strong negative relationship with the vegetation and Barren land. The calculated value of these two classes is −0.986 and −0.925 respectively (Table 7)
5.1 Surface Change Detection
Change detection techniques for various studies have been reviewed by many researchers. Remote Sensing and Geographical Information System (GIS) based change detection (by using digital satellite imageries) is the process that helps in determining the change associated with land use and land cover properties with reference to geo-referenced multi-temporal data (Jensen 1996). From a policy and planning perspec-tive, change detection in such cases helps in enhanc-ing the capacity of local governments to implement sound environmental management practices (Prenzel and Treitz 2004).
Multiple linear regression (MLR), also known sim-ply as multiple regression, is a statistical technique that uses several explanatory variables to predict the outcome of a response variable. The goal of multiple linear regressions (Table 8) is to model the linear
relationship between the explanatory (independent) variables and response (dependent) variable (Kenton 2019). Table 8 shows the linear relationship among the land use and land cover classes of the study region.
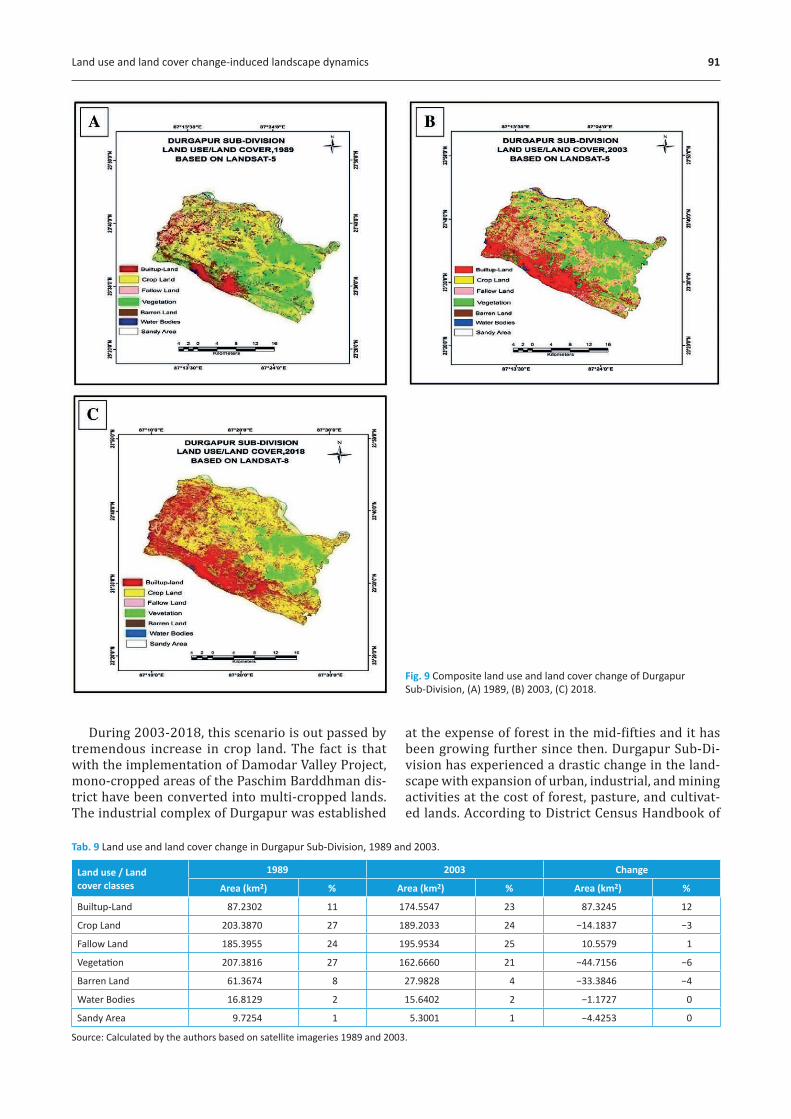
(i) Land use and land cover change: 1989 and 2003Table 9 shows the land use and land cover change dur-ing 1989 and 2003 under different classes. The com-posite land use and land cover of Durgapur Sub-Divi-sion are shown in Figure 9. The imagery which was taken from the Landsat-5 on Dec 17, 1989 (USGS), showed that the built-up land was 87.2302 km2 accounting for 11% of the total geographical area. But the imagery captured on Nov 15, 2003 (USGS) showed the built-up area increased to 174.5542 km2. This con-stitutes 23% of the total geographical area. The total change between the two time periods is 87.3240 km2 and the percentage increase is 12%. This considera-ble change happened due to an increase in the mining area at Andal and Pandabeswar Block.
Above Maps depict spatial change with respect to different classes’ categories of land use and land cover during 1989–2003. Higher change is wit-nessed under the built-up area which has registered a 12% increase in the discussed period. This may be associated with a decrease in cropland (−3%), vegetation (−6%) and barren land (−4%) in Table 9. Classified imagery showed that it is clear that there is growing more in urban and followed by rural set-tlements in the region. The new settlement is set up

90 Sribas Patra, Kapil Kumar Gavsker
Tab. 8 Multiple linear regression model.
Multiple linear regression model
R2Adjusted R square
Standard error of estimate
FStandardized
Coefficients (Beta)t-value
sig (p-value)
Buit-up Land (x1)
x2 0.432 −0.135 72.57956 0.76100 0.657 0.873 0.543
x3 0.494 −0.13 68.54350 0.97500 −0.703 −0.987 0.504
x4 0.973 0.946 15.84690 35.94800 −0.986 −5.996 0.105
x5 0.855 0.711 36.62812 5.91600 −0.925 −2.432 0.248
x6 0.914 0.829 28.20084 10.66700 −0.956 −3.266 0.189
x7 0.259 −0.482 82.91339 0.35000 0.509 0.591 0.660
Crop Land (x2)
x3 0.996 0.992 3.93607 262.90600 −0.998 −16.214 0.039
x4 0.597 0.193 40.60682 1.48000 −0.772 −1.216 0.438
x5 0.103 −0.793 60.54609 0.11500 −0.322 −0.340 0.792
x6 0.721 0.442 33.76055 2.58700 −0.849 −1.608 0.354
x7 0.967 0.993 11.66295 29.05800 0.983 5.391 0.117
Fallow Land (x3)
x4 0.656 0.313 45.70929 1.90900 0.810 1.382 0.399
x5 0.144 −0.721 72.13830 0.16800 0.379 0.410 0.752
x6 0.775 0.549 37.60922 3.43800 0.880 1.854 0.315
x7 0.941 0.882 18.91180 15.99400 −0.970 −3.999 0.156
Vegetation (x4)
x5 0.722 0.440 32.94319 2.59700 0.850 1.612 0.540
x6 0.983 0.965 8.21481 56.85400 0.991 7.540 0.084
x7 0.414 −0.171 47.81855 47.81855 −0.644 −0.841 0.555
Barren Land (x5)
x6 0.598 0.195 16.92628 1.48500 0.773 1.219 0.437
x7 0.210 −0.956 26.40610 0.02100 −0.143 −0.145 0.908
Water Bodies (x6)
x7 0.546 0.091 1.43962 1.20100 −0.739 −1.096 0.471
x1 = Built-Up Land, x2 = Crop Land, x3 = Fallow Land, x4 = Vegetation, x5= Barren Land, x6 = Water Bodies, x7= Sandy Area Source: Calculated by the authors.
in the Durgapur Municipal limits and beyond and around the Andal town area that is identified from the classified imagery. In 2003, the built-up area is also seen as have increased in the South-East region (Figure 9).
(ii) Land use and land cover change: 2003 and 2018The imagery is taken from the Landsat-5 on Nov 15, 2003 (USGS) noted Built-upland 174.5547 km2 or 23% but imagery taken on Nov 18, 2018 (USGS) the Built-up land reported about 221.4387 km2 which is 29% of the total geographical area. The rapid growth up to 2018 has taken place due to the establishment of a new industrial parks and sectors along the NH2 in Andal to Panagarh (Figure 10). This also with a rap-id increase of the population in the municipal area of the Durgapur (about 566,937 in 2011 census), Andal town (186,915), Pandabeswar (161,891). Under
built-up category, the mining area also increased in 2018 compared to 2003 at Andal and Pandabeswar block. A newly setup Airport is seen near Andal (War-ia) in 2018. An increase in cropland i.e. 12% took place simultaneously when there is a further decrease in fallow land (−13%) and vegetation (−6%) (Table 10). Anyhow, barren land, water bodies, and sandy areas remain intact. The fact is that there is an expan-sion of industrial activities in the virgin areas and fol-low up is the rise of urban areas and the growth of rural settlements as well. There are also linkages that with increase in population in the areas located in the region, there has been consistent pressure on land since the agriculture area has to be increased. This is resulting in a decrease in fallow land and vegetation cover in the Durgapur Sub-Division. Thus, the land-scape of the region is changing by these activities that accelerated over the last few years.
Land use and land cover change-induced landscape dynamics 91
Fig. 9 Composite land use and land cover change of Durgapur Sub-Division, (A) 1989, (B) 2003, (C) 2018.
Tab. 9 Land use and land cover change in Durgapur Sub-Division, 1989 and 2003.
Land use / Land cover classes
1989 2003 Change
Area (km2) % Area (km2) % Area (km2) %
Builtup-Land 87.2302 11 174.5547 23 87.3245 12
Crop Land 203.3870 27 189.2033 24 −14.1837 −3
Fallow Land 185.3955 24 195.9534 25 10.5579 1
Vegetation 207.3816 27 162.6660 21 −44.7156 −6
Barren Land 61.3674 8 27.9828 4 −33.3846 −4
Water Bodies 16.8129 2 15.6402 2 −1.1727 0
Sandy Area 9.7254 1 5.3001 1 −4.4253 0
Source: Calculated by the authors based on satellite imageries 1989 and 2003.
During 2003-2018, this scenario is out passed by tremendous increase in crop land. The fact is that with the implementation of Damodar Valley Project, mono-cropped areas of the Paschim Barddhman dis-trict have been converted into multi-cropped lands. The industrial complex of Durgapur was established
at the expense of forest in the mid-fifties and it has been growing further since then. Durgapur Sub-Di-vision has experienced a drastic change in the land-scape with expansion of urban, industrial, and mining activities at the cost of forest, pasture, and cultivat-ed lands. According to District Census Handbook of
92 Sribas Patra, Kapil Kumar Gavsker
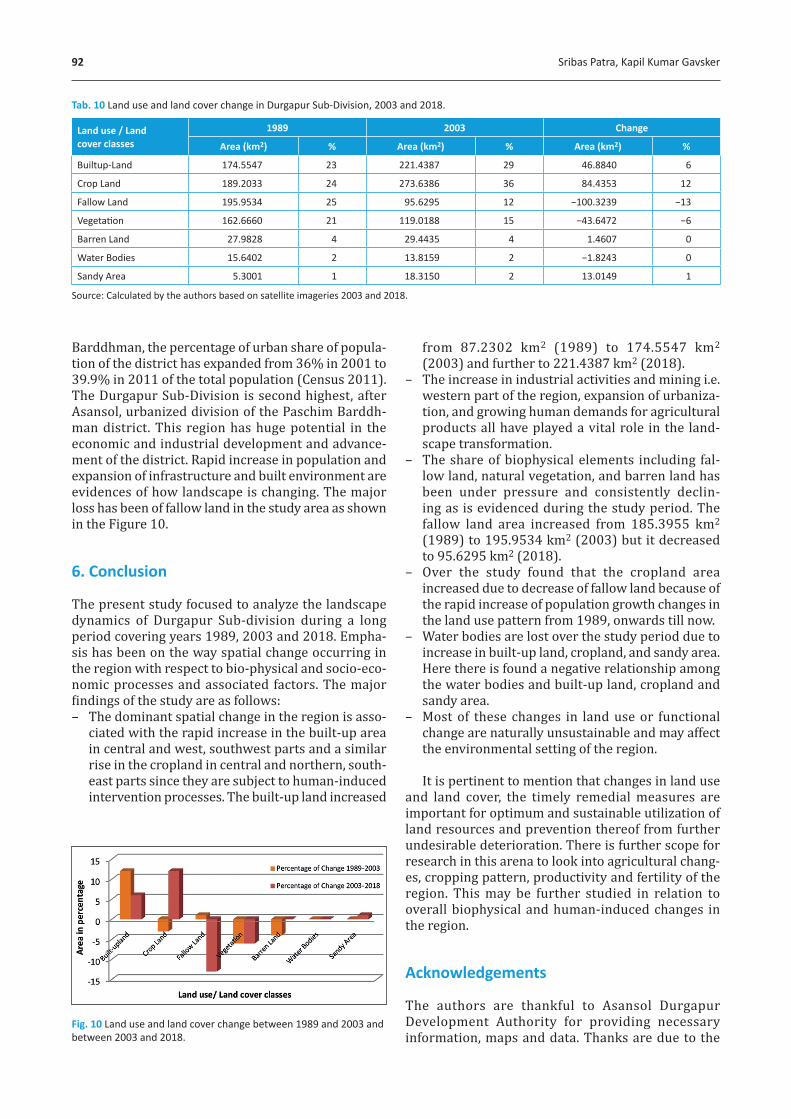
Barddhman, the percentage of urban share of popula-tion of the district has expanded from 36% in 2001 to 39.9% in 2011 of the total population (Census 2011). The Durgapur Sub-Division is second highest, after Asansol, urbanized division of the Paschim Barddh-man district. This region has huge potential in the economic and industrial development and advance-ment of the district. Rapid increase in population and expansion of infrastructure and built environment are evidences of how landscape is changing. The major loss has been of fallow land in the study area as shown in the Figure 10.
6. Conclusion
The present study focused to analyze the landscape dynamics of Durgapur Sub-division during a long period covering years 1989, 2003 and 2018. Empha-sis has been on the way spatial change occurring in the region with respect to bio-physical and socio-eco-nomic processes and associated factors. The major findings of the study are as follows:– The dominant spatial change in the region is asso-
ciated with the rapid increase in the built-up area in central and west, southwest parts and a similar rise in the cropland in central and northern, south-east parts since they are subject to human-induced intervention processes. The built-up land increased
from 87.2302 km2 (1989) to 174.5547 km2 (2003) and further to 221.4387 km2 (2018).
– The increase in industrial activities and mining i.e. western part of the region, expansion of urbaniza-tion, and growing human demands for agricultural products all have played a vital role in the land-scape transformation.
– The share of biophysical elements including fal-low land, natural vegetation, and barren land has been under pressure and consistently declin-ing as is evidenced during the study period. The fallow land area increased from 185.3955 km2 (1989) to 195.9534 km2 (2003) but it decreased to 95.6295 km2 (2018).
– Over the study found that the cropland area increased due to decrease of fallow land because of the rapid increase of population growth changes in the land use pattern from 1989, onwards till now.
– Water bodies are lost over the study period due to increase in built-up land, cropland, and sandy area. Here there is found a negative relationship among the water bodies and built-up land, cropland and sandy area.
– Most of these changes in land use or functional change are naturally unsustainable and may affect the environmental setting of the region.
It is pertinent to mention that changes in land use and land cover, the timely remedial measures are important for optimum and sustainable utilization of land resources and prevention thereof from further undesirable deterioration. There is further scope for research in this arena to look into agricultural chang-es, cropping pattern, productivity and fertility of the region. This may be further studied in relation to overall biophysical and human-induced changes in the region.
Acknowledgements
The authors are thankful to Asansol Durgapur Development Authority for providing necessary information, maps and data. Thanks are due to the
Tab. 10 Land use and land cover change in Durgapur Sub-Division, 2003 and 2018.
Land use / Land cover classes
1989 2003 Change
Area (km2) % Area (km2) % Area (km2) %
Builtup-Land 174.5547 23 221.4387 29 46.8840 6
Crop Land 189.2033 24 273.6386 36 84.4353 12
Fallow Land 195.9534 25 95.6295 12 −100.3239 −13
Vegetation 162.6660 21 119.0188 15 −43.6472 −6
Barren Land 27.9828 4 29.4435 4 1.4607 0
Water Bodies 15.6402 2 13.8159 2 −1.8243 0
Sandy Area 5.3001 1 18.3150 2 13.0149 1
Source: Calculated by the authors based on satellite imageries 2003 and 2018.
Fig. 10 Land use and land cover change between 1989 and 2003 and between 2003 and 2018.

Land use and land cover change-induced landscape dynamics 93
faculty members of Department of Applied Geography, Ravenshaw University, Cuttack (India) for sugges-tions and support towards timely execution of present research.
References
Administrative unit and Depogaphic profile. Accessed at http://www.sdodurgapur.org/blocks.php on 12. 12. 2019.
Ayele, G. T., Demessie, S. S., Mengistu, K. T., Tilahun, S. A., Melesse, A. M. (2016): Multitemporal Land Use/Land Cover Change Detection for the Batena Watershed, Rift Valley Lakes Basin, Ethiopia. In: Melesse, A., Abtew, W. (eds.) Landscape Dynamics, Soils and Hydrological Processes in Varied Climates. Springer Geography. Springer, https://doi.org/10.1007 /978-3-319-18787-7_4.
Bhatta, B. (2011): Remote Sensing and GIS. 2nd ed. New Delhi: Oxford University Press.
Bonan, G. B. (2008): Ecological Climatology – Concepts and Applications. 2nd ed. Cambridge: Cambridge University Press, https://doi.org/10.1017/CBO9780511805530.
Butchart, S. H. M., Walpole, M., Collen, B., van Strien, A., Scharlemann, J. P. M., Almond, R. E. A., Baillie, J. E. M., Bomhard, B., Brown, C., Bruno, J., Carpenter, K. E., Carr, G. M., Chanson, J., Chenery, A. M., Csirke, J., Davidson, N. C., Dentener, F., Foster, M., Galli, A., Galloway, J. N., Genovesi, P., Gregory, R. D., Hockings, M., Kapos, V., Lamarque, J. F., Leverington, F., Loh, J., McGeoch, M. A., McRae, L., Minasyan, A., Hernández Morcillo, M., Oldfield, T. E. E., Pauly, D., Quader, S., Revenga, C., Sauer, J. R., Skolnik, B., Spear, D., Stanwell-Smith, D., Stuart, S. N., Symes, A., Tierney M., Tyrrell, T. D., Vié, C., Watson R. (2010): Global Biodiversity: Indicators of Recent Decline. Science 328(5982), 1164–1168, https://doi.org/10.1126/science.1187512.
Census of India. (2011). Accessed at https://censusindia .gov.in/ on 12. 12. 2019.
Dwivedi, R. S., Sreenivas, K., Ramana, K. V. (2005): Land-use/land-cover change analysis in part of Ethiopia using Landsat Thematic Mapper data. International Journal of Remote Sensing 26(7), 1285–1287, https://doi.org /10.1080/01431160512331337763.
Dimyati, M., Mizuno, K., Kobayashi, S., Kitamura, T., (1996): An analysis of landuse/cover change in Indonesia. International Journal of Remote Sensing 17(5), 931–944, https://doi.org/10.1080/01431169608949056.
District Census Handbook of Barddhman. (2011). https://www.wbpspm.gov.in/publications/District%20Statistical%20Handbook.
Document Control Sheet, NRSC/ISRO. Accessed at https://bhuvan.nrsc.gov.in/gis/thematic/tools/document/wl /wl0809.pdf on 22. 12. 2019.
Erle, E., Pontius, R. (2007): Land-use and land-cover change. In: Cleveland, C. J. (ed.) Encyclopaedia of earth environmental information. Coalition, Washington.
Fan, F., Weng, Q., Wang, Y. (2007): Land use land cover change in Guangzhou, China, from 1998 to 2003, based on Landsat TM/ETM+ imagery. Sensors 7, 1323–1342, https://doi.org/10.3390/s7071323.
Farina, A. (2017): Landscape Dynamics: Oxford Bibliographies. Accessed at https://www .oxfordbibliographies.com/view/document/obo -9780199830060/obo-9780199830060-0182.xml.
Houghton, R. A. (1994): The worldwide extent of land-use change. Bio Science 44(5), 305–313, https://doi.org /10.2307/1312380.
Kenton, W. (2019). Multiple Linear Regression. Accessed at https://www.investopedia.com/terms/m/mlr .asp.
Land Use and Development Control Plan for Andal, Pandabeswar, Durgapur Faridpur & Kansa CD Blocks, Asansol Durgapur Development Authority. Accessed on http://addaonline.in/wp-content/uploads /2015/02/FINAL-LUDCP-REPORT1.pdf on 22. 12. 2019.
Liang, S., Fang, H., Morisette, J. T., Chen, M., Shuey, C. J., Walthall, C. L., Daughtry, C. S. (2002): Atmospheric correction of landsat ETM+ land surface imagery. II. Validation and applications. IEEE Transactions on Geoscience and Remote Sensing 40(12), 2736–2746, https://doi.org/10.1109/TGRS.2002.807579.
Myers, N. (1993): Tropical rainforests: the main deforestation fronts. Environmental Conservation 20(1), 9–16, https://doi.org/10.1017/S0376892900037176.
Prenzel, B., Treitz, P. (2004): Remote Sensing Change Detection for a Watershed in North Sulawesi, Indonesia. Progress in Planning 61(4), 349–363, https://doi.org /10.1016/S0305-9006(03)00068-0.
Singh, A. (1989): Digital change detection techniques using remotely sensed data. International Journal of Remote Sensing 10(6), 989–1003, https://doi.org/10.1080 /01431168908903939.
Sellers, P. J., Meeson, B. W., Hall, F. G., Asrar, G., Murphy, R. E., Schiffer, R. A., Bretherton, F. P., Dickinson, R. E., Ellingson, R. G., Field, C. B., Huemmric, K. F., Justice C. O., Melack J. M., Roulet N. T., Schime, D. S., Try P. D. (1995): Remote Sensing of the Land Surface for Studies of Global Change: Models–Algorithms–Experiments. Remote Sensing of Environment 51(1), 3–26, https://doi.org /10.1016/0034-4257(94)00061-Q.
Schröter, D., Cramer, W., Leemans, R., Prentice, I. C., Araujo, M. B., Arnell, N. W., Bondeau, A., Bugmann, H., Carter, T. R., Gracia, C. A., de la Vega-Leinert, A. C., Erhard, M., Ewert, F., Glendining, M., House, J. I., Kankaanpää, S., Klein, R. J. T., Lavorel, S., Lindner, M., Metzger, M. J., Meyer, J., Mitchell, T. D., Reginster, I., Rounsevell, M., Sabaté, S., Sitch, S., Smith, B., Smith, J., Smith, P., Sykes, M. T., Thonicke, K., Thuiller, W., Tuck, G., Zaehle, S., Zierl, B. (2010): Ecosystem Service Supply and Vulnerability to Global Change in Europe. Science 310(5752), 1333–1337, https://doi.org/10.1126 /science.1115233.
Sarkar, A. (2015): Practical Geography: A Systematic Approach. 3rd ed. New Delhi: Orient Blackswan.
Turner, B. L. (2002) Toward Integrated Land-Change Science: Advances in 1.5 Decades of Sustained International Research on Land-Use and Land-Cover Change. In: Steffen, W., Jäger, J., Carson, D. J., Bradshaw, C. (eds.) Challenges of a Changing Earth. Global Change – The IGBP Series. Berlin: Springer, https://doi.org /10.1007/978-3-642-19016-2_3.
Yuan, D., Elvidge, C. D., Lunetta, R. S. (1999): Survey of multi-spectral methods for land cover change analysis.

94 Sribas Patra, Kapil Kumar Gavsker
In: Lunetta, R. S., Elvidge, C. D. (eds.) Remote sensing change detection: environmental monitoring methods and applications. London: Taylor and Francis, 21–39.
Wilkie, D. S., Finn, J. T. (1996): Remote Sensing Imagery for Natural Resources Monitoring: A Guide for First-Time Users. Columbia University Press.
Zhao, G. X., Lin, G., Warner, T. (2004): Using Thematic Mapper data for change detection and sustainable use of cultivated land: a case study in the Yellow River delta, China. International Journal of Remote Sensing 25(13), 2509–2522, https://doi.org/10.1080/01431160310001619571