an analysis of land use and land cover dynamics and
TRANSCRIPT
Bansal et al.: Land use and land cover dynamics in Yamuna river basin
- 773 -
APPLIED ECOLOGY AND ENVIRONMENTAL RESEARCH 14(3): 773-792.
http://www.aloki.hu ● ISSN 1589 1623 (Print) ● ISSN 1785 0037 (Online)
DOI: http://dx.doi.org/10.15666/aeer/1403_773792
2016, ALÖKI Kft., Budapest, Hungary
AN ANALYSIS OF LAND USE AND LAND COVER DYNAMICS
AND CAUSATIVE DRIVERS IN A THICKLY POPULATED
YAMUNA RIVER BASIN OF INDIA
BANSAL, S.1*
– SRIVASTAV, S. K.1 – ROY, P. S.
2 – KRISHNAMURTHY, Y. V. N.
3
1Indian Institute of Remote Sensing, Indian Space Research Organisation,
4-Kalidas Road, Dehradun 248001, India
(email: [email protected])
2National Academy of Sciences, University of Hyderabad,
Prof. C.R. Rao Road, Gachibowli, Hyderabad 500046, India
(email: [email protected])
3Indian Space Research Organisation, ISRO Headquarters,
Antariksh Bhavan, New BEL Road, Bangalore 560231, India
(email: [email protected])
*Corresponding author
email: [email protected] or [email protected]
(phone: +91-9720906816)
(Received 31st May 2016; accepted 28
th Jun 2016)
Abstract. Understanding the land use and land cover (LULC) change processes is of great importance for
formulating the land use policy. In the present study, Remote Sensing, Geographic Information System
(GIS) and statistical techniques are used to understand the LULC dynamics and possible driving forces in
a thickly populated Yamuna river basin of India. The National Capital Territory of Delhi, one of the
world's largest urban agglomerations, occurs in this river basin. The LULC maps on 1:250,000 scales prepared at decadal interval (1985, 1995 and 2005) using satellite images are used for studying the LULC
dynamics. The major LULC changes observed during the study period are increase in cropland (65.7% to
67.9%) and built-up (0.9% to 1.9%) and decrease in forest (17.1% to 16.4%) and water bodies (2.3% to
1.9%). The dominant processes of the LULC changes include transitions from forest, grassland, shrub
land, water bodies and wasteland to cropland; transitions from cropland, shrub land, wasteland, grassland
and forest to built-up; conversion of forest to cropland, shrub land, plantation and built-up; and transitions
from water bodies to cropland, shrub land and wasteland. Most of the transitions are reversible in nature.
The statistical analysis (logistic regression) between decadal LULC maps and drivers indicates that LULC
changes are driven by a multitude of factors in different combinations and with different importance.
Socioeconomic, demographic and proximity drivers mainly influence the LULC change processes in the
study area in decreasing order of importance. The insights gained are important for simulating future
LULC scenarios as input for land management policy making. Keywords: land use and land cover (LULC); remote sensing; geographic information system; logistic
regression; drivers of LULC change; Yamuna basin
Introduction
Land is the most valuable natural resource that has been transforming since ages to
meet the demands of human kind in pursuit of better life. Some of the major landscapes
changes across the world have arisen due to human interference (Viles and Goudie,
1997; Lambin et al., 2001). A strong trend of urban development can be observed
throughout the world (United Nations Centre for Human Settlements, 1996) and India is
no exception, which has witnessed phenomenal development in different sectors since
Bansal et al.: Land use and land cover dynamics in Yamuna river basin
- 774 -
APPLIED ECOLOGY AND ENVIRONMENTAL RESEARCH 14(3): 773-792.
http://www.aloki.hu ● ISSN 1589 1623 (Print) ● ISSN 1785 0037 (Online)
DOI: http://dx.doi.org/10.15666/aeer/1403_773792
2016, ALÖKI Kft., Budapest, Hungary
independence. It occupies 2.3% of the world’s land area and supports more than 17.5%
of the world’s population. Indian agriculture has grown at the rate of about 2.6% per
annum in the post-independence era which is double the rate of pre-independence era
(Tripathi and Prasad, 2010). Significant land use and land cover (LULC) changes have
occurred in the country during the last few decades wherein demography, rapid
development, urbanisation and agriculture expansion has exerted an increasing pressure
on land. Historically, it has been observed that most of the developed cities in India are
located near the river banks. Considering this fact, the present study lays emphasis on
understanding the interaction of causative driving forces and LULC change in Yamuna
river basin of India.
The Yamuna is the longest tributary of river Ganga in the Lower Himalaya. After
flowing for about 200 km in the Himalaya, it then emerges into the Indo-Gangetic
plains (Rai et al., 2012) where it flows almost parallel to river Ganga and ultimately
meets river Ganga at Allahabad in the state of Uttar Pradesh. While flowing in Indo-
Gangetic plains, it creates a large (~69,000 km2) fertile zone called Ganga-Yamuna
Doab. The drainage basin is highly vegetated and populated area that needs attention
towards LULC change analysis. The study area covers part of seven states of the
country namely, Uttar Pradesh, Himachal Pradesh, Madhya Pradesh, Uttarakhand,
Haryana, Rajasthan and National Capital Territory of Delhi. It is thickly populated with
highest population density in Delhi. Yamuna waters feed a large population and are the
source of irrigation. Studying LULC change processes and understanding their linkages
with socioeconomic, demographic and physical factors are thus critical for formulating
land use policy in this river basin.
The driving factors responsible for LULC change in an area may be socioeconomic,
demographic, physical, proximate or a combination of all these. Also, these driving
factors may operate independently at different levels in a simultaneous manner that may
vary in time and space (Geist and Lambin, 2002). The changing patterns of LULC and
their driving factors have been studied in different countries at various scales. In India,
the changing patterns of LULC with decrease in forest cover, expansion of cropland and
increase in built-up areas have been identified from 1880 to 2010 (Tian et al., 2014).
Recently, in another study on LULC changes in India (Roy et al., 2015), significant
increase in built-up areas and cropland and decrease in fallow land, forest and wasteland
have been identified during 1985 to 2005 using satellite images. In a similar study in
Northeast China (Shen et al., 2013), changes in built-up, cropland, forest, grassland and
wetland were analysed from 1970 to 2004 that highlighted the effectiveness of forest
and wetland protection and restoration projects. Decrease in ecosystem services value
were found in Su-Xi-Chang region of Yangtz river delta, East China, due to the loss of
cropland and water bodies by urban expansion (Yirsaw et al., 2016). In Bonsa
catchment of Ankora river basin in Ghana, West Africa, land cover transitions from
1986 to 2011 showed that increase in population growth, agriculture expansion and
increased surface mining activities were responsible for increased deforestation rate
(Aduah, 2014). In Poland, the effect of LULC on ecological quality of rivers were
analysed which showed decline in population of bryophytes due to the loss of forest
(Zgola, 2014). Human induced LULC changes were revealed in Kagera Basin of Lake
Victoria (Wasige et al., 2013). Role of socioeconomic and physical drivers on land
degradation were identified in Vietnam (Vu et al., 2014).
It is difficult to link the drivers of LULC change in a heterogeneous landscape
because of uncertainty associated with misclassification and availability of data at

Bansal et al.: Land use and land cover dynamics in Yamuna river basin
- 775 -
APPLIED ECOLOGY AND ENVIRONMENTAL RESEARCH 14(3): 773-792.
http://www.aloki.hu ● ISSN 1589 1623 (Print) ● ISSN 1785 0037 (Online)
DOI: http://dx.doi.org/10.15666/aeer/1403_773792
2016, ALÖKI Kft., Budapest, Hungary
diverse scales (Martinez et al., 2011). LULC change is dynamic in nature and it is
difficult to obtain the real time information of LULC change through conventional
methods. Satellite remote sensing along with GIS that can bring different types of data
at one platform for analysis has brought a new dimension to study LULC changes at
varied scales (Wang et al., 2013).
In the present study, we investigate LULC change processes and the possible driving
forces of such change in the Yamuna river basin of India using remote sensing, GIS and
statistical techniques.
Materials and Methods
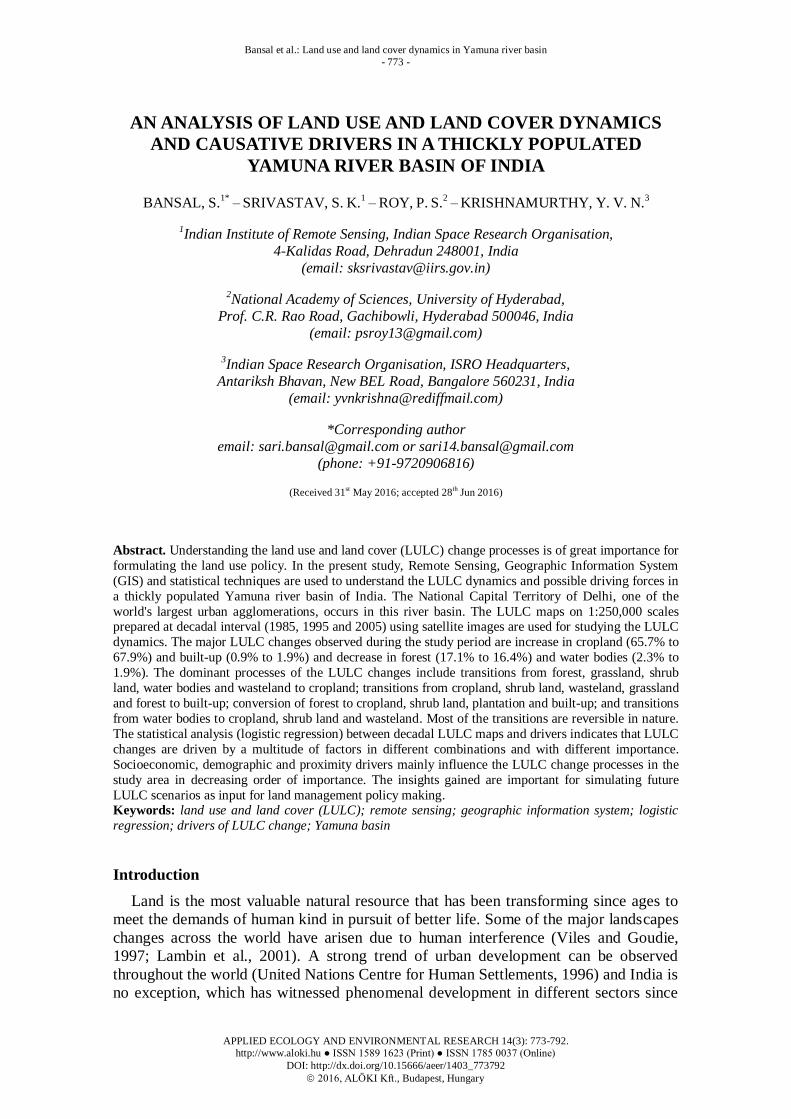
Study Area
Yamuna River originates from Yamunotri glacier at 30.98°and 78.45
° in the
Mussoorie range of the Lower Himalaya in the state of Uttarakhand, India. It covers an
area of 3,66,223 km2
which is about 42.5% of the total area of Ganga basin and 10.7%
of the total country's land area. In the present study, the drainage area of Chambal river,
which is a major tributary of river Yamuna, has been excluded. The study area of
Yamuna basin (~1,98,890 km2) delineated from 90 m digital elevation model (DEM)
obtained from Shuttle Radar Topography Mission (SRTM) as shown in Fig.1. Tons,
Chambal, Hindon, Sind, Betwa, Ken, Baghein and Mandakini are major tributaries and
Rishi Ganga, Uma, Hanuman Ganga, Giri, Karan, Sagar and Rind are smaller tributaries
of Yamuna. The basin landscape is characterized by hills, valleys, plains, lakes and
network of river streams. Many protected areas like sanctuaries (Bhindawas bird
sanctuary, Okhla wildlife sanctuary, Hastinapur wildlife sanctuary, National Chambal
wildlife sanctuary, etc.) and National parks (Ranthambore national park, Kalesar
national park, Keoladeo Ghana national park) are situated in the study area. The basin
has a huge variety of flora and fauna that varies with respect to the location and
environment. The elevation in the basin varies from 6320 m above mean sea level near
Yamunotri Glacier to around 100 m near the confluence with the river Ganga at
Allahabad with highly varied topography from steep, rugged mountains in the Himalaya
to almost flat in Indo-Gangetic plains. About 42% of the area is covered by alluvial soil
and over 50% of the area is cultivated. The irrigated land area in the basin is about 12.3
million hectares. There are four irrigation canals in the basin namely, Western Yamuna
canal, Eastern Yamuna canal, Agra canal and Gurgaon canal that delivers the Yamuna
water to the command areas (Rai et al., 2012).
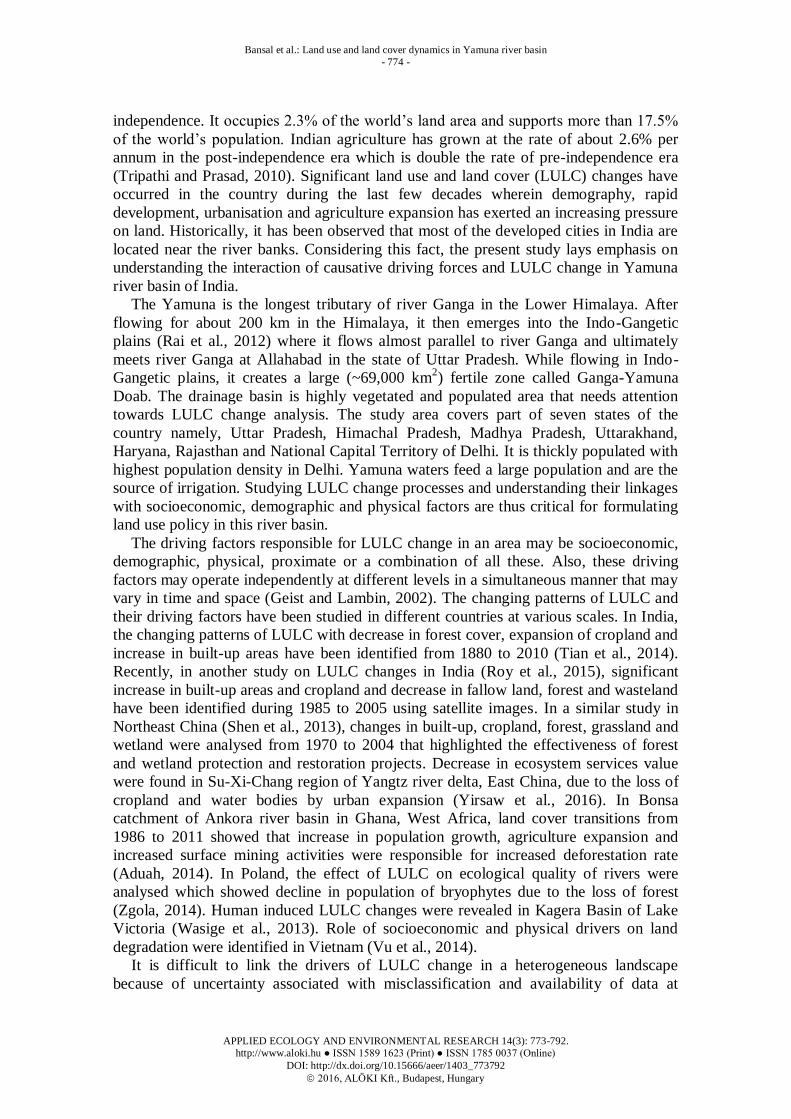
Methodology
The methodology includes three parts viz, LULC change analysis and accuracy
assessment; preparation and integration of socioeconomic, physical, demographic and
proximity driver datasets; and statistical analysis to derive relationship between drivers
and LULC changes (Fig. 2). Different datasets used in the present study and their
sources are listed in Table 1.
Bansal et al.: Land use and land cover dynamics in Yamuna river basin
- 776 -
APPLIED ECOLOGY AND ENVIRONMENTAL RESEARCH 14(3): 773-792.
http://www.aloki.hu ● ISSN 1589 1623 (Print) ● ISSN 1785 0037 (Online)
DOI: http://dx.doi.org/10.15666/aeer/1403_773792
2016, ALÖKI Kft., Budapest, Hungary
Figure 1. Study area taken for the present study
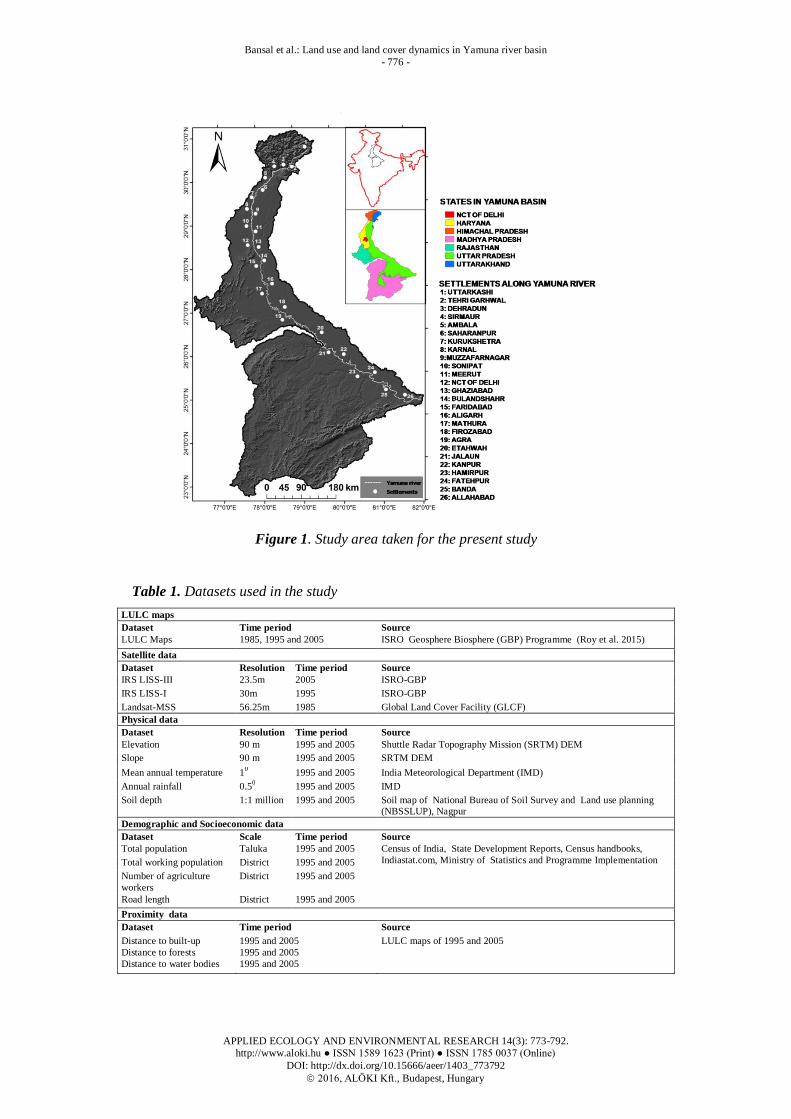
Table 1. Datasets used in the study
LULC maps
Dataset Time period Source
LULC Maps 1985, 1995 and 2005 ISRO Geosphere Biosphere (GBP) Programme (Roy et al. 2015)
Satellite data
Dataset Resolution Time period Source
IRS LISS-III 23.5m 2005 ISRO-GBP
IRS LISS-I 30m 1995 ISRO-GBP
Landsat-MSS 56.25m 1985 Global Land Cover Facility (GLCF)
Physical data
Dataset Resolution Time period Source
Elevation 90 m 1995 and 2005 Shuttle Radar Topography Mission (SRTM) DEM
Slope 90 m 1995 and 2005 SRTM DEM
Mean annual temperature 10 1995 and 2005 India Meteorological Department (IMD)
Annual rainfall 0.50 1995 and 2005 IMD
Soil depth 1:1 million 1995 and 2005 Soil map of National Bureau of Soil Survey and Land use planning (NBSSLUP), Nagpur
Demographic and Socioeconomic data
Dataset Scale Time period Source
Total population Taluka 1995 and 2005 Census of India, State Development Reports, Census handbooks,
Indiastat.com, Ministry of Statistics and Programme Implementation Total working population District 1995 and 2005
Number of agriculture
workers
District 1995 and 2005
Road length District 1995 and 2005
Proximity data
Dataset Time period Source
Distance to built-up
Distance to forests
Distance to water bodies
1995 and 2005
1995 and 2005
1995 and 2005
LULC maps of 1995 and 2005
Bansal et al.: Land use and land cover dynamics in Yamuna river basin
- 777 -
APPLIED ECOLOGY AND ENVIRONMENTAL RESEARCH 14(3): 773-792.
http://www.aloki.hu ● ISSN 1589 1623 (Print) ● ISSN 1785 0037 (Online)
DOI: http://dx.doi.org/10.15666/aeer/1403_773792
2016, ALÖKI Kft., Budapest, Hungary
Figure 2. Methodology followed in the present study
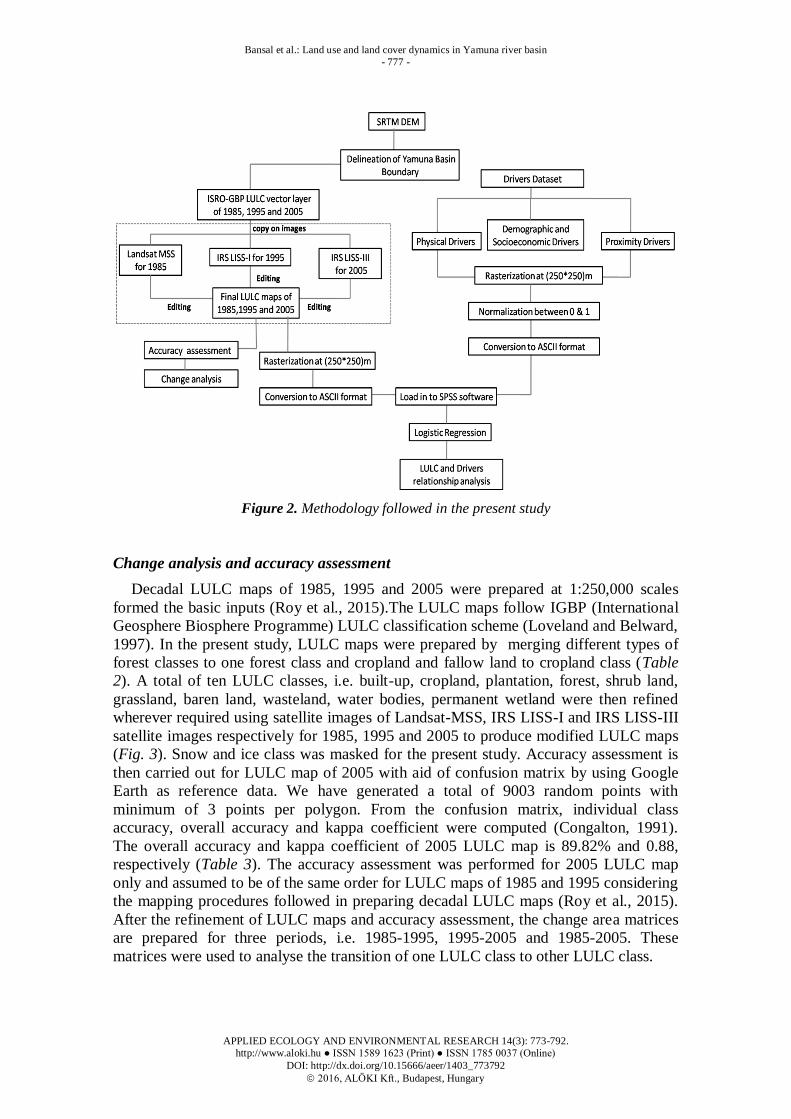
Change analysis and accuracy assessment
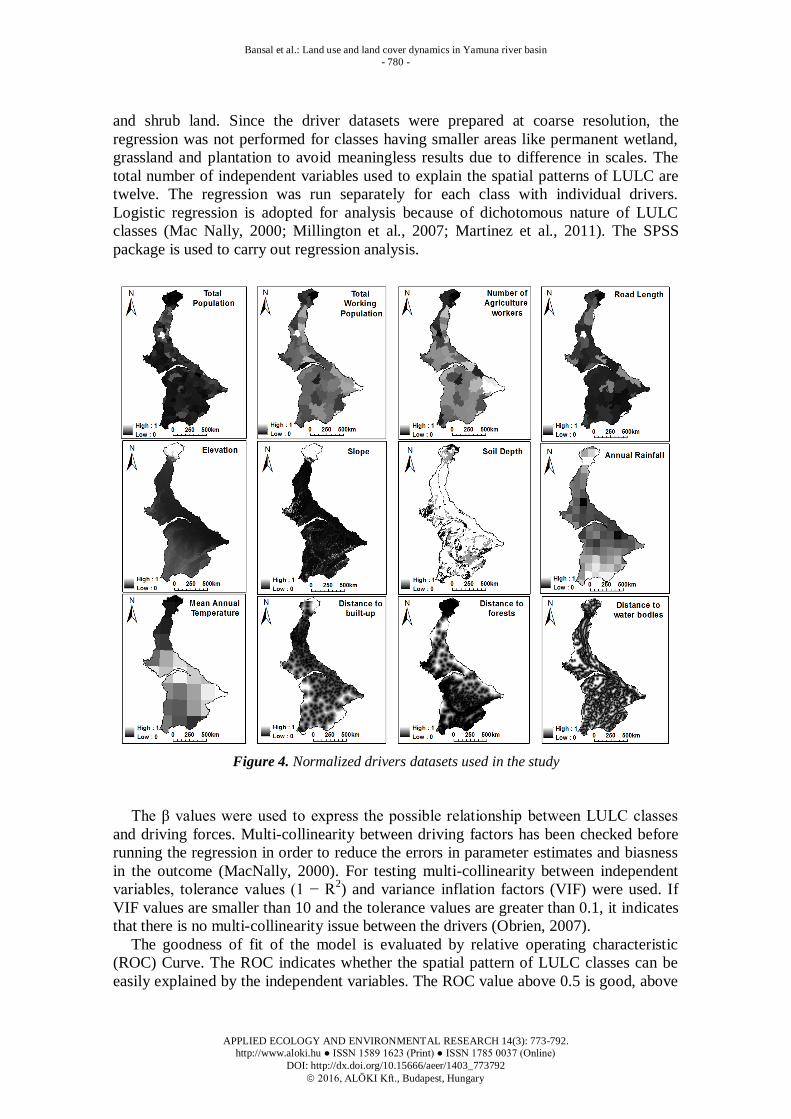
Decadal LULC maps of 1985, 1995 and 2005 were prepared at 1:250,000 scales
formed the basic inputs (Roy et al., 2015).The LULC maps follow IGBP (International
Geosphere Biosphere Programme) LULC classification scheme (Loveland and Belward,
1997). In the present study, LULC maps were prepared by merging different types of
forest classes to one forest class and cropland and fallow land to cropland class (Table
2). A total of ten LULC classes, i.e. built-up, cropland, plantation, forest, shrub land,
grassland, baren land, wasteland, water bodies, permanent wetland were then refined
wherever required using satellite images of Landsat-MSS, IRS LISS-I and IRS LISS-III
satellite images respectively for 1985, 1995 and 2005 to produce modified LULC maps
(Fig. 3). Snow and ice class was masked for the present study. Accuracy assessment is
then carried out for LULC map of 2005 with aid of confusion matrix by using Google
Earth as reference data. We have generated a total of 9003 random points with
minimum of 3 points per polygon. From the confusion matrix, individual class
accuracy, overall accuracy and kappa coefficient were computed (Congalton, 1991).
The overall accuracy and kappa coefficient of 2005 LULC map is 89.82% and 0.88,
respectively (Table 3). The accuracy assessment was performed for 2005 LULC map
only and assumed to be of the same order for LULC maps of 1985 and 1995 considering
the mapping procedures followed in preparing decadal LULC maps (Roy et al., 2015).
After the refinement of LULC maps and accuracy assessment, the change area matrices
are prepared for three periods, i.e. 1985-1995, 1995-2005 and 1985-2005. These
matrices were used to analyse the transition of one LULC class to other LULC class.
Bansal et al.: Land use and land cover dynamics in Yamuna river basin
- 778 -
APPLIED ECOLOGY AND ENVIRONMENTAL RESEARCH 14(3): 773-792.
http://www.aloki.hu ● ISSN 1589 1623 (Print) ● ISSN 1785 0037 (Online)
DOI: http://dx.doi.org/10.15666/aeer/1403_773792
2016, ALÖKI Kft., Budapest, Hungary
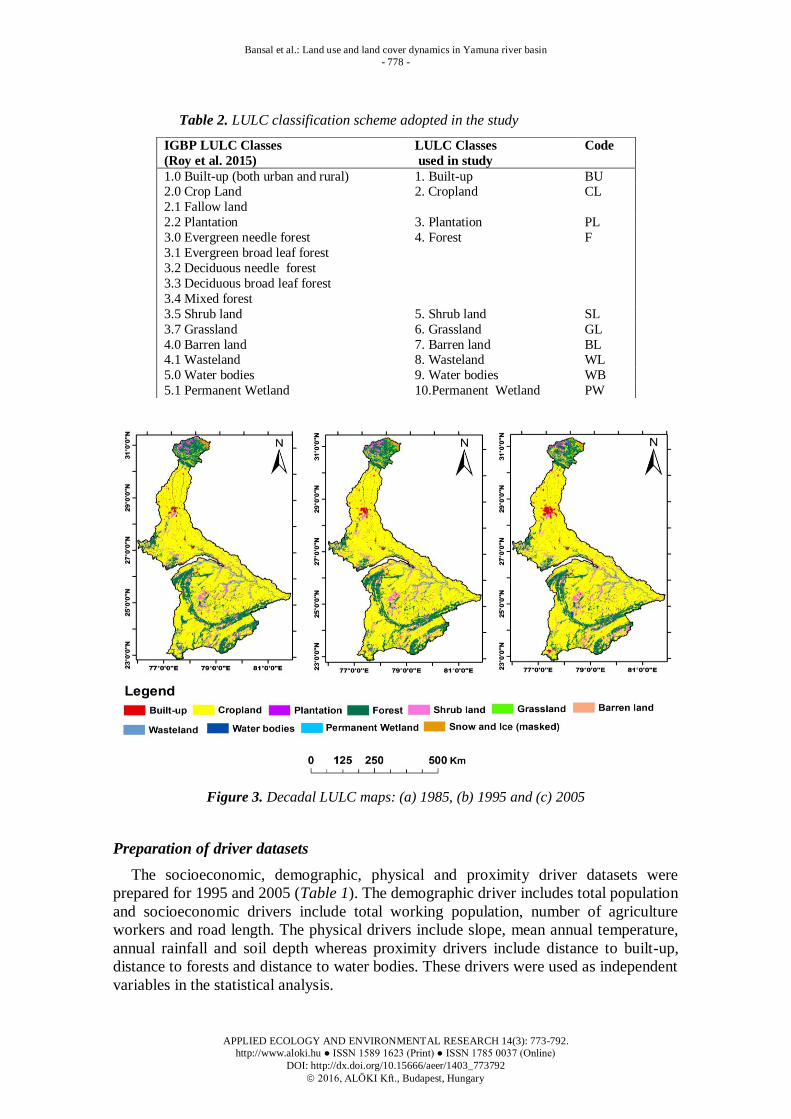
Table 2. LULC classification scheme adopted in the study
Figure 3. Decadal LULC maps: (a) 1985, (b) 1995 and (c) 2005
Preparation of driver datasets
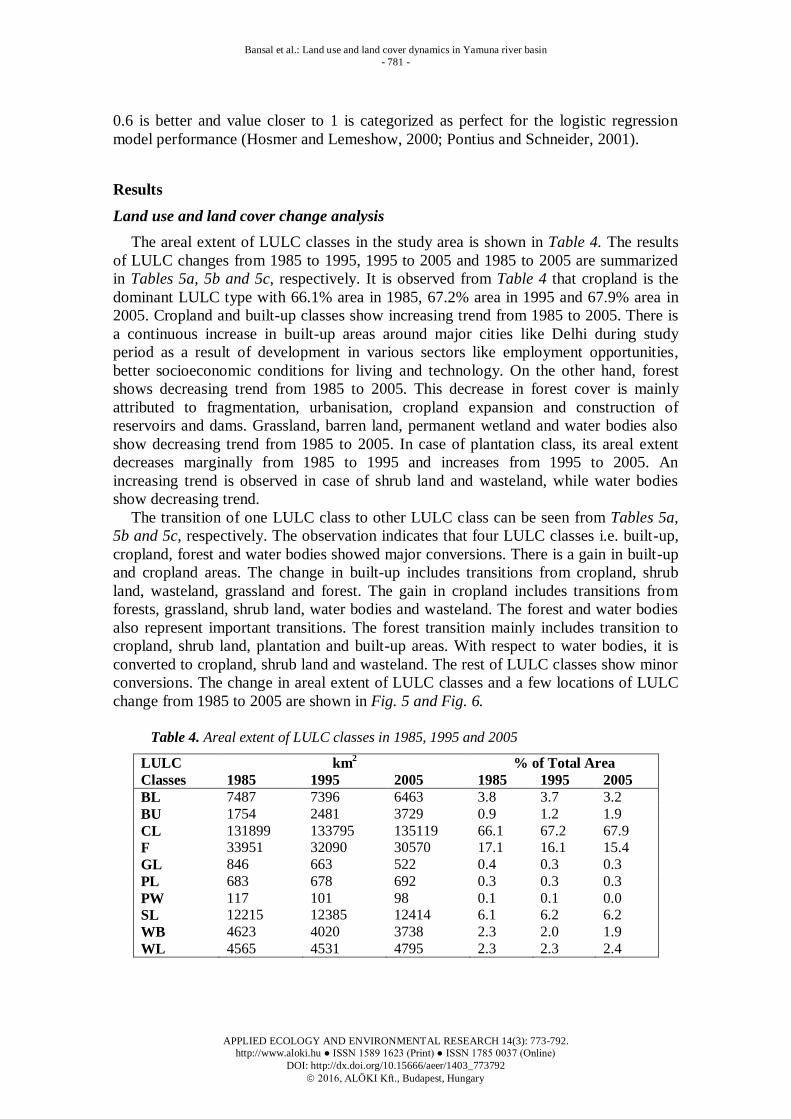
The socioeconomic, demographic, physical and proximity driver datasets were
prepared for 1995 and 2005 (Table 1). The demographic driver includes total population
and socioeconomic drivers include total working population, number of agriculture
workers and road length. The physical drivers include slope, mean annual temperature,
annual rainfall and soil depth whereas proximity drivers include distance to built-up,
distance to forests and distance to water bodies. These drivers were used as independent
variables in the statistical analysis.
IGBP LULC Classes
(Roy et al. 2015)
LULC Classes
used in study
Code
1.0 Built-up (both urban and rural) 1. Built-up BU 2.0 Crop Land
2.1 Fallow land
2. Cropland CL
2.2 Plantation 3. Plantation PL
3.0 Evergreen needle forest
3.1 Evergreen broad leaf forest
3.2 Deciduous needle forest
3.3 Deciduous broad leaf forest
3.4 Mixed forest
4. Forest F
3.5 Shrub land 5. Shrub land SL
3.7 Grassland 6. Grassland GL
4.0 Barren land 7. Barren land BL 4.1 Wasteland 8. Wasteland WL
5.0 Water bodies 9. Water bodies WB
5.1 Permanent Wetland 10.Permanent Wetland PW

Bansal et al.: Land use and land cover dynamics in Yamuna river basin
- 779 -
APPLIED ECOLOGY AND ENVIRONMENTAL RESEARCH 14(3): 773-792.
http://www.aloki.hu ● ISSN 1589 1623 (Print) ● ISSN 1785 0037 (Online)
DOI: http://dx.doi.org/10.15666/aeer/1403_773792
2016, ALÖKI Kft., Budapest, Hungary
Table 3. Accuracy assessment of LULC map of 2005
Cla
ssif
ied
da
ta
Reference data Users
accuracy
(%)
LULC
BL BU CL F GL PL PW SL WB WL Total Classes
BL 519 1 23 87
3
633 81.9
BU 13 1634 72 2
1 7 2
1731 94.4
CL
4 1147 24
1
25 5 3 1209 94.8
F
5 109 1544
4
18
1 1681 91.9
GL
96 17 2 315 6
1
437 72.1
PL
3 12
2 415
432 96.1
PW
8
116
124 93.5
SL 12 2 75
46
946
4 1085 87.2
WB
116 6 10
3 764
899 85.0
WL 3 2 52 7 19
1 1 687 772 89.0
Total 547 1747 1631 1672 392 426 117 1003 773 695 9003
Producer
accuracy (%) 94.9 93.5 70.3 92.3 80.4 97.4 99.1 94.3 98.8 98.8
Overall accuracy: 89.82 %
Khat or Kappa Coefficient: 0.88
BL- Barren land, BU- Built-up, CL- Cropland, F- Forest, GL- Grassland, PL- Plantation, PW- Permanent Wetland, SL- Shrub land,
WB- Water bodies, WL- Wasteland.
The socioeconomic data were collected at district level with the exception of
population data which was collected at taluka (sub-district) level. The data set were
collected from Census of India, Indiastat.com, Census handbooks, State development
reports and Statistical diaries. The slope and elevation has been derived from the SRTM
DEM. The annual rainfall and mean annual temperature were obtained from IMD (India
Meteorological Department). The rainfall and temperature data were available at half
and one degree grid, respectively. The soil depth was extracted from the soil map
prepared at 1:1 million scale by National Bureau of Soil Survey and Land Use Planning,
Nagpur. The soil depth was segregated from this map and reclassified and appended
with the map as a new field. The proximity drivers viz., distance to built-up, distance to
forests and distance to water bodies were derived from LULC maps of 1995 and 2005
using Euclidean distance in Arc GIS software. All the datasets were rasterized at
(250m×250m) and normalized between 0 and 1, so as to balance the range of data
values (Fig. 4).
Normalization of data values is important because of the sensitivity of data
transformation in statistical analysis (logistic regression in the present case).
Normalization is done by dividing the value of each grid cell with the highest value of
cell data to achieve similar data range. Moreover, in the multivariate analysis such as
logistic regression, the independent variables should have a similar scale to avoid
discrepancy in outcome (Veldkamp and Fresco, 1997; Verburg et al., 2004; Nefeslioglu
et al., 2008). After normalization, the raster data were converted to ASCII files and used
for statistical analysis in SPSS software.
Statistical analysis between drivers and LULC change
To analyse the relationship between LULC classes (dependent variables) and
possible driving factors (independent variables), logistic regression has been used. The
analysis was performed between LULC classes and drivers of 1995 and 2005,
respectively. The regression was run specifically for classes which are undergoing
significant changes like built-up, cropland, forest, water bodies, barren land, wasteland
Bansal et al.: Land use and land cover dynamics in Yamuna river basin
- 780 -
APPLIED ECOLOGY AND ENVIRONMENTAL RESEARCH 14(3): 773-792.
http://www.aloki.hu ● ISSN 1589 1623 (Print) ● ISSN 1785 0037 (Online)
DOI: http://dx.doi.org/10.15666/aeer/1403_773792
2016, ALÖKI Kft., Budapest, Hungary
and shrub land. Since the driver datasets were prepared at coarse resolution, the
regression was not performed for classes having smaller areas like permanent wetland,
grassland and plantation to avoid meaningless results due to difference in scales. The
total number of independent variables used to explain the spatial patterns of LULC are
twelve. The regression was run separately for each class with individual drivers.
Logistic regression is adopted for analysis because of dichotomous nature of LULC
classes (Mac Nally, 2000; Millington et al., 2007; Martinez et al., 2011). The SPSS
package is used to carry out regression analysis.
Figure 4. Normalized drivers datasets used in the study
The β values were used to express the possible relationship between LULC classes
and driving forces. Multi-collinearity between driving factors has been checked before
running the regression in order to reduce the errors in parameter estimates and biasness
in the outcome (MacNally, 2000). For testing multi-collinearity between independent
variables, tolerance values (1 − R2) and variance inflation factors (VIF) were used. If
VIF values are smaller than 10 and the tolerance values are greater than 0.1, it indicates
that there is no multi-collinearity issue between the drivers (Obrien, 2007).
The goodness of fit of the model is evaluated by relative operating characteristic
(ROC) Curve. The ROC indicates whether the spatial pattern of LULC classes can be
easily explained by the independent variables. The ROC value above 0.5 is good, above
Bansal et al.: Land use and land cover dynamics in Yamuna river basin
- 781 -
APPLIED ECOLOGY AND ENVIRONMENTAL RESEARCH 14(3): 773-792.
http://www.aloki.hu ● ISSN 1589 1623 (Print) ● ISSN 1785 0037 (Online)
DOI: http://dx.doi.org/10.15666/aeer/1403_773792
2016, ALÖKI Kft., Budapest, Hungary
0.6 is better and value closer to 1 is categorized as perfect for the logistic regression
model performance (Hosmer and Lemeshow, 2000; Pontius and Schneider, 2001).
Results
Land use and land cover change analysis
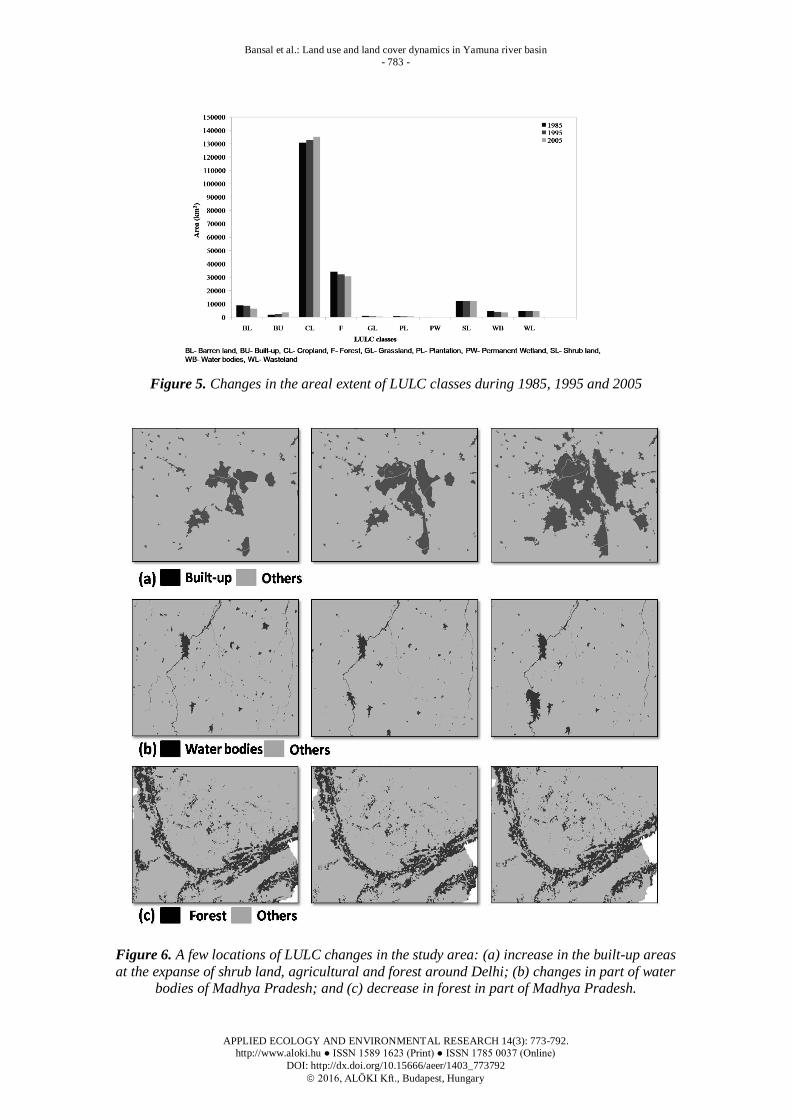
The areal extent of LULC classes in the study area is shown in Table 4. The results
of LULC changes from 1985 to 1995, 1995 to 2005 and 1985 to 2005 are summarized
in Tables 5a, 5b and 5c, respectively. It is observed from Table 4 that cropland is the
dominant LULC type with 66.1% area in 1985, 67.2% area in 1995 and 67.9% area in
2005. Cropland and built-up classes show increasing trend from 1985 to 2005. There is
a continuous increase in built-up areas around major cities like Delhi during study
period as a result of development in various sectors like employment opportunities,
better socioeconomic conditions for living and technology. On the other hand, forest
shows decreasing trend from 1985 to 2005. This decrease in forest cover is mainly
attributed to fragmentation, urbanisation, cropland expansion and construction of
reservoirs and dams. Grassland, barren land, permanent wetland and water bodies also
show decreasing trend from 1985 to 2005. In case of plantation class, its areal extent
decreases marginally from 1985 to 1995 and increases from 1995 to 2005. An
increasing trend is observed in case of shrub land and wasteland, while water bodies
show decreasing trend.
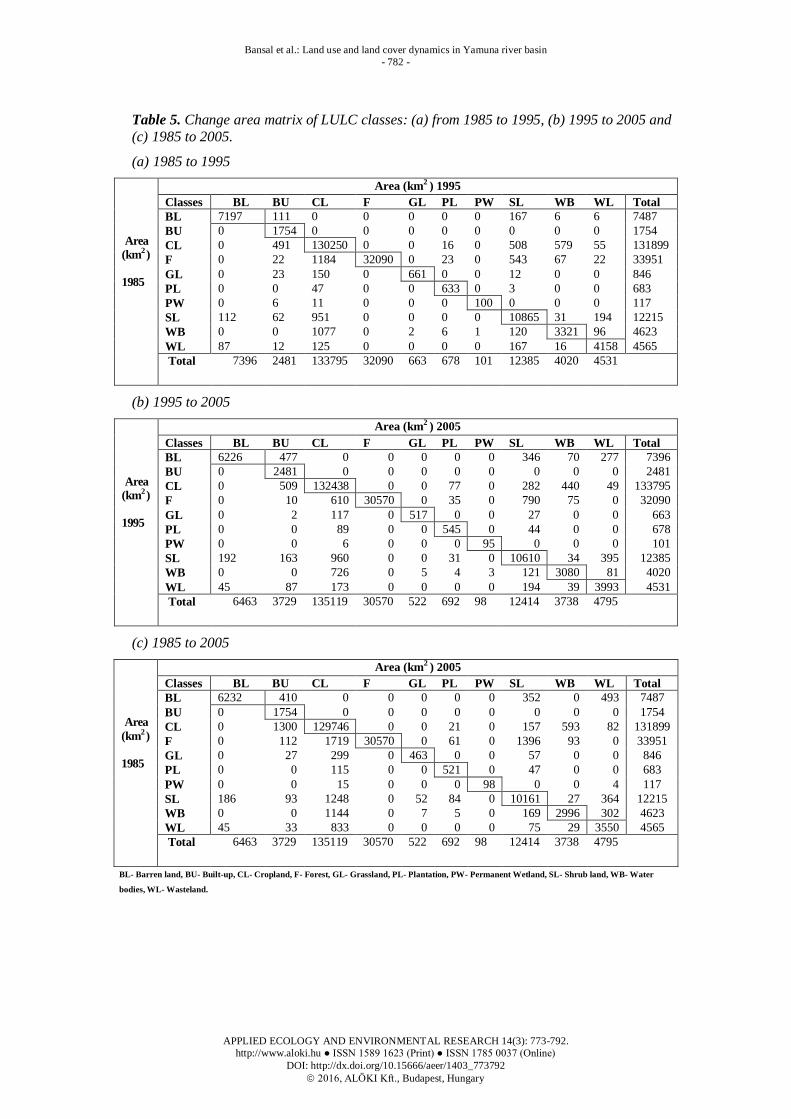
The transition of one LULC class to other LULC class can be seen from Tables 5a,
5b and 5c, respectively. The observation indicates that four LULC classes i.e. built-up,
cropland, forest and water bodies showed major conversions. There is a gain in built-up
and cropland areas. The change in built-up includes transitions from cropland, shrub
land, wasteland, grassland and forest. The gain in cropland includes transitions from
forests, grassland, shrub land, water bodies and wasteland. The forest and water bodies
also represent important transitions. The forest transition mainly includes transition to
cropland, shrub land, plantation and built-up areas. With respect to water bodies, it is
converted to cropland, shrub land and wasteland. The rest of LULC classes show minor
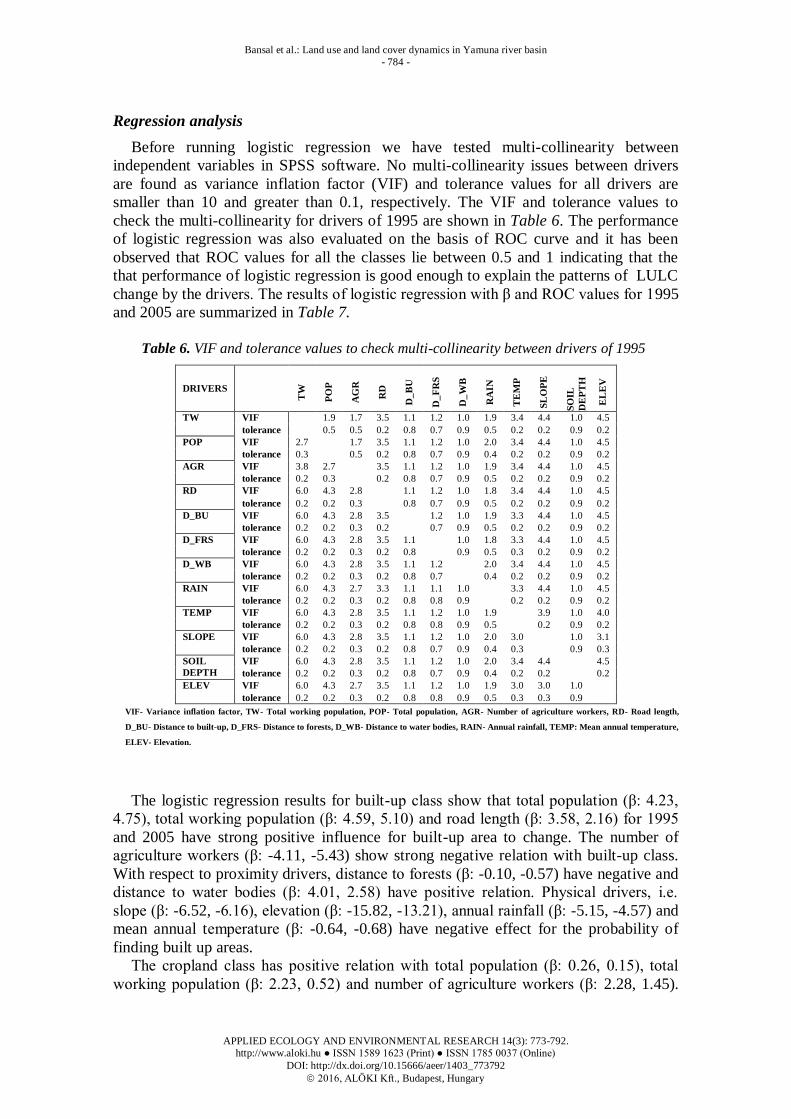
conversions. The change in areal extent of LULC classes and a few locations of LULC
change from 1985 to 2005 are shown in Fig. 5 and Fig. 6.
Table 4. Areal extent of LULC classes in 1985, 1995 and 2005
LULC
Classes
km2 % of Total Area
1985 1995 2005 1985 1995 2005
BL 7487 7396 6463 3.8 3.7 3.2
BU 1754 2481 3729 0.9 1.2 1.9
CL 131899 133795 135119 66.1 67.2 67.9
F 33951 32090 30570 17.1 16.1 15.4
GL 846 663 522 0.4 0.3 0.3
PL 683 678 692 0.3 0.3 0.3
PW 117 101 98 0.1 0.1 0.0
SL 12215 12385 12414 6.1 6.2 6.2
WB 4623 4020 3738 2.3 2.0 1.9
WL 4565 4531 4795 2.3 2.3 2.4
Bansal et al.: Land use and land cover dynamics in Yamuna river basin
- 782 -
APPLIED ECOLOGY AND ENVIRONMENTAL RESEARCH 14(3): 773-792.
http://www.aloki.hu ● ISSN 1589 1623 (Print) ● ISSN 1785 0037 (Online)
DOI: http://dx.doi.org/10.15666/aeer/1403_773792
2016, ALÖKI Kft., Budapest, Hungary
Table 5. Change area matrix of LULC classes: (a) from 1985 to 1995, (b) 1995 to 2005 and
(c) 1985 to 2005.
(a) 1985 to 1995
Area
(km2 )
1985
Area (km2
) 1995
Classes BL BU CL F GL PL PW SL WB WL Total
BL 7197 111 0 0 0 0 0 167 6 6 7487
BU 0 1754 0 0 0 0 0 0 0 0 1754
CL 0 491 130250 0 0 16 0 508 579 55 131899
F 0 22 1184 32090 0 23 0 543 67 22 33951
GL 0 23 150 0 661 0 0 12 0 0 846
PL 0 0 47 0 0 633 0 3 0 0 683
PW 0 6 11 0 0 0 100 0 0 0 117
SL 112 62 951 0 0 0 0 10865 31 194 12215
WB 0 0 1077 0 2 6 1 120 3321 96 4623
WL 87 12 125 0 0 0 0 167 16 4158 4565
Total 7396 2481 133795 32090 663 678 101 12385 4020 4531
(b) 1995 to 2005
Area
(km2 )
1995
Area (km2
) 2005
Classes BL BU CL F GL PL PW SL WB WL Total
BL 6226 477 0 0 0 0 0 346 70 277 7396
BU 0 2481 0 0 0 0 0 0 0 0 2481
CL 0 509 132438 0 0 77 0 282 440 49 133795
F 0 10 610 30570 0 35 0 790 75 0 32090
GL 0 2 117 0 517 0 0 27 0 0 663
PL 0 0 89 0 0 545 0 44 0 0 678
PW 0 0 6 0 0 0 95 0 0 0 101
SL 192 163 960 0 0 31 0 10610 34 395 12385
WB 0 0 726 0 5 4 3 121 3080 81 4020
WL 45 87 173 0 0 0 0 194 39 3993 4531
Total 6463 3729 135119 30570 522 692 98 12414 3738 4795
(c) 1985 to 2005
Area
(km2 )
1985
Area (km2 ) 2005
Classes BL BU CL F GL PL PW SL WB WL Total
BL 6232 410 0 0 0 0 0 352 0 493 7487
BU 0 1754 0 0 0 0 0 0 0 0 1754
CL 0 1300 129746 0 0 21 0 157 593 82 131899
F 0 112 1719 30570 0 61 0 1396 93 0 33951
GL 0 27 299 0 463 0 0 57 0 0 846
PL 0 0 115 0 0 521 0 47 0 0 683
PW 0 0 15 0 0 0 98 0 0 4 117
SL 186 93 1248 0 52 84 0 10161 27 364 12215
WB 0 0 1144 0 7 5 0 169 2996 302 4623
WL 45 33 833 0 0 0 0 75 29 3550 4565
Total 6463 3729 135119 30570 522 692 98 12414 3738 4795
BL- Barren land, BU- Built-up, CL- Cropland, F- Forest, GL- Grassland, PL- Plantation, PW- Permanent Wetland, SL- Shrub land, WB- Water
bodies, WL- Wasteland.
Bansal et al.: Land use and land cover dynamics in Yamuna river basin
- 783 -
APPLIED ECOLOGY AND ENVIRONMENTAL RESEARCH 14(3): 773-792.
http://www.aloki.hu ● ISSN 1589 1623 (Print) ● ISSN 1785 0037 (Online)
DOI: http://dx.doi.org/10.15666/aeer/1403_773792
2016, ALÖKI Kft., Budapest, Hungary
Figure 5. Changes in the areal extent of LULC classes during 1985, 1995 and 2005
Figure 6. A few locations of LULC changes in the study area: (a) increase in the built-up areas
at the expanse of shrub land, agricultural and forest around Delhi; (b) changes in part of water bodies of Madhya Pradesh; and (c) decrease in forest in part of Madhya Pradesh.
Bansal et al.: Land use and land cover dynamics in Yamuna river basin
- 784 -
APPLIED ECOLOGY AND ENVIRONMENTAL RESEARCH 14(3): 773-792.
http://www.aloki.hu ● ISSN 1589 1623 (Print) ● ISSN 1785 0037 (Online)
DOI: http://dx.doi.org/10.15666/aeer/1403_773792
2016, ALÖKI Kft., Budapest, Hungary
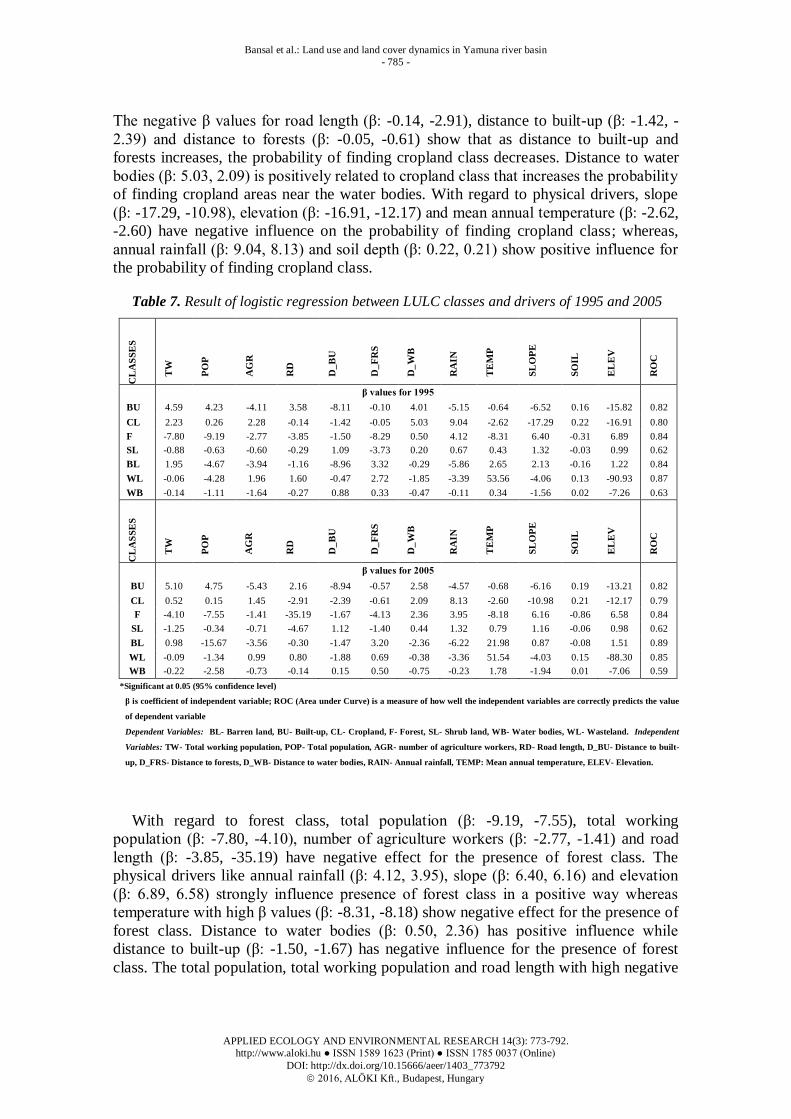
Regression analysis
Before running logistic regression we have tested multi-collinearity between
independent variables in SPSS software. No multi-collinearity issues between drivers
are found as variance inflation factor (VIF) and tolerance values for all drivers are
smaller than 10 and greater than 0.1, respectively. The VIF and tolerance values to
check the multi-collinearity for drivers of 1995 are shown in Table 6. The performance
of logistic regression was also evaluated on the basis of ROC curve and it has been
observed that ROC values for all the classes lie between 0.5 and 1 indicating that the
that performance of logistic regression is good enough to explain the patterns of LULC
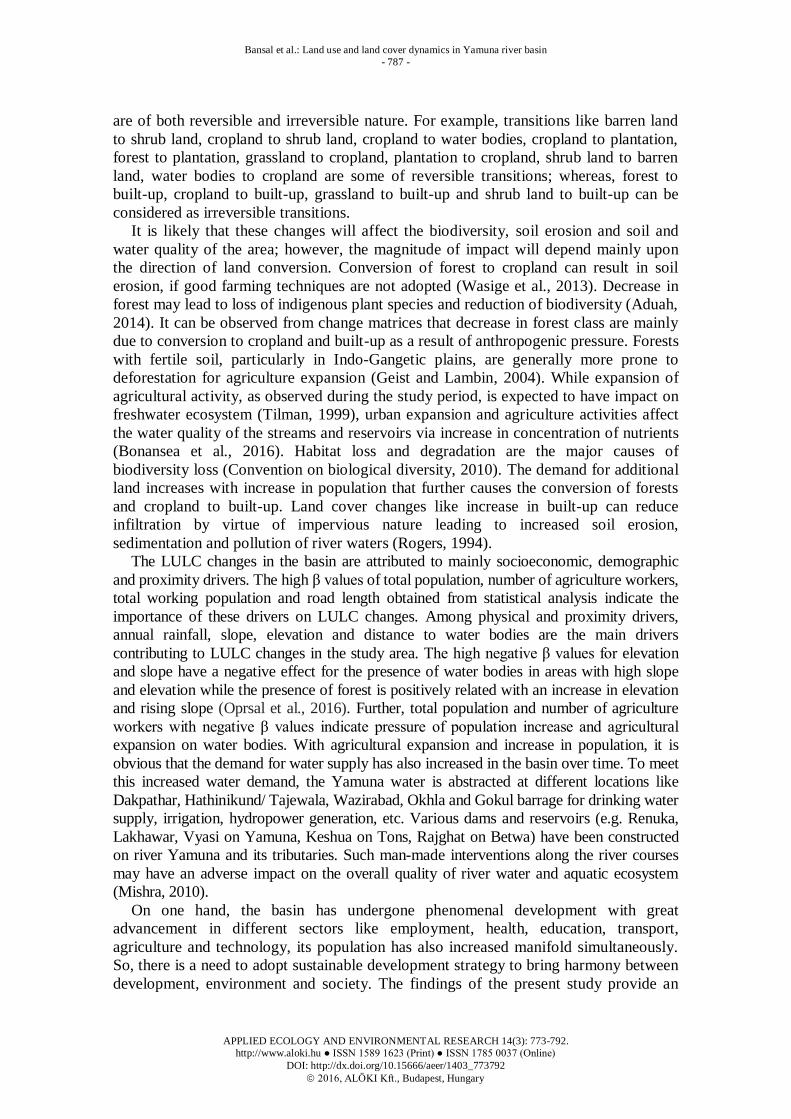
change by the drivers. The results of logistic regression with β and ROC values for 1995
and 2005 are summarized in Table 7.
Table 6. VIF and tolerance values to check multi-collinearity between drivers of 1995
DRIVERS
TW
PO
P
AG
R
RD
D_
BU
D_
FR
S
D_
WB
RA
IN
TE
MP
SL
OP
E
SO
IL
DE
PT
H
EL
EV
TW VIF
1.9 1.7 3.5 1.1 1.2 1.0 1.9 3.4 4.4 1.0 4.5
tolerance 0.5 0.5 0.2 0.8 0.7 0.9 0.5 0.2 0.2 0.9 0.2
POP VIF 2.7
1.7 3.5 1.1 1.2 1.0 2.0 3.4 4.4 1.0 4.5
tolerance 0.3 0.5 0.2 0.8 0.7 0.9 0.4 0.2 0.2 0.9 0.2
AGR VIF 3.8 2.7
3.5 1.1 1.2 1.0 1.9 3.4 4.4 1.0 4.5
tolerance 0.2 0.3 0.2 0.8 0.7 0.9 0.5 0.2 0.2 0.9 0.2
RD VIF 6.0 4.3 2.8
1.1 1.2 1.0 1.8 3.4 4.4 1.0 4.5
tolerance 0.2 0.2 0.3 0.8 0.7 0.9 0.5 0.2 0.2 0.9 0.2
D_BU VIF 6.0 4.3 2.8 3.5 1.2 1.0 1.9 3.3 4.4 1.0 4.5
tolerance 0.2 0.2 0.3 0.2 0.7 0.9 0.5 0.2 0.2 0.9 0.2
D_FRS VIF 6.0 4.3 2.8 3.5 1.1
1.0 1.8 3.3 4.4 1.0 4.5
tolerance 0.2 0.2 0.3 0.2 0.8 0.9 0.5 0.3 0.2 0.9 0.2
D_WB VIF 6.0 4.3 2.8 3.5 1.1 1.2
2.0 3.4 4.4 1.0 4.5
tolerance 0.2 0.2 0.3 0.2 0.8 0.7 0.4 0.2 0.2 0.9 0.2
RAIN VIF 6.0 4.3 2.7 3.3 1.1 1.1 1.0
3.3 4.4 1.0 4.5
tolerance 0.2 0.2 0.3 0.2 0.8 0.8 0.9 0.2 0.2 0.9 0.2
TEMP VIF 6.0 4.3 2.8 3.5 1.1 1.2 1.0 1.9
3.9 1.0 4.0
tolerance 0.2 0.2 0.3 0.2 0.8 0.8 0.9 0.5 0.2 0.9 0.2
SLOPE VIF 6.0 4.3 2.8 3.5 1.1 1.2 1.0 2.0 3.0
1.0 3.1
tolerance 0.2 0.2 0.3 0.2 0.8 0.7 0.9 0.4 0.3 0.9 0.3
SOIL
DEPTH
VIF 6.0 4.3 2.8 3.5 1.1 1.2 1.0 2.0 3.4 4.4
4.5
tolerance 0.2 0.2 0.3 0.2 0.8 0.7 0.9 0.4 0.2 0.2 0.2
ELEV VIF 6.0 4.3 2.7 3.5 1.1 1.2 1.0 1.9 3.0 3.0 1.0
tolerance 0.2 0.2 0.3 0.2 0.8 0.8 0.9 0.5 0.3 0.3 0.9
VIF- Variance inflation factor, TW- Total working population, POP- Total population, AGR- Number of agriculture workers, RD- Road length,
D_BU- Distance to built-up, D_FRS- Distance to forests, D_WB- Distance to water bodies, RAIN- Annual rainfall, TEMP: Mean annual temperature,
ELEV- Elevation.
The logistic regression results for built-up class show that total population (β: 4.23,
4.75), total working population (β: 4.59, 5.10) and road length (β: 3.58, 2.16) for 1995
and 2005 have strong positive influence for built-up area to change. The number of
agriculture workers (β: -4.11, -5.43) show strong negative relation with built-up class.
With respect to proximity drivers, distance to forests (β: -0.10, -0.57) have negative and
distance to water bodies (β: 4.01, 2.58) have positive relation. Physical drivers, i.e.
slope (β: -6.52, -6.16), elevation (β: -15.82, -13.21), annual rainfall (β: -5.15, -4.57) and
mean annual temperature (β: -0.64, -0.68) have negative effect for the probability of
finding built up areas.
The cropland class has positive relation with total population (β: 0.26, 0.15), total
working population (β: 2.23, 0.52) and number of agriculture workers (β: 2.28, 1.45).
Bansal et al.: Land use and land cover dynamics in Yamuna river basin
- 785 -
APPLIED ECOLOGY AND ENVIRONMENTAL RESEARCH 14(3): 773-792.
http://www.aloki.hu ● ISSN 1589 1623 (Print) ● ISSN 1785 0037 (Online)
DOI: http://dx.doi.org/10.15666/aeer/1403_773792
2016, ALÖKI Kft., Budapest, Hungary
The negative β values for road length (β: -0.14, -2.91), distance to built-up (β: -1.42, -
2.39) and distance to forests (β: -0.05, -0.61) show that as distance to built-up and
forests increases, the probability of finding cropland class decreases. Distance to water
bodies (β: 5.03, 2.09) is positively related to cropland class that increases the probability
of finding cropland areas near the water bodies. With regard to physical drivers, slope
(β: -17.29, -10.98), elevation (β: -16.91, -12.17) and mean annual temperature (β: -2.62,
-2.60) have negative influence on the probability of finding cropland class; whereas,
annual rainfall (β: 9.04, 8.13) and soil depth (β: 0.22, 0.21) show positive influence for
the probability of finding cropland class.
Table 7. Result of logistic regression between LULC classes and drivers of 1995 and 2005
CL
AS
SE
S
TW
PO
P
AG
R
RD
D_
BU
D_
FR
S
D_
WB
RA
IN
TE
MP
SL
OP
E
SO
IL
EL
EV
RO
C
β values for 1995
BU 4.59 4.23 -4.11 3.58 -8.11 -0.10 4.01 -5.15 -0.64 -6.52 0.16 -15.82 0.82
CL 2.23 0.26 2.28 -0.14 -1.42 -0.05 5.03 9.04 -2.62 -17.29 0.22 -16.91 0.80
F -7.80 -9.19 -2.77 -3.85 -1.50 -8.29 0.50 4.12 -8.31 6.40 -0.31 6.89 0.84
SL -0.88 -0.63 -0.60 -0.29 1.09 -3.73 0.20 0.67 0.43 1.32 -0.03 0.99 0.62
BL 1.95 -4.67 -3.94 -1.16 -8.96 3.32 -0.29 -5.86 2.65 2.13 -0.16 1.22 0.84
WL -0.06 -4.28 1.96 1.60 -0.47 2.72 -1.85 -3.39 53.56 -4.06 0.13 -90.93 0.87
WB -0.14 -1.11 -1.64 -0.27 0.88 0.33 -0.47 -0.11 0.34 -1.56 0.02 -7.26 0.63
CL
AS
SE
S
TW
PO
P
AG
R
RD
D_
BU
D_
FR
S
D_
WB
RA
IN
TE
MP
SL
OP
E
SO
IL
EL
EV
RO
C
β values for 2005
BU 5.10 4.75 -5.43 2.16 -8.94 -0.57 2.58 -4.57 -0.68 -6.16 0.19 -13.21 0.82
CL 0.52 0.15 1.45 -2.91 -2.39 -0.61 2.09 8.13 -2.60 -10.98 0.21 -12.17 0.79
F -4.10 -7.55 -1.41 -35.19 -1.67 -4.13 2.36 3.95 -8.18 6.16 -0.86 6.58 0.84
SL -1.25 -0.34 -0.71 -4.67 1.12 -1.40 0.44 1.32 0.79 1.16 -0.06 0.98 0.62
BL 0.98 -15.67 -3.56 -0.30 -1.47 3.20 -2.36 -6.22 21.98 0.87 -0.08 1.51 0.89
WL -0.09 -1.34 0.99 0.80 -1.88 0.69 -0.38 -3.36 51.54 -4.03 0.15 -88.30 0.85
WB -0.22 -2.58 -0.73 -0.14 0.15 0.50 -0.75 -0.23 1.78 -1.94 0.01 -7.06 0.59
*Significant at 0.05 (95% confidence level)
β is coefficient of independent variable; ROC (Area under Curve) is a measure of how well the independent variables are correctly predicts the value
of dependent variable
Dependent Variables: BL- Barren land, BU- Built-up, CL- Cropland, F- Forest, SL- Shrub land, WB- Water bodies, WL- Wasteland. Independent
Variables: TW- Total working population, POP- Total population, AGR- number of agriculture workers, RD- Road length, D_BU- Distance to built-
up, D_FRS- Distance to forests, D_WB- Distance to water bodies, RAIN- Annual rainfall, TEMP: Mean annual temperature, ELEV- Elevation.
With regard to forest class, total population (β: -9.19, -7.55), total working
population (β: -7.80, -4.10), number of agriculture workers (β: -2.77, -1.41) and road
length (β: -3.85, -35.19) have negative effect for the presence of forest class. The
physical drivers like annual rainfall (β: 4.12, 3.95), slope (β: 6.40, 6.16) and elevation
(β: 6.89, 6.58) strongly influence presence of forest class in a positive way whereas
temperature with high β values (β: -8.31, -8.18) show negative effect for the presence of
forest class. Distance to water bodies (β: 0.50, 2.36) has positive influence while
distance to built-up (β: -1.50, -1.67) has negative influence for the presence of forest
class. The total population, total working population and road length with high negative

Bansal et al.: Land use and land cover dynamics in Yamuna river basin
- 786 -
APPLIED ECOLOGY AND ENVIRONMENTAL RESEARCH 14(3): 773-792.
http://www.aloki.hu ● ISSN 1589 1623 (Print) ● ISSN 1785 0037 (Online)
DOI: http://dx.doi.org/10.15666/aeer/1403_773792
2016, ALÖKI Kft., Budapest, Hungary
β values and physical drivers (elevation, slope and annual rainfall) with high positive β
values influence the probability of presence of forests.
In case of water bodies, total population (β: -1.11, -2.58), total working population
(β: -0.14, -0.22), number of agriculture workers (β: -1.64, -0.73) and road length (β: -
0.27, -0.14) have negative correlation which shows that as values of these drivers
increases, there is a possibility of decrease in water bodies areas. Distance to built-up
(β: 0.88, 0.15) and distance to forests (β: 0.33, 0.50) have positive effect for the
presence of water bodies. Physical drivers like annual rainfall (β: -0.11, -0.23), slope (β:
-1.56, -1.94) and elevation (β: -7.26, -7.06) have negative and mean annual temperature
(β: 0.34, 1.78) has positive relation with water bodies. The total population and number
of agriculture workers with negative β values indicate pressure on the water bodies.
In case of shrub land class, total population (β: -0.63, -0.34), total working
population (β: -0.88, -1.25), number of agriculture workers (β: -0.60, -0.71) and road
length (β: -0.29, -4.67) have negative effect for the presence of shrub land class.
Proximity drivers like distance to built-up (β: 1.09, 1.12) and distance to water bodies
(β: 0.20, 0.44) have positive relation while distance to forests (β: -3.73, -1.40) has
negative relation with shrub land class. Physical drivers like annual rainfall (β: 0.67,
1.32), mean annual temperature (β: 0.43, 0.79), slope (β: 1.32, 1.16) and elevation (β:
0.99, 0.98) show positive relation while soil depth (β: -0.03, -0.06) show negative
relation for the presence of shrub land.
In case of barren land, socioeconomic drivers like total population (β: -4.67, -15.67),
number of agriculture workers (β: -3.94, -3.56) and road length (β: -1.16, -0.30) show
negative relation while total working population (β: 1.95, 0.98) show positive relation.
The increase in distance to built-up (β: -8.96, -1.47) and distance to water bodies (β: -
0.29, -2.36) decreases the probability of finding barren land decreases. Distance to
forests show positive (β: 3.32, 3.20) relation with barren land. Physical drivers like
annual rainfall (β: -5.86, -6.22) and soil depth (β: -0.16, -0.08) have negative relation
while mean annual temperature (β: 2.65, 21.98), slope (β: 2.13, 0.87) and elevation (β:
1.22, 1.51) have positive relation for the presence of barren land.
In case of wasteland class, total population (β: -4.28, -1.34) and total working population
(β: -0.06, -0.09) have negative influence while number of agriculture workers (β: 1.96, 0.99)
and road length (β: 1.60, 0.80) have positive influence. Distance to water bodies (β: -1.85, -
0.38) and distance to built-up (β: -0.47, -1.88) show negative effect whereas distance to
forests (β: 2.72, 0.69) shows positive effect for the presence of wasteland class. Very strong
positive relation (β: 53.56, 51.54) with temperature and negative relation (β: -90.93, -88.30)
with elevation are observed for the wasteland class. Thus, physical and proximity drivers
strongly influence barren land and wasteland classes.
In summary, the above results indicate that LULC in the Yamuna river basin is
influenced by a multitude of drivers (socioeconomic, demographic, physical and
proximity drivers) in different combinations. Since physical drivers generally have very
low temporal variability, socioeconomic, demographic and proximity drivers mainly
control the LULC change processes in the study area in decreasing order of importance.
Discussion
The results indicate that significant LULC changes have occurred in the basin during
the study period. The major LULC changes include the continuous expansion of built-
up and cropland areas and shrinkage of forest areas. The LULC transitions in the study
Bansal et al.: Land use and land cover dynamics in Yamuna river basin
- 787 -
APPLIED ECOLOGY AND ENVIRONMENTAL RESEARCH 14(3): 773-792.
http://www.aloki.hu ● ISSN 1589 1623 (Print) ● ISSN 1785 0037 (Online)
DOI: http://dx.doi.org/10.15666/aeer/1403_773792
2016, ALÖKI Kft., Budapest, Hungary
are of both reversible and irreversible nature. For example, transitions like barren land
to shrub land, cropland to shrub land, cropland to water bodies, cropland to plantation,
forest to plantation, grassland to cropland, plantation to cropland, shrub land to barren
land, water bodies to cropland are some of reversible transitions; whereas, forest to
built-up, cropland to built-up, grassland to built-up and shrub land to built-up can be
considered as irreversible transitions.
It is likely that these changes will affect the biodiversity, soil erosion and soil and
water quality of the area; however, the magnitude of impact will depend mainly upon
the direction of land conversion. Conversion of forest to cropland can result in soil
erosion, if good farming techniques are not adopted (Wasige et al., 2013). Decrease in
forest may lead to loss of indigenous plant species and reduction of biodiversity (Aduah,
2014). It can be observed from change matrices that decrease in forest class are mainly
due to conversion to cropland and built-up as a result of anthropogenic pressure. Forests
with fertile soil, particularly in Indo-Gangetic plains, are generally more prone to
deforestation for agriculture expansion (Geist and Lambin, 2004). While expansion of
agricultural activity, as observed during the study period, is expected to have impact on
freshwater ecosystem (Tilman, 1999), urban expansion and agriculture activities affect
the water quality of the streams and reservoirs via increase in concentration of nutrients
(Bonansea et al., 2016). Habitat loss and degradation are the major causes of
biodiversity loss (Convention on biological diversity, 2010). The demand for additional
land increases with increase in population that further causes the conversion of forests
and cropland to built-up. Land cover changes like increase in built-up can reduce
infiltration by virtue of impervious nature leading to increased soil erosion,
sedimentation and pollution of river waters (Rogers, 1994).
The LULC changes in the basin are attributed to mainly socioeconomic, demographic
and proximity drivers. The high β values of total population, number of agriculture workers,
total working population and road length obtained from statistical analysis indicate the
importance of these drivers on LULC changes. Among physical and proximity drivers,
annual rainfall, slope, elevation and distance to water bodies are the main drivers
contributing to LULC changes in the study area. The high negative β values for elevation
and slope have a negative effect for the presence of water bodies in areas with high slope
and elevation while the presence of forest is positively related with an increase in elevation
and rising slope (Oprsal et al., 2016). Further, total population and number of agriculture
workers with negative β values indicate pressure of population increase and agricultural
expansion on water bodies. With agricultural expansion and increase in population, it is
obvious that the demand for water supply has also increased in the basin over time. To meet
this increased water demand, the Yamuna water is abstracted at different locations like
Dakpathar, Hathinikund/ Tajewala, Wazirabad, Okhla and Gokul barrage for drinking water
supply, irrigation, hydropower generation, etc. Various dams and reservoirs (e.g. Renuka,
Lakhawar, Vyasi on Yamuna, Keshua on Tons, Rajghat on Betwa) have been constructed
on river Yamuna and its tributaries. Such man-made interventions along the river courses
may have an adverse impact on the overall quality of river water and aquatic ecosystem
(Mishra, 2010).
On one hand, the basin has undergone phenomenal development with great
advancement in different sectors like employment, health, education, transport,
agriculture and technology, its population has also increased manifold simultaneously.
So, there is a need to adopt sustainable development strategy to bring harmony between
development, environment and society. The findings of the present study provide an
Bansal et al.: Land use and land cover dynamics in Yamuna river basin
- 788 -
APPLIED ECOLOGY AND ENVIRONMENTAL RESEARCH 14(3): 773-792.
http://www.aloki.hu ● ISSN 1589 1623 (Print) ● ISSN 1785 0037 (Online)
DOI: http://dx.doi.org/10.15666/aeer/1403_773792
2016, ALÖKI Kft., Budapest, Hungary
understanding of LULC change processes which can be used as an input for sustainable
land management not only in Yamuna river basin but also in other similar river basins.
One of the major limitations of the present study is that the drivers, particularly
socioeconomic, demographic and meteorological (rainfall and temperature), were
available at different scales (resolutions). It required a considerable effort in collating
and converting the socioeconomic and demographic data available in tabular form to
geo-referenced spatial format before carrying out statistical analysis to explore
dependencies of drivers on LULC change. Despite limitations, the present study based
on remote sensing, GIS and statistical analysis clearly brings out the linkage between
LULC change and the drivers of such change at river basin scale. The statistical analysis
at different scales (i.e. grid size) may further improve understanding the causes of
LULC change. The results of this study provide first and foremost input towards
simulating future LULC scenario.
Conclusions
In this study, we have investigated LULC change and driving forces causing such
change in the Yamuna river basin of India. The major LULC changes observed during
1985-2005 at decadal interval are increase in cropland and built-up and decrease in
forest and water bodies. The dominant processes of the LULC changes include
transitions from forest, grassland, shrub land, water bodies and wasteland to cropland;
transitions from cropland, shrub land, wasteland, grassland and forest to built-up; and
conversion of forest to cropland, shrub land, plantation and built-up. The decrease in
forest cover is mainly attributed to fragmentation, urbanisation, cropland expansion and
construction of reservoirs and dams. Further, it is noticed that most of LULC transitions
in the study are reversible in nature.
The statistical analysis suggests that LULC changes are driven by a combination of
socioeconomic, demographic, physical and proximity drivers. However, in general it is
found that the socioeconomic, demographic and proximity drivers mainly influence the
LULC change processes in decreasing order of importance. The population increase
with accompanied development exerted pressure on existing land in pursuit of better
living standards leading to LULC change.
The present study is an example to understand the dynamics and causes of LULC
change using multiple techniques, i.e. remote sensing, GIS and statistics. Despite
limitations of having driver datasets at coarse and different scales, the study clearly
brings out the linkage between LULC change and the drivers of such change in a large
study area of river basin size. The statistical analysis at different scales (i.e. grid size)
may further improve understanding the causes of LULC change. The insights gained
through this study will be useful in simulating future LULC scenarios and thus in
providing inputs to sustainable land management policy making.
Acknowledgements. We thank ISRO-Geosphere Biosphere Programme (GBP) for making us available
decadal satellite images and reference LULC maps. We are thankful to ISRO-GBP LULC project team
for fruitful discussions. We also acknowledge Census of India, India Meteorological Department and
University of Maryland for socioeconomic, climatic data and satellite data, respectively. We are grateful
to Director, Indian Institute of Remote Sensing, Dehradun for encouragement and support to carry out this
study. We thank the anonymous reviewers for their helpful comments and suggestions to improve the
quality of this manuscript.
Bansal et al.: Land use and land cover dynamics in Yamuna river basin
- 789 -
APPLIED ECOLOGY AND ENVIRONMENTAL RESEARCH 14(3): 773-792.
http://www.aloki.hu ● ISSN 1589 1623 (Print) ● ISSN 1785 0037 (Online)
DOI: http://dx.doi.org/10.15666/aeer/1403_773792
2016, ALÖKI Kft., Budapest, Hungary
REFERENCES
[1] Aduah, M.S., Warburton, M.L., Jewitt, G. (2015): Analysis of land cover changes in the
Bonsa catchment, Ankobra basin, Ghana. –Applied ecology and environmental research 13(4): 935-955.
[2] Bonansea, M., Ledesma, C., Rodriguez, M.C. (2016): Assessing the impact of land use
and land cover on water quality in the watershed of a reservoir. –Applied ecology and
environmental research 14(2): 447-456.
[3] Congalton, R.G. (1991): A review of assessing the accuracy of classifications of remotely
sensed data. –Remote sensing of environment 37(1): 35-46.
[4] Hosmer, D.W., Lemeshow, S. (2000): Applied Logistic Regression. –John Wiley and
Sons, New Jersey, USA. [5] Lambin, E.F., Turner, B.L., Geist, H.J., Agbola, S.B., Angelsen, A., Bruce, J.W.,
Coomes, O.T., Dirzo, R., Fischer, G., Folke, C., George, P.S. (2001): The causes of land-
use and land-cover change: moving beyond the myths. –Global environmental
change 11(4): 261-269.
[6] Loveland, T.R., Belward, A.S. (1997): The IGBP-DIS global 1km land cover data set, DISCover: first results. –International Journal of Remote Sensing 18(15): 3289-3295.
[7] Mac Nally, R. (2000): Regression and model-building in conservation biology,
biogeography and ecology: the distinction between–and reconciliation of–‘predictive’and
‘explanatory’models. –Biodiversity & Conservation 9(5): 655-671. [8] Martinez, J.M.A., Suarez-Seoane, S., Calabuig, E.D.L. (2011): Modelling the risk of land
cover change from environmental and socio-economic drivers in heterogeneous and
changing landscapes: The role of uncertainty. –Landscape and Urban Planning 101(2): 108-119.
[9] Millington, J.D., Perry, G.L., Romero-Calcerrada, R. (2007): Regression techniques for
examining land use/cover change: a case study of a Mediterranean landscape. –Ecosystems 10(4): 562-578.
[10] Mishra, A.K. (2010): A River about to Die: Yamuna. –J. Water Resource and Protection
2: 489-500.
[11] Nefeslioglu, H.A., Gokceoglu, C., Sonmez, H. (2008): An assessment on the use of logistic regression and artificial neural networks with different sampling strategies for the
preparation of landslide susceptibility maps. –Engineering Geology 97(3): 171-191.
[12] Obrien, R.M. (2007): A caution regarding rules of thumb for variance inflation factors. –Quality & Quantity 41(5): 673-690.
[13] Oprsal, Z., Kladivo, P., Machar, I. (2016): The role of selected biophysical factors in
long-term land-use change of cultural landscape. –Applied ecology and environmental
research 14(2): 23-40. [14] Outlook, G.B. 3 (2010): Secretariat of the convention on biological diversity.
Montreal 94.
[15] Pontius, R.G., Schneider, L.C. (2001): Land-cover change model validation by an ROC method for the Ipswich watershed, Massachusetts, USA. –Agriculture, Ecosystems &
Environment 85(1): 239-248.
[16] Rai, R.K., Upadhyay, A., Ojha, C.S.P., Singh, V.P. (2012): Salient Features of the Yamuna River Basin. –Springer, Netherlands.
[17] Rogers, P. (1994): Hydrology and Water Quality. ‒ In: Meyer, W.B., Turner Ii, B.L.
(eds.) Changes in Land Use and Land Cover: A Global Perspective, Cambridge
University Press, Cambridge, UK. [18] Roy, P.S., Roy, A., Joshi, P.K., Kale, M.P., Srivastava, V.K., Srivastava, S.K., Dwevidi,
R.S., Joshi, C., Behera, M.D., Meiyappan, P., Sharma, Y. (2015): Development of
decadal (1985-1995-2005) land use and land cover database for India. –Remote Sensing 7(3): 2401.
Bansal et al.: Land use and land cover dynamics in Yamuna river basin
- 790 -
APPLIED ECOLOGY AND ENVIRONMENTAL RESEARCH 14(3): 773-792.
http://www.aloki.hu ● ISSN 1589 1623 (Print) ● ISSN 1785 0037 (Online)
DOI: http://dx.doi.org/10.15666/aeer/1403_773792
2016, ALÖKI Kft., Budapest, Hungary
[19] Shen, Z., Lu, C., Yin, R., Qi, J. (2013): Land cover changes in Northeast China from
the late 1970s to 2004. –Applied ecology and environmental research 11(1): 67-78.
[20] Tian, H., Banger, K., Bo, T., Dadhwal, V.K. (2014): History of land use in India during 1880–2010: Large-scale land transformations reconstructed from satellite data and
historical archives. –Global and Planetary Change 121: 78-88.
[21] Tilman, D. (1999): Global environmental impacts of agricultural expansion: the need for
sustainable and efficient practices. –Proceedings of the National Academy of Sciences 96(11): 5995-6000.
[22] Tripathi, A., Prasad, A.R. (2010): Agricultural development in India since independence:
A study on progress, performance, and determinants. –Journal of emerging knowledge on emerging markets 1(1): 8.
[23] United Nations Centre for Human Settlements (1996): An urbanizing world: global report
on human settlements. –Oxford University Press, USA.
[24] Veldkamp, A., Fresco, L.O. (1997): Reconstructing land use drivers and their spatial scale dependence for Costa Rica (1973 and 1984). –Agricultural systems 55(1): 19-43.
[25] Verburg, P.H., Van Eck, J.R.R., De Nijs, T.C., Dijst, M.J., Schot, P. (2004): Determinants
of land-use change patterns in the Netherlands. –Environment and Planning B: Planning and Design 31(1): 125-150.
[26] Viles, H., Goudie, A. (1997): The Earth Transformed: An Introduction to the Human
Impact on the Environment. –Blackwell, Oxford, UK. [27] Vu, Q.M., Le, Q.B., Frossard, E., Vlek, P.L. (2014): Socio-economic and biophysical
determinants of land degradation in Vietnam: An integrated causal analysis at the national
level. –Land Use Policy 36: 605-617.
[28] Wang, D., Gong, J., Chen, L., Zhang, L., Song, Y., Yue, Y. (2013): Comparative analysis of land use/cover change trajectories and their driving forces in two small watersheds in
the western Loess Plateau of China. –International Journal of Applied Earth Observation
and Geoinformation 21: 241-252. [29] Wasige, J.E., Groen, T.A., Smaling, E., Jetten, V. (2013): Monitoring basin-scale land
cover changes in Kagera Basin of Lake Victoria using ancillary data and remote
sensing. –International Journal of Applied Earth Observation and Geoinformation 21: 32-42.
[30] Yirsaw, E., Wu, W., Temesgen, H., Bekele, B. (2016): Effect of temporal land use/land
cover changes on Ecosystem Services Value in coastal area of China: the case of Su-Xi-
Chang region. –Applied ecology and environmental research 14(3): 409-422. [31] Zgola, T. (2014): The response of aquatic plants to catchment land use for different types
of lowland rivers. –Applied ecology and environmental research 12(1): 143-162.
Bansal et al.: Land use and land cover dynamics in Yamuna river basin
- 791 -
APPLIED ECOLOGY AND ENVIRONMENTAL RESEARCH 14(3): 773-792.
http://www.aloki.hu ● ISSN 1589 1623 (Print) ● ISSN 1785 0037 (Online)
DOI: http://dx.doi.org/10.15666/aeer/1403_773792
2016, ALÖKI Kft., Budapest, Hungary
APPENDICES
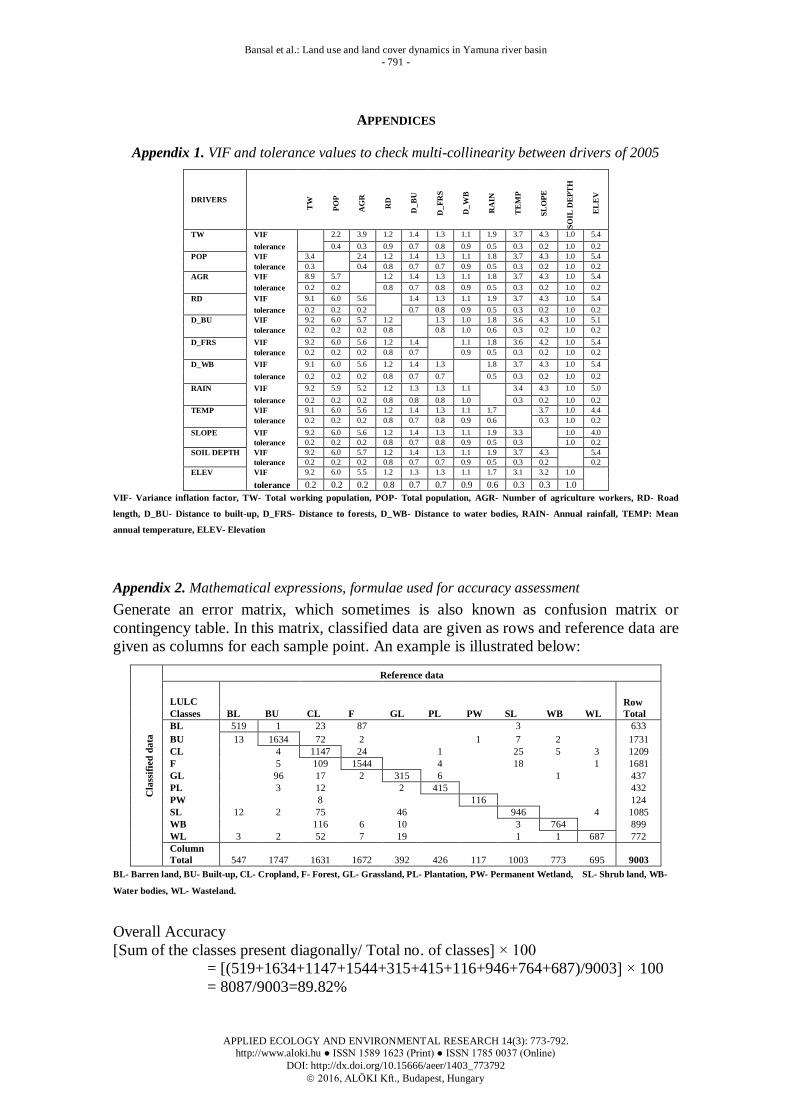
Appendix 1. VIF and tolerance values to check multi-collinearity between drivers of 2005
DRIVERS
TW
PO
P
AG
R
RD
D_
BU
D_
FR
S
D_
WB
RA
IN
TE
MP
SL
OP
E
SO
IL D
EP
TH
EL
EV
TW VIF 2.2 3.9 1.2 1.4 1.3 1.1 1.9 3.7 4.3 1.0 5.4
tolerance 0.4 0.3 0.9 0.7 0.8 0.9 0.5 0.3 0.2 1.0 0.2
POP VIF 3.4 2.4 1.2 1.4 1.3 1.1 1.8 3.7 4.3 1.0 5.4
tolerance 0.3 0.4 0.8 0.7 0.7 0.9 0.5 0.3 0.2 1.0 0.2
AGR VIF 8.9 5.7 1.2 1.4 1.3 1.1 1.8 3.7 4.3 1.0 5.4
tolerance 0.2 0.2 0.8 0.7 0.8 0.9 0.5 0.3 0.2 1.0 0.2
RD VIF 9.1 6.0 5.6 1.4 1.3 1.1 1.9 3.7 4.3 1.0 5.4
tolerance 0.2 0.2 0.2 0.7 0.8 0.9 0.5 0.3 0.2 1.0 0.2
D_BU VIF 9.2 6.0 5.7 1.2 1.3 1.0 1.8 3.6 4.3 1.0 5.1
tolerance 0.2 0.2 0.2 0.8 0.8 1.0 0.6 0.3 0.2 1.0 0.2
D_FRS VIF 9.2 6.0 5.6 1.2 1.4 1.1 1.8 3.6 4.2 1.0 5.4
tolerance 0.2 0.2 0.2 0.8 0.7 0.9 0.5 0.3 0.2 1.0 0.2
D_WB VIF 9.1 6.0 5.6 1.2 1.4 1.3 1.8 3.7 4.3 1.0 5.4
tolerance 0.2 0.2 0.2 0.8 0.7 0.7 0.5 0.3 0.2 1.0 0.2
RAIN VIF 9.2 5.9 5.2 1.2 1.3 1.3 1.1 3.4 4.3 1.0 5.0
tolerance 0.2 0.2 0.2 0.8 0.8 0.8 1.0 0.3 0.2 1.0 0.2
TEMP VIF 9.1 6.0 5.6 1.2 1.4 1.3 1.1 1.7 3.7 1.0 4.4
tolerance 0.2 0.2 0.2 0.8 0.7 0.8 0.9 0.6 0.3 1.0 0.2
SLOPE VIF 9.2 6.0 5.6 1.2 1.4 1.3 1.1 1.9 3.3 1.0 4.0
tolerance 0.2 0.2 0.2 0.8 0.7 0.8 0.9 0.5 0.3 1.0 0.2
SOIL DEPTH VIF 9.2 6.0 5.7 1.2 1.4 1.3 1.1 1.9 3.7 4.3 5.4
tolerance 0.2 0.2 0.2 0.8 0.7 0.7 0.9 0.5 0.3 0.2 0.2
ELEV VIF 9.2 6.0 5.5 1.2 1.3 1.3 1.1 1.7 3.1 3.2 1.0
tolerance 0.2 0.2 0.2 0.8 0.7 0.7 0.9 0.6 0.3 0.3 1.0
VIF- Variance inflation factor, TW- Total working population, POP- Total population, AGR- Number of agriculture workers, RD- Road
length, D_BU- Distance to built-up, D_FRS- Distance to forests, D_WB- Distance to water bodies, RAIN- Annual rainfall, TEMP: Mean
annual temperature, ELEV- Elevation
Appendix 2. Mathematical expressions, formulae used for accuracy assessment
Generate an error matrix, which sometimes is also known as confusion matrix or
contingency table. In this matrix, classified data are given as rows and reference data are
given as columns for each sample point. An example is illustrated below:
Cla
ssif
ied
da
ta
Reference data
LULC
BL BU CL F GL PL PW SL WB WL
Row
Total Classes
BL 519 1 23 87
3
633
BU 13 1634 72 2
1 7 2
1731
CL
4 1147 24
1
25 5 3 1209
F
5 109 1544
4
18
1 1681
GL
96 17 2 315 6
1
437
PL
3 12
2 415
432
PW
8
116
124
SL 12 2 75
46
946
4 1085
WB
116 6 10
3 764
899
WL 3 2 52 7 19
1 1 687 772
Column
Total 547 1747 1631 1672 392 426 117 1003 773 695 9003
BL- Barren land, BU- Built-up, CL- Cropland, F- Forest, GL- Grassland, PL- Plantation, PW- Permanent Wetland, SL- Shrub land, WB-
Water bodies, WL- Wasteland.
Overall Accuracy
[Sum of the classes present diagonally/ Total no. of classes] × 100
= [(519+1634+1147+1544+315+415+116+946+764+687)/9003] × 100
= 8087/9003=89.82%
Bansal et al.: Land use and land cover dynamics in Yamuna river basin
- 792 -
APPLIED ECOLOGY AND ENVIRONMENTAL RESEARCH 14(3): 773-792.
http://www.aloki.hu ● ISSN 1589 1623 (Print) ● ISSN 1785 0037 (Online)
DOI: http://dx.doi.org/10.15666/aeer/1403_773792
2016, ALÖKI Kft., Budapest, Hungary
Users accuracy
[Individual class present diagonally/ Row total of that class] × 100
For example user accuracy of Barren land class:
= [519/633] ×100=81.9%
Producer accuracy
[Individual class present diagonally/ Column total of that class] × 100
For example producer accuracy of Barren land class:
= [519/547] ×100=94.9%
Kappa coefficient
[Observed accuracy – Chance agreement]/ [1– Chance agreement]
Chance agreement = ∑[ Product of row and column marginals for each class]
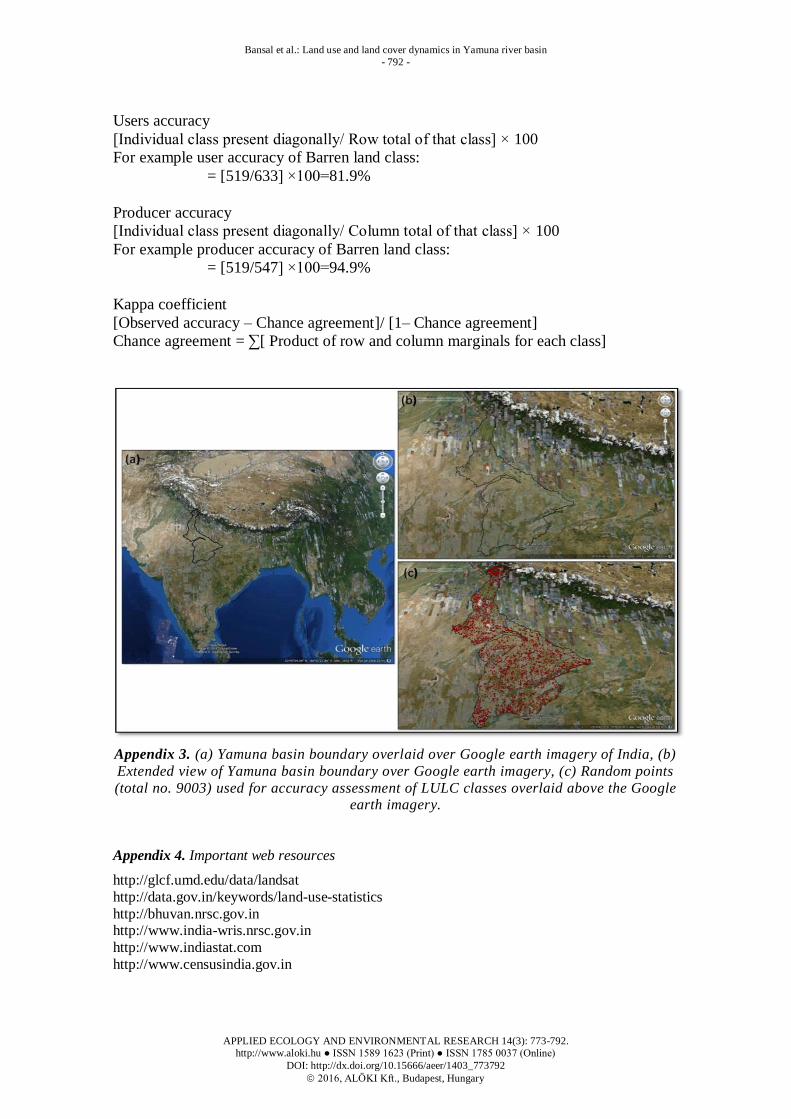
Appendix 3. (a) Yamuna basin boundary overlaid over Google earth imagery of India, (b)
Extended view of Yamuna basin boundary over Google earth imagery, (c) Random points
(total no. 9003) used for accuracy assessment of LULC classes overlaid above the Google earth imagery.
Appendix 4. Important web resources
http://glcf.umd.edu/data/landsat
http://data.gov.in/keywords/land-use-statistics
http://bhuvan.nrsc.gov.in http://www.india-wris.nrsc.gov.in
http://www.indiastat.com
http://www.censusindia.gov.in