ipe-k < lecture note 3> 2013.03.22
DESCRIPTION
IPE-K < Lecture Note 3> 2013.03.22. IPE -K: Technological Innovation and International Competitiveness * Some parts of this note are borrowed from references for teaching purpose only. Semester : Spring 2013 Time: Friday 9:00~12:00 am Class Room: No. 322 - PowerPoint PPT PresentationTRANSCRIPT
1
IPE-K <Lecture Note 3> 2013.03.22
IPE-K: Technological Innovation and International Competitiveness
*Some parts of this note are borrowed from references for teaching purpose only.
Semester: Spring 2013 Time: Friday 9:00~12:00 am Class Room: No. 322 Professor: Yoo Soo Hong Office Hour: By appointment Mobile: 010-4001-8060 E-mail: [email protected] Home P.: //yoosoohong.weebly.com

IT Industry Strong Engines for nation’s development
- Broadband Internet - Digital Multimedia Broadcasting - Wireless Broadband Internet - HD/LCD TV - IT Application to Automobile, Shipbuilding & Machinery
Shipbuilding Industry World’s 1st Shipbuilding country, Market Share 40 %, Drill ship
Korea’s World Class Enterprises
• SAMSUNG• HYUNDAI• LG• SK• POSCO
Korea Today
2

Contribution to the Korean economy by share: GDP (14%) and Export (30%)
CP(28.8%)
TFTLCD (41.3%)
DTV(13%)
MP3(20%)
Memory(45.0%)
(% in the world)Korean Electronics Leading the World Market
Miracle on the Han River
High accelerated growth - Exports - Rapid industrialization - Technological achievement - Education boom - Rapid urbanization - Exponential rise in living standards
‘Miracle’ - Rapid development of post war Korea into the 13th largest economy of the
world - A role model for many developing countries
5
0
2
4
6
8
10
12
14
1960 1965 1970 1975 1980 1985 1990 1995 2000
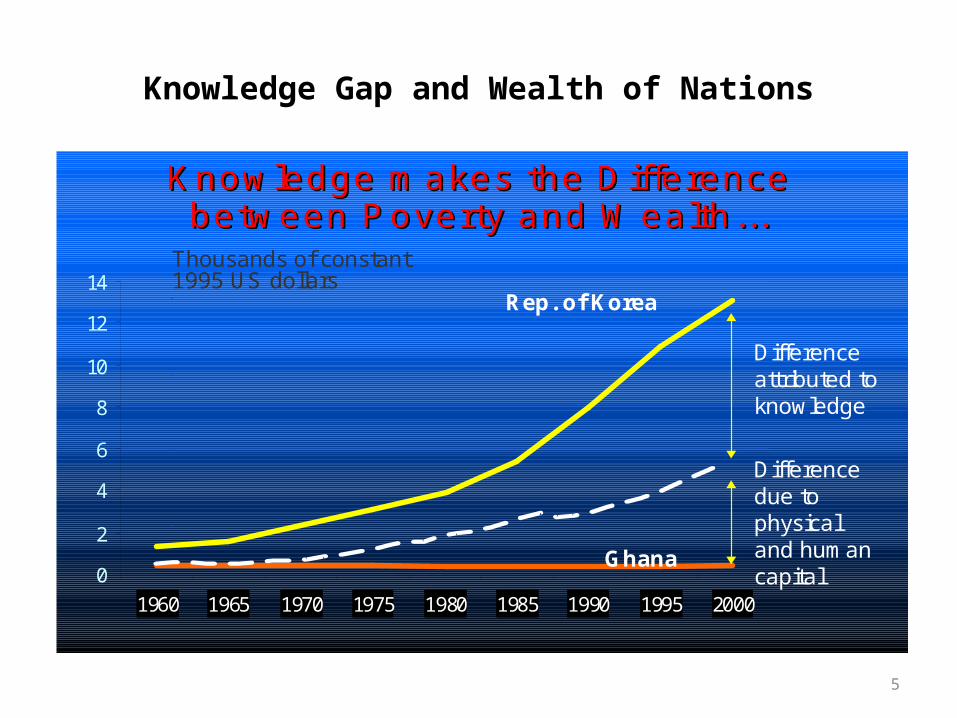
K n o w le d g e m a k e s th e D if fe re n c e K n o w le d g e m a k e s th e D if fe r e n c e b e tw e e n P o v e r ty a n d W e a lth . . .b e tw e e n P o v e r ty a n d W e a lth . . .
R e p . o f K o r e a
G h a n a
T h o u s a n d s o f c o n s ta n t 1 9 9 5 U S d o lla rs
D if fe re n c e a t t r ib u te d to k n o w le d g e
D if fe re n c e d u e to p h y s ic a l a n d h u m a n c a p ita l
Knowledge Gap and Wealth of Nations

Acquisition
Assimilation
Improvement
Creation
Capacity Building Stages and Model
DevelopingCountry
Newly-IndustrializingCountry
AdvancedCountry
Imitation internalization generatingS&T & R&D Stages
DevelopmentStages
6

Changes in the Interactions between the Gov-ernment and the Market (1980s)
Government-Driven Economic System (P-I)
Government
Finance Enterprises
Market Field
Government and Mar-ket Compromised Sys-
tem (P-II)
Government
Enterprises
Finance
Market Field
7
8
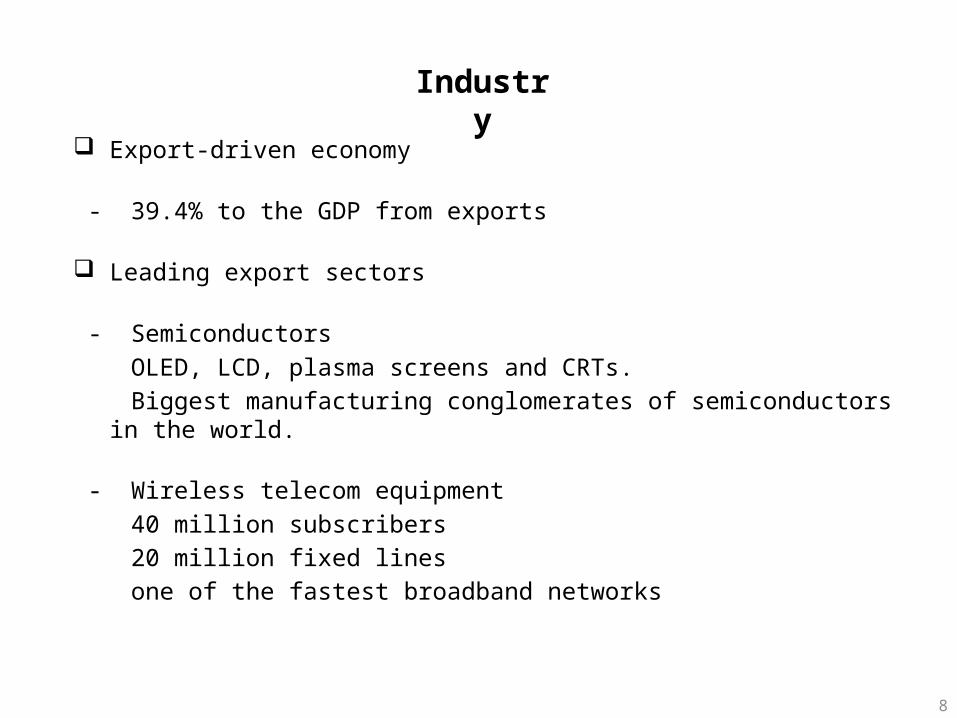
Export-driven economy
- 39.4% to the GDP from exports
Leading export sectors
- Semiconductors OLED, LCD, plasma screens and CRTs. Biggest manufacturing conglomerates of semiconductors in the world.
- Wireless telecom equipment 40 million subscribers 20 million fixed lines one of the fastest broadband networks
Industry
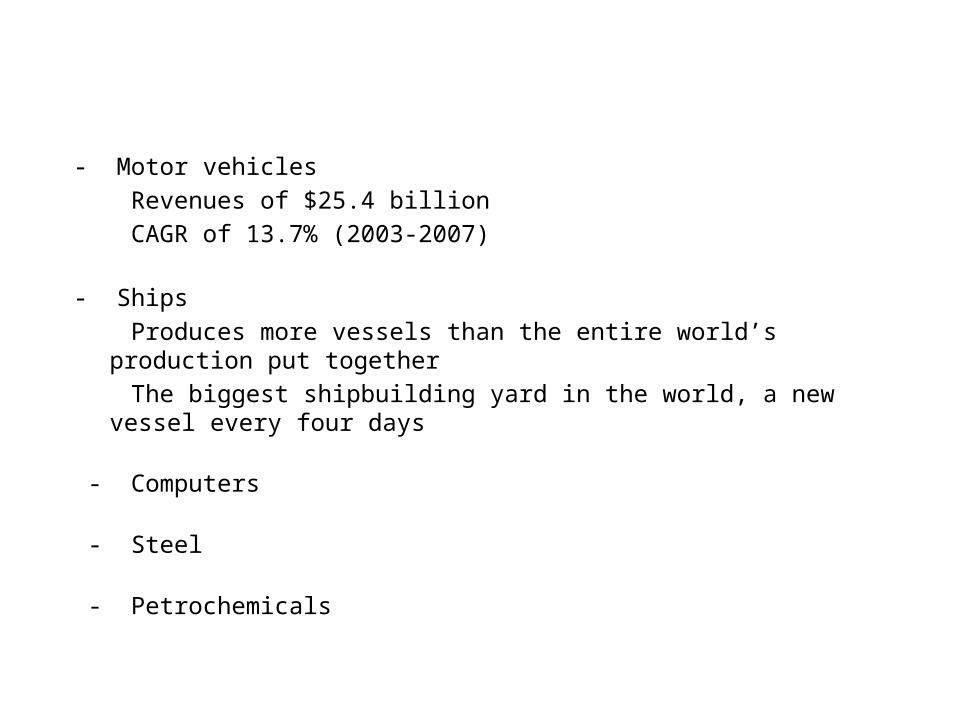
- Motor vehicles Revenues of $25.4 billion CAGR of 13.7% (2003-2007)
- Ships Produces more vessels than the entire world’s production put together The biggest shipbuilding yard in the world, a new vessel every four days
- Computers - Steel - Petrochemicals
10
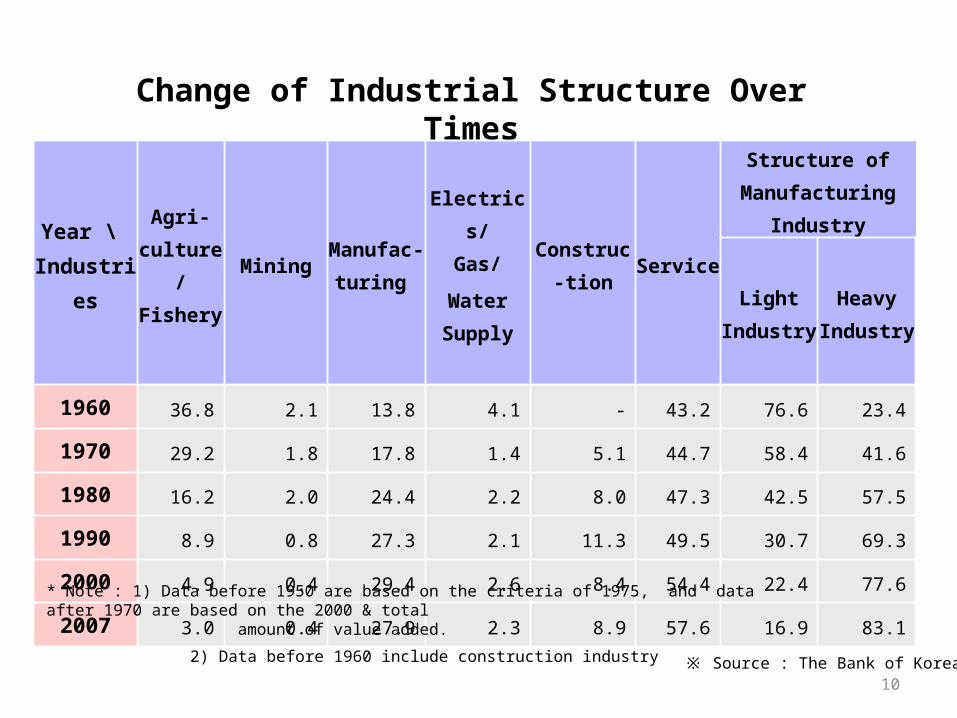
Change of Industrial Structure Over Times
Year \ Industries
Agri-culture/ Fishery
Mining Manufac-turing
Electrics/Gas/
Water Supply
Construc-tion Service
Structure of Manu-facturing Industry
Light In-dustry
Heavy In-dustry
1960 36.8 2.1 13.8 4.1 - 43.2 76.6 23.4
1970 29.2 1.8 17.8 1.4 5.1 44.7 58.4 41.6
1980 16.2 2.0 24.4 2.2 8.0 47.3 42.5 57.5
1990 8.9 0.8 27.3 2.1 11.3 49.5 30.7 69.3
2000 4.9 0.4 29.4 2.6 8.4 54.4 22.4 77.6
2007 3.0 0.4 27.9 2.3 8.9 57.6 16.9 83.1* Note : 1) Data before 1950 are based on the criteria of 1975, and data after 1970 are based on the 2000 & total amount of value added.
2) Data before 1960 include construction industry ※ Source : The Bank of Korea

Top 10 Leading Industries in the Republic of Korea’s Manufacturing Sectors
Source: Bank of Korea. National Accounts and Statistical Yearbook

12
Change of the Five Export Items by Year
1970 1980 1990 1995 2000 2005 2009
1st Textiles(40.8%)
Textiles(28.8%)
Clothing(11.7%)
Semi-conductor(14.1%)
Semi-conductor(15.1%)
Semi-conductor(10.5%)
Ship(12.4%)
2nd Plywood(11.0%)
Electronics(11.4%)
Semi-conductors
(7.0%)
Automobile(6.7%)
Computer(8.5%)
Automobile(10.4%)
Semi-conductor
(8.5%)
3rd Wig(10.8%)
Iron & Steel
(9.0%)
Footwear(6.6%)
Ship(4.5%)
Automobile(7.7%)
Mobile Phone(9.7%)
Mobile Phone (8.5%)
4th Iron Ore(5.9%)
Footwear(5.2%)
Media Equipment
(5.6%)
Artificial Fiber
(4.3%)
Petroleum Products (5.3%)
Ship(6.2%)
Display(7.0%)
5th Electronics(3.5%)
Ship(3.5%)
Ship(4.4%)
Media Equipment
(3,9%)
Ship(4,9%)
Petroleum Products (5.4%)
Automobile(7.0%)
To-tal 72.0% 57.9% 35.2% 33.6% 41.4% 42.2% 43.5%
13
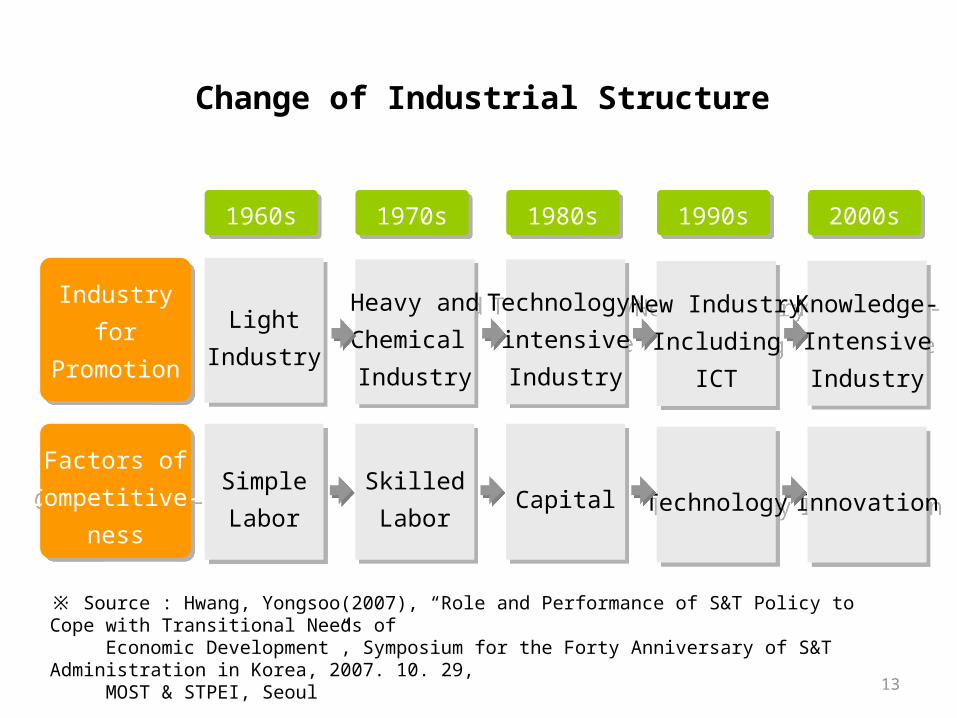
Change of Industrial Structure
※ Source : Hwang, Yongsoo(2007), “Role and Performance of S&T Policy to Cope with Transitional Needs of Economic Development”, Symposium for the Forty Anniversary of S&T Administration in Korea, 2007. 10. 29, MOST & STPEI, Seoul
1960s
Industryfor
Promotion
1970s 1980s 1990s 2000s
LightIndustry
Heavy andChemical Industry
Technology-intensiveIndustry
New IndustryIncluding
ICT
Knowledge-IntensiveIndustry
Factors ofCompetitive-
ness
SimpleLabor
SkilledLabor
Capital Technology Innovation

14
- Acquisition of technologies for development : ’60s and ’70s Development of light industries and heavy chemical industries for import substitution and export-expansion
- Generated enormous demand for technologies that were not available from domestic sources
Policy responses - Promotion of inward transfer of technologies - Developing domestic absorptive capacity to digest, assimilate and improve upon the transferred technologies
How Korea acquired technology for industrialization
Industrialization and S&T development
15
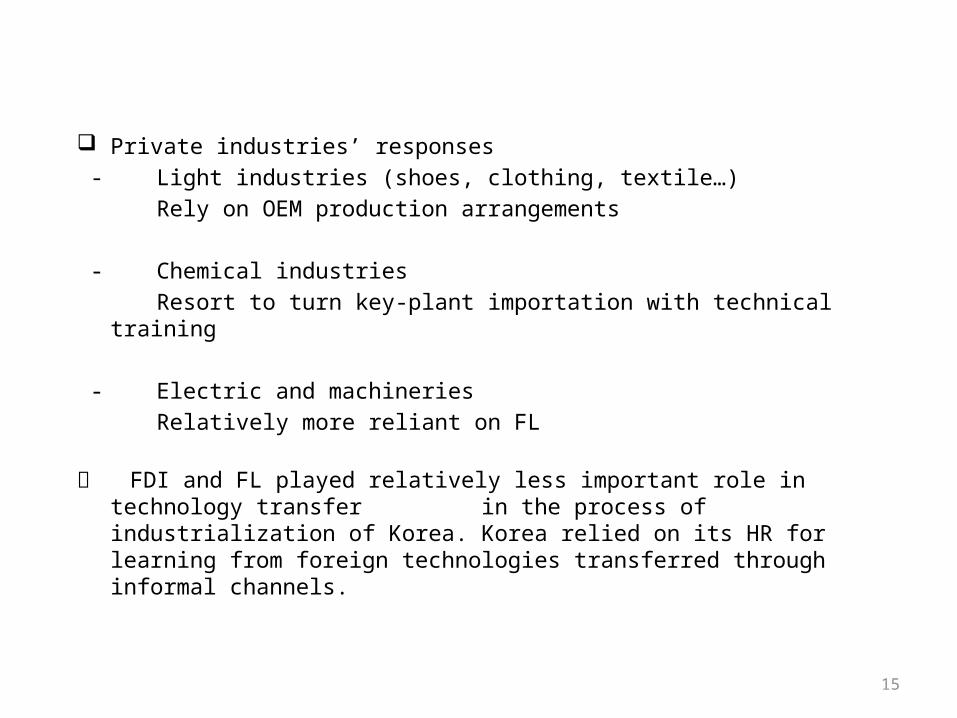
Private industries’ responses - Light industries (shoes, clothing, textile…) Rely on OEM production arrangements
- Chemical industries Resort to turn key-plant importation with technical training
- Electric and machineries Relatively more reliant on FL
FDI and FL played relatively less important role in technology transfer in the process of industrialization of Korea. Korea relied on its HR for learning from foreign technologies transferred through informal chan-nels.

16
- Korean economic growth into the 1980s • Increased demand for complex and sophisticated technologies• Increasing reluctance of foreign countries to transfer technologies to
Korea
- Policy response• Launching the NRDP and promoting private industrial R&D• NRDP in 1982• Policy incentives for industrial R&D: financial, fiscal, tax, etc.
How Korea built up an indigenous R&D system

17
Science & Technology strategy Roadmap of Korea Gov-ernment
CompetitiveDevelop-
mentStage
Major direction ofIndustrial
Policy
1960s 1970s 1980s 1990s 2000s
Expand exportoriented light
industries
Expand heavyand chemical
industries
Expandtechnology Intensiveindustries
Promotehigh-
technologyinnovation
TechnologyCommer-cialization
Factor Driven Stage
Investment Driven Stage
Innovation Driven Stage
Cheap labor
Manufacturing capability
Innovative capabilitySource of
Competition
2010s
Green Growth&
New Growth Engines
Convergence capability
New Growth EngineDriven Stage
18
S&TRole of
Government
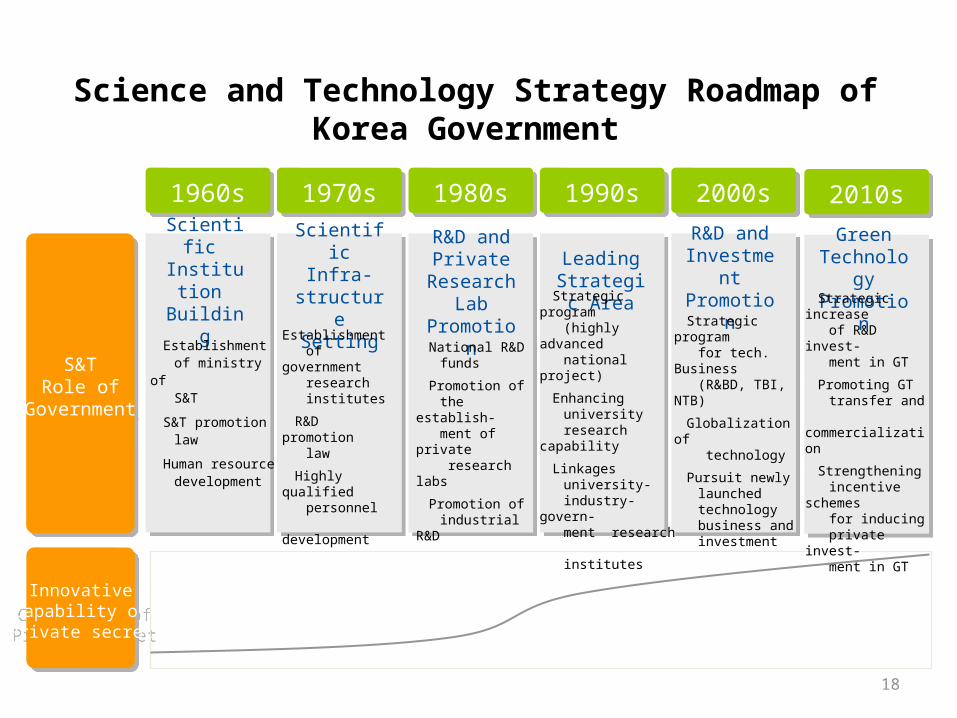
Science and Technology Strategy Roadmap of Korea Government
1960s 1970s 1980s 1990s 2000s
Scientific Institution Building
ScientificInfra-struc-
tureSetting
R&D and Private
ResearchLab
Promotion
Leading Strategic
Area
R&D andInvestmentPromotion
• Establishment of ministry of S&T
• S&T promotion law
• Human resource development
• Establishment of government research institutes• R&D promotion law• Highly qualified personnel development
• National R&D funds• Promotion of the establish- ment of private research labs• Promotion of industrial R&D
• Strategic program (highly advanced national project)• Enhancing university research capability• Linkages university- industry-govern- ment research institutes
• Strategic program for tech. Business (R&BD, TBI, NTB)• Globalization of technology• Pursuit newly launched technology business and investment
InnovativeCapability of
Private secret
2010s
Green Technology Promotion
• Strategic increase of R&D invest- ment in GT• Promoting GT transfer and commercialization• Strengthening incentive schemes for inducing private invest- ment in GT

19
Chronology of Major S&T Policy Measures
1960s• Establishment of KIST (1966), MOST (1967)• S&T Promotion Act (1967)
1970s• Establishment of GRIs in the field of chemical & heavy industries from
mid-1970s • Construction of Daeduk Science Town (Started in 1974)
1980s• Launching of the national R&D program (1982)• Promoting private firm’s research institutes by reforming financial & tax in-
centives to stimulate R&D investment
1990s• Promotion of university research: SRC, ERC, etc.• Introduction of new types of nat’l R&D programs - Highly Advanced Nat’l Program, The 21st Century Frontier R&D Program. • Establishment of inter-ministerial coordination body: NSTC
2000s• Introduction of National Technology Road Map (NTRM) - To suggest TRMs for key technologies to secure products/functions. • Introduction of overall coordination system - Office of S&T Innovation in MOST was created in Oct. 2004
20
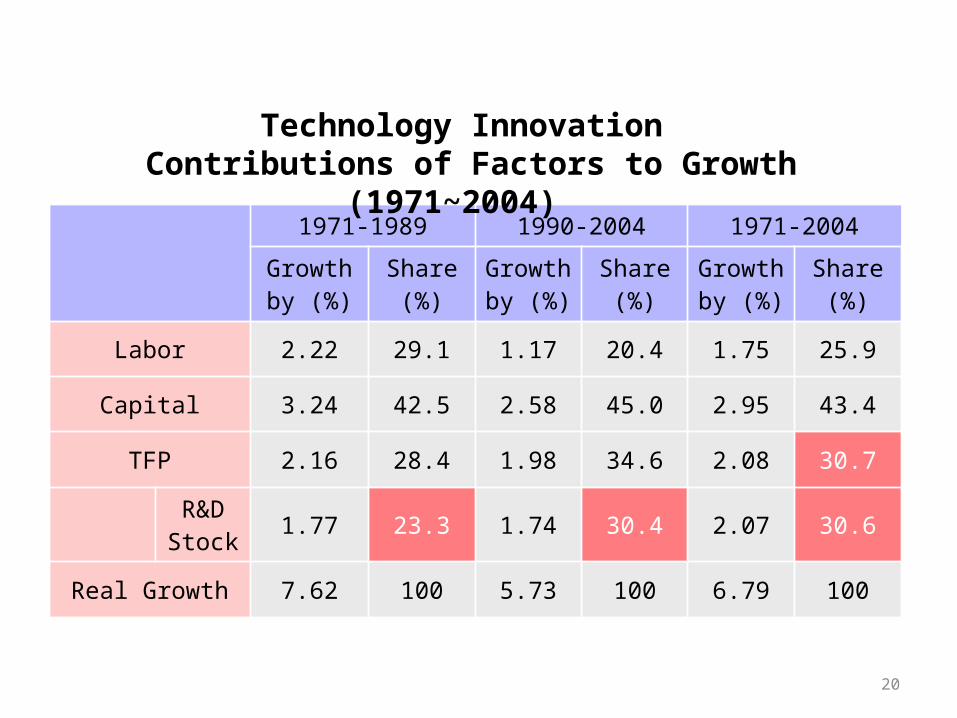
1971-1989 1990-2004 1971-2004
Growth by (%)
Share(%)
Growth by (%)
Share(%)
Growth by (%)
Share(%)
Labor 2.22 29.1 1.17 20.4 1.75 25.9
Capital 3.24 42.5 2.58 45.0 2.95 43.4
TFP 2.16 28.4 1.98 34.6 2.08 30.7
R&D Stock 1.77 23.3 1.74 30.4 2.07 30.6
Real Growth 7.62 100 5.73 100 6.79 100
Technology Innovation Contributions of Factors to Growth (1971~2004)

Factors of International Competitiveness
86.3%
13.1%
41.9%
12.2%17.7%
2.0%
77.2%
2.9%8.4%
4.4% 5.1% 2.0%0%
20%
40%
60%
80%
100%
Technology Design Brand Image Labor production
costs
Distribution and financial
costs
No ans.
Multiple choice Single Choice
21Source: Korea Exim Bank
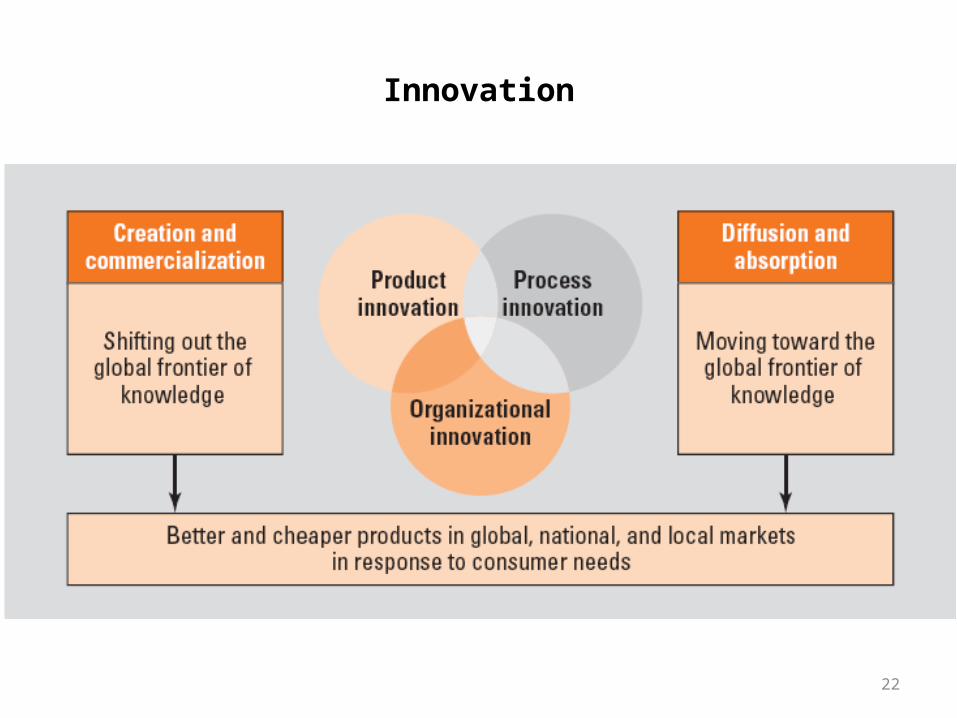
Innovation
22

23
Trend of Korea’s R&D expenditures
35.4
71.1
23.1
39.6
64.6
28.9
60.4
76.9
0
50
100
1975 1980 1985 1990 1995 2000 2005
(%)
Business Sector
Public Sector
29.7
70.3
Note: The public sector includes CGRIs, universities, and non-profit research institutes. Source: KISTEP, DB (2007)
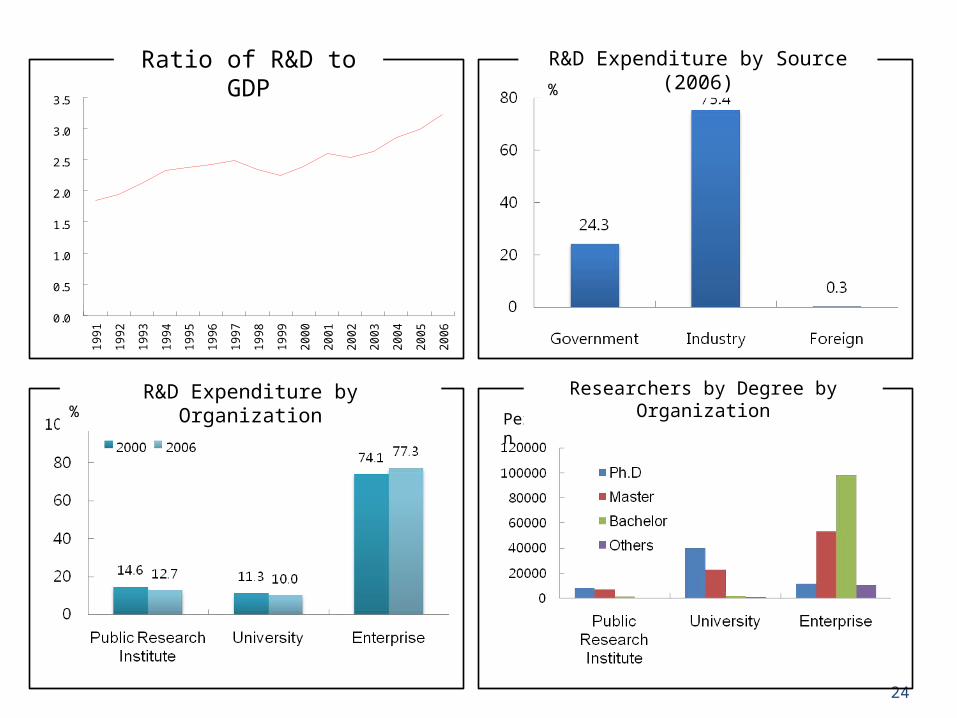
24
0.0
0.5
1.0
1.5
2.0
2.5
3.0
3.519
9119
9219
9319
9419
9519
9619
9719
9819
9920
0020
0120
0220
0320
0420
0520
06
Ratio of R&D to GDP R&D Expenditure by Source (2006)%
R&D Expenditure by Organization% Person
Researchers by Degree by Organi-zation
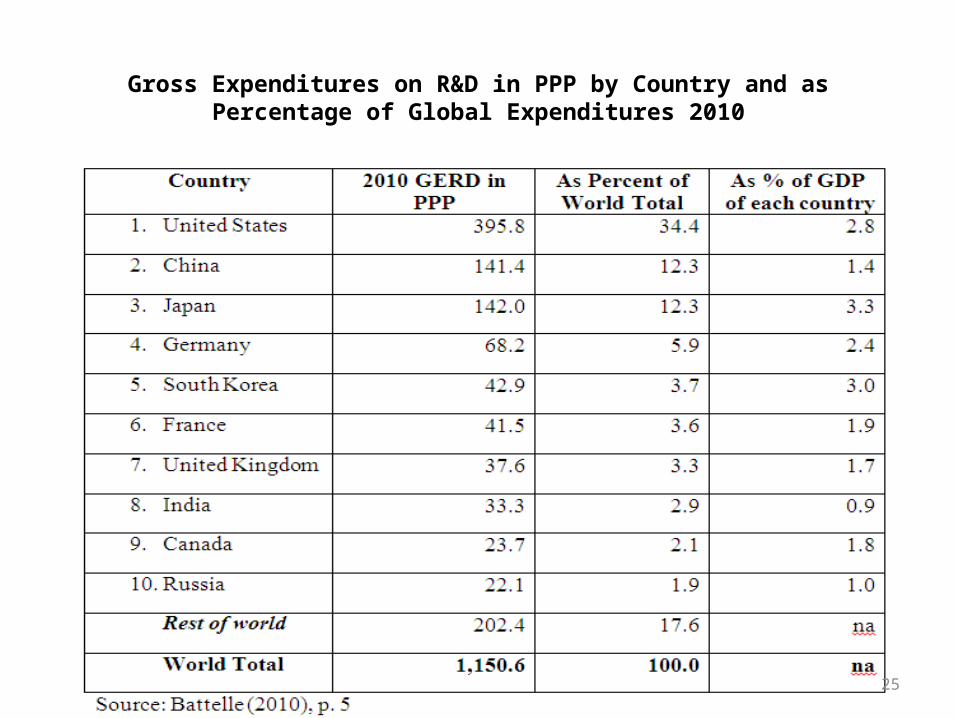
Gross Expenditures on R&D in PPP by Country and as Percentage of Global Expenditures 2010
25
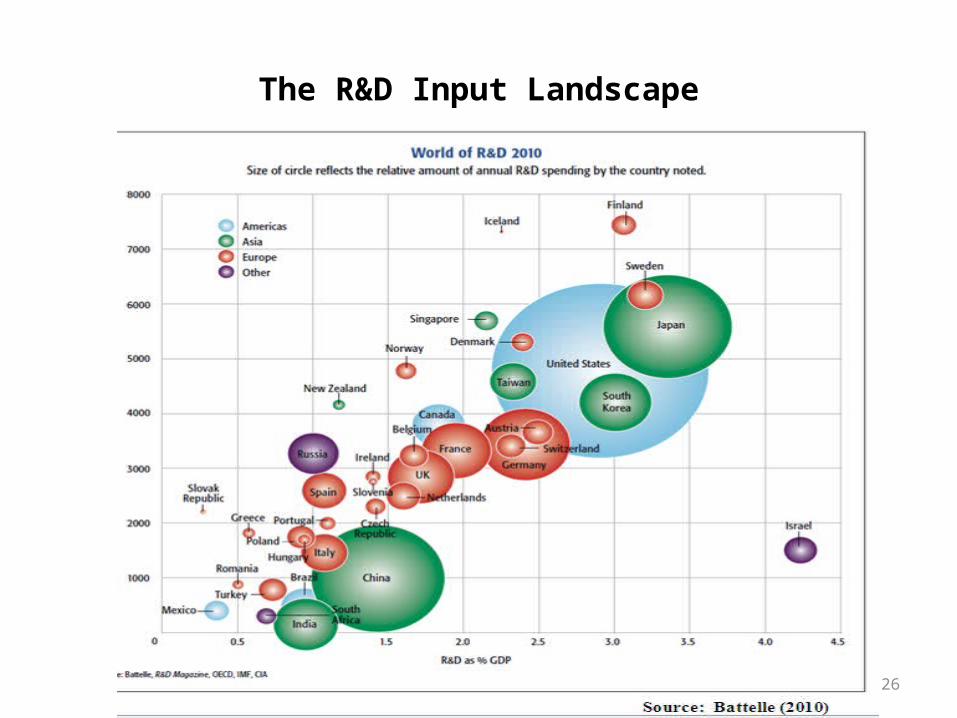
The R&D Input Landscape
26

27
Outward-looking development strategy Pressure for R&D investment - Government policy toward FDI and TT Focus on indigenous R&D Government-led industrial development
- Industry-targeting Inter-industry R&D imbalance - Favoring large enterprises R&D system biased for large firms/Financial
capability to invest in R&D - S&T for industrialization R&D system biased toward technology devel-
opment - Rich pool of well educate HRST High absorptive capacity - Government-led development of S&T infrastructure Relative impor-
tance of GRIs
Key Factors of the Korean NIS
28
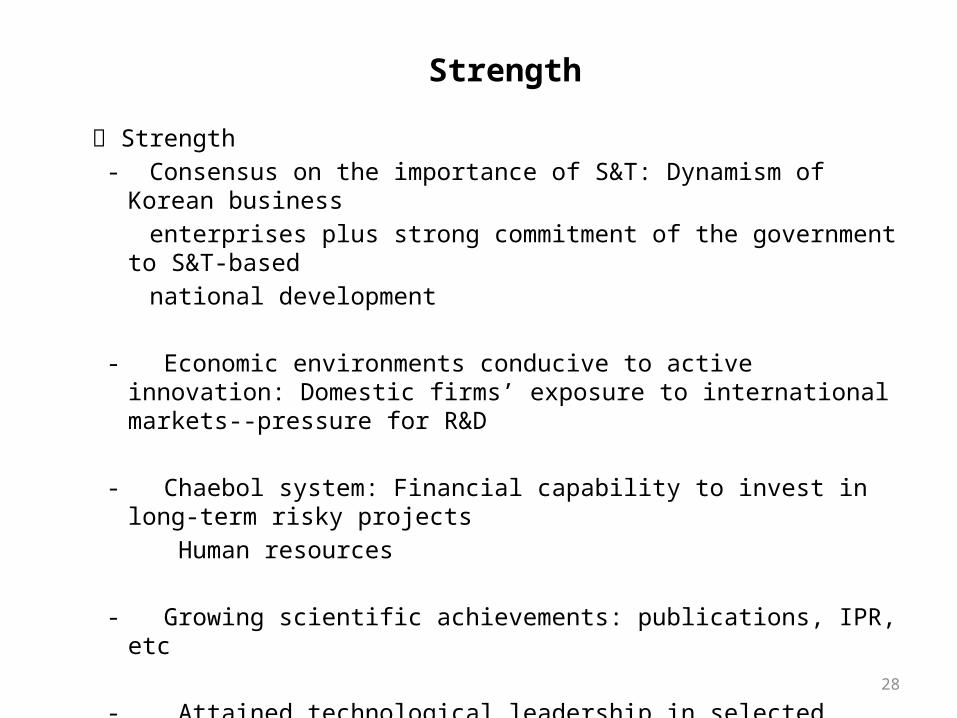
Strength - Consensus on the importance of S&T: Dynamism of Korean business enterprises plus strong commitment of the government to S&T-based national development - Economic environments conducive to active innovation: Domestic firms’
exposure to international markets--pressure for R&D
- Chaebol system: Financial capability to invest in long-term risky projects Human resources
- Growing scientific achievements: publications, IPR, etc
- Attained technological leadership in selected areas
Strength
29
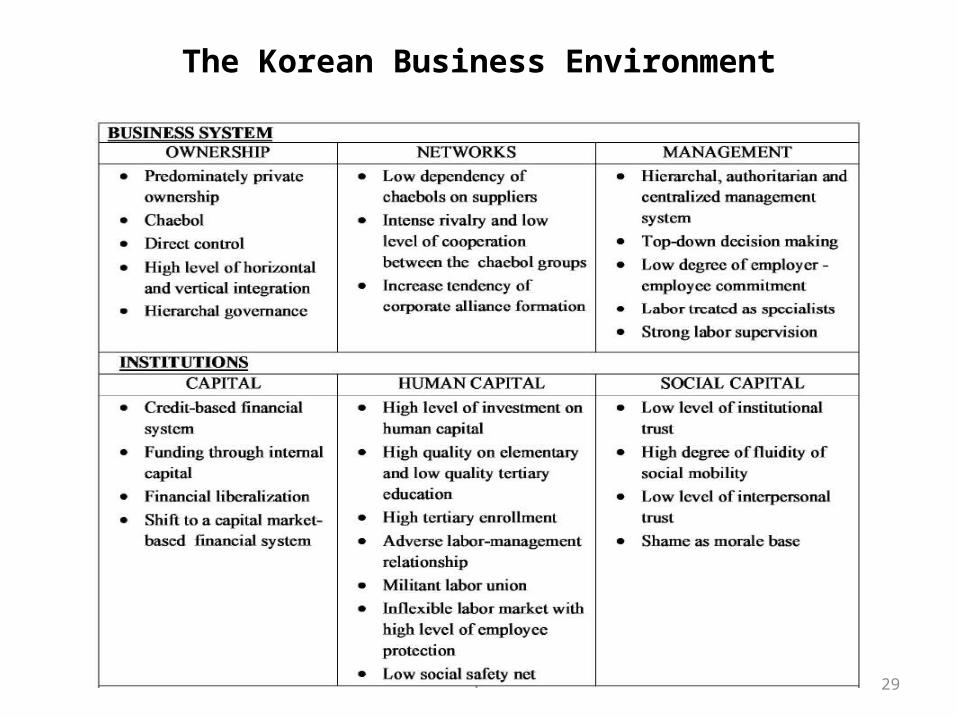
The Korean Business Environment

30
Korean Business Environment

Large ent.0.13%
Mid ent.
Small ent.
0.32%
99.55%
60.59%
8.91%
30.50%
Source: K-Biz. Small Biz Economic Institute. KITA. 2007
Number Exports
Large firms dominating export structure - Although the number of SMEs and MSEs is 99.9% of the total, their
export of share is only 39.4%. Desirable growth of SMEs- SME → MSE → Global Hidden Champion
Polarization and Needs for High-growth SMEs
High Dependency on Large Firms

3232
Exports by Small and Large Firms
2002 2003 2004 2007
Total Exports 162,471 (100.0)
193,817 (100.0)
184,883 (100.0)
371,489(100.0)
SMEs 68,309 (42.0)
81,699 (42.2)
72,208 (39.1)
113,676(30.6)
Large Enterprises 94,053 (57.9)
112,015 (57.7)
112,460 (60.8)
257,813(69.4)
Other(Public sector)
110 (0.1)
103 (0.1)
216(0.1)
(0.0)
(Unit: Million US dollars, %)
Note: The numbers in the parenthesis are the shares in total exportsSource: The Export-Import Bank of Korea
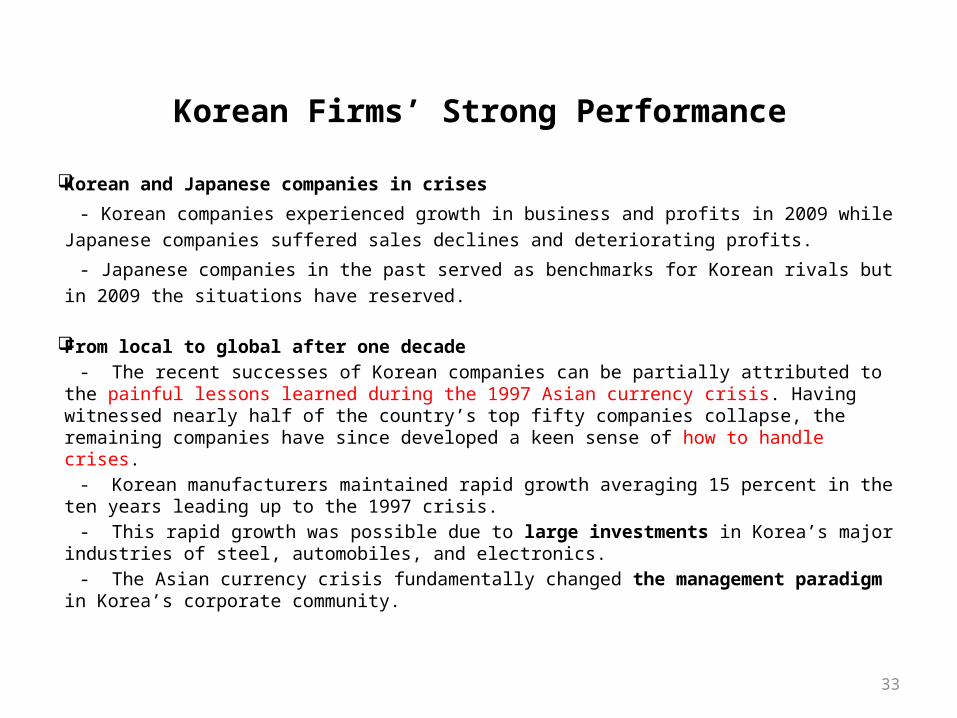
Korean Firms’ Strong Performance
Korean and Japanese companies in crises - Korean companies experienced growth in business and profits in 2009 while Japanese
companies suffered sales declines and deteriorating profits.
- Japanese companies in the past served as benchmarks for Korean rivals but in 2009 the situations have reserved.
From local to global after one decade - The recent successes of Korean companies can be partially attributed to the painful
lessons learned during the 1997 Asian currency crisis. Having witnessed nearly half of the country’s top fifty companies collapse, the remaining companies have since developed a keen sense of how to handle crises.
- Korean manufacturers maintained rapid growth averaging 15 percent in the ten years lead-ing up to the 1997 crisis.
- This rapid growth was possible due to large investments in Korea’s major industries of steel, automobiles, and electronics.
- The Asian currency crisis fundamentally changed the management paradigm in Korea’s corporate community.
33

34
- Companies shifted focus to profitable growth and management efficiency and adopted a management mode that enabled continuous corporate re-structuring.
- As a result, the restructuring led to a marked improvement of internal core
competencies, while at the same time the rate of company growth slowed significantly.
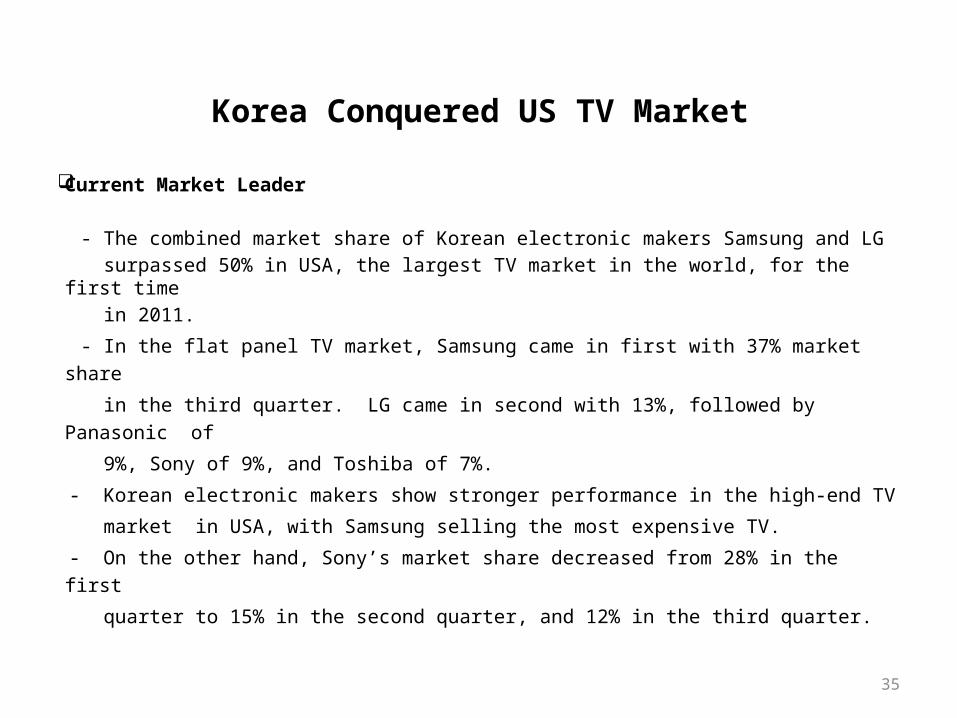
Korea Conquered US TV Market
Current Market Leader
- The combined market share of Korean electronic makers Samsung and LG surpassed 50% in USA, the largest TV market in the world, for the first time in 2011.
- In the flat panel TV market, Samsung came in first with 37% market share
in the third quarter. LG came in second with 13%, followed by Panasonic of
9%, Sony of 9%, and Toshiba of 7%.
- Korean electronic makers show stronger performance in the high-end TV
market in USA, with Samsung selling the most expensive TV.
- On the other hand, Sony’s market share decreased from 28% in the first
quarter to 15% in the second quarter, and 12% in the third quarter.
35

Market Share of 3D LCD TV in USA (2011)
March
April May Jun
e July
Augu
st
Septe
mber
0%10%20%30%40%50%60%70%
SamsungLGSonysharpVizio
Source: MD

Increasing Market Share of Korean Makers
- In the first quarter of 2011, combined market share of Samsung and LG was 57% (Samsung 51%, LG 6%)
- In the third quarter, it increased to 71% with LG increasing its share by 9% (Samsung 56%, LG 15%)
- Korean makers are also taking the lead in the European market. Samsung ranked number one in the European display market in the second quarter with 32%, followed by LG in the second place with 19% market share.
37

38
Earning Results of Korean and Japanese Companies, 2008-2009

39
Korean Companies vs. Global Companies, 2009

40
SERI Corporate Competitiveness Model
Competitiveness of Korea’s top 100 - SERI CI consists of two axes: internal resources (physical structure) and differentia-
tion (strengths). Derived from the three factors of traditional corporate management (human resources, materials, and financial capital), internal resources are defined as human capital, investment capabilities, and soundness of capital structure.
- Differentiation consists of operational excellence, product leadership, and customer intimacy. To measure the Key Success Factor (KSF), SERI elected corporate earn-ings, universality of data, and measurability as components of the Key Performance Indicator (KPI).
- Even if considered on the basis of internal resources alone, Korean companies seemed well positioned to take on almost any task.
- Korea’s corporate ecosystem is led by a handful of globalized companies that have improved their competitiveness significantly over the years.

41
Future Direction - On top of competitiveness, two additional factors will play a positive role in
the advancement of Korea’s global companies. The first factor is that the center of economic activity is shifting from the advanced economies to China and other emerging economies, where Korean companies are performing well.
- Second, Korean companies have traditionally been active in respond-ing to change, via innovative investment and speedy action, meaning that they have plenty dynamic capabilities which is closely related to corporate growth during transition phases.
- If Korean companies could strengthen their networking capabilities and brand power, they could emerge in an even more dominant posi-tion on the global stage.

Samsung History
– Established in 1969 to manufacture black and white TV sets
– Purchased a Korea Semiconductor Business in 1974
– In 1980 dedicated most of its resources to semiconductor business and built its first manufacturing facility.
– By early 1990’s, was amongst the industry’s top contenders
– Brand value rank grew from 43rd in the world ($ 5.2 billion) in 2000 to 21st in the world ( $12.6 billion) in 2004 and 20th in 2006 (16.1 billion)
– Ahead of many brands such as Pepsi, Google, and Siemens
– Total net revenue in 2004 was $78.5 billion, and $78.7 billion in 2006
42

Samsung Structure
Spans 58 countries
Samsung Electronics has 5 business divisions :– Semiconductor – Digital Media– Telecommunications– LCD– Digital Appliances
43

Samsung DRAM Facts
2nd Largest chipmaker worldwide (2006)
Market leader in DRAM 1992 - 2007– Total DRAM Volume 896.4M units (2003) – Over 1,200 DRAM products
• “Frontier” to legacy products• Specialty and customized products
– Versus competitors: • Average price premium: 34%• Average operating margin difference: +53%
44

Samsung Performance
Cost Advantages– Lowest raw materials cost (volume)– Lowest depreciation– Labor and SG&A (Selling, General and Administrative Expenses) not
high– Shared core designs– Lower cost fabs (12%)– Flexible production lines– Higher yields (because of process quality)
Highest Price– Highest reliability in industry: >$1 premium
45

Generic Competitive Strategies of SamsungTa
rget
Mar
ket
Overall Low-CostProviderStrategy
(Commodity DRAM)
BroadDifferentiation
Strategy(Cutting Edge DRAM)
FocusedLow-CostStrategy
(Low cost flash memory)
FocusedDifferentiation
Strategy(Rambus DRAM)
Best-Cost ProviderStrategy
(Samsung’s Strategy)
Lower Cost Differentiation
BroadRange of Buyers
Narrow Buyer
Segmentor Niche
46
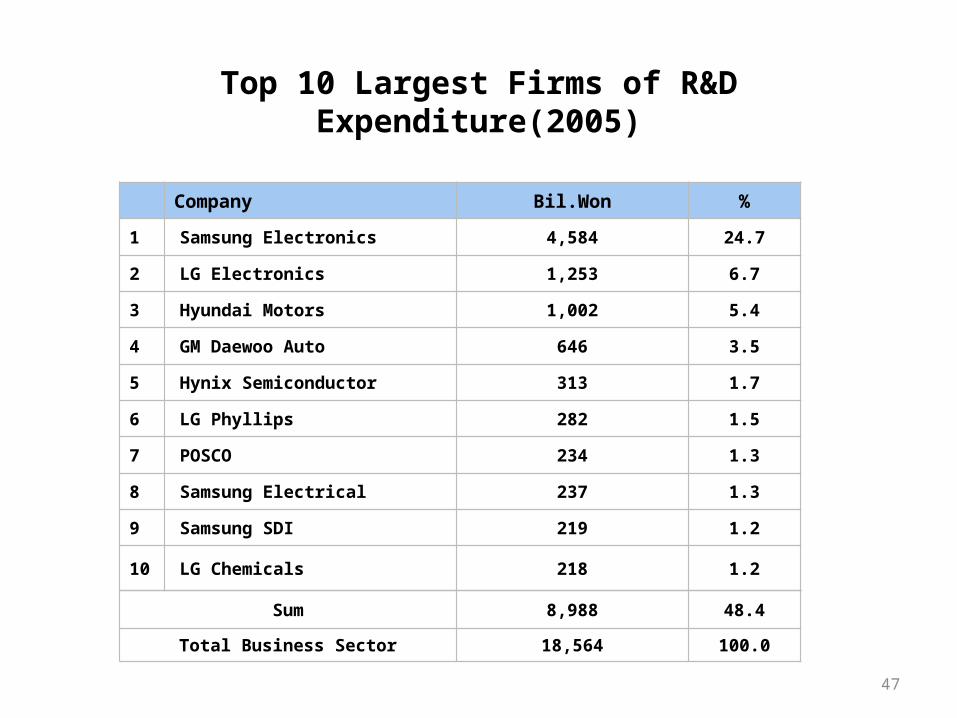
Top 10 Largest Firms of R&D Expenditure(2005)
Company Bil.Won %
1 Samsung Electronics 4,584 24.7
2 LG Electronics 1,253 6.7
3 Hyundai Motors 1,002 5.4
4 GM Daewoo Auto 646 3.5
5 Hynix Semiconductor 313 1.7
6 LG Phyllips 282 1.5
7 POSCO 234 1.3
8 Samsung Electrical 237 1.3
9 Samsung SDI 219 1.2
10 LG Chemicals 218 1.2
Sum 8,988 48.4
Total Business Sector 18,564 100.0
47

(Yen Billion)
4848
Comparison of the Operating Profits of Samsung and Japanese Electronics Companies (Jul-Sep,
2009)
Source: Compiled from Japanese Newspapers
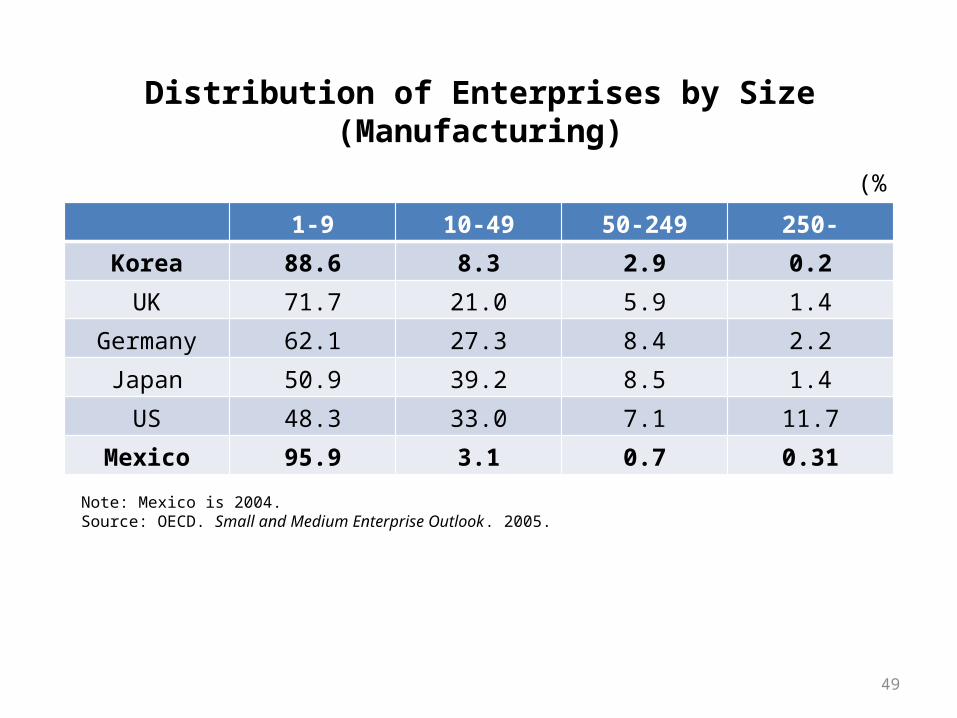
Distribution of Enterprises by Size (Manufacturing)
49
Note: Mexico is 2004.Source: OECD. Small and Medium Enterprise Outlook. 2005.
(%)1-9 10-49 50-249 250-
Korea 88.6 8.3 2.9 0.2UK 71.7 21.0 5.9 1.4
Germany 62.1 27.3 8.4 2.2
Japan 50.9 39.2 8.5 1.4
US 48.3 33.0 7.1 11.7
Mexico 95.9 3.1 0.7 0.31

50
Status of SMEs in the Korean Industry - The weight (share) of SMEs has been steadily increasing in the
1980s, which reflects their positive role in economic development. - SMEs contribute to employment creation and forming the basis of
the economy. The terms of number of enterprises, their share is 99.9% and the share of employment is 87.5%.
SMEs and EmploymentThousand enterprises Million persons
No. of en-terprises
No. of em-ployees
51
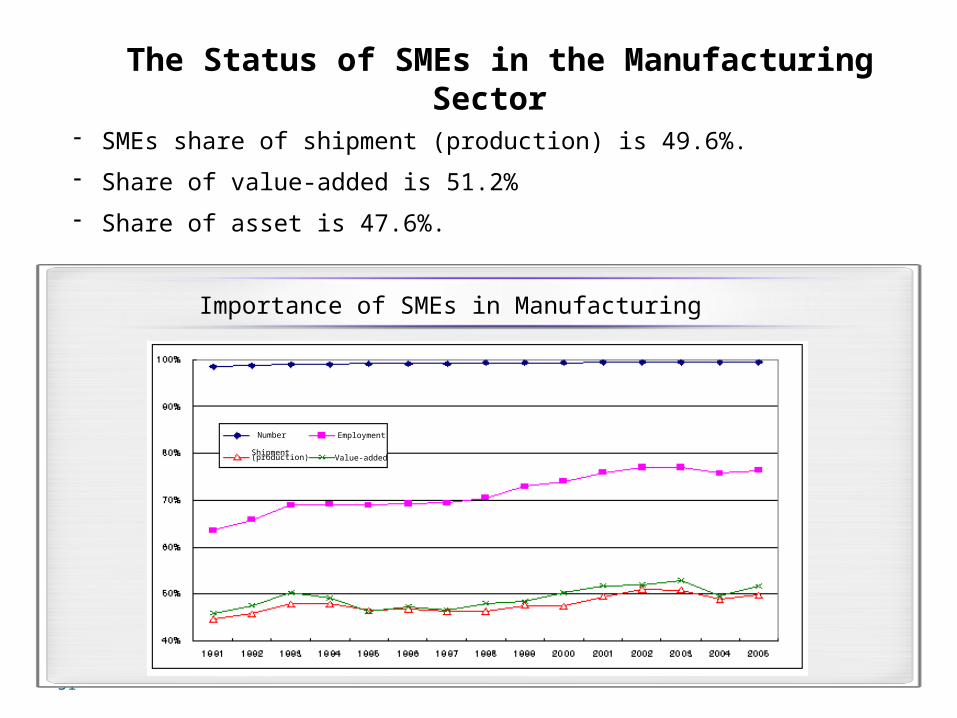
The Status of SMEs in the Manufacturing Sector- SMEs share of shipment (production) is 49.6%.- Share of value-added is 51.2%- Share of asset is 47.6%.
Importance of SMEs in Manufacturing
Number
Shipment(production)
Employment
Value-added
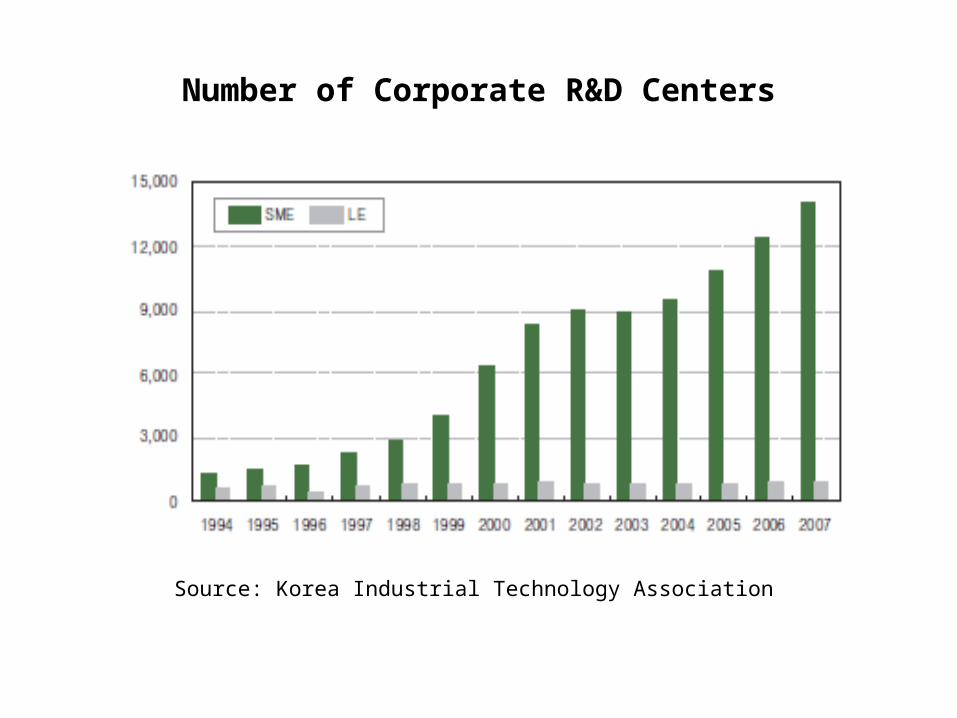
Number of Corporate R&D Centers
Source: Korea Industrial Technology Association
53
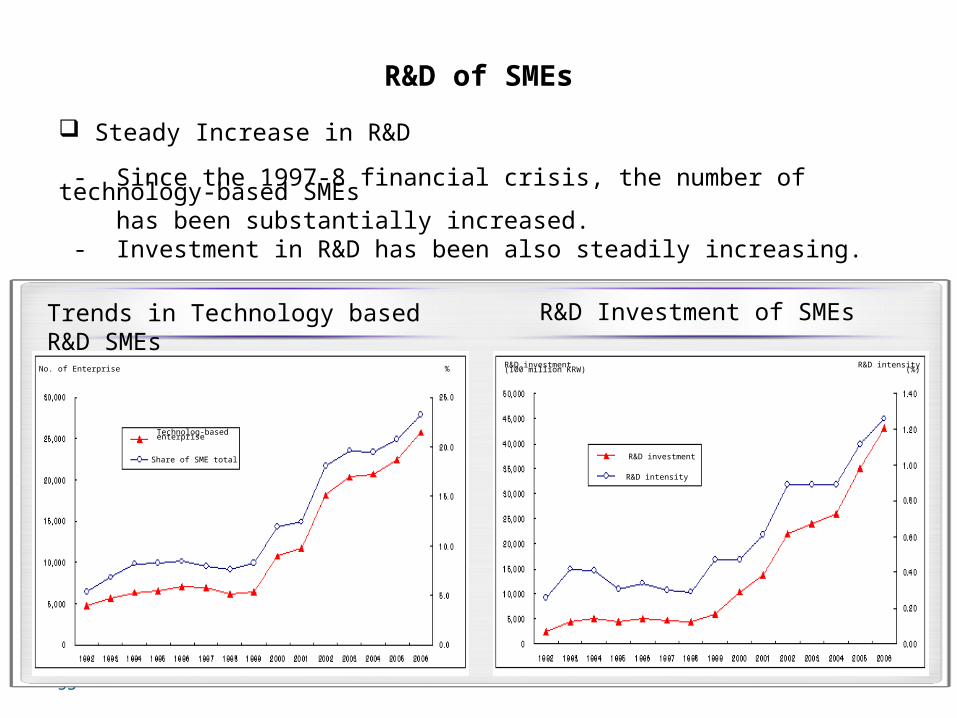
R&D of SMEs
Trends in Technology based R&D SMEs
R&D Investment of SMEs
Steady Increase in R&D - Since the 1997-8 financial crisis, the number of technology-based SMEs has been substantially increased. - Investment in R&D has been also steadily increasing.
No. of Enterprise %
Technolog-basedenterprise
Share of SME total
R&D investment(100 million KRW) R&D intensity (%)
R&D investment
R&D intensity

Technology Support
Technology development is the backbone of innovation-driven SMEs, which is emerging as a test bed for new technologies and new products. To take full advantage of this fact, SMBA provides a variety of technology inno-vation support programs.
- Start-up technology development- SME technology transfer- SME technology innovation- Support for joint utilization of research equipment- Support for production-environment innovation technology- Support for industry-academia offices- Support for joint development industry-academia-research institute- Cooperative-type technology development- Support for establishment of research institutes attached to SMEs
54
55
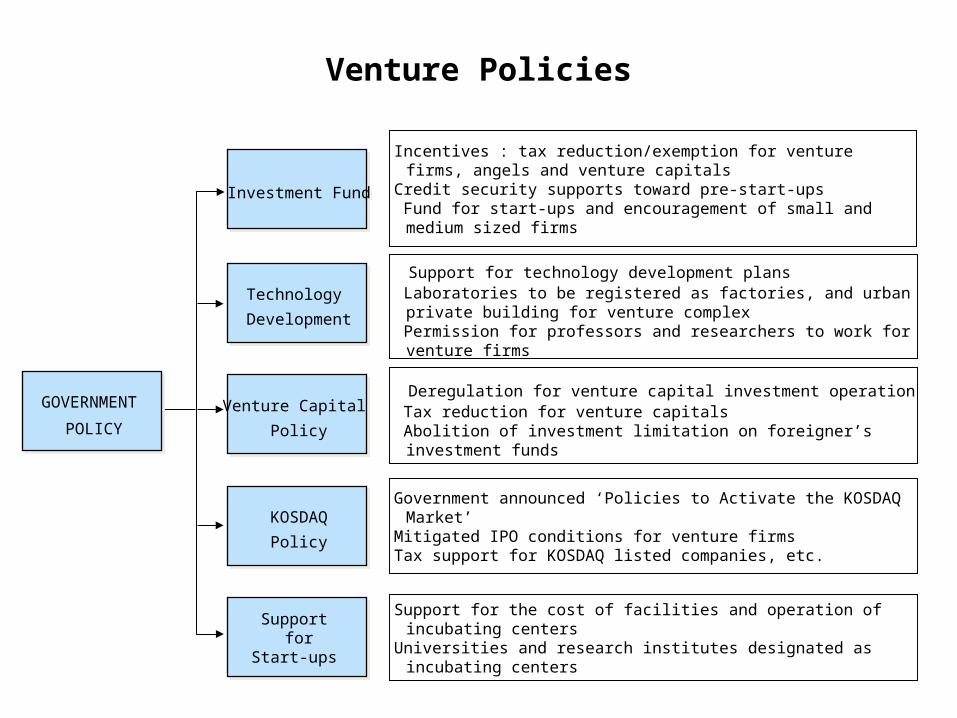
Venture Policies
Technology Development
Venture Capital Policy
KOSDAQPolicy
Support for
Start-ups
GOVERNMENT
POLICY
Support for technology development plans Laboratories to be registered as factories, and urban private
building for venture complex Permission for professors and researchers to work for venture
firms
Deregulation for venture capital investment operation Tax reduction for venture capitals Abolition of investment limitation on foreigner’s investment
funds
Government announced ‘Policies to Activate the KOSDAQ Market’ Mitigated IPO conditions for venture firms Tax support for KOSDAQ listed companies, etc.
Support for the cost of facilities and operation of incubating cen-ters
Universities and research institutes designated as incubating centers
Investment Fund
Incentives : tax reduction/exemption for venture firms, angels and venture capitals
Credit security supports toward pre-start-ups Fund for start-ups and encouragement of small and medium
sized firms

Korean SME Overseas Investment by Firm Size
57
(Unit: No. of Cases, US $ 1,000, %)
Category 2004 2005 2006 2007 2008
TotalInvestment
(A)
Cases 13,157 16,346 19,000 21,855 19,150
Amount 6,670,813 7,052,607 11,566,115 21,799,017 21,855,699
SMEInvestment
(B)
Cases 7,157 7,909 9,148 11,192 10,408
Amount 2,053,169 2,307,506 3,382,995 5,881,708 5,707,433
SME Ratio(B/A)
Cases 54.4 48.4 48.1 51.2 54.3
Amount 30.8 32.7 29.2 27.0 26.1
Source: The Bank of Korea

Policy Measures to Increase Global SME Presence
On-site Facilitation Programs
- Branch Programs: Support marketing and export-related activities through
KOTRA employees in local areas (operated by KOTRA)
- Korea Business Development Center Programs (KBDC): Relocate 10-20
export SMEs to each respective KBDC and support local marketing and ex-
port activities (by the Small Business Corporation)
- I-Park Program: Similar to KBDC, but subject firms are limited to IT compa-
nies, and overseas bases are located in only six areas, including Beijing,
Tokyo, Shanghai, Silicon Valley, Boston, and London (operated by the Korea
Software Industry Promotion Agency)
58
Background of Global Hidden Champions
The number of hidden champions (HCs) in Korea is relatively small.
Although they are many potential hidden champions, the environment is not conducive to the growth of HCs.
- Enterprise having 300 employees and more are regarded as large enter-prises and subject to regulations, rather than supports by the government.
Recently Korea realized the need to support HCs. - For this purpose, two concepts of ‘high-growth enterprise’ and ‘mid-sized en-
terprise’(MSE) are emerged.
Year 2010 is announced as the year of mid-sized enterprises for govern-ments’ launching of various policies to promote the growth of these firms.
59
Evaluation
Contributions- Enhanced SME policies made great contributions to economic growth by facilitat-
ing competition and innovation for SMEs and by strengthening production bases. - Especially, policies helped SMEs’ export performance and transform the econ-
omy towards an innovation-driven economy after the Asian Crisis.- As the role of the government has been reduced, a market-friendly policy para-
digm has been needed.
Inefficient Policies - Although it cannot be denied that SME policies of Korea supported the growth of
SMEs significantly, the policies have been criticized for being inefficient and inef-fective in many cases.
- Government programs are too many and too much with complicated procedures in many cases.
60

Strengths and Weaknesses of Korea
Strengths
- Consensus on the importance of S&T: Dynamism of Korea business en-terprises plus strong commitment of the government to S&T-based na-tional development
- Economic environments conductive to active innovation: Domestic firms’ exposure to international markets—pressure for R&D
- Chaebol system: financial capability to invest in long-term risky projects
- Human resources Growing scientific achievements: publications, IPR, etc. Attained technological leadership in selected areas
61

Weaknesses
- Disadvantage of being small
- Imbalances in innovation system Basic scientific research vs. technological development Large firms vs. SMSs Regional concentration
- Excessive reliance on private investment: vulnerable to changes in markets
- Weak industry-science relationship
- Insufficient internationalization: insufficient R&D-based FDI, international co-invention, etc.
62

63
Five Strong Points of Korean Firms Viewed by Japan
Adversary or recession is the period to drive- It is the best time to leap forward when the rival is retreating.
Discard egalitarianism (=everything is equally important)- Concentrate on growing or emerging areas without worrying barriers or
difficulties
Commodities rather than products- Instead of enforcing selling technologically superior products, develop
commodities wanted by buyers
Do not depend on the domestic market- Always conscious of the world market
Endlessly learning and practice- Diligently learn superior techniques to re-create own capability

64
Policy Lessons
Lessons
- Market competition is the very source of motivation for innovation - Pressure for technological competitiveness
- Effectiveness of the outward-looking development strategy for small economies
- Human resource is the key to learning
- Government can play effectively the role of facilitator and promoter at the early stage of development
65
References
Kim, Jong-Nyun. Korean Firms Come Out Winners from Global Crisis. SERI. 2010.
Bendt, Flora and Sanne, Joakim. 2010. “The Korean Business Systems”. School of Business, University of Gothenburg.
Hong, Y. S. 2011. “ Innovation Strategy and Management of the Korean Electronics Industry: Focusing on Samsung”. (PPT). IGIE.
Kim, Suk Joon. “Korean Industrial Policy and the Role of Science and Technology”. FEUISE Annual Conference 2010. (PPT).