iot based air pollution detection monitoring system with
TRANSCRIPT
i
IoT Based Air Pollution Detection Monitoring System with
Arduino
by
Mursil mahmud
ID: 183110
The project report submitted to the Institute of Information Technology
in partial fulfilment of the requirements for the degree of
Professional Masters in Information Technology
Supervisor: Dr. Mohammad Shahidul Islam
Coordinator
PMIT Coordination Committee & Associate Professor, IIT, JU
Institute of Information Technology
Jahangirnagar University
Savar, Dhaka-1342
December, 2019
ii
CERTIFICATE
The project titled “Air Pollution Detection Monitoring System” submitted by Mursil Mahmud,
ID-183110, has been accepted as satisfactory in partial fulfillment of the requirement for the
degree of Professional Masters in Information Technology on December, 2019.
____________________
Project Supervisor
Dr. Mohammad Shahidul Islam
Coordinator, PMIT Coordination Committee & Associate Professor, IIT, JU
BOARD OF EXAMINERS
Dr. Mohammad Shahidul Islam PMIT Coordinator
Associate Professor, IIT, JU PMIT Coordination Committee
Dr. M. Mesbahuddin Sarker Member, PMIT Coordination Committee
Professor, IIT, JU & Director IIT
Dr. M. Shamim Kaiser Member, PMIT Coordination Committee
Professor, IIT, JU
Dr. Mohammad Abu Yousuf Member, PMIT Coordination Committee
Associate Professor, IIT, JU
Dr. Jesmin Akter Member, PMIT Coordination Committee
Associate Professor, IIT, JU

iii
CANDIDATE’S DECLARATION
I hereby declare that this project work is based on the results found by myself. Materials of
work found by other researcher are mentioned by reference. I also declare that neither this
project nor any part of this has been submitted elsewhere for award of any degree.
____________________
Mursil Mahmud
ID: 183110
iv
DEDICATION
I dedicate this project to my daughters of Umme Tasmia Mushfika Elahi & Laaibah Fatima. I
also dedicate this project to all of my honorable teachers of Institute of Information Technology
(IIT), Jahangirnagar University, Savar, Dhaka-1342.
v
LIST OF TABLES AND FIGURES
Tables Page
1.1 SWOT Analysis----------------------------------------------------------------- 6
4.2 Air Quality Range Wise Result------------------------------------------------ 38
4.3 AQI levels and Connected Health Impacts-----------------------------------39
Figures Page
3.2 Proposed System Architecture------------------------------------------------- 19
3.3 Circuit Diagram------------------------------------------------------------------20
3.4 Block diagram for proposed model of the system---------------------------21
3.5 Flowchart for the Proposed System-------------------------------------------22
3.6.1 Arduino Uno microcontroller------------------------------------------------24
3.6.2 Gas sensor MQ135------------------------------------------------------------ 26
3.6.3 LCD (16x2) --------------------------------------------------------------------28
3.6.4 Buzzer---------------------------------------------------------------------------28
3.6.5 ESP8266 Wi-Fi Device-------------------------------------------------------29
3.6.6 Arduino A-B Cable (0.5m) ---------------------------------------------------30
3.6.7 Jumper wire (M to F, M to M, F to F) ---------------------------------------30
3.7 Setup the Hardware---------------------------------------------------------------31
4.2 Running the System---------------------------------------------------------------36
vi
LIST OF ABBREVIATIONS
AEG: Air Excellence Guide
AQI: Air Quality Indicator
PPB: Parts Per Billion
PPM: Parts Per Million
IoT: Internet of Things
LPG: Liquefied Petroleum Gas
IDE: Integrated Development Environment
LED: Light Emitting Diode
LCD: Liquid Crystal Display
GSM: Global System for Mobile communication
OEMs: Original Equipment Manufacturers
CCSA: China Communications Standards Association
API: Application Programming Interface
MCU: Micro Control Unit
IDE: Integrated Development Environment

vii
ACKNOWLEDGEMENT
Though I have taken efforts in this project, it would not be possible without the kind support
and help of many individuals. Firstly, I would like to thank my Mom for their infinite sacrifices
for me and supports for making it possible to board on this journey.
I am highly indebted to the faculty members of Jahangirnagar University for their guidance
and constant supervision by Dr. Mohammad Shahidul Islam as well as for providing necessary
information regarding the project & for their support in completing the project.
I would like to express my gratitude towards my friends & member of Institute of Information
Technology for their kind co-operation and encouragement which help me in completion of
this project. My thanks and appreciations also go to the people who have willingly helped me
out with their abilities.
Mursil Mahmud
December 2019
viii
ABSTRACT
Nowadays air pollution has turned out to be one of the significant issues because of increment
in the quantity of vehicles and during the time spent industrialization and urbanization.
This expansion in the level of contamination brings about destructive consequences for
prosperity. This project explains the depiction and execution of an Air Pollution detection
system. The innovation grasped here, is a hands-on execution of the idea of Internet of Things.
This detailed work is an exploration of the possibilities of consumption of this innovation,
in this world, where natural well-being is turning into a genuine risk. The work is actualized
utilizing microcontroller board of Arduino. In this project I am going to make an IoT based
Air Pollution Detection Monitoring System in which I will monitor the Air Quality over a web
server using ESP8266 Wi-Fi device and will a trigger alarm when the air quality goes down a
certain level means when there is amount of harmful gases is present in the air like CO2. It will
show the air quality in PPM (Parts Per Million) as like “Fresh Air”, “Poor Air”, “Danger Air”
on LCD and webpage so that I can monitor it very easily.
ix
TABLE OF CONTENTS
Page
Certificate---------------------------------------------------------------------------------------------- ii
Candidate’s Declaration---------------------------------------------------------------------------- iii
Dedication---------------------------------------------------------------------------------------------- iv
List of Tables and Figures-------------------------------------------------------------------------- v
List of Abbreviations-------------------------------------------------------------------------------- vi
Acknowledgements----------------------------------------------------------------------------------- vii
Abstract------------------------------------------------------------------------------------------------ viii
Chapter 1 Introduction and Background--------------------------------------------------------1
1.1 Introduction-----------------------------------------------------------------------1
1.2 Purpose of the Project-----------------------------------------------------------2
1.3 Objectives of Monitoring Air Quality-----------------------------------------2
1.4 Air Quality Parameters----------------------------------------------------------3
1.5 Importance of Air Pollution Monitoring System----------------------------4
1.6 Benefits and Beneficiaries------------------------------------------------------5
1.6.1 Benefits-----------------------------------------------------------------5
1.6.2 Beneficiaries-----------------------------------------------------------5
1.7 SWOT Analysis------------------------------------------------------------------6
1.8 Advantages of Proposed Project-----------------------------------------------7
1.8.1 Portability--------------------------------------------------------------7
1.8.2 Safety-------------------------------------------------------------------7
1.8.3 Cost---------------------------------------------------------------------7
1.8.4 Simple Maintenance--------------------------------------------------7
CHAPTER 2 LITERATURE REVIEWS--------------------------------------------------------8
2.1 Introduction---------------------------------------------------------------------- 8
2.2 Opportunity, Status & Capability of IoT------------------------------------- 8
2.2.1 Opportunity of IoT--------------------------------------------------- 8
2.2.2 Status of IoT---------------------------------------------------------- 9
x
2.2.3 Capability of IoT----------------------------------------------------- 9
2.3 Motivation and General Description------------------------------------------ 10
2.4 Open and General IoT Architecture-------------------------------------------11
2.5 Challenge & Prospect of IoT---------------------------------------------------12
2.5.1 Challenge of IoT------------------------------------------------------12
2.5.2 Prospect of IoT--------------------------------------------------------15
2.6 Conclusion----------------------------------------------------------------------- 17
CHAPTER 3 PROPOSED SYSTEM ARCHITECTURE -----------------------------------18
3.1 Introduction-----------------------------------------------------------------------18
3.2 Proposed System Architecture-------------------------------------------------19
3.3 Circuit Diagram------------------------------------------------------------------20
3.4 Block diagram for proposed model of the system---------------------------21
3.5 Algorithm & Working Process-------------------------------------------------22
3.6 Implementation Technologies--------------------------------------------------23
3.6.1 Arduino Uno-----------------------------------------------------------23
3.6.2 Gas sensor MQ135----------------------------------------------------26
3.6.3 LCD (16x2) ------------------------------------------------------------28
3.6.4 Buzzer-------------------------------------------------------------------28
3.6.5 ESP8266 Wi-Fi--------------------------------------------------------29
3.6.6 Arduino A-B Cable (0.5m) ------------------------------------------30
3.6.7 Jumper wire (M to F, M to M, F to F) -----------------------------30
3.7 Setup the Hardware of this Project---------------------------------------------31
CHAPTER 4 CODDING ANALYSIS & RESULT---------------------------------------------32
4.1 Code Explanation-----------------------------------------------------------------32
4.2 Results------------------------------------------------------------------------------36
4.3 Result Analysis--------------------------------------------------------------------39
CHAPTER 5 CONCLUSION AND FUTURE WORK----------------------------------------40
5.1 Conclusion-------------------------------------------------------------------------40
5.2 Future Scope-----------------------------------------------------------------------40
Reference-------------------------------------------------------------------------------------------------41
1
CHAPTER 1
INTRODUCTION AND BACKGROUND
1.1 Introduction
The Air Excellence Guide (AEG) may be a common indicator of air quality. The Air Quality
Indicator (AQI) is calculated and supported on air pollutants like CO and NO2 compounds that
consume opposing possessions happening the atmosphere and human health. The Air Quality
Indicator may be a range that represents the very finest meditation of a specific air unused
matter at a particular time. I propose an air quality as well as air pollution monitoring system
that allows us to monitor and check live air quality as well as air pollution in an area through
Internet of Things (IoT). It uses air sensors (Gas Sensor MQ135) to sense presence of harmful
gases/compounds in the air and constantly transmit this data. In addition, system keeps
measuring air level and reports it. The sensors interact with Arduino Uno (Microcontroller)
which processes this data and transmits it over the application. This allows authorities to
monitor air pollution in different areas and act against it [1]. In addition, authorities can keep a
watch on the air pollution near schools, and hospitals areas. Normally, little concentrations area
unit measured exploitation ppb (parts per billion), that represents units of mass of a material
per one billion units of total mass. Parts per million (ppm) may be similar and unremarkable
used unit to measure concentrations of pollutants. It determines the requirements of a new
system and analyze on product and resource requirement, which is required for the successful
system. The product requirement contains input and output requirements it gives the wants in
term of input to produce the required productivity. The resource requirements define in brief
about the hardware that are needed to achieve the required functionality. In this project I am
going to make an IoT based Air Pollution Detection Monitoring System in which I monitor the
Air Quality over a web server using ESP8266 Wi-Fi device and a trigger alarm when the air
quality goes down a certain level means when there is amount of harmful gases is present in
the air like CO2. It shows the air quality in PPM (Parts Per Million) on LCD and webpage so
that I monitor it very easily.
2
1.2 Purpose of Project
The project is an implementation of IoT (Internet of Things) Based Air Pollution Monitoring
System Using Arduino. Air pollution is a growing issue and it is necessary to monitor air
quality for a better future and healthy living for all. IoT is getting popular day-by-day and
standards are on its way. Therefore, collection of air quality information is easier. Analysis of
monitoring data allows us to assess how bad air pollution from day to day. According to the
recent survey, Dhaka, the capital of Bangladesh is the third in the list of most air-polluted city.
Thus because of this expansion in the quantity of vehicles contamination is developing quickly
and it influencing people groups wellbeing too. This air contamination makes disease and harm
safe, neurological, regenerative and respiratory framework. In extraordinary cases, it can
likewise cause passing. As indicated by overview 50000 to 100000 unexpected losses occurred
to us only because of air contamination [2]. Along these lines, there is a requirement for
checking air quality and to monitor it. IoT is the system of physical gadgets, vehicles, home
apparatuses, and different things implanted with hardware, programming, sensors, and
availability which empowers these articles to associate and trade information. IoT permits
articles to be noticed or controlled. In this paper, I am proposing and going to piloting a model
which IoT to screen air contamination.
1.3 Objectives of Monitoring Air Quality
The air quality monitoring program design dependent upon the monitoring specific objectives
specified for the air quality management in the selected area of interest. Defining the output
influence, the design of the network and optimize the resources used for monitoring. It also
ensures that the network is specially designed to optimize the information on the problems at
hand. There might be different objectives for the development of the environmental monitoring
and surveillance system. Normally, the system has to provide on-line data and information
transfer with a direct /automatically/ on-line quality control of the collected data. Several
monitors, sensors and data collection systems to be applied to make on-line data handover and
control likely. The main objectives stated for the development of an air quality measurement
and surveillance program might be to facilitate the background concentration(s) measurements,
monitor current levels as a baseline for assessment, check the air quality relative to standards
or limit values, detect the importance of individual sources, enable comparison of the air quality
data from different areas and countries, collect data for the air quality management, traffic and
land-use planning purposes, observe trends (related to emissions), develop abatement
strategies, determine the exposure and assess the effects of air pollution on health, vegetation
3
or building materials, inform the public about the air quality and raise the awareness, develop
warning systems for the prevention of undesired air pollution episodes, facilitate the source
apportionment and identification, supply data for research investigations, develop/validate
management tools (such as models), develop and test analytical instruments and to support
legislation in relation to the air quality limit values and guidelines. The relationships between
the data collected and the information to be derived from them must be taken into account when
a monitoring program is planned, executed and reported. This emphasizes the need for users
and potential users of the data to be involved in planning surveys, not only to ensure that the
surveys are appropriate to their needs but also to justify committing the resources.
1.4 Air Quality Parameters
The important parameters that are considered in the proposed framework include: Carbon
Dioxide (CO2) – CO2 is colorless, odorless gas and non-combustible gas. Also, it is measured
under the category of smother gases that have ability of interfering the availability of oxygen
for tissues. Carbon Dioxide is a gas vital to life in the world, because it is one of the most vital
elements evolving photosynthesis process, which converts solar into chemical energy. The
concentration of CO2 has amplified due mainly to massive remnant fuels boiling. This increase
makes plants grow rapidly. The rapid growth of undesirable plants leads to the increase use of
chemicals to eliminate them [3].
Sulphur Dioxide (SO2) - Sulphur Dioxide is a colorless gas, detectable by the distinct odor and
taste. Like CO2, it is mainly due to fossil fuels boiling and to manufacturing processes. In high
attentions may cause breathing problems, especially in sensitive groups, like asthmatics. It
contributes to acid rains.
Nitrogen Dioxide (NO2) – Nitrogen Dioxide is a brownish gas, easily detectable for its odor,
very corrosive and highly oxidant. It is produced as the result of fossil fuels burning. Frequently
NO terrified to the atmosphere is converted in NO2 by chemical processes. In high absorptions,
NO2 may principal to respiratory problems. Like SO2, it contributes to acid rains.
Smoke - About 1 million people are in custom of tobacco smoking globally of which majority
population is from rising countries. Every year nearly 4.9 million people expired due to
smoking allow to 2007 report. In addition, second hand smoke is serious threat to the health of
people of all age’s causes 41000 deaths each year.
LPG - Liquefied petroleum gas (LPG) is an odorless and colorless liquid which evaporates
readily into a gas. Leakage is generally noticed by adding an odorant into it. It is considered

4
under the category of highly flammable gases and it can be classified as a carcinogen and
mutagen if Butadiene content is more than 0.1%. LPG may escape in the form of a gas or a
fluid. If it escapes in the form of a liquid, it vanishes quickly and will eventually form large
cloud of gas in air, which is relatively thicker than air thus drops to the ground. Whereas, LPG
vapors travel along the ground for a long distance and gets collected in drains or basements.
Gas principals to burn or detonate after getting in touch with a source of ignition.
Temperature and humidity- Quantity of temperature is an important for safety of people and
affects our life skills. Greenhouse outcome can be observed by measuring temperature and
comparing temperature changes from historical to present time especially since the industrial
revolution using climate data. Humidity is a type of gas that guards us from UV rays from the
sun and helps trick heat on Earth, thereby making the climate on Earth, a pleasant one for
living. However, as humidity increases, the warmth on Earth also increases which makes our
life uncomfortable. Humidity is essential for various storage and food processing facilities.
1.5 Importance of Air Pollution Monitoring System
Air is one of the most basic and important elements for human being to survive. Clean and
Sound air is the key to a good and healthy life. But now days in city life it has become the most
threatened factor. Pollution of air has become the most concerned and affected issue now for
us. A diversity of air pollutants has known or suspected injurious effects on human health and
the atmosphere. In most areas, these toxins are principally the products of combustion from
space warming, power generation or from motor vehicle traffic flow. Pollutants from these
sources may not only prove a problem in the immediate locality of these sources but can travel
long distances. Generally, if someone is young and in a good state of health, moderate air
pollution levels are unlikely to have any serious short term effects. However, higher levels and
long term exposure to air pollution can lead to more serious symptoms and conditions causing
human health. This not only affects the respiratory and inflammatory response systems, but
can also lead to more serious conditions such as heart disease and cancer. People with lung or
heart situations to be more vulnerable to the effects of air pollution. Air pollution has also been
recognized by doctors as one of the world’s greatest 10 killers seeing some 29,000 premature
deaths in UK and 430,000 worldwide in one year. Air pollution can cause both short term and
long term effects on health and many people are concerned about pollution in the air that they
breathe. These people may include:
5
People with heart or lung situations, or other breathing problems, whose health to be
exaggerated by air pollution.
Parents, careers and healthcare professionals who look after someone whose health is
sensitive to pollution.
People who want to know more about air pollution, its causes, and what they can do to
help reduce it.
Monitoring air quality is essential for local authorities as well as for major public and private
industries to understand and prevent air pollution and measure emission sources, in order to
reserve health and donate to the fight against the greenhouse influence. Industrial operatives
use air quality monitoring apparatus to cost effectively monitor and manage emanations on
their perimeter, which helps them recover relationships with controllers and communities. With
air quality rule shifting the burden from publicly funded monitoring to observing funded by
industry, it has been progressively important for businesses to obtain their individual quality
monitoring equipment. To get the best results from the environment about the pollution level
of air, toxicity and harmfulness for human, air quality monitoring device is vastly used. An air
quality monitor is an expedient that actions the level of common air toxins. Displays are
available for both indoor and outdoor locations. Indoor air quality monitors are naturally sensor
based tools. Some of them are able to quantity ppb levels and come as either varied gas or
moveable units. Sensor based tools and air quality monitoring systems are used widely in
outdoor ambient claims.
1.6 Benefits and Beneficiaries
1.6.1 Benefits
1. Achievement of proper facility to ensure pollution free environment
2. Reduction of health risk in day-to-day life
1.6.2 Beneficiaries
1. Society People
2. Special Care Units in the hospitals
3. Urban and Rural planning sector and green building management system
6
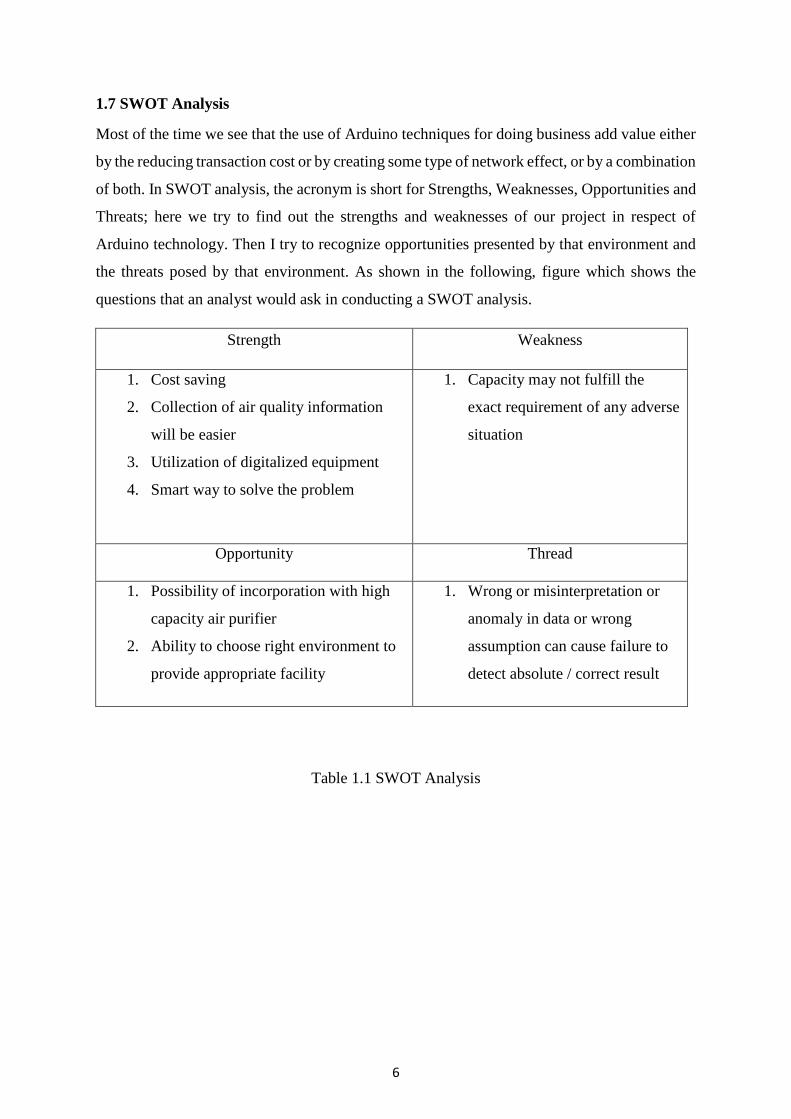
1.7 SWOT Analysis
Most of the time we see that the use of Arduino techniques for doing business add value either
by the reducing transaction cost or by creating some type of network effect, or by a combination
of both. In SWOT analysis, the acronym is short for Strengths, Weaknesses, Opportunities and
Threats; here we try to find out the strengths and weaknesses of our project in respect of
Arduino technology. Then I try to recognize opportunities presented by that environment and
the threats posed by that environment. As shown in the following, figure which shows the
questions that an analyst would ask in conducting a SWOT analysis.
Strength
Weakness
1. Cost saving
2. Collection of air quality information
will be easier
3. Utilization of digitalized equipment
4. Smart way to solve the problem
1. Capacity may not fulfill the
exact requirement of any adverse
situation
Opportunity
Thread
1. Possibility of incorporation with high
capacity air purifier
2. Ability to choose right environment to
provide appropriate facility
1. Wrong or misinterpretation or
anomaly in data or wrong
assumption can cause failure to
detect absolute / correct result
Table 1.1 SWOT Analysis
7
1.8 Advantages of Proposed Project
1.8.1 Portability
It is a compact device which consists of many sensors including cloud which are all combined
by using internet of things (IoT).
1.8.2 Safety
One can avoid from going to particular location by redirecting themselves or by taking safety
protections such as wearing mask and can reduce over dumped wastages in a particular locality
area [4].
1.8.3 Cost
Compared to others it’s efficient and low cost because sensor is clubbed by using internet of
things (IoT) and Arduino microcontroller.
1.8.4 Simple Maintenance
As the Project deals with the software embedded C, so maintenance will be easy and this can
also be installed in Arduino (arduino-1.8.10-windows.exe).
8
CHAPTER 2
LITERATURE REVIEWS
2.1 Introduction
This chapter reviews some of the past works in processing and understanding IoT based air
pollution detection monitoring system. Air pollution is not only natural medical matters impact
on creating nations alike. The strong effect of air pollution on wellbeing are extremely mind
blowing as there are a broad area of sources and their particular influence differ from one
another. The synthetic substances reason an assortment of mankind and natural medical issues
enlarge in air contamination impacts on condition also on human wellbeing. The proposed
framework unit incorporates an Arduino, MQ135 Gas sensor, LCD and ESP8266 Wi-Fi
Device. Almost all the past and recent works in IoT based on methods that implement these
steps sequentially and independently.
2.2 Opportunity, Status & Capability of IoT
2.2.1 Opportunity of IoT
The IoT create a huge network of billions or trillions of “Things” communicating each other.
The IoT is not dissident revolution over the existing technologies, it is comprehensive uses of
existing technologies, and it is the creation of the new communication modes. The IoT blends
the virtual world and the physical world by transporting different concepts and technical
components together: pervasive networks, reduction of devices, mobile communication, and
new ecosystem. In IoT, applications, services, middleware components, networks, and end
nodes to structurally planned and used in entire new ways. IoT proposals a means to look into
complex procedures and dealings. The IoT implies a symbiotic communication between the
physical and the digital worlds: physical entities have digital complements and virtual
illustration; things become context aware and they sense, communicate, interact, and exchange
data, information, and knowledge. New chances meet business requirements, and new services
to be created based on real-time physical world data. All from the physical or virtual world
possibly be connected by the IoT. Connectivity between the things to be available to all with
low cost and cannot be owned by private objects. For IoT, intelligent learning, fast placement,
best information understanding and interpreting, against fraud and malicious attack, and
privacy protection are vital requirements [5].
9
2.2.2 Status of IoT
The IoT regarded as an extension of existing interaction between people and applications
through a new dimension of “Things” for communication and integration. The IoT
development process is a multifaceted large-scale technological novelty process. The IoT is
developing from the vertical application to polymeric application. At the early stage of IoT
placement, driving of domain specific requests is the main development approach. A domain-
specific application might be an industrial control system with its own industry features. The
application can provide various enterprise management services being combined with the
industry manufacture and business processes. Polymeric requests are cross-industry
applications founded on public information service stages. These requests provision both home
users and industry users. The application is provided and promoted by communication
operators and solution providers with large scale. For example, a vehicle integrated with sensor
networks, a global positioning system (GPS), and radio communication technology provide
inclusive detection, navigation, entertainment, and other information services. By preserving
such information through the public service platform, consumers, original equipment
manufacturers (OEMs), maintenance providers, and vehicle organization agencies can share
this information and segment services to improve the vehicle, the vehicle component design,
and the fabrication process through the vehicle growth management.
2.2.3 Capability of IoT
In summary, the IoT applications have the following capabilities. Location Identifying and
Sharing of Location Info: The IoT system can gather the location information of IoT stations
and end nodes, and then offer services based on the collected location information. The location
information includes geographical position information got from the GPS, Cell-ID, RFID, etc.,
and complete or relative position information between things. More representative IoT
applications include at least the following.
Mobile asset tracking: This application track and display the status of product using the position
sensing device and statement function installed on the commodity.
Fleet management: The manager of the fleet schedule the vehicles and drivers established on
the business supplies and the real-time position information collected by the vehicles.
Traffic information system: This application gets traffic information such as road traffic
conditions and congested locations by tracking the location information of a large number of
vehicles. The system thus contributions the driver to select the most efficient route.
10
Environment Sensing: The IoT system collect and process all kinds of physical or chemical
environmental parameters via the locally or widely organized terminals. Typical environmental
information includes temperature, humidity, noise, visibility, light intensity, spectrum,
radiation, pollution (CO, CO2, etc.), images, and body pointers. Representative applications
include at least the following.
Environment detection: IoT systems offer environmental and ecological, such as forest and
glacier, checking; disaster, such as volcanoes and seismic, monitoring; and factory monitoring.
All are automatic alarm systems using environmental parameters collected by large number of
sensors.
Remote medical monitoring: IoT analyze the recurring indicator data collected from the device
placed on patients’ body and provide the users with health trends and health advice.
Remote Controlling: IoT systems control IoT terminals and execute functions based on
application commands combined with information collected from things and service
requirements.
Appliance control: People remotely control operating status of appliances through IoT system.
Disaster recovery: Users remotely start disasters treatment facilities to minimize losses caused
by disasters according to the monitoring mentioned before.
Ad Hoc Networking: IoT system have rapidly self-organized networking capability and can
interoperate with the network/service layer to provide related services [7]. In the vehicle
network, in order to transfer the data, the network between vehicles and/or road infrastructures
rapidly self-organized.
Secure Communication: IoT system further establish secure data transmission channel between
the application or service platform and IoT terminals based on service requirements
2.3 Motivation and General Description
As seen in the previous overview to the current IoT, most IoT applications in China were
domain-specific or application specific solutions. The architectures of these IoT systems are
split and cannot correlate and integrate the data from different storage tower; these isolated IoT
keys use private protocols and cause much difficulties in information sharing, technology
multiplexing, network managements, and advancement. All these problems are delaying the
development of IoT. In order to decrease the total IoT cost and share information, I need to
11
integrate multiple functions and capitals into a larger system. IoT thus needs to be intended
with an open and generic IoT architecture with open borders and resources, considering
different business scenarios, application-based requirements, and current technologies. I have
thus seen the motivation to express a standard for IoT integration in order to reduce the total
cost of money and time from devices, developments, and deployments. An open and basic IoT
architecture is an integrated solution with interoperability. It has the following characteristics.
Standard Interface and Protocol: By comparing various private IoT systems, a generic IoT
structure has the same hardware and software interfaces, and protocols.
Public and Operating: A general IoT architecture is organized to take over public IoT
applications with open operating competence. A public IoT system integrate multiple IoT
requests into one architecture.
Open, Scalable, and Flexible: An open IoT architecture with open resources, open standards,
and open interfaces easily extend its functionality and the scale of performance. It adapts to
different requirements including technical growths flexibly.
2.4 Open and General IoT Architecture
China Communications Standards Association (CCSA) planned a reference model for the IoT,
which consists of sensing layer, network and business layers, and application layer. Fulfilling
with this reference model, its open and general architecture, which is layered, open, and elastic.
The architecture includes three functional stages as follows.
Sensing and Gateway Platform: This platform connects sensors, controllers, RFID readers, and
location detecting device (e.g., GPS) to IoT network layer. Modularization of hardware, data
format, and software edge is proposed for IoT terminal, IoT Gateway, and angle node. IoT
terminal, IoT gateway, and tip node can include flexible modules combined with control
module, common interface module, and communication module. Joint interface module
collects physical interfaces of various sensors into a shared interface. Common control module
can connect sensors, controllers, GPS, and RFID booklovers with a common connection
protocol. The software and application parameters of an IoT terminal and IoT gateway ought
to be able to self-configure and self-adapt. Modularization, shared interface, intelligent
operation, self-adaption, and self-configuration are important characteristics of this stage.
Resource and Administration Platform: Network and service layer includes backbone networks
and resource administration stages. The backbone network contains 3G, 4G, internet, optical
fiber network, Ethernet network, satellite networks, and private network. The resource and
12
administration stage provides common capabilities which can be used by different IoT
applications, such as data processing, data storage, security management, and application
supporting. These abilities may also be invoked by specific IoT application support
capabilities, e.g., to build other specific IoT application support capabilities. This stage also
provides relevant control functions of network connectivity, such as access and transport
resource control functions, mobility management, or authentication, authorization, and
accounting for IoT terminals, services, applications, users, and developers.
Open Application Platform: Modularization design in this application stage provides common
function and open application programming interface (API). An IoT application provider
develop its application using these APIs. Meanwhile, this stage supports application
managements. Various applications can be obtainable to the application stage and users get
application information and subscribe applications through this platform. Suitable and easy
deployment, distribution, and flexible application environment are the characteristics of this
stage.
2.5 Challenge & Prospect of IoT
IoT trends to be unified, seamless, and pervasive. Largescale service deployment needs to be
framed within a set of standards. However, IoT involves many manufacturers, spans multiple
industries, and it differs widely in application scenarios and user requirements, which
consequently gives impacts on large-scale commercial deployment of related services. The
development of IoT is a step-by-step process. There are still many problems to be solved, such
as low power nodes and computing, low cost and low latency communication, identification
and positioning technologies, self-organized distributed systems technology, and distributed
intelligence.
2.5.1 Challenge of IoT
The IoT provides many new chances to the industry and end user in many application fields.
Currently, however, the IoT itself lacks theory, technology architecture, and standards that
integrate the simulated world and the real physical world in an integrated framework.
Following key challenges are thus recorded.
Architecture Challenge: IoT encompasses a life-threatening wide range of technologies. IoT
involves a cumulative number of smart interconnected devices and sensors (e.g., cameras,
biometric, physical, and chemical sensors) that are often nonintrusive, transparent, and
invisible. As the communications among these devices are predictable to happen anytime,
13
anywhere for any related services, generally, these communications are in a wireless,
autonomic, and ad hoc manner. In addition, the services become much more mobile,
regionalized, and complex. In IoT, data integrations over different environments are thus tough
and to be supported by modular interoperable components. Infrastructure solutions require
systems to combine volumes of data from various sources and control relevant features, to
interpret data and show their relationships, to compare data to ancient useful information, and
support decision-making. Single position architecture cannot be a blueprint for all applications.
Heterogeneous situation architectures have to coexist in IoT. Architectures should be open, and
following standards, they should not limit users to use fixed, end-to-end solutions. IoT
architectures should be flexible to cater for suitcases such as identification (RFID, tags),
intelligent devices, and smart objects (hardware and software solutions).
Technical Challenge: IoT technology to be complex for variety of reasons. First, there are
legacy heterogeneous architectures in the present networking technologies and applications,
e.g., different applications and environments need different networking technologies, and the
ranges as well as other features of cellular, wireless local area network, and RFID technologies
are much unlike from each other. Second, communication technologies, including fixed and
mobile communication systems, power stripe communications, wireless communication, and
short-range wireless communication technologies, for both fixed and mobile devices, either
simple or complicated, should be low cost and with reliable connectivity. At last, there are
thousands of unlike applications; it is in natural to have different requirements on what parties
need to communicate with each other, what kind of security solutions are appropriate, and so
on. To recap, complexity and alternative technologies may introduce problems; unnecessary
competition and deployment barriers in markets may also introduce problems; systems and
communication mechanisms with needless dependencies may block the relocation of IoT
systems to the most economic and efficient stages. All the above may block IoT to join as many
“Things” as possible.
Hardware Challenge: Smart devices with improved inter-device communication will lead to
smart systems with high degrees of intelligence. Its independence enables rapid deployment of
IoT applications and creation of new services. Therefore, hardware researches are focusing on
designing wireless recognizable systems with low size, low cost yet sufficient functionality.
As the bandwidth of IoT terminals could vary from kbps to mbps from sensing simple value to
video stream, supplies on hardware are diverging. However, two requirements have been
nevertheless the basics: one is the extremely low power consumption in sleep mode and the
14
other is ultra-low cost. Suppose the snoozing time over active time is one million, the escape
power of an IoT terminal at least be one million time less than that of active. It is so far
incredible when an IoT terminal is snoozing and receiving RF signals. It difficult when using
advanced CMOS silicon with relatively more leakage power. Hardware and protocol code sign
for snoozing has been thus the first hardware challenge of IoT. Billions of IoT terminals used;
the cost of an IoT terminal necessity be ultra-low. Though, so far, there is no low cost locating
solution for IoT, especially the positioning precision of a short-range IoT terminal must be
high. Low energetic power is also a contest for low-cost terminal. Traditionally, low cost equals
to lower presentation or longer process latency. Longer treating latency ends up to higher
energy consumption. As the range resource is very limited at the lower part in L band, IoT may
use higher RF such as the frequency bands higher than 5 GHz. The higher the RF, the more
power feasting from RF PA will be. In another way, not yet used very narrow spectrum band
between two used bands have to be used by future IoT. To use very narrow band with strong
power neighbors, the cost of passive component not be low and that will definitely be a
potential challenge in the future.
Privacy and Security Challenge: Compared with outdated networks, security and privacy issues
of IoT become more prominent. Much information includes privacy of users, so that defense
of privacy becomes an important security issues in IoT. Because of the mixtures of things,
services, and networks, security of IoT needs to cover more administration objects and levels
than traditional network security. Existing security architecture is intended from the perception
of human communication, may not be suitable and directly applied to IoT system. Using
existed security instruments block logical relationship between things in IoT. IoT needs low-
cost- and M2M-oriented technical solutions to assurance the privacy and the security. In many
use cases, the security of a system has been considered as a general feature. Related research
shall focus on privacy control. Low cost, low latency, and energy-efficient cryptography
algorithms and related supple hardware to be essential for sensor or device.
Standard Challenge: Standards play a significant role in forming IoT. A standard is important
to allow all actors to equally access and use. Developments and coordination of standards and
proposals promote efficient development of IoT infrastructures and applications, services, and
devices. In general, standards developed by cooperated multi parties, and information models
and protocols in the standards, shall be open. The standard development process shall also be
open to all participants, and the resulting standards publicly and freely available. In today’s
network world, global standards are naturally more relevant than any local arrangements.
15
Business Challenge: For a mature application, its business model and request scenario are clear
and easy to be mapped into technical necessities. So the developers do not need to spend much
time on business-related aspects. But for IoT, there are too many potentials and uncertainties
in business models and application states. It is inefficient in terms of business-technology
alignment, and one solution not fit possibilities for all. The IoT is a stimulating traditional
business model. Although small-scale applications have been lucrative in some industries, it is
untenable when extended to other industries. In the early stage of IoT development, business
aspects should be careful to reduce the risk of failure.
2.5.2 Prospect of IoT
With the development and adulthood of distributed intelligent information processing
technologies, IoT systems make intelligent sensing widely available through information
sharing and teamwork. The gradual founding and improvement of the standards system
inescapably bring IoT into our daily life. The IoT creates an opportunity for the web-based
services, thus attractive the commercial and social potential future of IoT. The growth of IoT
keeps going forward along scale, collaborative, and intelligent. Promoted by technology,
standardization, and application experiences, IoT applications expand the scale in the different
industries, and more initiatives to be attracted to come in.
Interoperability: Information interoperability take place among unlike things, unlike
enterprises, unlike industries, and unlike regions or countries; application models change from
closed to open and the globalization of IoT application system helping different industries and
fields to be constructed. Interoperability is the essential issue for adventure layers of physical,
device, communication, function and application. These levels usually are built with different
languages and protocols. Level and domain clear languages and protocols are, therefore,
needed. A rounded approach is required in addressing and solving the interoperability of IoT
devices and services at several layers.
Intelligent System: The IoT bring seamless business and social networking over fast reliable
and protected networks into our society. System intelligence important for the development of
IoT and the key point context awareness and inter-things information exchange. Therefore,
increasing and familiarizing the intelligence at the device level will be a focus of research, such
as the integration of sensors and actuators, high efficiency, multi standard and adaptive
communication subsystems, and adaptable antennae. Intelligences can be presented using
micro control unit (MCU) on upper layers. However, physical layer so far has been far behind
the mandatory intelligent level, for example, to adapt IoT devices under different radio
16
infrastructures. Four parts in physical layer must be further advanced to adapt to and/or to form
an intelligent IoT device, which are as follows. Programmable baseband processor used to
adapt to different modulation algorithms, different error correction algorithms, different
channel bandwidths, and diverse channel scenarios. Software-controlled RF essential for
transceiver to adapt to the local radio frequency necessities. Fully digital RF PA the
indispensable device to consume less low power and offer programmability for PA to adapt
radio transmission requirements. Finally, controllable integrated passive components an
essential glue to connect intelligent semiconductor components into a sensor node with low
cost, low size, and low power.
Energy Sustainability: In the future, energy-efficient and self-sustainable systems key
enhancing issues to the IoT. The ways to harvest energy from surroundings must be developed.
Efficiency in dispensation and communication must also be increased through new circuits,
new programming paradigms, and the further growth of energy-efficient protocols and smart
antennae. The expansion of new, efficient, and compact batteries, fuel cells, as well as new
energy generation devices join energy transmission methods or energy harvesting the key
factors for the roll-out of autonomous wireless smart systems. Charging of global IoT
terminals, power consumption of global IoT access points and gateways, as well as the power
consumption of IoT data processing in IoT substructures one of the dominant power consumers
in the future world. Mechanical energy harvests sufficient for body network as a part of IoT.
Solar or wind energy is a provisional energy sources which may not be dependable. It used for
battery charging.
2.6 Conclusion
The IoT incorporates several technologies such as information technology, cognitive sciences,
communication technology, and low-power electronics. IoT creates a newer information
society and information economy. But the trials from research, industries, and the government
will keep pushing and investing. The expansion of IoT depend on technological advances in
silicon scaling and energy-efficient devices, in getting the information from mixed sources, in
reducing costs, and in refining efficiencies. The development of the IoT exposed many new
challenges including the lack of essential theory supporting, unclear architecture, and
undeveloped standards. To meet these challenges, I give a three-layer architecture including
three platforms. The proposed acting standard can confidently balance desires from different
parties, can open the door for future important theory development, and can eventually
17
stimulate/regulate IoT development. Recent years, Chinese government is pushing the
expansion of the IoT. Following the Chinese 12th Five-Year Plan for IoT Development, China
has skillful a number of demonstration application projects such as the smart city and the
intelligent transportation system in public IoT applications, intelligent coal mine, and the IOFs
in industry claims. The future of IoT will be predictable to be unified, seamless, and pervasive.
Large-scale service deployment needs to be enclosed within a set of standards. Thus, the
developments of IoT as a brainy system can be proceeding with interoperability, energy
sustainability, privacy, and security. IoT have become a predictable trend of development of
information industry, which certain to bring new changes to our lives.
18
CHAPTER 3
PROPOSED SYSTEM ARCHITECTURE
3.1 Introduction
The paper aims at designing an air pollution monitoring system which can be installed in a
specific locality and to enhance the system from the previously developed systems beating the
earlier disadvantages by developing an android app available for the public. This app can be
used by anyone to get in live updates about the pollution in their region. It uses Arduino
integrated with individual gas sensors like carbon monoxide, ammonia along with particulate
matter, humidity, and smoke which measures the concentration of each gas separately. The
collected data is uploaded to the cloud using thing speak platform at regular time intervals.
Ethernet shield is used for connecting Arduino and cloud. Pictorial or graphical representation
of values can be shown in Thing speak The users can install an android application through
which they get the recent updates and graphical content up to date [6]. The average
concentration of each gas is analyzed using matlab. Then certain time control is assigned based
on the standard level of each gas measured and the result can be viewed in android application.
The architecture of air pollution monitoring and awareness creation system. The concentration
level of each gas can be viewed both as a graph and in numerical format. Based on these values
the air quality index value is calculated and the nature of the air quality in that area is
determined which is also displayed through the app. Along with this, the health effects for the
corresponding air quality is displayed to create awareness among the public. Additionally, they
could also get to know the temperature and weather in that region. The users will not get
disturbed with irrelevant data as the values displayed are location specific and help them stay
tuned to the current status of air pollution.
19
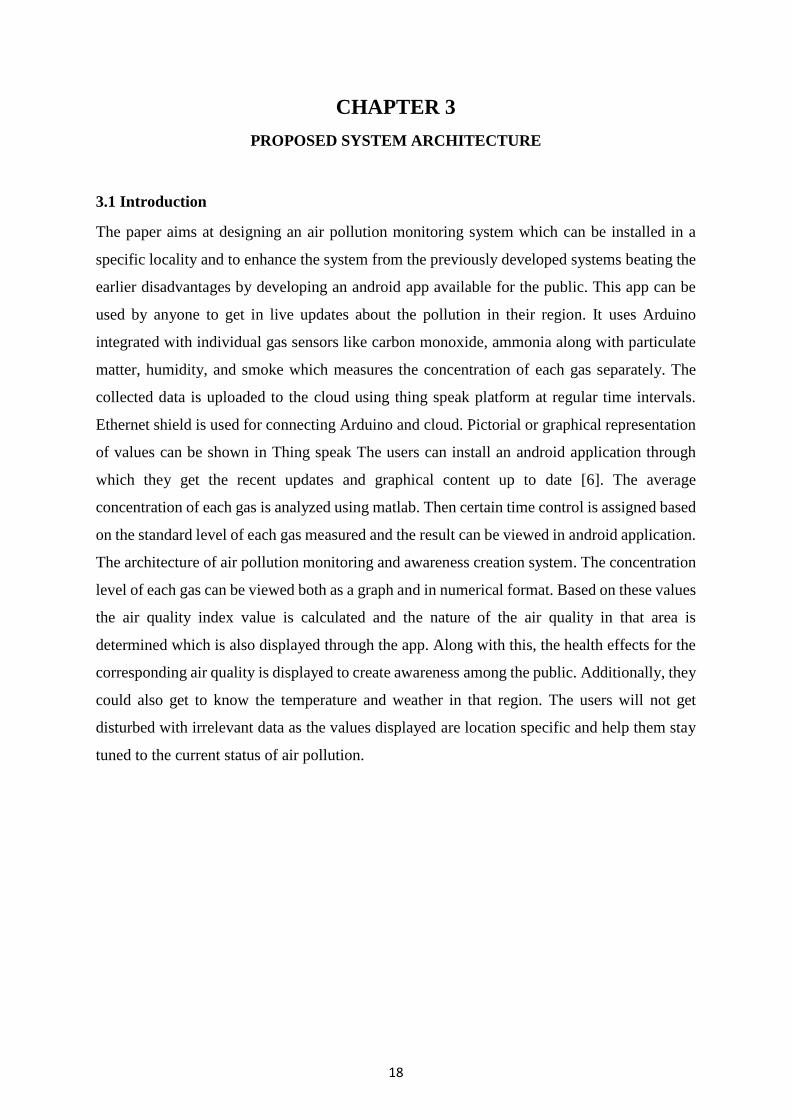
3.2 Proposed System Architecture
Internet of Things (IoT) mainly deals with connecting smart devices to internet by joining the
advantage of OSI layered Architecture. In the context of this work we propose a cluster of Air
Quality Monitoring Gas Sensor MQ135 motes, which are used to measure the concentration of
Air pollutants in the air. The Gas Sensors MQ135 is interface with a tiny entrenched platform
equipped with other [7]. We have mainly used the Arduino UNO which is an open source
development boards with ESP8266-12E chips. MQ135 Gas Sensor is used to collect gas
concentration measurements. This sensor data would be captured and sent to the Arduino UNO
for IoT (Internet of Things) based data acquirement.
Fig 3.2 Proposed System Architecture
20
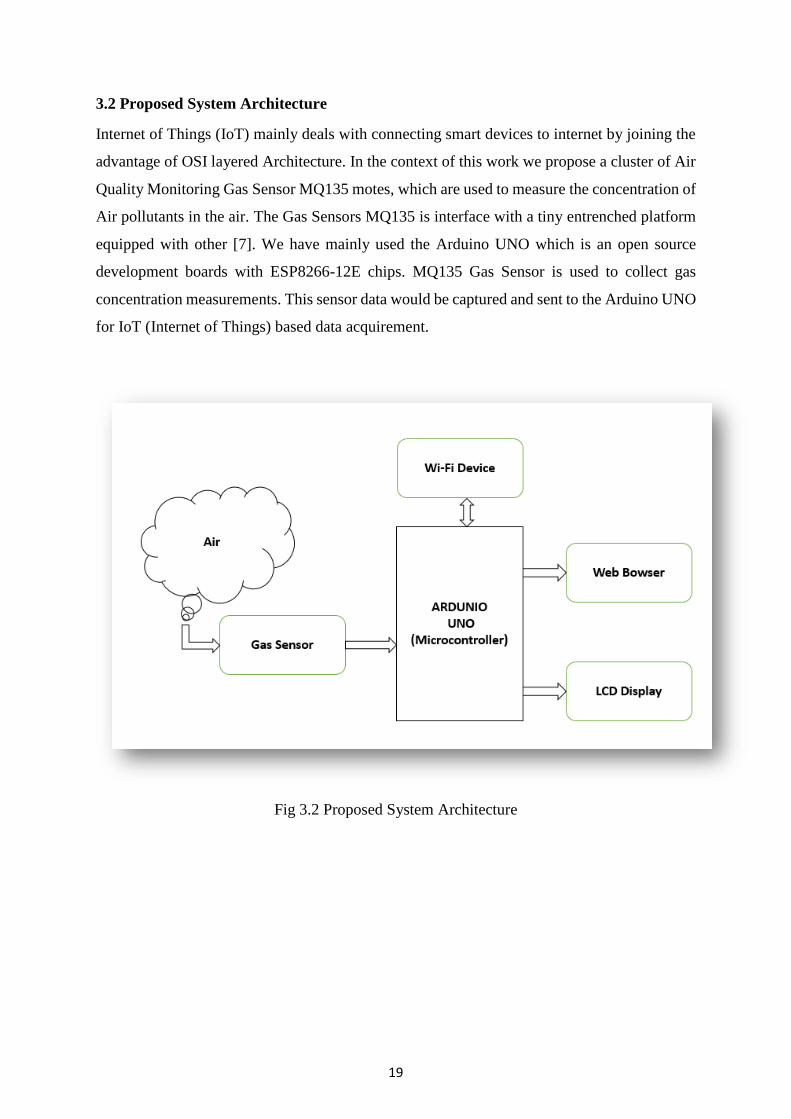
3.3 Circuit Diagram
I connect the ESP8266 with the Arduino. ESP8266 runs on 3.3V and connect the VCC and the
CH_EN to the 3.3V pin of Arduino. The RX pin of ESP8266 works on 3.3V and it
communicate with the Arduino when I connect it directly to the Arduino. So, I have to make a
voltage divider for it which convert the 5V into 3.3V. This can be done by connecting three
resistors in series like I did in the circuit. Connect the TX pin of the ESP8266 to the pin 8 of
the Arduino and the RX pin of the esp8266 to the pin 9 of Arduino. ESP8266 Wi-Fi module
gives my projects access to Wi-Fi or internet. Then I connect the MQ135 sensor with the
Arduino. Connect the VCC and the ground pin of the sensor to the 5V and ground of the
Arduino and the Analog pin of sensor to the A0 of the Arduino. Connect a buzzer to the pin 7
of the Arduino which start to beep when the condition becomes true. In last, I connect LCD
with the Arduino [8]. The connections of the LCD are as follows
Connect pin VCC to the 5V of the Arduino; Connect pin GND to the GND of the Arduino;
Connect pin RS to the pin 12 of the Arduino; Connect pin RW & GND (Read/Write) to used
Jumper pin; Connect pin E to the pin 11 of the Arduino; The following four pins are data pins
which are used to communicate with the Arduino; Connect pin D4 to pin 5 of Arduino; Connect
pin D5 to pin 4 of Arduino; Connect pin D6 to pin 3 of Arduino; Connect pin D7 to pin 2 of
Arduino.
Fig 3.3 Circuit Diagram
21
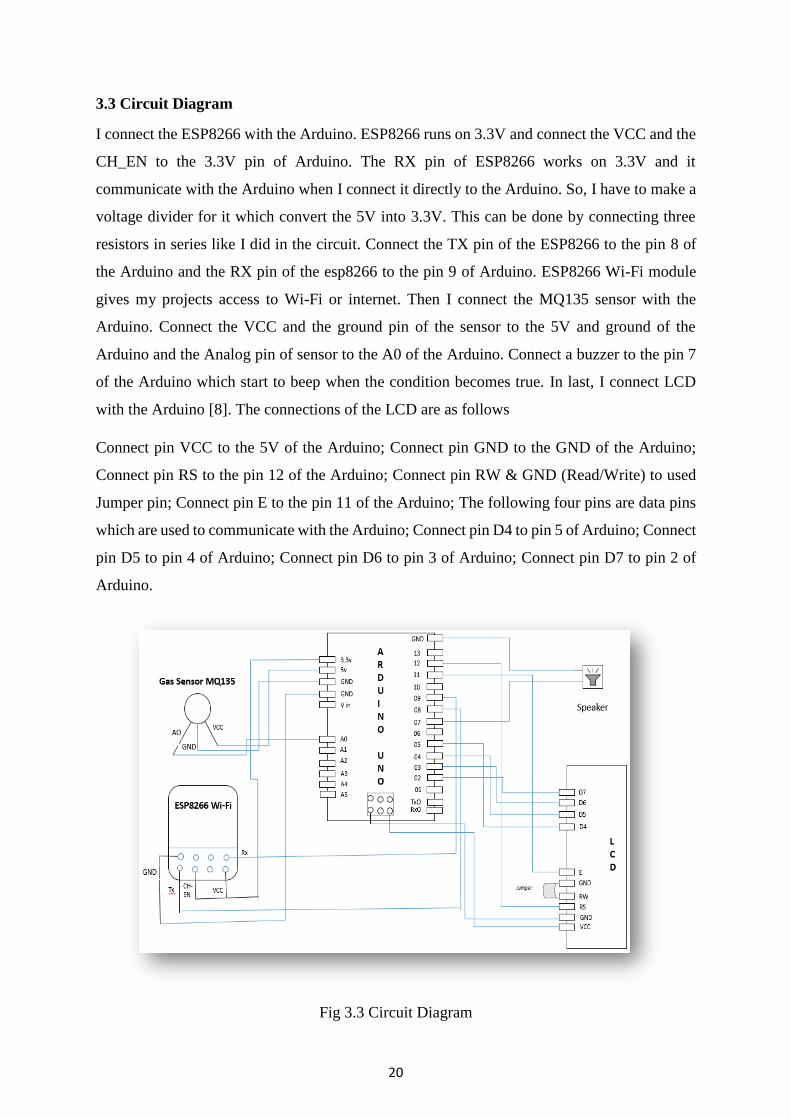
3.4 Block diagram for proposed model of the system
The major components of my project have been mentioned in the above section. Here I explain
the architecture. Gas sensor & Wi-Fi Device are connected to the Arduino board. Also LCD
connected to the Arduino board for displaying information. I am monitor the Air Quality over
a serial monitor & LCD using Gas sensor and trigger an alarm when the air quality goes down
beyond a certain level, means when there is sufficient amount of harmful gases are present in
the air like CO2, smoke, alcohol, benzene and NH3. It is shown the air quality in PPM on the
LCD as well as serial monitor so that I can monitor it very easily [9]. I have used MQ135 sensor
which is the best choice for monitoring Air Quality as it can detect most harmful gases and can
measure their amount accurately. In this Internet of Things (IoT) project, I can monitor the
pollution level from anywhere using computer.
Fig 3.4 Block diagram for proposed model of the system
22
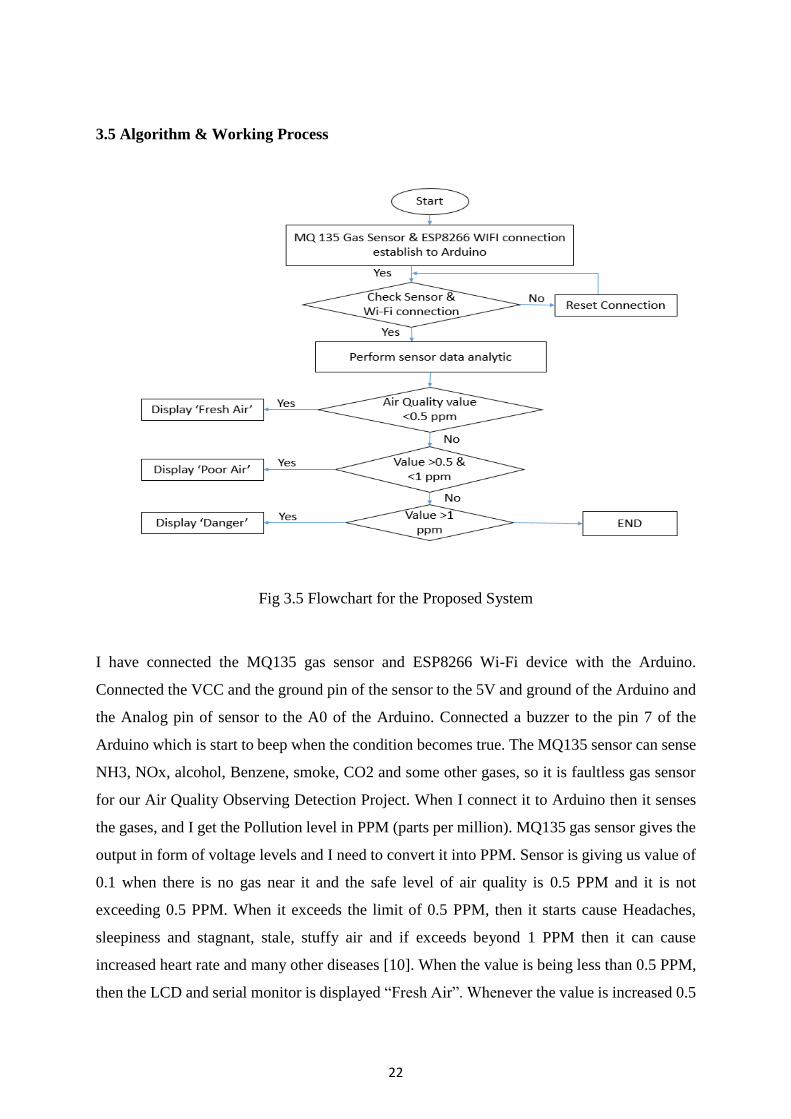
3.5 Algorithm & Working Process
Fig 3.5 Flowchart for the Proposed System
I have connected the MQ135 gas sensor and ESP8266 Wi-Fi device with the Arduino.
Connected the VCC and the ground pin of the sensor to the 5V and ground of the Arduino and
the Analog pin of sensor to the A0 of the Arduino. Connected a buzzer to the pin 7 of the
Arduino which is start to beep when the condition becomes true. The MQ135 sensor can sense
NH3, NOx, alcohol, Benzene, smoke, CO2 and some other gases, so it is faultless gas sensor
for our Air Quality Observing Detection Project. When I connect it to Arduino then it senses
the gases, and I get the Pollution level in PPM (parts per million). MQ135 gas sensor gives the
output in form of voltage levels and I need to convert it into PPM. Sensor is giving us value of
0.1 when there is no gas near it and the safe level of air quality is 0.5 PPM and it is not
exceeding 0.5 PPM. When it exceeds the limit of 0.5 PPM, then it starts cause Headaches,
sleepiness and stagnant, stale, stuffy air and if exceeds beyond 1 PPM then it can cause
increased heart rate and many other diseases [10]. When the value is being less than 0.5 PPM,
then the LCD and serial monitor is displayed “Fresh Air”. Whenever the value is increased 0.5
23
PPM, then serial monitor is displayed “Poor Air, Open Windows”. If it is increased 1 PPM,
then the buzzer is kept beeping and the LCD is displayed “Danger! Move to fresh Air”. After
uploading the code, I am connected to the Wi-Fi of my ESP8266 device, the serial monitor has
opened and it is showing the IP address like shown below (192.168.43.57). If I have typed
mentioned IP address in my browser, it is shown the output as below. I have to refresh the page
again if I want to see the current Air Quality Value in PPM. After uploading code, the value is
being less than 0.5 PPM, then the LCD and Web Browser is displayed “Fresh Air”. After
uploading code, the value is increased 0.5 PPM, then the LCD and web browser are displayed
“Poor Air, Open Windows”. After uploading code, When the value is increased 1.00 PPM then
the buzzer is kept beeping and the LCD and Web Browser are displayed “Danger! Move to
fresh Air”.
3.6 Implementation Technologies
It’s a device that takes data from the environment that has been selected for our research
purpose. The device is built with various sensors and they take data by sensing from the
environment. The sensors take analog data from the environment which later is converted into
digital with the help of Arduino and then sent to the server where all the data are stored [11].
This device is consisting of the following components:
i. Arduino Uno
ii. Gas sensor MQ135
iii. ESP8266 Wi-Fi Device
iv. 16x2 LCD
v. Buzzer
vi. 0.5m Arduino A-B Cable
vii. Jumper wire
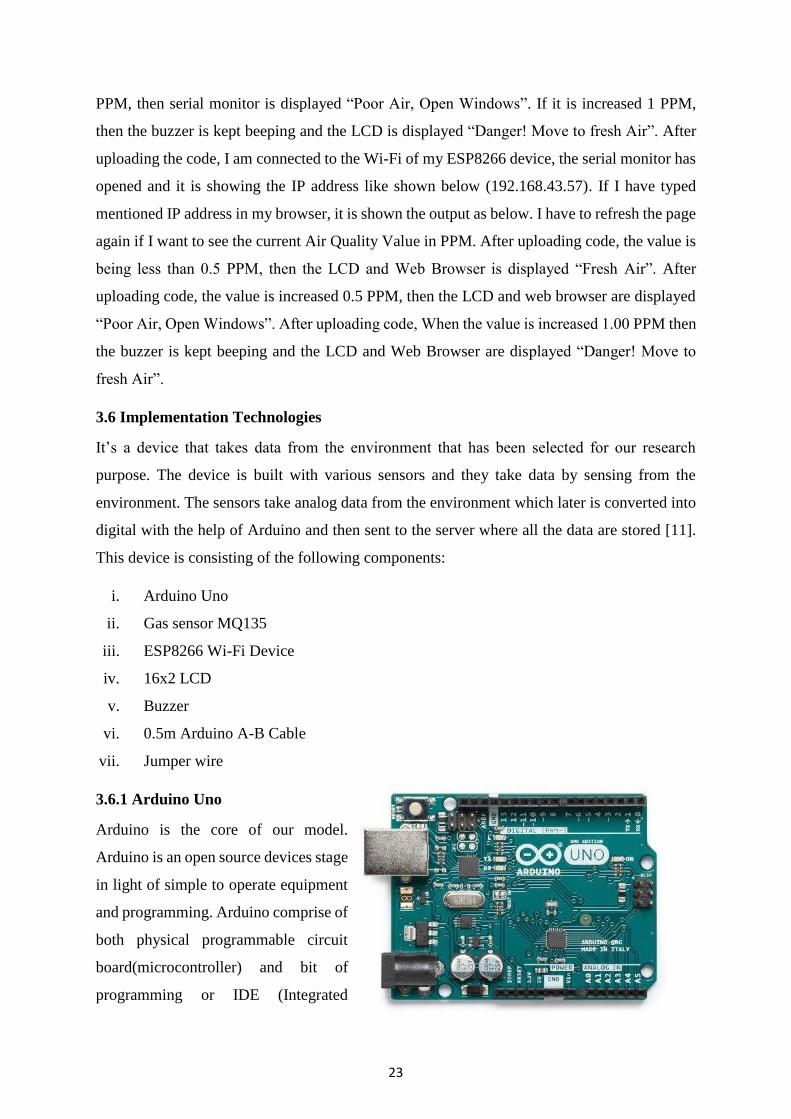
3.6.1 Arduino Uno
Arduino is the core of our model.
Arduino is an open source devices stage
in light of simple to operate equipment
and programming. Arduino comprise of
both physical programmable circuit
board(microcontroller) and bit of
programming or IDE (Integrated
24
Development Environment) that keeps running on our PC, used to compose and transfer PC
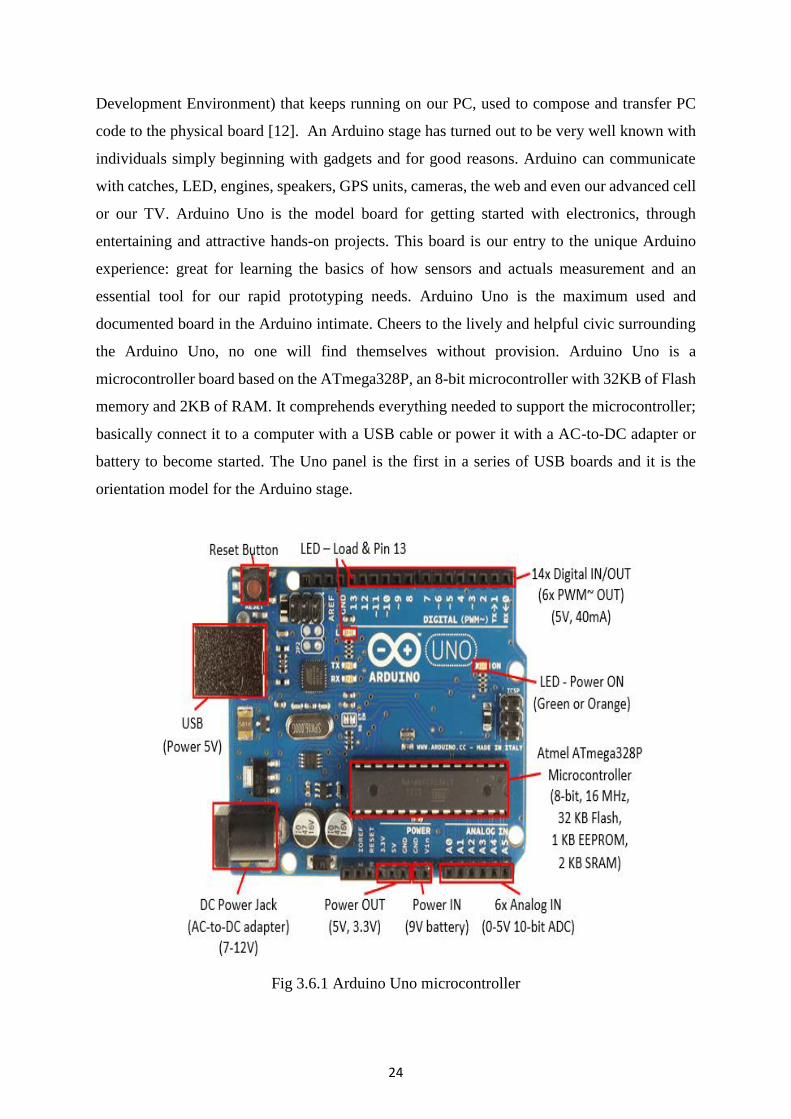
code to the physical board [12]. An Arduino stage has turned out to be very well known with
individuals simply beginning with gadgets and for good reasons. Arduino can communicate
with catches, LED, engines, speakers, GPS units, cameras, the web and even our advanced cell
or our TV. Arduino Uno is the model board for getting started with electronics, through
entertaining and attractive hands-on projects. This board is our entry to the unique Arduino
experience: great for learning the basics of how sensors and actuals measurement and an
essential tool for our rapid prototyping needs. Arduino Uno is the maximum used and
documented board in the Arduino intimate. Cheers to the lively and helpful civic surrounding
the Arduino Uno, no one will find themselves without provision. Arduino Uno is a
microcontroller board based on the ATmega328P, an 8-bit microcontroller with 32KB of Flash
memory and 2KB of RAM. It comprehends everything needed to support the microcontroller;
basically connect it to a computer with a USB cable or power it with a AC-to-DC adapter or
battery to become started. The Uno panel is the first in a series of USB boards and it is the
orientation model for the Arduino stage.
Fig 3.6.1 Arduino Uno microcontroller
25
This device is intended to provide the user with a cost-efficient means of determining air
quality. Our sensor attentions on the five components of the Eco-friendly Protection Agency's
Air Quality Index: ozone, particulate matter, carbon monoxide, sulfur dioxide, and nitrous
oxide. This device detects all of these pollutants except sulfur dioxide. The device also contains
a civic gas sensor to alert the operator to gas leaks or the presence of combustible gases. Also,
a temperature and humidity sensor is involved as these situations can influence the performance
of the gas sensors. We have yet to fully calibrate our device, but we have extracted data from
sensor data sheets to make some preliminary estimations. The sensors used are moderately low-
cost and vary importantly from component to component so they essential to be calibrated with
known attentions of the target gasses. I have not yet had the chance do so. It is the maximum
flexible hardware platform used based on ATmega328P which can be planned according to the
purpose where it is to be used. It has 6 analog inputs, 14 digital input/output pins (6 pins of
these can be used as PWM outputs), a USB connection, a 16 MHz quartz crystal, SPI, serial
interface, a reset button, a power jack and an ICSP header. The Arduino microcontroller is not
only for technical spectators but is intended for inventors and artists as well because of its focus
to usability based on its design which helps to achieve the proposed goal. It is the primary
component of the framework. In accumulation, it is an open source microcontroller device with
easily reachable software/hardware platform and is well-matched with many sensors available.
All needed for its working is present on the board; we only require a USB cable to straight
connect it to the computer or provide power using battery source or AC to DC adapter to get
started. Similarly, it is not expensive and can be measured with free authoring software i.e. IDE
(integrated development environment). With the availability of a large no. of source codes over
the internet, the programming of Arduino becomes relaxed. The online rising community
backing Arduino involves of programmers like us that segment their examples for others to
make it a more dependable platform. It is principally used in RF and IR circuits. These
interpreters are mainly used for remote control applications like intruder alarm, car door alarm,
security system etc. The chosen pair of encoder and decoder for communication should have
same number of address and data bits.
26
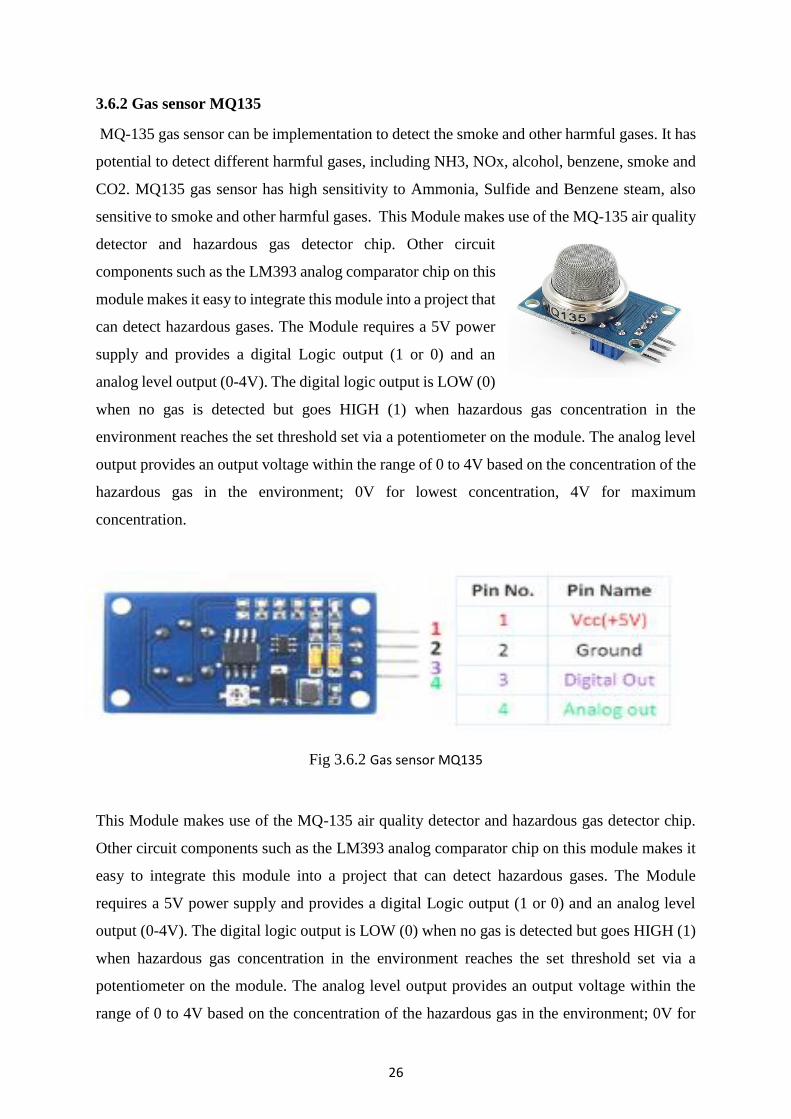
3.6.2 Gas sensor MQ135
MQ-135 gas sensor can be implementation to detect the smoke and other harmful gases. It has
potential to detect different harmful gases, including NH3, NOx, alcohol, benzene, smoke and
CO2. MQ135 gas sensor has high sensitivity to Ammonia, Sulfide and Benzene steam, also
sensitive to smoke and other harmful gases. This Module makes use of the MQ-135 air quality
detector and hazardous gas detector chip. Other circuit
components such as the LM393 analog comparator chip on this
module makes it easy to integrate this module into a project that
can detect hazardous gases. The Module requires a 5V power
supply and provides a digital Logic output (1 or 0) and an
analog level output (0-4V). The digital logic output is LOW (0)
when no gas is detected but goes HIGH (1) when hazardous gas concentration in the
environment reaches the set threshold set via a potentiometer on the module. The analog level
output provides an output voltage within the range of 0 to 4V based on the concentration of the
hazardous gas in the environment; 0V for lowest concentration, 4V for maximum
concentration.
Fig 3.6.2 Gas sensor MQ135
This Module makes use of the MQ-135 air quality detector and hazardous gas detector chip.
Other circuit components such as the LM393 analog comparator chip on this module makes it
easy to integrate this module into a project that can detect hazardous gases. The Module
requires a 5V power supply and provides a digital Logic output (1 or 0) and an analog level
output (0-4V). The digital logic output is LOW (0) when no gas is detected but goes HIGH (1)
when hazardous gas concentration in the environment reaches the set threshold set via a
potentiometer on the module. The analog level output provides an output voltage within the
range of 0 to 4V based on the concentration of the hazardous gas in the environment; 0V for
27
lowest concentration, 4V for maximum concentration. You can use it detects hazardous gases
such as Ammonia, Nitrogen Oxide, Alcohol, Benzene, Smoke (Carbon Monoxide), Carbon
Dioxide and other air contaminants in our DIY project. The MQ-135 device on this module
uses a heating element. After initial power ON, please wait at least 20 Seconds before reading
outputs to ensure data validity. The Sensitive material used in MQ135 gas sensor is SnO2. The
conductivity of this material is lower in clean air. The sensor conductivity increases with the
increasing concentration of target pollution gas. MQ135 can monitor different kinds of toxic
gases such as sulphide, ammonia gas, benzene series steam and CO2. The detection range is
10-10,000 ppm with the voltage rate of about 5.0V±0.1V AC or DC The important features are
long life span, low cost, simple driver circuit and good sensitivity to toxic gases. MQ 135 gas
sensor is widely used in industrial gas alarm, portable gas detector and domestic gas alarm as
shown in Fig.6. MQ-135 is used in this framework for monitoring CO2 in air. The amount of
CO2 present in the atmosphere is 400.7 ppm according to which the sensor is calibrated.
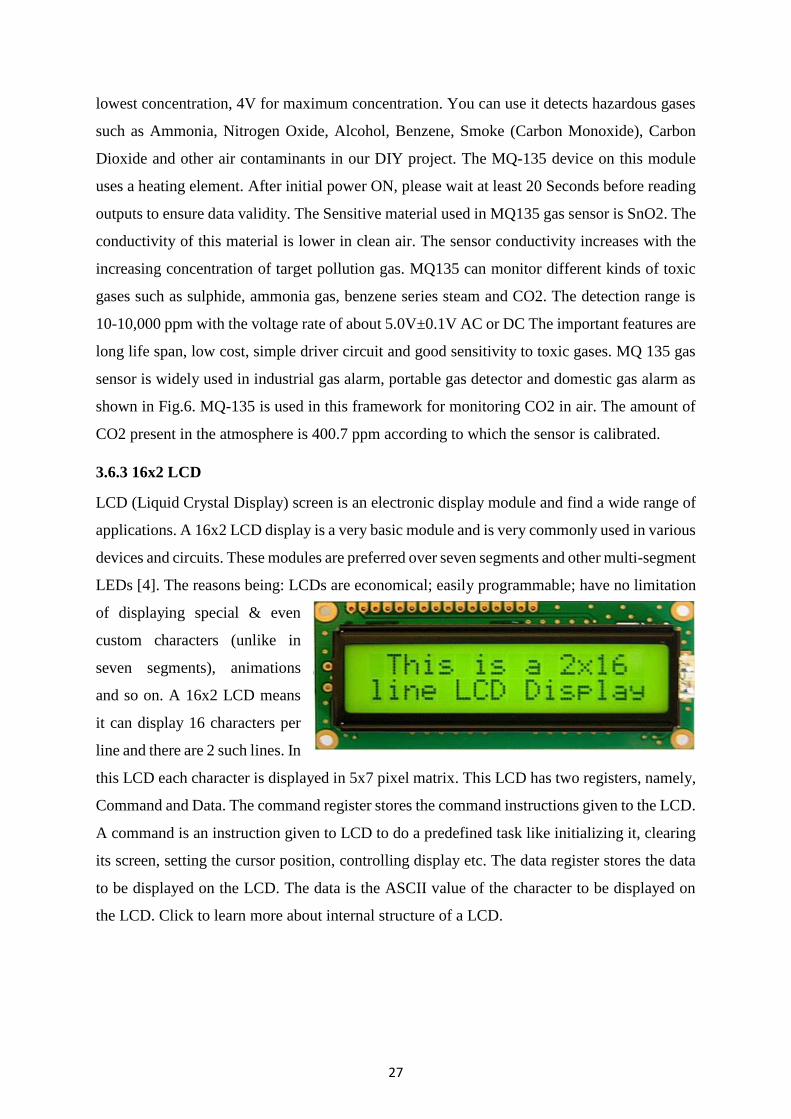
3.6.3 16x2 LCD
LCD (Liquid Crystal Display) screen is an electronic display module and find a wide range of
applications. A 16x2 LCD display is a very basic module and is very commonly used in various
devices and circuits. These modules are preferred over seven segments and other multi-segment
LEDs [4]. The reasons being: LCDs are economical; easily programmable; have no limitation
of displaying special & even
custom characters (unlike in
seven segments), animations
and so on. A 16x2 LCD means
it can display 16 characters per
line and there are 2 such lines. In
this LCD each character is displayed in 5x7 pixel matrix. This LCD has two registers, namely,
Command and Data. The command register stores the command instructions given to the LCD.
A command is an instruction given to LCD to do a predefined task like initializing it, clearing
its screen, setting the cursor position, controlling display etc. The data register stores the data
to be displayed on the LCD. The data is the ASCII value of the character to be displayed on
the LCD. Click to learn more about internal structure of a LCD.
28
Fig 3.6.3 LCD (16x2)
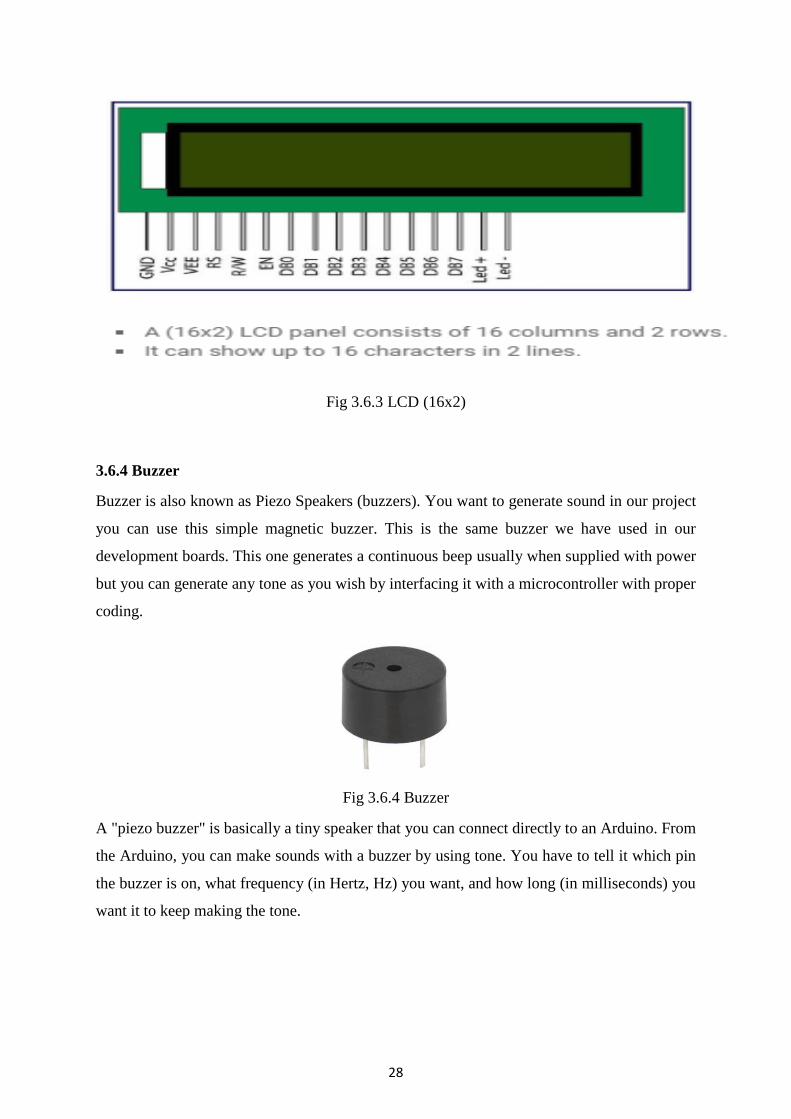
3.6.4 Buzzer
Buzzer is also known as Piezo Speakers (buzzers). You want to generate sound in our project
you can use this simple magnetic buzzer. This is the same buzzer we have used in our
development boards. This one generates a continuous beep usually when supplied with power
but you can generate any tone as you wish by interfacing it with a microcontroller with proper
coding.
Fig 3.6.4 Buzzer
A "piezo buzzer" is basically a tiny speaker that you can connect directly to an Arduino. From
the Arduino, you can make sounds with a buzzer by using tone. You have to tell it which pin
the buzzer is on, what frequency (in Hertz, Hz) you want, and how long (in milliseconds) you
want it to keep making the tone.
29
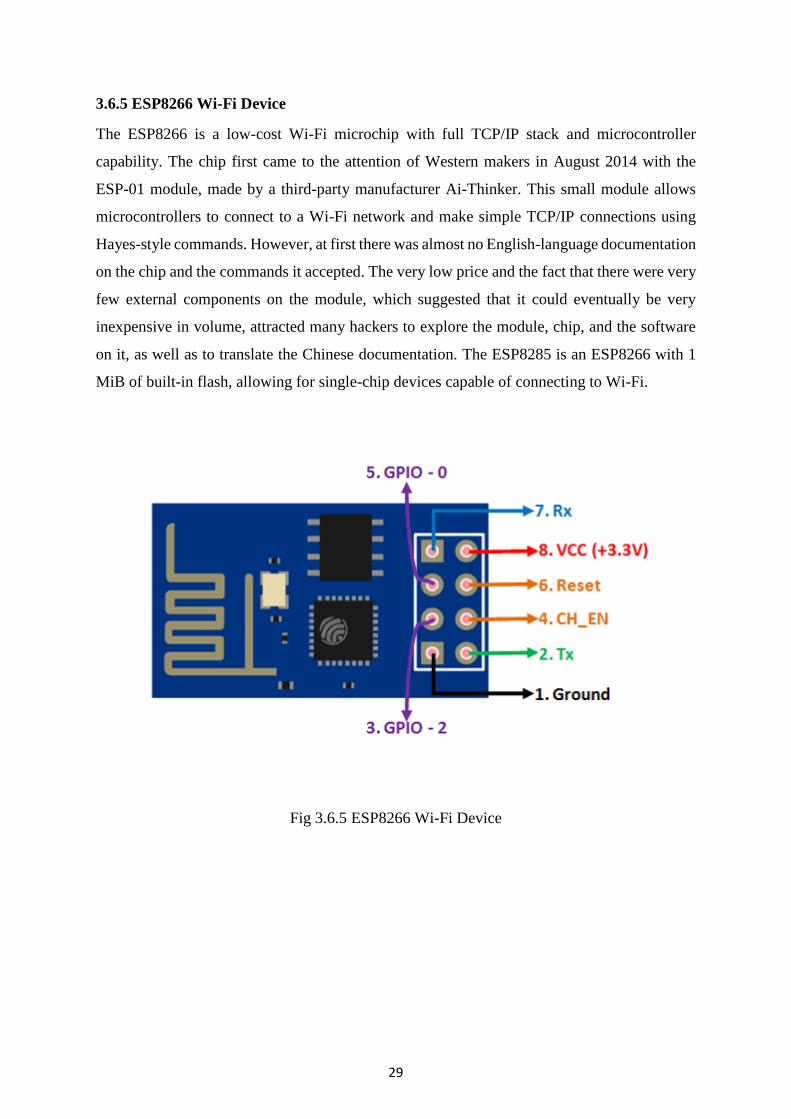
3.6.5 ESP8266 Wi-Fi Device
The ESP8266 is a low-cost Wi-Fi microchip with full TCP/IP stack and microcontroller
capability. The chip first came to the attention of Western makers in August 2014 with the
ESP-01 module, made by a third-party manufacturer Ai-Thinker. This small module allows
microcontrollers to connect to a Wi-Fi network and make simple TCP/IP connections using
Hayes-style commands. However, at first there was almost no English-language documentation
on the chip and the commands it accepted. The very low price and the fact that there were very
few external components on the module, which suggested that it could eventually be very
inexpensive in volume, attracted many hackers to explore the module, chip, and the software
on it, as well as to translate the Chinese documentation. The ESP8285 is an ESP8266 with 1
MiB of built-in flash, allowing for single-chip devices capable of connecting to Wi-Fi.
Fig 3.6.5 ESP8266 Wi-Fi Device
30
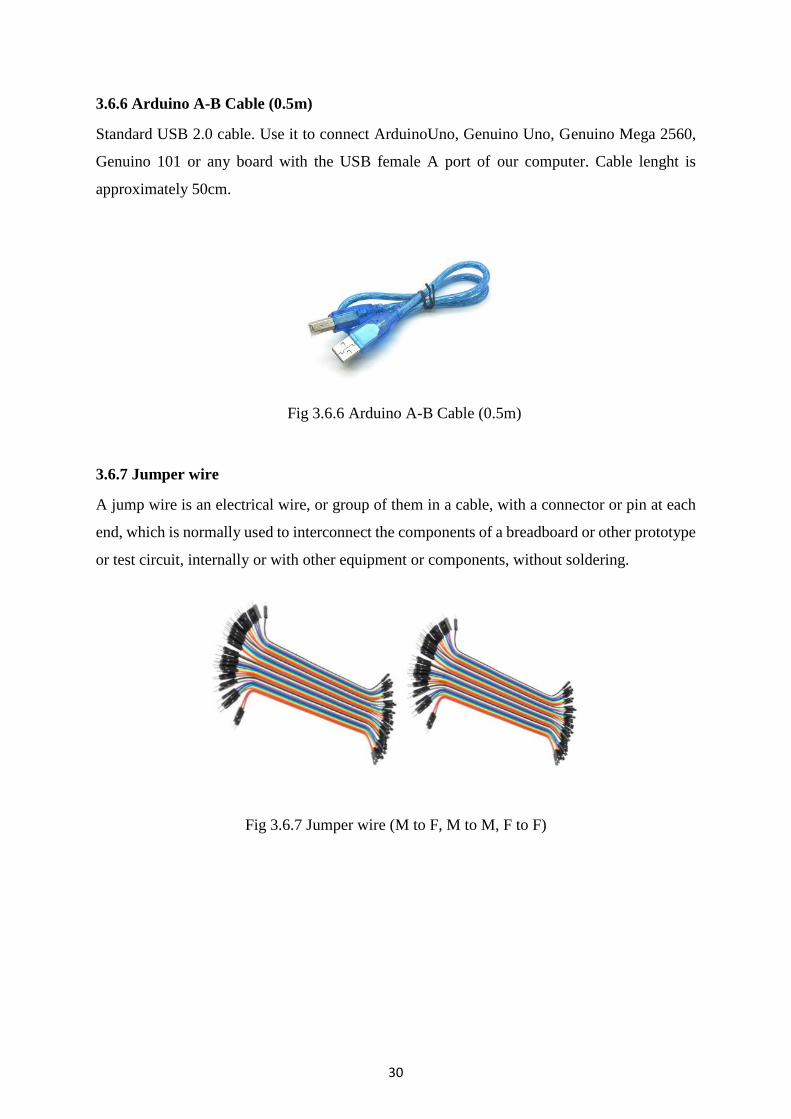
3.6.6 Arduino A-B Cable (0.5m)
Standard USB 2.0 cable. Use it to connect ArduinoUno, Genuino Uno, Genuino Mega 2560,
Genuino 101 or any board with the USB female A port of our computer. Cable lenght is
approximately 50cm.
Fig 3.6.6 Arduino A-B Cable (0.5m)
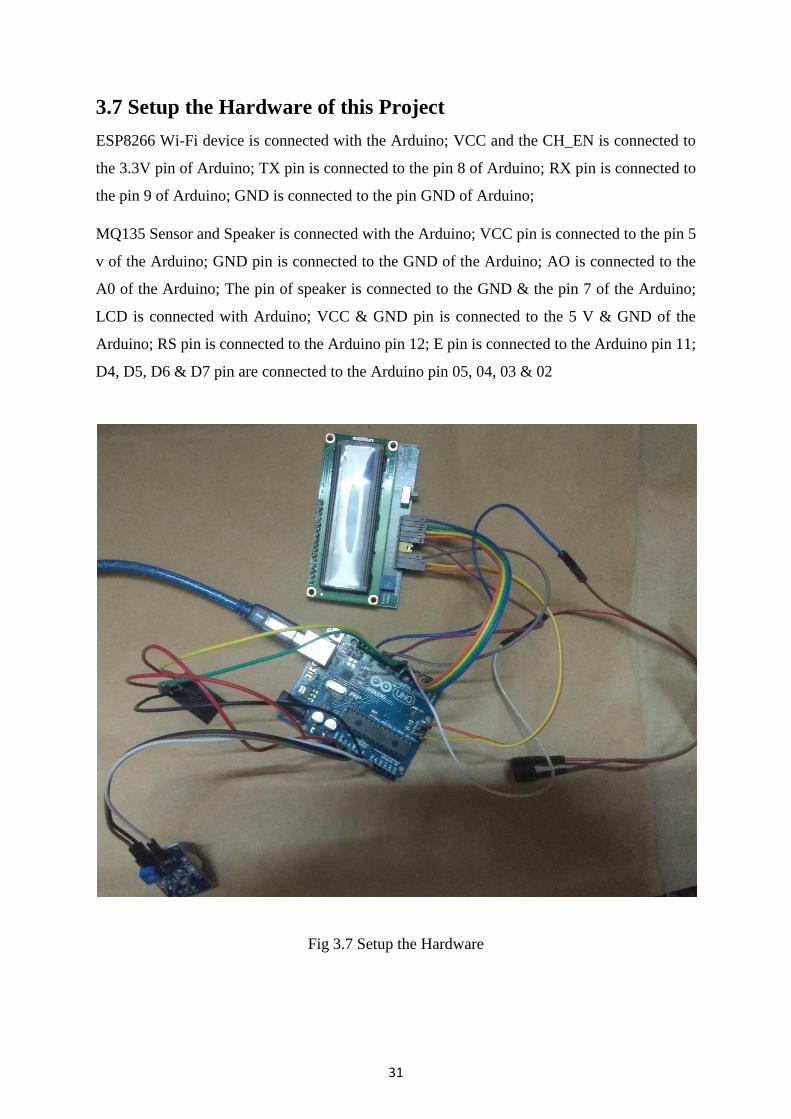
3.6.7 Jumper wire
A jump wire is an electrical wire, or group of them in a cable, with a connector or pin at each
end, which is normally used to interconnect the components of a breadboard or other prototype
or test circuit, internally or with other equipment or components, without soldering.
Fig 3.6.7 Jumper wire (M to F, M to M, F to F)
31
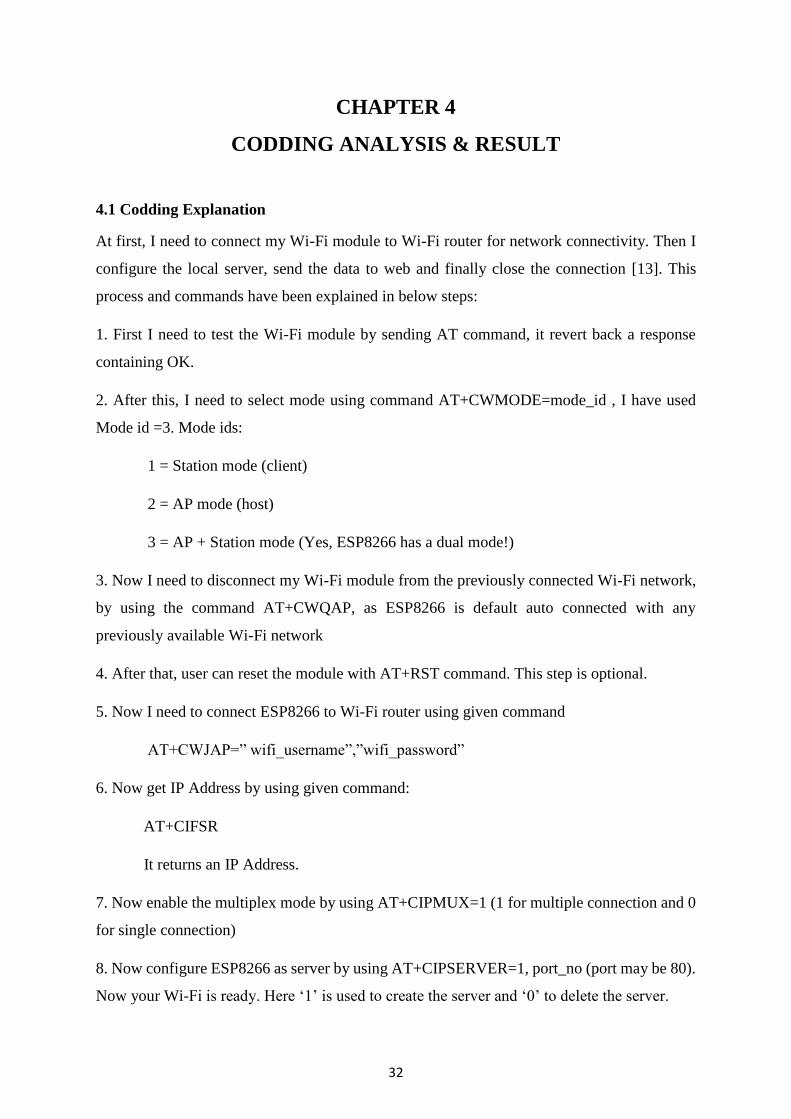
3.7 Setup the Hardware of this Project
ESP8266 Wi-Fi device is connected with the Arduino; VCC and the CH_EN is connected to
the 3.3V pin of Arduino; TX pin is connected to the pin 8 of Arduino; RX pin is connected to
the pin 9 of Arduino; GND is connected to the pin GND of Arduino;
MQ135 Sensor and Speaker is connected with the Arduino; VCC pin is connected to the pin 5
v of the Arduino; GND pin is connected to the GND of the Arduino; AO is connected to the
A0 of the Arduino; The pin of speaker is connected to the GND & the pin 7 of the Arduino;
LCD is connected with Arduino; VCC & GND pin is connected to the 5 V & GND of the
Arduino; RS pin is connected to the Arduino pin 12; E pin is connected to the Arduino pin 11;
D4, D5, D6 & D7 pin are connected to the Arduino pin 05, 04, 03 & 02
Fig 3.7 Setup the Hardware
32
CHAPTER 4
CODDING ANALYSIS & RESULT
4.1 Codding Explanation
At first, I need to connect my Wi-Fi module to Wi-Fi router for network connectivity. Then I
configure the local server, send the data to web and finally close the connection [13]. This
process and commands have been explained in below steps:
1. First I need to test the Wi-Fi module by sending AT command, it revert back a response
containing OK.
2. After this, I need to select mode using command AT+CWMODE=mode_id , I have used
Mode id =3. Mode ids:
1 = Station mode (client)
2 = AP mode (host)
3 = AP + Station mode (Yes, ESP8266 has a dual mode!)
3. Now I need to disconnect my Wi-Fi module from the previously connected Wi-Fi network,
by using the command AT+CWQAP, as ESP8266 is default auto connected with any
previously available Wi-Fi network
4. After that, user can reset the module with AT+RST command. This step is optional.
5. Now I need to connect ESP8266 to Wi-Fi router using given command
AT+CWJAP=” wifi_username”,”wifi_password”
6. Now get IP Address by using given command:
AT+CIFSR
It returns an IP Address.
7. Now enable the multiplex mode by using AT+CIPMUX=1 (1 for multiple connection and 0
for single connection)
8. Now configure ESP8266 as server by using AT+CIPSERVER=1, port_no (port may be 80).
Now your Wi-Fi is ready. Here ‘1’ is used to create the server and ‘0’ to delete the server.
33
9. Now by using given command user can send data to local created server:
AT+CIPSEND =id, length of data
Id = ID no. of transmit connection
Length = Max length of data is 2 kb
10. After sending ID and Length to the server, I need to send data like:
Serial.println(“[email protected]”);
11. After sending data I need close the connection by given command:
AT+CIPCLOSE=0
Now data has been transmitted to local server.
12. Now type IP Address in Address Bar in web browser and hit enter. Now user can see
transmitted data on webpage.
//-------------------------------------------------------------------------------------------------------------//
//Include Software Serial Library for allow serial communication on PIN no. and declare some
variables and strings.
#include<SoftwareSerial.h>
SoftwareSerial client(2,3); //RX, TX
String webpage="";
int i=0,k=0;
String readString;
int x=0;
boolean No_IP=false;
String IP="";
char temp1='0';
//After this, I have to define some functions for performing my desired tasks.
In Setup () function, I initialize inbuilt serial UART communication for ESP8266 as
client. begin (9600); at the baud rate of 9600.
void setup ()
{
34
Serial.begin(9600);
client.begin(9600);
wifi_init ();
Serial.println("System Ready...");
}
//In wifi_init () function, I initialize the Wi-Fi module by sending some commands like reset,
set mode, connect to router, configure connection etc. These commands have also been
explained above in description part.
void wifi_init ()
{
connect_wifi("AT",100);
connect_wifi("AT+CWMODE=3",100);
connect_wifi("AT+CWQAP",100);
connect_wifi("AT+RST",5000);
//In connect_wifi() function, I send commands data to ESP8266 and then read response from
ESP8266 Wi-Fi module.
void connect_wifi(String cmd, int t)
{
int temp=0,i=0;
while(1)
{
Serial.println(cmd);
//sendwebdata( ) function is used for sending data to Local Server or Webpage.
void sendwebdata(String webPage)
{
int ii=0;
while(1)
{
unsigned int l=webPage.length();
Serial.print("AT+CIPSEND=0,");
client.print("AT+CIPSEND=0,");
//void send() function is used for sending data strings to sendwebdata() function. That it is
further sent to webpage.
void Send()
35
{
webpage = "<h1>Welcome to IoT based Air Pollution Detection Monitoring
System</h1><body bgcolor=f0f0f0>";
sendwebdata(webpage);
webpage=name;
webpage+=dat;
//get_ip() function is used for getting IP address of Local created server.
//In void loop () function, I send instruction to user for refreshing the page and check whether
the server is connected of not. When user refresh or request the webpage, data automatically
transmitted to the same IP address [14].
void loop()
{
k=0;
Serial.println("Please Refresh your Page");
while(k<1000)
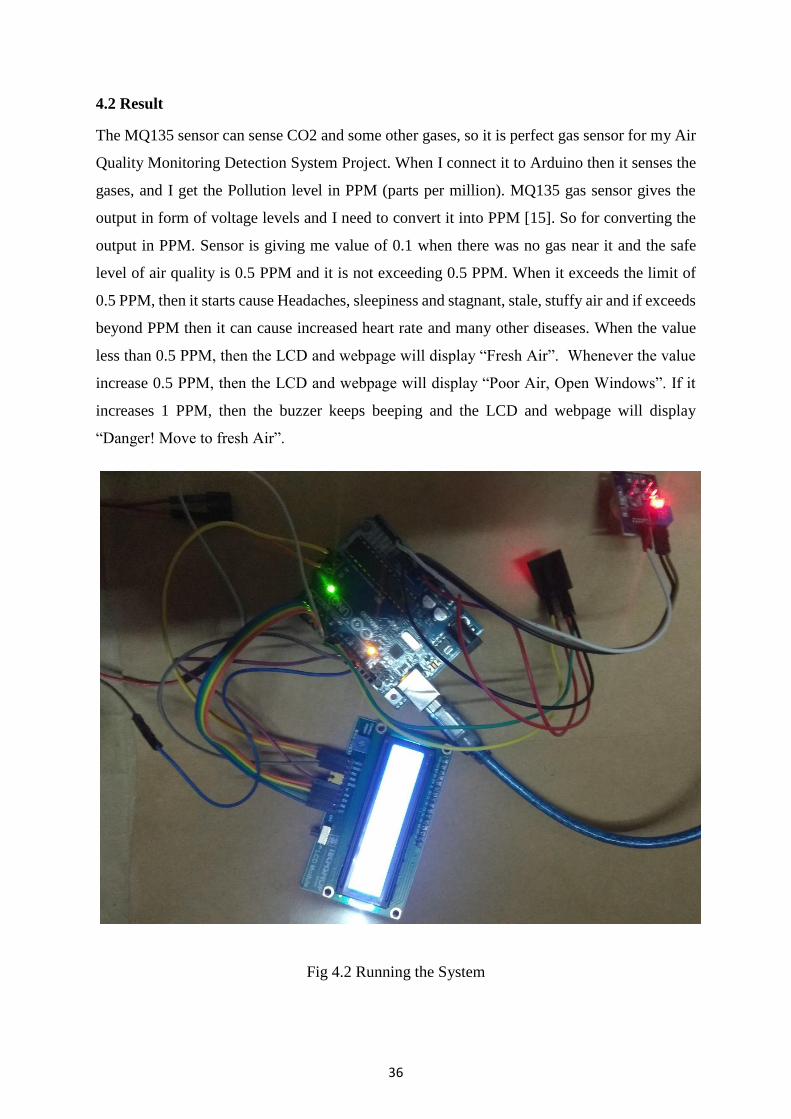
36
4.2 Result
The MQ135 sensor can sense CO2 and some other gases, so it is perfect gas sensor for my Air
Quality Monitoring Detection System Project. When I connect it to Arduino then it senses the
gases, and I get the Pollution level in PPM (parts per million). MQ135 gas sensor gives the
output in form of voltage levels and I need to convert it into PPM [15]. So for converting the
output in PPM. Sensor is giving me value of 0.1 when there was no gas near it and the safe
level of air quality is 0.5 PPM and it is not exceeding 0.5 PPM. When it exceeds the limit of
0.5 PPM, then it starts cause Headaches, sleepiness and stagnant, stale, stuffy air and if exceeds
beyond PPM then it can cause increased heart rate and many other diseases. When the value
less than 0.5 PPM, then the LCD and webpage will display “Fresh Air”. Whenever the value
increase 0.5 PPM, then the LCD and webpage will display “Poor Air, Open Windows”. If it
increases 1 PPM, then the buzzer keeps beeping and the LCD and webpage will display
“Danger! Move to fresh Air”.
Fig 4.2 Running the System
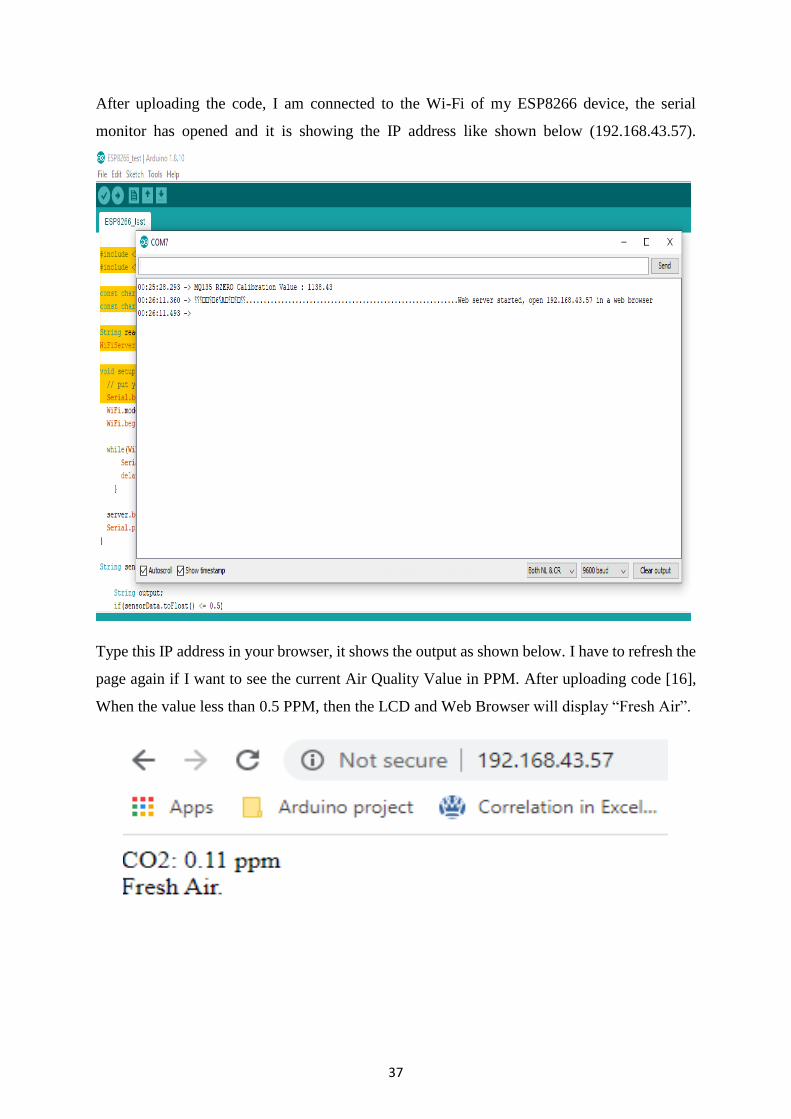
37
After uploading the code, I am connected to the Wi-Fi of my ESP8266 device, the serial
monitor has opened and it is showing the IP address like shown below (192.168.43.57).
Type this IP address in your browser, it shows the output as shown below. I have to refresh the
page again if I want to see the current Air Quality Value in PPM. After uploading code [16],
When the value less than 0.5 PPM, then the LCD and Web Browser will display “Fresh Air”.
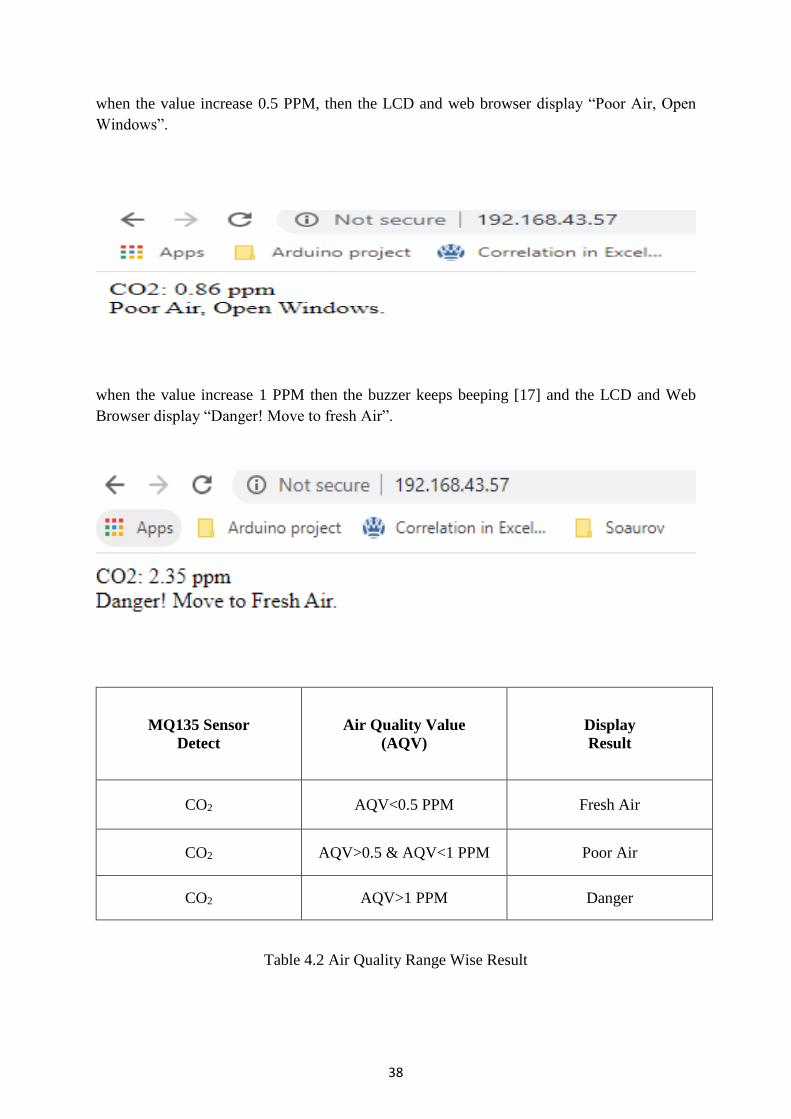
38
when the value increase 0.5 PPM, then the LCD and web browser display “Poor Air, Open
Windows”.
when the value increase 1 PPM then the buzzer keeps beeping [17] and the LCD and Web
Browser display “Danger! Move to fresh Air”.
MQ135 Sensor
Detect
Air Quality Value
(AQV)
Display
Result
CO2 AQV<0.5 PPM Fresh Air
CO2 AQV>0.5 & AQV<1 PPM Poor Air
CO2 AQV>1 PPM Danger
Table 4.2 Air Quality Range Wise Result
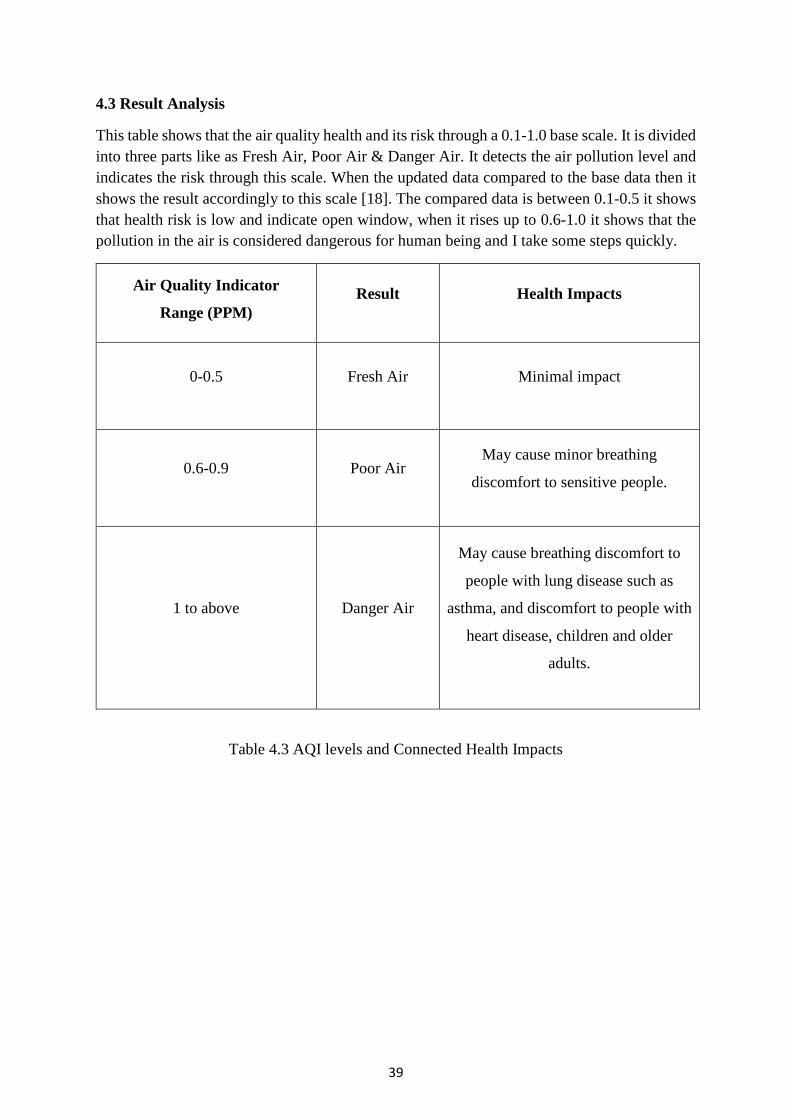
39
4.3 Result Analysis
This table shows that the air quality health and its risk through a 0.1-1.0 base scale. It is divided
into three parts like as Fresh Air, Poor Air & Danger Air. It detects the air pollution level and
indicates the risk through this scale. When the updated data compared to the base data then it
shows the result accordingly to this scale [18]. The compared data is between 0.1-0.5 it shows
that health risk is low and indicate open window, when it rises up to 0.6-1.0 it shows that the
pollution in the air is considered dangerous for human being and I take some steps quickly.
Air Quality Indicator
Range (PPM)
Result Health Impacts
0-0.5 Fresh Air Minimal impact
0.6-0.9 Poor Air May cause minor breathing
discomfort to sensitive people.
1 to above Danger Air
May cause breathing discomfort to
people with lung disease such as
asthma, and discomfort to people with
heart disease, children and older
adults.
Table 4.3 AQI levels and Connected Health Impacts
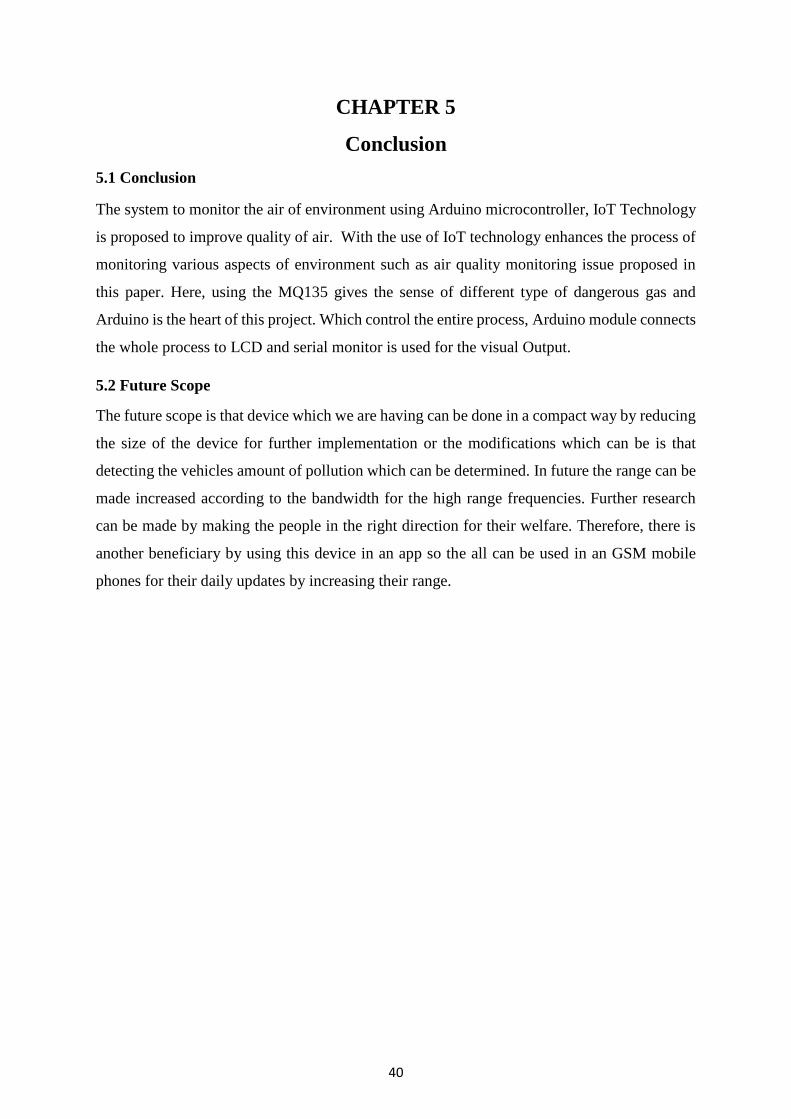
40
CHAPTER 5
Conclusion
5.1 Conclusion
The system to monitor the air of environment using Arduino microcontroller, IoT Technology
is proposed to improve quality of air. With the use of IoT technology enhances the process of
monitoring various aspects of environment such as air quality monitoring issue proposed in
this paper. Here, using the MQ135 gives the sense of different type of dangerous gas and
Arduino is the heart of this project. Which control the entire process, Arduino module connects
the whole process to LCD and serial monitor is used for the visual Output.
5.2 Future Scope
The future scope is that device which we are having can be done in a compact way by reducing
the size of the device for further implementation or the modifications which can be is that
detecting the vehicles amount of pollution which can be determined. In future the range can be
made increased according to the bandwidth for the high range frequencies. Further research
can be made by making the people in the right direction for their welfare. Therefore, there is
another beneficiary by using this device in an app so the all can be used in an GSM mobile
phones for their daily updates by increasing their range.

41
Reference
[1] Ch.V.Saikumar, M.Reji, P.C.Kishoreraja, “IOT Based Air Quality Monitoring System”,
International Journal on Information Theory (IJIT), Vol-117, No.-9, 2017;
[2] Riteeka Nayak, Malaya Ranjan Panigrahy , Vivek Kumar Rai and T Appa Rao “IOT
based air pollution monitoring system”, International Journal on Information Theory (IJIT)
Vol-3, Issue-4, 2017;
[3] Poonam Pal, Ritik Gupta, Sanjana Tiwari, Ashutosh Sharma, “Air Pollution System
Using Arduino”, International Journal on Information Theory (IJIT), Vol-04, Issue-10,
2017;
[4] D.Arunkumar, K.Ajaykanth, M.Ajithkannan, M.Sivasubramanian, “Smart Air
Pollution Detection And Monitoring Using IoT”, International Journal on Information
Theory (IJIT) Vol-119, No.-15, 2018;
[5] Shanzhi Chen, Hui Xu, Dake Liu, Bo Hu, and Hucheng Wang, “A Vision of IoT:
Applications, Challenges, and Opportunities with China Perspective”, IEEE INTERNET
OF THINGS JOURNAL, VOL.-1, NO.-4, August 2014;
[6] S. Chen, H. Xu, D. Liu, B. Hu and H. Wang, "A Vision of IoT: Applications,
Challenges, and Opportunities with China Perspective," in IEEE Internet of Things Journal,
Vol-1, No.-4, 2014;
[7] Ms. Sarika Deshmukh, Mr.Saurabh surendran and Prof.M.P. Sardey, “Air and Sound
Pollution Monitoring System using IoT” International Journal on Information Theory
(IJIT), Vol-5, Issue-6, 2017;
[8] Navreetinder Kaur,Rita Mahajan and Deepak Bagai, “Air Quality Monitoring System
based on Arduino Microcontroller”, International Journal on Information Theory (IJIT),
Vol.-5, Issue-6, June 2016;
[9].Palaghat Yaswanth Sai, “An IoT Based Automated Noise and Air Pollution Monitoring
System”, International Journal on Information Theory (IJIT), Vol.-6, Issue-3, March 2017;
[10] L.Ezhilarasi, 2 K.Sripriya, 3 A .Suganya , 4 K.Vinodhini, “A System for Monitoring
Air and Sound Pollution using Arduino Controller with IOT Technology”, International
Journal on Information Theory (IJIT), Vol.-3 Issue-2, 2017;
[11] Devahema, P.V. Sai Surya Vamsi, Archit Garg, Abhinav Anand, Desu Rajasekhar
Gupta, “IOT based Air Pollution Monitoring System”, Journal of Network
Communications and Emerging Technologies (JNCET), Vol-8, Issue-4, 2018;
[12] Hardware components
Link: https://www.arduino.cc/
[13] ESP8266 Web Server with Arduino IDE
Link: https://randomnerdtutorials.com/esp8266-web-server-with-arduino-ide/
42
[14] Send AT commands to ESP8266 from Arduino Uno via a Software Serial port
Link: https://arduino.stackexchange.com/questions/18575/send-at-commands-to-esp8266-
from-arduino-uno-via-a-softwareserial-port
[15] Interfacing of MQ135 Gas Sensor with Arduino
Link: https://microcontrollerslab.com/interfacing-mq-135-gas-sensor-arduino/
[16] Arduino Smoke Level Detector using MQ-135 Sensor with Alert Alarm
Link: https://how2electronics.com/arduino-smoke-level-detector-using-mq-135-sensor/
[17] How Does the Arduino Speaker Work
Link: https://maker.pro/arduino/projects/arduino-speaker
[18] How to Interface Esp8266 Wi-Fi Module with Arduino
Link:http://microcontrollerproject.com/esp8266-arduino-send-data-to-web-server-
tutorial-with-example/