integration of geophysics, geologic mapping and … · elemental mercury is found in fractured...
TRANSCRIPT
INTEGRATION OF GEOPHYSICS, GEOLOGIC MAPPING AND WATER-LEVEL MONITORING TO CHARACTERIZE THE HYDROGEOLOGY
OF A FRACTURED BEDROCK SITE IN BERLIN, NEW HAMPSHIRE
James R. Degnan, U.S. Geological Survey, Pembroke, NHStewart F. Clark Jr., U.S. Geological Survey, Montpelier, VT
Philip T. Harte, U.S. Geological Survey, Pembroke, NH
Abstract
Elemental mercury is found in fractured depressions and potholes on the bedrock surface, in theoverburden, and is dissolved in ground water at the site of a former chlor-alkali plant (cell house) alongthe bank of the Androscoggin River, in Berlin, N.H. The cell house has been demolished, ground-waterflow impeded by installation of an up-gradient-slurry wall, and capped with an impermeable geomem-brane. Mercury has been removed from fractures at the surface on the riverbank five times; however,more continues to be found. Potential pathways for movement of mercury and ground water were indi-cated with the results of a geohydrologic study. The study demonstrates the integration of geophysicalsurveys, geologic mapping, and water-level monitoring in three areas: (1) the riverbank, (2) the siteperimeter, and (3) the capped area.
Results from ground-penetrating radar and two-dimensional-resistivity surveys along the river-bank indicate electrically conductive zones that are interpreted as bedrock fractures, which are potentialground-water-flow paths. Geologic mapping along the riverbank shows that bedrock fracturing is moreprevalent in gneiss than pegmatite and is associated with schist in shear zones that correspond to geo-physical anomalies. Nearly horizontal anomalies in ground-penetrating-radar survey results beneathareas mapped as pegmatite may represent locations where vertical fractures in gneiss terminate on a hori-zontal fractured contact between gneiss and pegmatite. Significant hydraulic connections were identifiedby analysis of stage changes in the Androscoggin River and bedrock water levels. Assessment of hydrau-lic heads in bedrock and overburden show vertical ground-water gradients in both directions. Resistivity-survey results along the site perimeter indicate fractures and overburden-filled bedrock troughs whereground water may bypass a slurry wall. Overburden water levels and discharge from a drainage pipe sug-gest that ground water is passing through or beneath the slurry wall. Response of overburden water levelsdo not show connections with the river.
Introduction
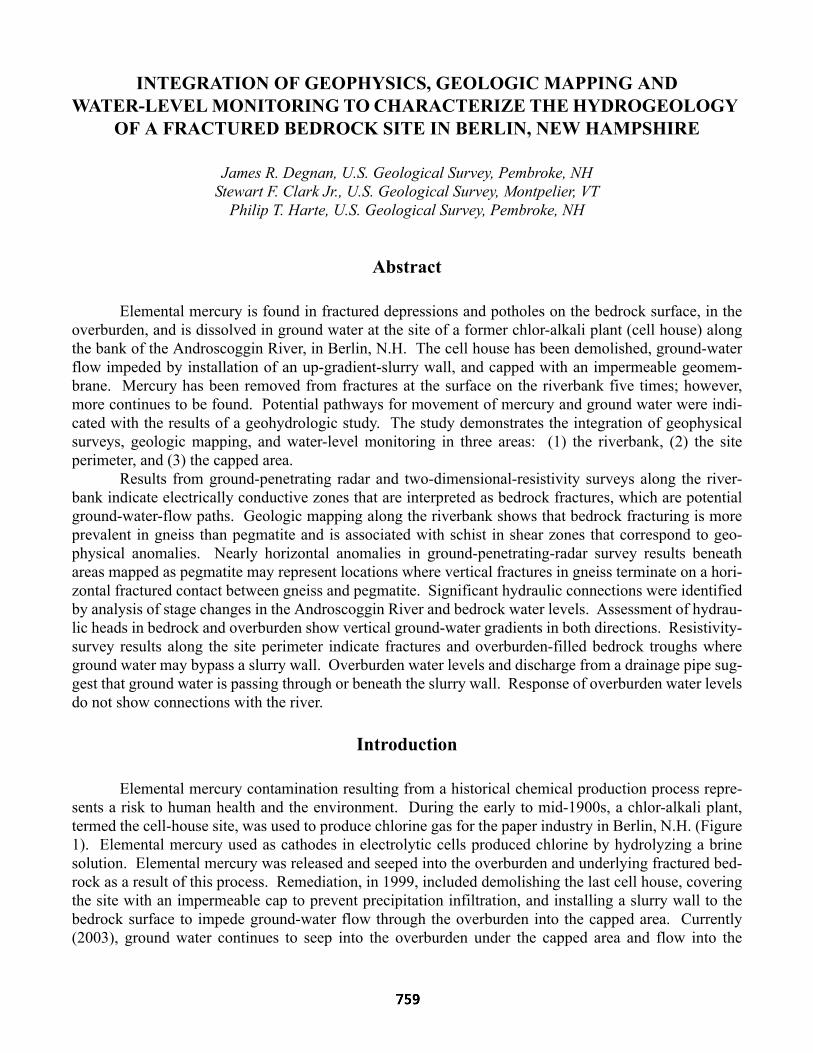
Elemental mercury contamination resulting from a historical chemical production process repre-sents a risk to human health and the environment. During the early to mid-1900s, a chlor-alkali plant,termed the cell-house site, was used to produce chlorine gas for the paper industry in Berlin, N.H. (Figure1). Elemental mercury used as cathodes in electrolytic cells produced chlorine by hydrolyzing a brinesolution. Elemental mercury was released and seeped into the overburden and underlying fractured bed-rock as a result of this process. Remediation, in 1999, included demolishing the last cell house, coveringthe site with an impermeable cap to prevent precipitation infiltration, and installing a slurry wall to thebedrock surface to impede ground-water flow through the overburden into the capped area. Currently(2003), ground water continues to seep into the overburden under the capped area and flow into the
Androscoggin River (Margaret A. Bastien, New Hampshire Department of Environmental Services, writ-ten commun., 2002). Despite five removal efforts, elemental mercury continues to appear in bedrockfractures along the riverbank at the cell-house site (Figure 2). The extent of mercury contamination inbedrock and mechanisms of transport to the riverbank are unknown. The capped area appears to be thesource of the mercury contamination (Margaret A. Bastien, New Hampshire Department of Environmen-tal Services, written commun., 2002).
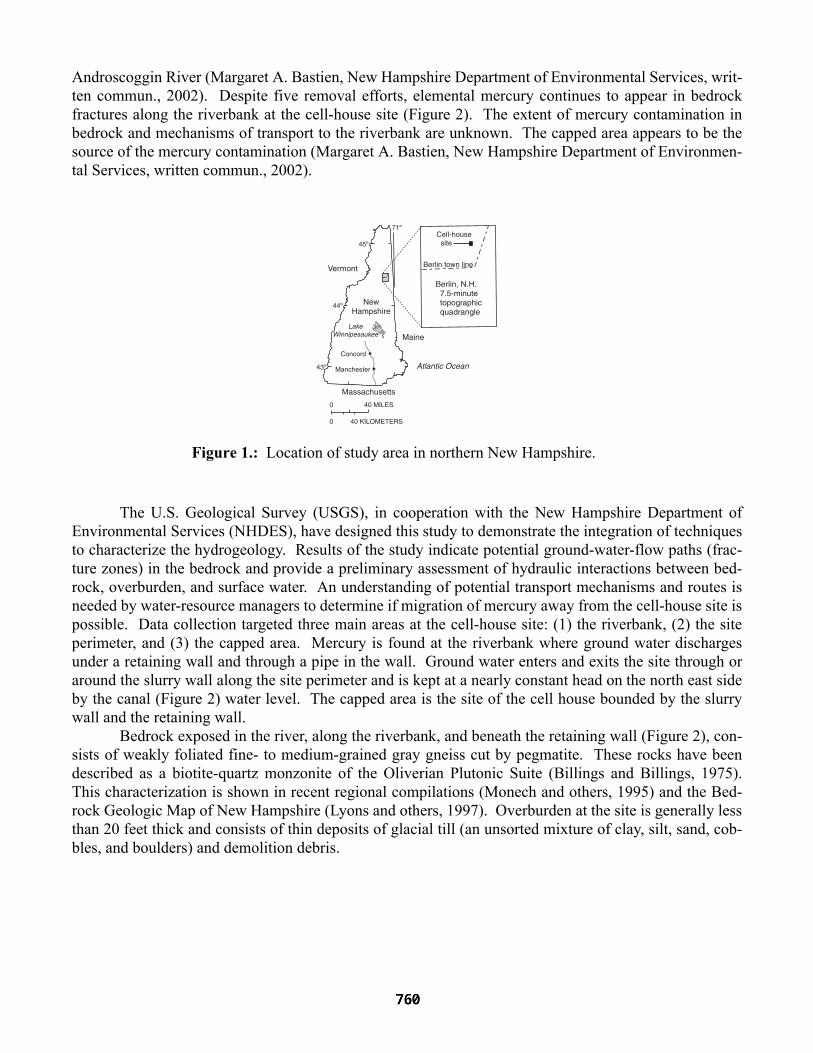
The U.S. Geological Survey (USGS), in cooperation with the New Hampshire Department ofEnvironmental Services (NHDES), have designed this study to demonstrate the integration of techniquesto characterize the hydrogeology. Results of the study indicate potential ground-water-flow paths (frac-ture zones) in the bedrock and provide a preliminary assessment of hydraulic interactions between bed-rock, overburden, and surface water. An understanding of potential transport mechanisms and routes isneeded by water-resource managers to determine if migration of mercury away from the cell-house site ispossible. Data collection targeted three main areas at the cell-house site: (1) the riverbank, (2) the siteperimeter, and (3) the capped area. Mercury is found at the riverbank where ground water dischargesunder a retaining wall and through a pipe in the wall. Ground water enters and exits the site through oraround the slurry wall along the site perimeter and is kept at a nearly constant head on the north east sideby the canal (Figure 2) water level. The capped area is the site of the cell house bounded by the slurrywall and the retaining wall.
Bedrock exposed in the river, along the riverbank, and beneath the retaining wall (Figure 2), con-sists of weakly foliated fine- to medium-grained gray gneiss cut by pegmatite. These rocks have beendescribed as a biotite-quartz monzonite of the Oliverian Plutonic Suite (Billings and Billings, 1975).This characterization is shown in recent regional compilations (Monech and others, 1995) and the Bed-rock Geologic Map of New Hampshire (Lyons and others, 1997). Overburden at the site is generally lessthan 20 feet thick and consists of thin deposits of glacial till (an unsorted mixture of clay, silt, sand, cob-bles, and boulders) and demolition debris.
NewHampshire
71º
44º
43º
45º
Concord
LakeWinnipesaukee
Manchester
40 MILES0
0 40 KILOMETERS
Atlantic Ocean
Maine
Massachusetts
Vermont
Berlin, N.H. 7.5-minute topographic quadrangle
Berlin town line
Cell-house site
Figure 1.: Location of study area in northern New Hampshire.
P-4AMW-4
P-18
P-19
P-21
P-11
P-12
SW-1
P-13
MW-2MW-7
P-14
MW-3MW-8
P-17
P-15
P-16
MW-5
MW-9
MW-6
P-20P-22
SW-3
MW-1
SW-2
SWP-1
SWP-3
MW-10BMW-10A
Sawmill dam
Slurry wallCap
Road
Canal
Line 2
1100
And
rosc
oggi
n Riv
er
Retaining wall
Line 1
Line 3
1082
1086
1082
1082
Line
15Line 18
Line 26
Line
13
Line
14
Line
16
Line
17
Line 12
Line 8
Line 10Line 11
Line 9
1098
1102
1104
1106
1108
1100
1106
1104
1088
0
0 100 METERS
100 200 300 FEET
20 40 60 80
Base road, slurry wall, and cap from Weston Solutions, Inc.; sawmill dam, hydrography, and contours from Nexfor Fraser Papers, Berlin-Gorham Operations;New Hampshire state plane feet coordinate system, NAD 83
Retaining wall
Cap
Slurry wall
SWP-2
EXPLANATION Bedrock outcrop area Well type and identifying numberGeophysical surveys and line number Overburden well or piezometer Ground-penetrating radar survey Bedrock well Resistivity survey Surface-water measuring point Ground-penetrating radar and resistivity Contour—Contour interval 2 feet surveys along same line Direction of flow
1100
Line 3Line 8Line 1
721,500
722,0001,114,500 1,115,000
PoolR
iver
bank
P-11MW-7SW-1
Capped area
Site perimeter
Site perimeter
1090
(elevation1082 feet)
(elevation1099 feet)
And
rosc
oggi
n Riv
er
Roa
dR
oad
Figure 2.: Location of the cell-house site, geophysical survey lines, surface-water measuring points, and wells, Berlin, N.H.
Methods
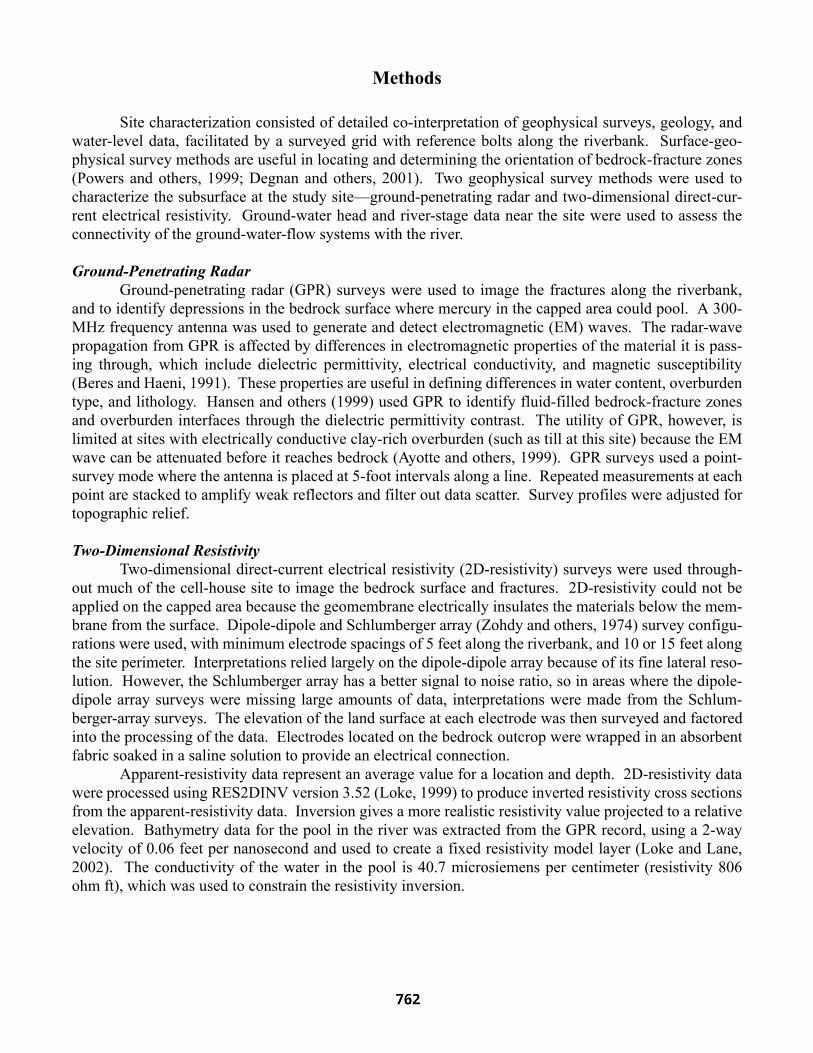
Site characterization consisted of detailed co-interpretation of geophysical surveys, geology, andwater-level data, facilitated by a surveyed grid with reference bolts along the riverbank. Surface-geo-physical survey methods are useful in locating and determining the orientation of bedrock-fracture zones(Powers and others, 1999; Degnan and others, 2001). Two geophysical survey methods were used tocharacterize the subsurface at the study site—ground-penetrating radar and two-dimensional direct-cur-rent electrical resistivity. Ground-water head and river-stage data near the site were used to assess theconnectivity of the ground-water-flow systems with the river.
Ground-Penetrating RadarGround-penetrating radar (GPR) surveys were used to image the fractures along the riverbank,
and to identify depressions in the bedrock surface where mercury in the capped area could pool. A 300-MHz frequency antenna was used to generate and detect electromagnetic (EM) waves. The radar-wavepropagation from GPR is affected by differences in electromagnetic properties of the material it is pass-ing through, which include dielectric permittivity, electrical conductivity, and magnetic susceptibility(Beres and Haeni, 1991). These properties are useful in defining differences in water content, overburdentype, and lithology. Hansen and others (1999) used GPR to identify fluid-filled bedrock-fracture zonesand overburden interfaces through the dielectric permittivity contrast. The utility of GPR, however, islimited at sites with electrically conductive clay-rich overburden (such as till at this site) because the EMwave can be attenuated before it reaches bedrock (Ayotte and others, 1999). GPR surveys used a point-survey mode where the antenna is placed at 5-foot intervals along a line. Repeated measurements at eachpoint are stacked to amplify weak reflectors and filter out data scatter. Survey profiles were adjusted fortopographic relief.
Two-Dimensional ResistivityTwo-dimensional direct-current electrical resistivity (2D-resistivity) surveys were used through-
out much of the cell-house site to image the bedrock surface and fractures. 2D-resistivity could not beapplied on the capped area because the geomembrane electrically insulates the materials below the mem-brane from the surface. Dipole-dipole and Schlumberger array (Zohdy and others, 1974) survey configu-rations were used, with minimum electrode spacings of 5 feet along the riverbank, and 10 or 15 feet alongthe site perimeter. Interpretations relied largely on the dipole-dipole array because of its fine lateral reso-lution. However, the Schlumberger array has a better signal to noise ratio, so in areas where the dipole-dipole array surveys were missing large amounts of data, interpretations were made from the Schlum-berger-array surveys. The elevation of the land surface at each electrode was then surveyed and factoredinto the processing of the data. Electrodes located on the bedrock outcrop were wrapped in an absorbentfabric soaked in a saline solution to provide an electrical connection.
Apparent-resistivity data represent an average value for a location and depth. 2D-resistivity datawere processed using RES2DINV version 3.52 (Loke, 1999) to produce inverted resistivity cross sectionsfrom the apparent-resistivity data. Inversion gives a more realistic resistivity value projected to a relativeelevation. Bathymetry data for the pool in the river was extracted from the GPR record, using a 2-wayvelocity of 0.06 feet per nanosecond and used to create a fixed resistivity model layer (Loke and Lane,2002). The conductivity of the water in the pool is 40.7 microsiemens per centimeter (resistivity 806ohm ft), which was used to constrain the resistivity inversion.
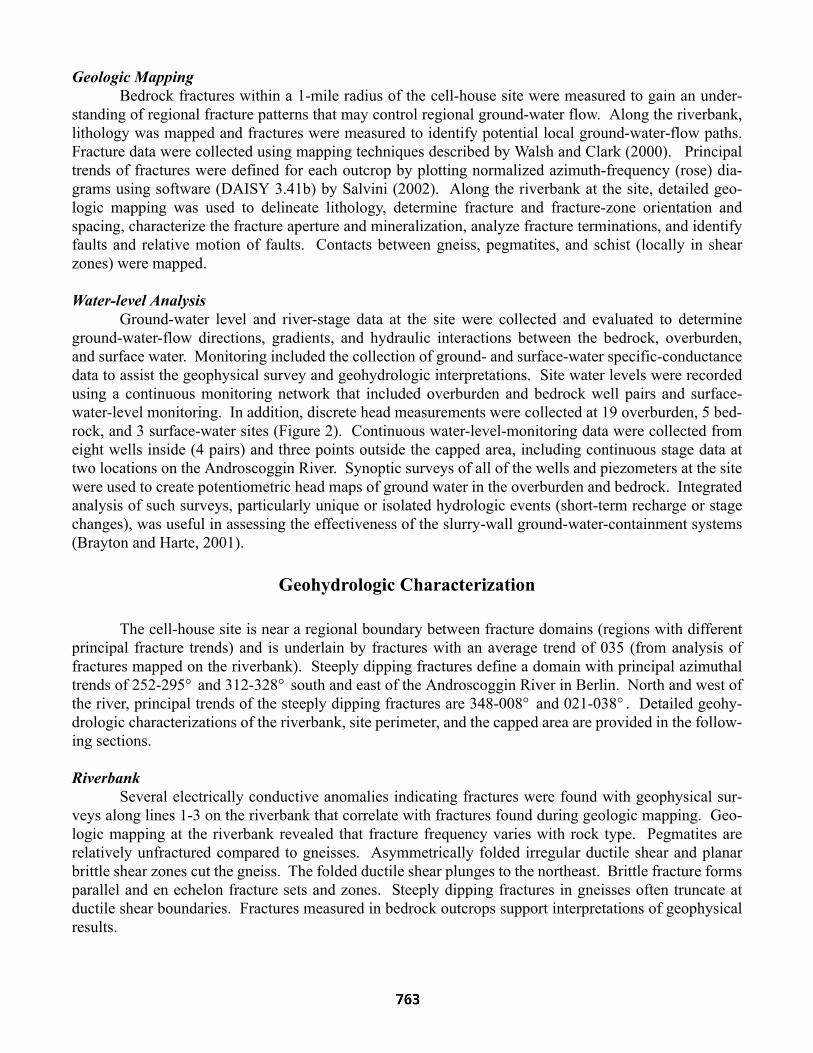
Geologic MappingBedrock fractures within a 1-mile radius of the cell-house site were measured to gain an under-
standing of regional fracture patterns that may control regional ground-water flow. Along the riverbank,lithology was mapped and fractures were measured to identify potential local ground-water-flow paths.Fracture data were collected using mapping techniques described by Walsh and Clark (2000). Principaltrends of fractures were defined for each outcrop by plotting normalized azimuth-frequency (rose) dia-grams using software (DAISY 3.41b) by Salvini (2002). Along the riverbank at the site, detailed geo-logic mapping was used to delineate lithology, determine fracture and fracture-zone orientation andspacing, characterize the fracture aperture and mineralization, analyze fracture terminations, and identifyfaults and relative motion of faults. Contacts between gneiss, pegmatites, and schist (locally in shearzones) were mapped.
Water-level AnalysisGround-water level and river-stage data at the site were collected and evaluated to determine
ground-water-flow directions, gradients, and hydraulic interactions between the bedrock, overburden,and surface water. Monitoring included the collection of ground- and surface-water specific-conductancedata to assist the geophysical survey and geohydrologic interpretations. Site water levels were recordedusing a continuous monitoring network that included overburden and bedrock well pairs and surface-water-level monitoring. In addition, discrete head measurements were collected at 19 overburden, 5 bed-rock, and 3 surface-water sites (Figure 2). Continuous water-level-monitoring data were collected fromeight wells inside (4 pairs) and three points outside the capped area, including continuous stage data attwo locations on the Androscoggin River. Synoptic surveys of all of the wells and piezometers at the sitewere used to create potentiometric head maps of ground water in the overburden and bedrock. Integratedanalysis of such surveys, particularly unique or isolated hydrologic events (short-term recharge or stagechanges), was useful in assessing the effectiveness of the slurry-wall ground-water-containment systems(Brayton and Harte, 2001).
Geohydrologic Characterization
The cell-house site is near a regional boundary between fracture domains (regions with differentprincipal fracture trends) and is underlain by fractures with an average trend of 035 (from analysis offractures mapped on the riverbank). Steeply dipping fractures define a domain with principal azimuthaltrends of 252-295° and 312-328° south and east of the Androscoggin River in Berlin. North and west ofthe river, principal trends of the steeply dipping fractures are 348-008° and 021-038° . Detailed geohy-drologic characterizations of the riverbank, site perimeter, and the capped area are provided in the follow-ing sections.
RiverbankSeveral electrically conductive anomalies indicating fractures were found with geophysical sur-
veys along lines 1-3 on the riverbank that correlate with fractures found during geologic mapping. Geo-logic mapping at the riverbank revealed that fracture frequency varies with rock type. Pegmatites arerelatively unfractured compared to gneisses. Asymmetrically folded irregular ductile shear and planarbrittle shear zones cut the gneiss. The folded ductile shear plunges to the northeast. Brittle fracture formsparallel and en echelon fracture sets and zones. Steeply dipping fractures in gneisses often truncate atductile shear boundaries. Fractures measured in bedrock outcrops support interpretations of geophysicalresults.
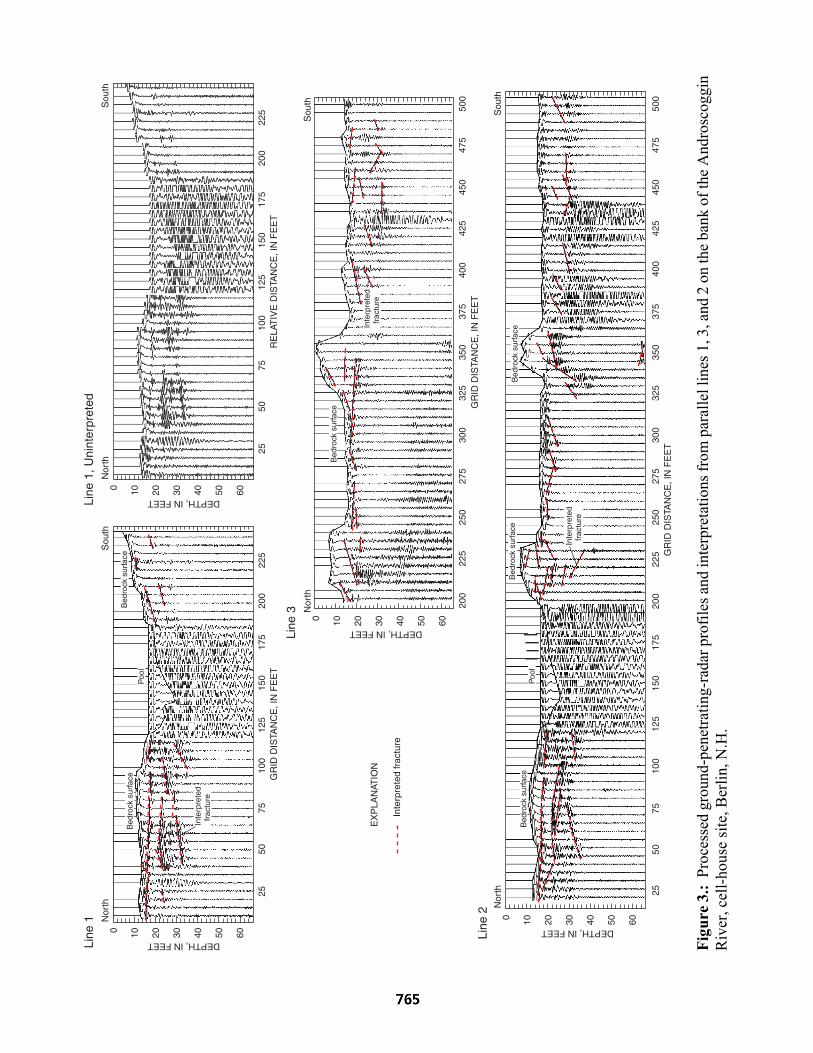
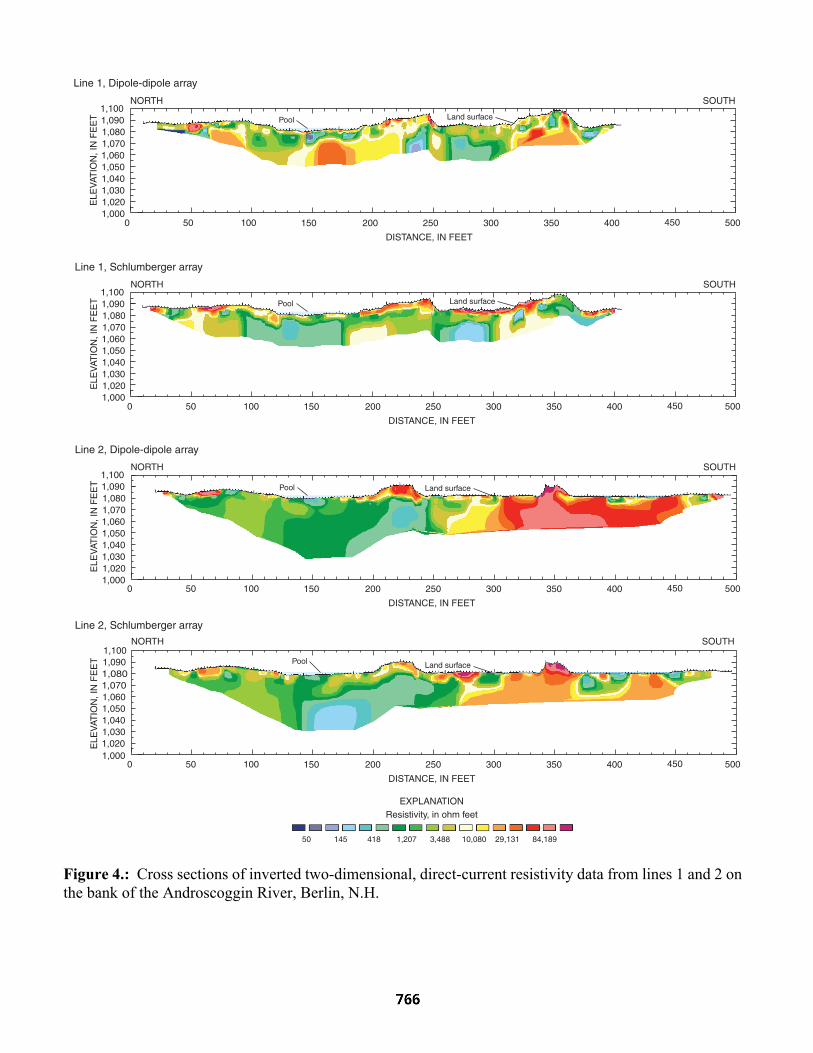
GPR results at a distance of 50 to 100 ft along lines 1 and 2, show several horizontal and shallow-dipping reflectors that are consistent between the two lines (Figure 3) beneath areas mapped as pegmatite.Nearby geologic mapping indicate that these anomalies may represent locations where vertical fracturesin gneiss terminate on sub-horizontally fractured contacts between gneiss and pegmatite. Core logs fromadjacent boreholes in the capped area show alternating layers of pegmatite and gneiss. 2D-resistivityresults from lines 1 and 2 (Figure 4) indicate electrically conductive anomalies in the bedrock that are inthe same locations as the reflections seen in the GPR results.
Several conductive anomalies along line 1 (dipole-dipole array) have resistivity values less than150-ohm feet. Electrically conductive ground water (greater than 4,000 microseimens per centimeter)was found in the bedrock at well MW-7 near the largest 2D-resistivity anomaly under the high relief bed-rock at a distance of 235 feet along the line and with a 60° apparent dip. This feature lines up with ananomaly along line 2 centered at 225 feet with a 50° apparent dip. This is the location of an asymmetri-cally folded ductile shear zone, a major structural feature on the riverbank at the cell-house site, withopen vuggy fractures and chlorite alteration, plunging 47° in a 055° direction. Water-level monitoringnear the shear zone, at bedrock well MW-7 and in the river at SW-1, confirms a hydraulic connectionbetween the ground water in the fractured bedrock and the river in this area (Figure 5).
At the southern end of the riverbank, GPR-survey results were not as consistent between surveylines 2 and 3 (Figure 3). In addition to shallow and horizontal reflections, a steeply dipping reflection iscentered at 330 feet on line 2. The lack of electrical anomalies from 310 feet to the southern end of line 2in the dipole-dipole array survey results is due to missing data points. Conductive anomalies are indicatedin the Schlumberger array survey results (Figure 4).
Site PerimeterSeven potential fracture zones that could transmit ground water into or out of the capped area
were located with 2D-resistivity surveys along the site perimeter to the east, south, and southwest of thecapped area (lines 8-18, Figure 2). On the southern perimeter of the site, 2D-resistivity survey resultsfrom lines 10, 11, and 12 indicate a fracture zone with a 160 trend crossing all three survey lines. Theprojected trend of this zone intersects the slurry wall where a historic map shows a main waterline, whichmay be the cause of the anomaly. Electrically conductive features near the surface could be buried metalfrom the demolition of buildings, or main waterlines. Electrically conductive features below the inter-preted surface of the bedrock along these lines are likely bedrock-fracture zones.
2D-resistivity survey results along lines 8 and 9, at the southwestern perimeter of the site and par-allel to the Androscoggin River, indicate potential overburden and bedrock ground-water-flow paths outof the site past the western end of the slurry wall (Figure 6). The center of an interpreted fracture zoneand trough in the bedrock surface striking 80° extends between lines 8 and 9 at an approximate distanceof 140 feet along the lines (Figure 6). Results from line 9 indicate a more conductive anomaly in the bed-rock than on line 8. Buried metal debris along line 8 may obscure conductive features.
GR
ID D
ISTA
NC
E, I
N F
EE
T
DEPTH, IN FEETLine
1 Nor
thS
outh
5010
015
020
022
517
512
575
25
0 10 20 30 40 50 60
Bed
rock
sur
face
Bed
rock
sur
face
Poo
l
GR
ID D
ISTA
NC
E, I
N F
EE
T
DEPTH, IN FEET
Line
3 Nor
thS
outh
225
300
350
400
425
375
325
250
200
0 10 20 40 50 60
Bed
rock
sur
face
275
450
475
500
30
GR
ID D
ISTA
NC
E, I
N F
EE
T
DEPTH, IN FEET
Line
2N
orth
Sou
th
5010
015
020
022
517
512
575
25
0 10 20 30 40 50 60
300
350
400
425
375
325
250
275
450
475
500
Bed
rock
sur
face
Bed
rock
sur
face
Bed
rock
sur
face
Poo
l
Inte
rpre
ted
fra
ctur
eE
XP
LAN
ATIO
N
Int
erpr
eted
frac
ture
Inte
rpre
ted
fra
ctur
e
Inte
rpre
ted
fra
ctur
e
RE
LAT
IVE
DIS
TAN
CE
, IN
FE
ET
DEPTH, IN FEETLine
1, U
nint
erpr
eted
Nor
thS
outh
5010
015
020
022
517
512
575
25
0 10 20 30 40 50 60
Figu
re 3
.: P
roce
ssed
gro
und-
pene
tratin
g-ra
dar p
rofil
es a
nd in
terp
reta
tions
from
par
alle
l lin
es 1
, 3, a
nd 2
on
the
bank
of t
he A
ndro
scog
gin
Riv
er, c
ell-h
ouse
site
, Ber
lin, N
.H.
50 145 418 1,207 3,488 10,080 29,131 84,189
EXPLANATIONResistivity, in ohm feet
DISTANCE, IN FEET
0 50 100 150 200 250 300 350 400 450 500
Land surface
1,000
1,030
1,060
1,090
1,020
1,0401,050
1,0701,080
ELE
VAT
ION
, IN
FE
ET
Line 2, Schlumberger array
1,100NORTH SOUTH
Pool
Land surface
Line 2, Dipole-dipole array
Pool
1,000
1,030
1,060
1,090
1,020
1,0401,050
1,0701,080
ELE
VAT
ION
, IN
FE
ET
1,100NORTH SOUTH
Line 1, Dipole-dipole array
Land surfacePool
1,000
1,030
1,060
1,090
1,020
1,0401,050
1,0701,080
ELE
VAT
ION
, IN
FE
ET
1,100NORTH SOUTH
DISTANCE, IN FEET
0 50 100 150 200 250 300 350 400 450 500
Land surface
Line 1, Schlumberger array
Pool
1,000
1,030
1,060
1,090
1,020
1,0401,050
1,0701,080
ELE
VAT
ION
, IN
FE
ET
1,100NORTH SOUTH
DISTANCE, IN FEET
0 50 100 150 200 250 300 350 400 450 500
DISTANCE, IN FEET
0 50 100 150 200 250 300 350 400 450 500
Figure 4.: Cross sections of inverted two-dimensional, direct-current resistivity data from lines 1 and 2 on the bank of the Androscoggin River, Berlin, N.H.

1,078
1,080
1,082
1,084
1,086
1,088
DA
ILY
AV
ER
AG
E W
AT
ER
LE
VE
L, IN
FE
ET
Janu
ary
1, 2
003
Febr
uary
1, 2
003
Mar
ch 1
, 200
3
April
1, 2
003
May
1, 2
003
DATE
SW-1
MW-7D
ecem
ber 1
, 200
2
June
1, 2
003
DISTANCE, IN FEET
0 50 100 150 200 250 300 350
Land surface
1,000
1,030
1,060
1,090
1,020
1,0401,050
1,0701,080
ELE
VAT
ION
, IN
FE
ET
Line 9, Dipole-dipole array
1,100NORTHWEST SOUTHEAST
Landsurface
Line 8, Dipole-dipole array
1,000
1,030
1,060
1,090
1,020
1,0401,050
1,0701,080
ELE
VAT
ION
, IN
FE
ET
1,100NORTHWEST SOUTHEAST
DISTANCE, IN FEET
0 50 100 150 200 250 300 350
5 12.8 32.8 83.9 215 550 1,407 3,603
EXPLANATIONResistivity, in ohm feet
Trough
Trough
Fractured zone
Fractured zone
Figure 6.: Cross sections of inverted two-dimensional, direct-current resistivity data and interpretations from lines 8 and 9 on the southwest perimeter of the cell-house site, Berlin, N.H.
Figure 5.: Hydrograph of bedrock well MW-7 and the Androscoggin River stage (SW-1), cell-house site, Berlin, N.H.
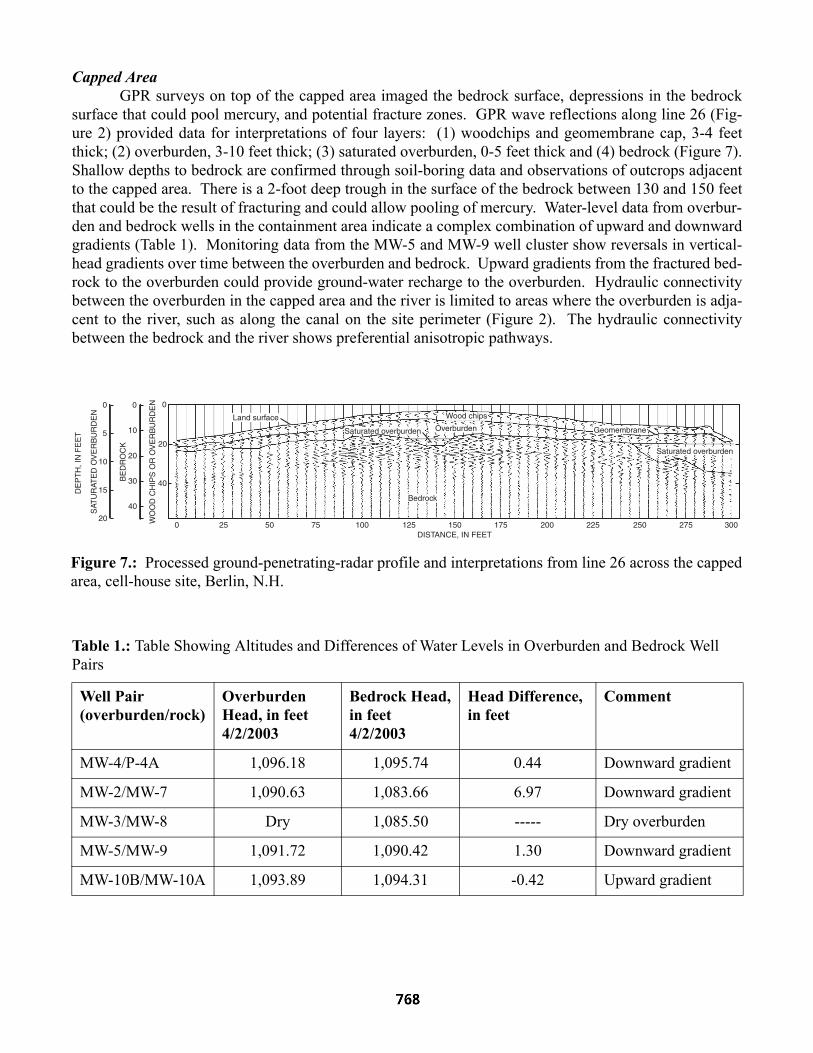
Capped AreaGPR surveys on top of the capped area imaged the bedrock surface, depressions in the bedrock
surface that could pool mercury, and potential fracture zones. GPR wave reflections along line 26 (Fig-ure 2) provided data for interpretations of four layers: (1) woodchips and geomembrane cap, 3-4 feetthick; (2) overburden, 3-10 feet thick; (3) saturated overburden, 0-5 feet thick and (4) bedrock (Figure 7).Shallow depths to bedrock are confirmed through soil-boring data and observations of outcrops adjacentto the capped area. There is a 2-foot deep trough in the surface of the bedrock between 130 and 150 feetthat could be the result of fracturing and could allow pooling of mercury. Water-level data from overbur-den and bedrock wells in the containment area indicate a complex combination of upward and downwardgradients (Table 1). Monitoring data from the MW-5 and MW-9 well cluster show reversals in vertical-head gradients over time between the overburden and bedrock. Upward gradients from the fractured bed-rock to the overburden could provide ground-water recharge to the overburden. Hydraulic connectivitybetween the overburden in the capped area and the river is limited to areas where the overburden is adja-cent to the river, such as along the canal on the site perimeter (Figure 2). The hydraulic connectivitybetween the bedrock and the river shows preferential anisotropic pathways.
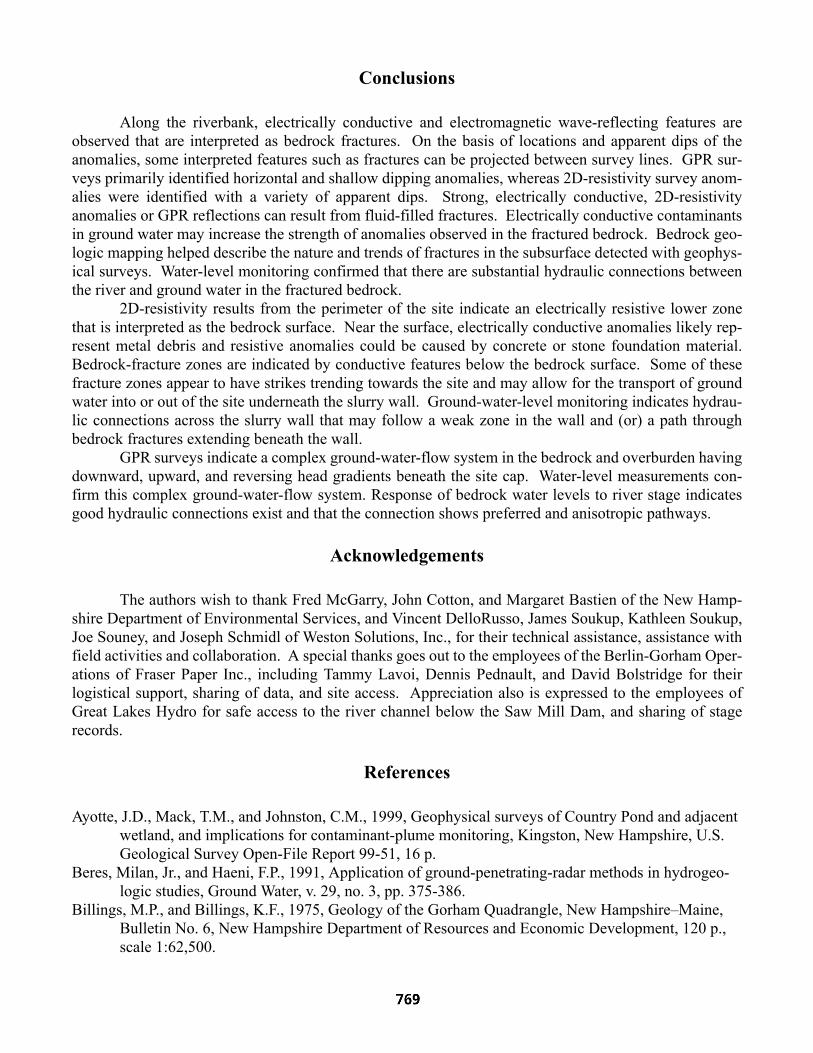
Table 1.: Table Showing Altitudes and Differences of Water Levels in Overburden and Bedrock Well Pairs
Well Pair (overburden/rock)
Overburden Head, in feet 4/2/2003
Bedrock Head,in feet 4/2/2003
Head Difference, in feet
Comment
MW-4/P-4A 1,096.18 1,095.74 0.44 Downward gradient
MW-2/MW-7 1,090.63 1,083.66 6.97 Downward gradient
MW-3/MW-8 Dry 1,085.50 ----- Dry overburden
MW-5/MW-9 1,091.72 1,090.42 1.30 Downward gradient
MW-10B/MW-10A 1,093.89 1,094.31 -0.42 Upward gradient
DISTANCE, IN FEET50 100 150 200 2251751257525 300250 2750
SAT
UR
ATE
D O
VE
RB
UR
DE
N
0
15
20
5
10
BE
DR
OC
K
0
20
10
30
40
WO
OD
CH
IPS
OR
OV
ER
BU
RD
EN 0
20
40
Land surfaceOverburdenSaturated overburden
Saturated overburden
Bedrock
Geomembrane
Wood chips
DE
PT
H, I
N F
EE
T
Figure 7.: Processed ground-penetrating-radar profile and interpretations from line 26 across the capped area, cell-house site, Berlin, N.H.
Conclusions
Along the riverbank, electrically conductive and electromagnetic wave-reflecting features areobserved that are interpreted as bedrock fractures. On the basis of locations and apparent dips of theanomalies, some interpreted features such as fractures can be projected between survey lines. GPR sur-veys primarily identified horizontal and shallow dipping anomalies, whereas 2D-resistivity survey anom-alies were identified with a variety of apparent dips. Strong, electrically conductive, 2D-resistivityanomalies or GPR reflections can result from fluid-filled fractures. Electrically conductive contaminantsin ground water may increase the strength of anomalies observed in the fractured bedrock. Bedrock geo-logic mapping helped describe the nature and trends of fractures in the subsurface detected with geophys-ical surveys. Water-level monitoring confirmed that there are substantial hydraulic connections betweenthe river and ground water in the fractured bedrock.
2D-resistivity results from the perimeter of the site indicate an electrically resistive lower zonethat is interpreted as the bedrock surface. Near the surface, electrically conductive anomalies likely rep-resent metal debris and resistive anomalies could be caused by concrete or stone foundation material.Bedrock-fracture zones are indicated by conductive features below the bedrock surface. Some of thesefracture zones appear to have strikes trending towards the site and may allow for the transport of groundwater into or out of the site underneath the slurry wall. Ground-water-level monitoring indicates hydrau-lic connections across the slurry wall that may follow a weak zone in the wall and (or) a path throughbedrock fractures extending beneath the wall.
GPR surveys indicate a complex ground-water-flow system in the bedrock and overburden havingdownward, upward, and reversing head gradients beneath the site cap. Water-level measurements con-firm this complex ground-water-flow system. Response of bedrock water levels to river stage indicatesgood hydraulic connections exist and that the connection shows preferred and anisotropic pathways.
Acknowledgements
The authors wish to thank Fred McGarry, John Cotton, and Margaret Bastien of the New Hamp-shire Department of Environmental Services, and Vincent DelloRusso, James Soukup, Kathleen Soukup,Joe Souney, and Joseph Schmidl of Weston Solutions, Inc., for their technical assistance, assistance withfield activities and collaboration. A special thanks goes out to the employees of the Berlin-Gorham Oper-ations of Fraser Paper Inc., including Tammy Lavoi, Dennis Pednault, and David Bolstridge for theirlogistical support, sharing of data, and site access. Appreciation also is expressed to the employees ofGreat Lakes Hydro for safe access to the river channel below the Saw Mill Dam, and sharing of stagerecords.
References
Ayotte, J.D., Mack, T.M., and Johnston, C.M., 1999, Geophysical surveys of Country Pond and adjacent wetland, and implications for contaminant-plume monitoring, Kingston, New Hampshire, U.S. Geological Survey Open-File Report 99-51, 16 p.
Beres, Milan, Jr., and Haeni, F.P., 1991, Application of ground-penetrating-radar methods in hydrogeo-logic studies, Ground Water, v. 29, no. 3, pp. 375-386.
Billings, M.P., and Billings, K.F., 1975, Geology of the Gorham Quadrangle, New Hampshire–Maine, Bulletin No. 6, New Hampshire Department of Resources and Economic Development, 120 p., scale 1:62,500.
Brayton, M.J., and Harte, P.T., 2001, Results of a monitoring program of continuous water levels, specific conductance and water temperature at the OK Tool Facility of the Savage Municipal Well Super-fund Site, Milford, New Hampshire, U.S. Geological Survey Open-File Report 01-338, 50 p.
Degnan, J.R., Moore, R.B., and Mack, T.J. 2001, Geophysical investigations of well fields to characterize fractured bedrock aquifers in southern New Hampshire, U.S. Geological Survey Water-Resources Investigations Report 01-4183, 54 p.
Hansen, B.P., Stone, J.R., and Lane, J.W., Jr., 1999, Characteristics of fractures in crystalline bedrock determined by surface and borehole geophysical surveys, Eastern Surplus Superfund Site, Med-dybemps, Maine, U.S. Geological Survey Water-Resources Investigations Report 99-4050, 55 p.
Loke, M.H., 1999, Electrical imaging surveys for environmental and engineering studies, A practical guide to 2-D and 3-D Surveys, Penang, Malaysia, accessed at (http://www.geoelectrical.com/), 68 p.
Loke, M.H., and Lane, J.W., 2002, The use of constraints in 2D and 3D resistivity modeling, in the 8th Environmental and Engineering Geophysical Society European Section meeting, Aveiro, Portu-gal, September, 8-12, 2002.
Lyons, J.B., Bothner, W.A., Moench, R.H., and Thompson, J.B., Jr., 1997, Bedrock geologic map of New Hampshire, U.S. Geological Survey State Geologic Map, 2 sheets, scale 1: 250,000 and 1:500,000.
Moench, R.H., Boone, G.M., Bothner, W.A., Boudette, E.L., Hatch Jr., N.L., Hussey II, A.M., and Mar-vinney, R.G., 1995, Geologic map of the Sherbrooke-Lewiston area, Maine, New Hampshire, and Vermont, United States and Quebec, Canada, U.S. Geological Survey Miscellaneous Investiga-tion Series Map I-1898-D, scale 1:250,000.
Powers, C.J., Singha, Kamini, and Haeni, F.P., 1999, Integration of surface geophysical methods for frac-ture detection in bedrock at Mirror Lake, New Hampshire, in Toxic Substances Hydrology Pro-gram Meeting, March 8-12, 1999, Proceedings, Charleston, S.C., U.S. Geological Survey, pp. 757-768.
Salvini, Francesco, 2002, The Structural Data Integrated System Analyzer software (DAISY 3.41b), Rome, Italy, Universita degli Studi “Roma Tre,” Dipartimento di Scienze Geologiche.
Walsh, G.J., and Clark, S.F., Jr., 2000, Contrasting methods of fracture trend characterization in crystal-line metamorphic and igneous rocks of the Windham Quadrangle, New Hampshire, Northeastern Geology and Environmental Sciences, v. 22, no. 2, 2000, pp. 109-120.
Zohdy, A.A.R., Eaton, G.P., and Mabey, D.R., 1974, Application of surface geophysics to ground-water investigations, U.S. Geological Survey Techniques of Water-Resources Investigations, book 2, chap. D1, 86 p.