integrated solid waste management in northern...
TRANSCRIPT

EX POST EVALUATION OF INVESTMENT PROJECTS CO-FINANCED BY THE
EUROPEAN REGIONAL DEVELOPMENT FUND (ERDF) OR COHESION FUND
(CF) IN THE PERIOD 1994-1999
INTEGRATED SOLID WASTE MANAGEMENT IN NORTHERN LISBON
PREPARED BY: BLOMEYER & SANZ, GUADALAJARA
IN PARTNERSHIP WITH CSIL, CENTRE FOR INDUSTRIAL STUDIES, MILAN
PREPARED FOR: EUROPEAN COMMISSION DIRECTORATE-GENERAL
REGIONAL POLICY POLICY DEVELOPMENT
EVALUATION
MILAN, SEPTEMBER 5, 2012

This report is part of a study carried out by a Team selected by the Evaluation Unit, DG Regional Policy,
European Commission, through a call for tenders by open procedure no 2010.CE.16.B.AT.036.
The consortium selected comprises CSIL – Centre for Industrial Studies (lead partner – Milan) and DKM
Economic Consultants (Dublin).
The Core Team comprises:
- Scientific Director: Massimo Florio, CSIL and University of Milan;
- Project Coordinators: Silvia Vignetti and Julie Pellegrin, CSIL;
- External experts: Ginés de Rus (University of Las Palmas, Spain), Per-Olov Johansson (Stockholm School
of Economics, Sweden) and Eduardo Ley (World Bank, Washington, D.C.);
- Senior experts: Ugo Finzi, Mario Genco, Annette Hughes and Marcello Martinez;
- Task managers: John Lawlor, Julie Pellegrin and Davide Sartori;
- Project analysts: Emanuela Sirtori, Gelsomina Catalano and Rory Mc Monagle.
A network of country experts provides the geographical coverage for the field analysis: Roland Blomeyer,
Fernando Santos (Blomeyer and Sanz – Guadalajara), Andrea Moroni (CSIL – Milano), Antonis Moussios,
Panos Liveris (Eurotec - Thessaloniki), Marta Sánchez-Borràs, Mateu Turró (CENIT – Barcelona), Ernestine
Woelger (DKM – Dublin).
The authors of this report are Roland Blomeyer, Fernando Santos and Antonio Sanz from Blomeyer & Sanz
and Emanuela Sirtori from CSIL. The authors of the CBA Analysis are John Lawlor and Rory Mc Monagle
from DKM Economic Consultants.
The authors are grateful for the very helpful comments from the EC staff and particularly to Veronica
Gaffey, José-Luís Calvo de Celis and Kai Stryczynski. They also express their gratitude to all stakeholders
who agreed to respond to the team’s questions and contributed to the realisation of the case study. The
authors are responsible for any remaining errors or omissions.
Quotation is authorised as long as the source is acknowledged.
Cover: Valorsul plant of urban solid waste treatment. Source: Valorsul..
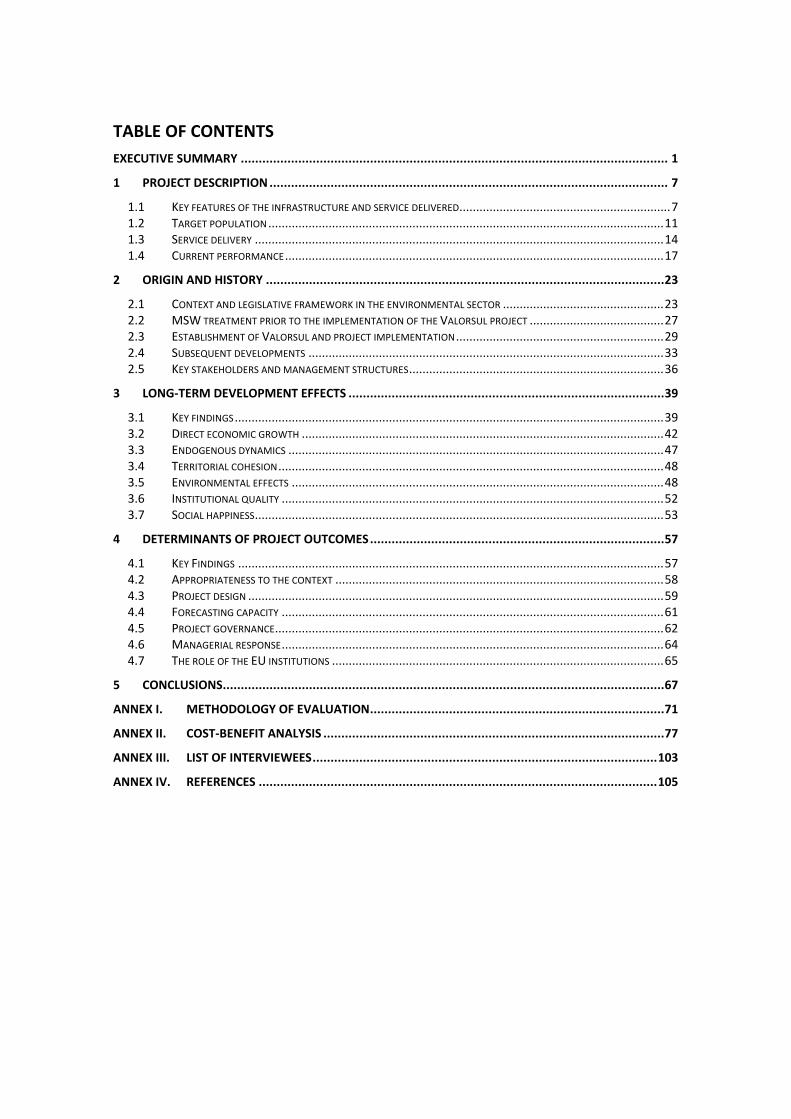
TABLE OF CONTENTS
EXECUTIVE SUMMARY ....................................................................................................................... 1
1 PROJECT DESCRIPTION ............................................................................................................... 7
1.1 KEY FEATURES OF THE INFRASTRUCTURE AND SERVICE DELIVERED............................................................... 7 1.2 TARGET POPULATION ...................................................................................................................... 11 1.3 SERVICE DELIVERY .......................................................................................................................... 14 1.4 CURRENT PERFORMANCE ................................................................................................................. 17
2 ORIGIN AND HISTORY ............................................................................................................... 23
2.1 CONTEXT AND LEGISLATIVE FRAMEWORK IN THE ENVIRONMENTAL SECTOR ................................................ 23 2.2 MSW TREATMENT PRIOR TO THE IMPLEMENTATION OF THE VALORSUL PROJECT ........................................ 27 2.3 ESTABLISHMENT OF VALORSUL AND PROJECT IMPLEMENTATION .............................................................. 29 2.4 SUBSEQUENT DEVELOPMENTS .......................................................................................................... 33 2.5 KEY STAKEHOLDERS AND MANAGEMENT STRUCTURES ............................................................................ 36
3 LONG-TERM DEVELOPMENT EFFECTS ........................................................................................ 39
3.1 KEY FINDINGS ................................................................................................................................ 39 3.2 DIRECT ECONOMIC GROWTH ............................................................................................................ 42 3.3 ENDOGENOUS DYNAMICS ................................................................................................................ 47 3.4 TERRITORIAL COHESION ................................................................................................................... 48 3.5 ENVIRONMENTAL EFFECTS ............................................................................................................... 48 3.6 INSTITUTIONAL QUALITY .................................................................................................................. 52 3.7 SOCIAL HAPPINESS .......................................................................................................................... 53
4 DETERMINANTS OF PROJECT OUTCOMES .................................................................................. 57
4.1 KEY FINDINGS ............................................................................................................................... 57 4.2 APPROPRIATENESS TO THE CONTEXT .................................................................................................. 58 4.3 PROJECT DESIGN ............................................................................................................................ 59 4.4 FORECASTING CAPACITY .................................................................................................................. 61 4.5 PROJECT GOVERNANCE .................................................................................................................... 62 4.6 MANAGERIAL RESPONSE .................................................................................................................. 64 4.7 THE ROLE OF THE EU INSTITUTIONS ................................................................................................... 65
5 CONCLUSIONS ........................................................................................................................... 67
ANNEX I. METHODOLOGY OF EVALUATION .................................................................................. 71
ANNEX II. COST-BENEFIT ANALYSIS ............................................................................................... 77
ANNEX III. LIST OF INTERVIEWEES ................................................................................................ 103
ANNEX IV. REFERENCES ............................................................................................................... 105

LIST OF ABBREVIATIONS
AD Anaerobic Digestion
CBA Cost-Benefit Analysis
CF Cohesion Fund
CH4 Methane
CO2 Carbon Dioxide
CSR Corporate Social Responsibility
EBCR Economic Benefit-Cost ratio
EC European Commission
EDP Energias de Portugal
EGF Empresa Geral de Fomento
EIB European Investment Bank
ENPV Economic Net Present Value
ERDF European Regional Development Fund
ERR Economic Rate of Return
ERSAR Regulatory Authority for Water and Waste Services (Entidade Reguladora dos
Serviços de Águas e Resíduos)
EU European Union
EUR Euro
FBCR Financial Benefit-Cost ratio
FNPV Financial Net Present Value
FRR Financial Rate of Return
GDP Gross Domestic Product
GHG Greenhouse gases
GWh Giga-Watt-hour
IFDR Financial Institute for Regional Development (Instituto Financeiro para o
Desenvolvimento Regional)
INE National Institute of Statistics
IRAR Regulatory Institute of water and waste
IRR Internal Rate of Return
ISO International Organization for Standardisation
kg Kilogramme
km Kilometre
m Metre
MBT Mechanical biological treatment
MRF Materials Recovery Facility
MSW Municipal Solid Waste
MSW Municipal Solid Waste
MW Mega-Watt
MWh Mega-Watt-hour
NGO Non-Governmental Organization
NPV Net Present Value
NUTS Nomenclature of Territorial Statistical Units
NYMBY Not in my backyard
OECD Organisation for Economic Co-operation and Development
OHSAS Occupational Health and Safety Assessment Series
PERSU National Strategic Plan for Municipal Solid Waste (Plan Estatal de Resíduos
Sólidos Urbanos)
S.A. Public Limited Company (Sociedade Anonima)
t Tonnes
Tj TeraJoules
VAT Value Added Tax
WtE Waste to Energy


1
EXECUTIVE SUMMARY
This case study analyses the development of the Integrated Waste Management System in the
metropolitan area of Northern Lisbon, implemented by the public company Valorsul
( .).
The report evaluates (ex-post) the long term performance of such a system. Further details on
the methodology are described in the box below and, more extensively, in Annex I.
OVERALL APPROACH AND METHODOLOGY
The Conceptual Framework delivered in the First Intermediate Report has been developed from the evaluation questions included in the ToR3, and further specified and organised in accordance with the study team’s understanding. In particular, the Team identified three relevant dimensions of analysis:
a) The object of the evaluation (the ‘WHAT’): this relates to the typologies of long‐term contributions that can be observed. Starting from the typologies identified in the ToR (socio‐economic development and quality of life) the Team developed the following classification of long‐term effects: ‘Economic development’ (including effects on GDP growth and endogenous dynamics) and ‘Quality of life’, taken here to be synonymous with additional social wellbeing, i.e. including effects that are not captured by the economic variables. ‘Quality of life’, in turn, has been divided into: social cohesion, territorial cohesion, institutional learning, environmental effects and social happiness.
b) The timing of the long‐term effects (the ‘WHEN’): this dimension relates to the point in the project’s lifetime at which the effects materialise for the first time (short‐term dimension) and stabilise (long‐term dimension). The proper timing of an evaluation and the role it can have in relation to the project’s implementation is also discussed here.
c) The determinants of the project’s performance (the ‘HOW’): the assumption here is that five aspects of project’s implementation and their interplay are crucial for the project’s final performance. These aspects are: project design, forecasting capacity, governance, context and managerial response. Five Working Hypotheses are related to these dimensions and explain how each of them can influence the generation of the project’s short or long‐term effects.
On the basis of this conceptualisation, a set of detailed evaluation questions are developed, which aim to guide the entire study and to support the provision of conclusions and recommendations.
The methodology developed to answer the evaluation questions consists of a combination of quantitative (Cost Benefit Analysis) and qualitative (interviews, surveys, searches of government and newspaper archives, etc.) techniques, integrated in such a way as to produce ten project histories. CBA is an appropriate analytical approach for the ex‐post evaluation because it can provide quantification of or indications of some of the long‐term effects produced by the project. However, the most important contribution of the CBA exercise is to provide a framework of analysis to identify the most crucial aspects of the projects’ ex‐post performance and final outcome. Qualitative analysis on the other had is more focussed on understanding the underlying causes and courses of action of the delivery process. On the basis of the findings of the ten case studies, the Final Report will draw lessons along the key dimensions identified of ‘what’, ‘when’ and ‘how’.
Source: CSIL Milano
Portugal’s economy was undergoing significant growth in the early 1990s, following structural
changes in various sectors, namely industry, agriculture, coastal urbanisation and tourism. At
the same time, the country had difficulties in balancing this progress with social and
environmental developments. The waste sector, in particular, was managed in an
unsustainable way, and Portugal struggled with the new challenges arising from EU

2
membership (specifically compliance with policies and legislation). MSW treatment still relied
upon landfill disposal and, to a minor extent, compost production. Recycling was largely
underdeveloped and no incinerator plants were in operation.
In response to this, starting from 1993 the Government reorganised the waste sector by
means of new laws, policies, plans and institutions. Two Decree-Laws1 allowed municipalities
to undertake waste management activities through third-party concessions and they set the
conditions for shared management systems between municipalities. Furthermore, the
Strategic Plan for Municipal Solid Waste (PERSU) was launched in 1996, which set the ground
for the construction of new infrastructures for waste treatment.
Within this context, Valorsul was established in 1994 as the public company responsible for
municipal waste treatment of the metropolitan area of North Lisbon, including the
municipalities of Amadora, Lisbon, Loures, Odivelas and Vila Franca de Xira2. Its shareholders
include the Councils of these municipalities as well as other public bodies at national level. In
1995 the company was granted a twenty-five year concession for the construction and
management of the necessary facilities for the recovery or disposal of municipal solid waste
(MSW) produced by some 1.3 million people. The overall project size can be appreciated if one
considers that in 2009 the MSW produced by the municipalities in the catchment area
accounted for 16% of total MSW generated in Portugal.
The initial project, financially supported by the CF and the European Investment Bank, covered
the construction of a Waste to Energy Plant (WtE), a modern sanitary landfill, a material
sorting facility, drop-off centre and a bottom ash processing and recovery installation. The
project also envisaged the sealing of uncontrolled open dumps and the implementation of
separate collection of specific MSW (albeit collection remained the responsibility of the
municipalities and not of Valorsul). This project was implemented between 1995 and 2002 and
involved a capital expenditure of EUR 331.4 million in current terms (at 2011 prices). The
evaluation takes into account also a subsequent Cohesion Fund project, approved in 1999,
involving the construction of an Anaerobic Digestion Plant producing compost from organic
waste (for an investment cost of EUR 34.6 million). This plant, which started operations in
2008, complemented the Valorsul waste management aimed at providing the population of
the metropolitan area of Northern Lisbon with modern and effective facilities for waste
treatment and recycling.
The total investment cost for implementation of the Integrated Waste Management System
considered in the analysis is EUR 366 million in constant 2011 prices. Besides the Cohesion
Fund and European Investment Bank’s contribution, the remaining cost were covered by
Valorsul own resources, as shown in the following Table.
1 Decree-Law 372/93 October 29
th and 379/93 November 5
th.
2 Note that, at the time of the establishment of Valorsul, Odivelas belonged to the municipality of Loures, from which it became
independent in 1998.
3
OVERVIEW OF INVESTMENT COSTS AND SOURCES OF FINANCING
Financing period 1995-2002; 1999-2008
First year of operation 1996-2008
Total investment costs (2011 prices) EUR 366 million 100%
Sources of financing and co-funding rates over the total investment costs
Cohesion Fund EUR 136.8 million 37.38%
European Regional Development Fund EUR 0 0
European Investment Bank EUR 125.8 million 34.36%
National-regional-local public contribution EUR 0 0
Public equity/commercial debt/internal cash flow EUR 103.4 million 28.26%
Environmental quality is the aspect on which the project has had the most positive impact. The
project contributed, in particular, to the closure of all uncontrolled landfills in the catchment,
which were generating significant air and soil pollution; to proper processing of municipal
waste (e.g. it reduced the amount of untreated waste sent to landfills from 100% in 1998 to
17% in 2009); to the generation of partially renewable electricity (Valorsul produces 0.7% of
the national electricity of Portugal), thus reducing greenhouse gas emissions, and to increasing
the recycling rates of organics and other materials.
It is worth highlighting, however, that the current recycling rates in the catchment area (which
varies between 6% and 14% of total recyclable materials) are still below the national and EU
targets, in contravention of EU Directive 2004/12/EC on packaging and packaging waste.
Organic waste sorting is very poor, and the high improper fraction prevents from producing
good quality compost. Despite the numerous education campaigns implemented by Valorsul,
more time and efforts are probably needed in order to change the waste sorting behaviour of
citizens.
From an economic viewpoint the project has contributed to direct economic growth in a
number of areas, such as energy production, sale of recyclable products and delivery of
effective waste treatment services. Notwithstanding this, the benefits to economic growth
could have been greater, subject to the following conditions:
a higher recycling rate, enabling an increase in the sale of recyclable materials;
a better quality of compost produced, which would have generated higher revenues
from the Anaerobic Digestion Plant: Valorsul is experiencing difficulties in marketing
the compost due to its poor quality;
and, if the facilities had been built in a single complex. The plants that are part of the
Valorsul Integrated Waste Management System have been spread over the different
municipalities involved. Their centralisation in a single location would have allowed a
saving in waste transportation costs between facilities and in overhead costs, while
generating relevant synergies.
Additionally, Valorsul’s financial return on investment would have been higher if the tariffs
paid by municipalities for the waste treatment services reflected their cost. Instead, thanks to
4
the governmental subsidisation of the price of energy produced by ‘green’ sources, Valorsul
generates high income from the production of energy from waste, and as a result can charge
the municipalities very low gate fees, sufficient to make a modest financial surplus3, but not
covering the operation cost of waste treatment. This is in contravention of the European
“polluter pays” principle4.
These issues are reflected in the CBA exercise. On a socio-economic basis, the project has a
negative return (ENPV EUR -44 million) over a 30 year timeframe. However, if compared to the
counterfactual of a landfill, which generates an ENPV of EUR -179 million, the project
generates a net positive return for society of approximately EUR 135 million, with an internal
rate of return of 5.9%.
Overall, the project’s economic benefits, that have been quantified in the CBA, are not
particularly high and they are positive only when compared to the counterfactual scenario.
This is partly due to the aforementioned reasons (lost revenue opportunities from the sale of
compost, the limited revenues from the sale of recyclable materials and the relative more
costly decentralised system). However, in assessing the project’s impact it has to be
considered that the CBA does not incorporate a large number of other effects which in fact
have been produced by the project.
The large scale of the project (one of the largest at that time), the new technology
(incineration) and the multi-municipal management structure used, had a positive impact on
capacity building, from a technical as well as a managerial perspective. Much of the expertise
was acquired from international experts brought in to establish the project, with a potential
positive effect on the endogenous dynamics of economic growth. With regard to institutional
quality, the project helped to create in a relatively short period of time a level of expertise and
capacity to deliver large and complex projects that did not exist before in Portugal. The project
was ‘pioneering’ at the time, and it can be said that in the medium to long run, it also
influenced some institutional structures in a sort of learning-by-doing process. In fact, the
lessons learnt have been used to assist EU Candidate Countries involved in similar projects in
subsequent years, through the EC Twinning Instrument.
Regarding territorial cohesion, the project has had an influence on reducing welfare disparities
between the relatively large and rich municipality of Lisbon and the other smaller and less
economically developed municipalities in the metropolitan area: if the decentralised strategy
followed in the construction of the waste treatment facilities increased the transport cost of
waste and the transport emissions, it also helped to distribute the employment and
development opportunities generated by the new infrastructures across all the municipalities
involved and, most of all, to minimize the “Not in my backyard” syndrome: since no
3 It is not uncommon for the gate fees at municipal WtE plants to be set as a residual after energy sales revenues are taken into
account. It is worth noting also that final users contribute as tax payers to the subsidisation of the energy sector. 4 According to this principle, stated in Directive 2004/35/CE, the operator whose activity has caused the environmental damage or
the imminent threat of such damage is to be held financially liable. The objective of this principle is to induce operators to adopt measures and develop practices to minimise the risks of environmental damage so that their exposure to financial liabilities is reduced.

5
municipality was in favour of the construction of a waste treatment complex in its area, in
order not to dissatisfy any municipality, Valorsul accepted to distribute the different plants
over the entire catchment area. Instead, the project did not contribute to social cohesion,
since it ensured the provision of a public service to all citizens, without focusing on particular
social groups.
The main non-quantified benefit is on social happiness. Local residents not only enjoy a better
quality of waste services, but also have been the target of many initiatives in the area of
environmental education, which increases public perception of the improvement in quality of
life attained thanks to the new Integrated Waste Management System. While in its initial
stages the project faced opposition from local communities and environmental organisations,
Valorsul’s efforts to increase the transparency of its operations, raise awareness and involve
civil society organisations and other stakeholders, helped to change perceptions. The closure
and rehabilitation of old dumps provided valuable public amenities while generating significant
environmental improvements. Moreover, Valorsul has supported additional initiatives to
increase people’s quality of life, such as the construction of an indoor swimming pool and the
planting of trees in public parks. As a result of this, opposition is now considered negligible and
the project’s impact on social happiness has been very high.
The project was highly appropriate to its context and this played a positive role in the
generation of long-term effects: the large problem of waste management and the need to
comply with EU policies and legislation was highly relevant in the justification of the project,
which was also necessary for the success of national plans and strategies such as PERSU. The
celebration of Expo ’98 in Lisbon was also an important driver, since the selected location was
occupied by an old dump site and a poorly functioning composting plant, for which an
alternative solution had to be found. Very important too was the availability of EU funds for
large infrastructures that would help Portugal to meet EU environmental standards.
Another key factor in the project’s success was the limited on-going opposition to the project,
which has been minimised through an adequate forecasting capacity and managerial response.
On the one hand, Valorsul anticipated that the public would oppose the new technology, but it
managed to change perceptions, as said, by organising communication campaigns and building
strategic partnerships with companies, authorities and local associations, with particular
attention to those groups who had more reservations regarding the project. On the other
hand, Valorsul secured the consensus of the municipalities involved, which are both its
shareholders and users of the Integrated Waste Management System, by adapting to their
demands: more specifically, municipalities asked for and obtained the construction of waste
facilities in each of the target territories and a of ring-road serving the WtE plant so as to
reduce traffic congestion. Demands of environmental organisations have also been addressed
through the decision to build the composting plant.
Forecasting capacity however was limited as far as the waste volume and composition in the
target area were concerned. The WtE plant’s capacity turned out to be slightly higher than
actual demand: it is capable of treating 662,000 tonnes of MSW per year, but in fact over
recent years has received on average 560,000 tonnes; the current economic crisis, which has

6
constrained private consumption and thus waste generation, is further reducing the volume of
waste to be treated. Nevertheless, Valorsul has demonstrated good capacity to adapt to this.
With the goal of maximising utilisation of the WtE capacity and reaching economies of scale, in
2010 the company decided to merge with Resioeste, the association of municipalities
responsible for waste management in the West region of Lisbon, having a population of about
400,000 inhabitants.
Regarding project design, it proved to be effective in generating the expected effects. The
project was planned in a comprehensive and incremental way. At first, the most urgent issues
were tackled, i.e. sealing of open dumps and construction of a modern landfill. Then the WtE
plant was commissioned, and initiatives for complementary waste treatment followed.
Finally, it is worth noting the role of the EC and the European Investment Bank (EIB). The EC
not only co-financed Valorsul’s first project, but also gave continuous support to Valorsul’s
activities through the co-financing of further projects, namely: the refurbishment of municipal
landfills (European Regional Development Fund); the Anaerobic Digestion Plant (Cohesion
Fund); the Ecovia project (LIFE Programme), etc. The role of the EIB was also of great value. In
addition to a financial contribution close to that of the CF (32% against 36% of total investment
cost), the EIB also provided technical and economic assistance for the design of the project.
The main lesson that can be drawn from this project concerns the way how Valorsul involved
and collaborated with local authorities, Non-Governmental Organisations and other parties in
order to secure consensus among stakeholders. Projects envisaging the construction of
incinerator plants are usually subject to very strong public opposition, but Valorsul successfully
managed to cope with that by organising numerous awareness campaigns and ensuring high
transparency towards the public since the early stage of project design. On the other hand, the
project also allows to perceive the importance that good waste sorting among households has
in ensuring the effectiveness of the entire waste management system: the recovery of
recyclable materials in the Northern Lisbon area currently is not enough to comply with the EU
targets on recycling5 and bad separation of organic waste prevents from producing compost to
be sold to the agriculture sector. New awareness campaigns and the improvement of waste
collection, which have been foreseen in the new Strategic Plan for Municipal Solid Waste,
covering the period 2007-2016, are expected to improve the recycling rates in the future years.
5 Set in Directive 94/62/EC on packaging and packaging waste, amended by Directive 2004/12/EC.

7
1 PROJECT DESCRIPTION
1.1 KEY FEATURES OF THE INFRASTRUCTURE AND SERVICE DELIVERED
Valorsul was established in 1994, as a publicly owned limited company6 to deliver municipal
waste treatment for the Northern Lisbon metropolitan area, integrating the municipalities of
Amadora, Lisbon, Loures and Vila Franca de Xira7. The shareholders of the company included
the Councils of these four municipalities as well as the public bodies Parque Expo '98 S.A.,
Empresa Geral do Fomento S.A. and the national energy company Eletricidade de Portugal S.A.
In 1998 the municipality of Odivelas, previously part of Loures, acquired autonomy and it was
automatically included as the fifth municipality of Valorsul.
On 28th September 1995 Valorsul signed a twenty-five year concession contract with the
Ministry of Environment for the conception, construction and management of all the
necessary installations for the recovery or disposal of municipal waste produced in this area.
For the purpose of this study we will look at Valorsul from its inception phase up to the
present day. The main object of analysis will be the major project “Multi-municipal System for
Urban Solid Waste Treatment for the Metropolitan Area of Northern Lisbon”8, co-financed by
the Cohesion Fund9 over the period 1995-2002. The original project application was prepared
by the Directorate General for Regional Development and subsequently implemented by
Valorsul10: it involved an investment of EUR 186.41 million in current terms, 49.41% of which
co-funded by the Cohesion Fund. The main initiatives included in the project were as follows:
1. Construction of a Waste to Energy (WtE) plant, which allows for the valorisation of waste
through energy production;
2. Construction of a ring-road connecting Loures and Lisbon, serving the WtE plant;
3. Construction of a modern engineered landfill (the Mato da Cruz landfill) to provide for the
reception of incinerator bottom ash11 and a back-up in cases where the WtE plant was not
available; biogas generated by waste is flared, in order to minimise the escape of methane
emissions;
4. Construction of the Materials Recovery Facility and a drop-off centre12, where glass, paper
and packaging are sorted from the separate collection and then forwarded to the recycling
industry. Waste separation is generally carried out automatically, by means of a trommel,
6 The legal form in Portugal is sociedade anónima (S.A.).
7 Valorsul was established under the Decree-Law No. 297/94 of November 21
st. It is also based on Decree-Law No. 294/94 of
November 16th
, which establishes the legal regime for the granting of concessions for the exploitation and management of municipal solid waste treatment systems. 8 ‘Sistema Multimunicipal de Tratamento de RSU da Area Metropolitana de Lisboa Norte’.
9 Reference number 95/10/61/026.
10 European Commission, 1994.
11 Bottom ash can also be used in civil construction. The part that is not used in this sector is disposed of to the landfill.
12 With a capacity of 105,000 t/year.

8
a bag opener, a balistic separator, three optical separating devices and four film suction
systems. The refinement of the sorting is done manually.
5. Construction of the Bottom Ash Processing and Recovery installation, which extracts
ferrous metals from the bottom ash produced by the WtE plant;
6. Sealing of uncontrolled dumps in Vale Forno and Sta Iria de Azoia.
Figure 1.1 VALORSUL WTE PLANT
Source: Valorsul, 2009
The WtE plant, inaugurated in 2000, was the flagship initiative and the raison d'être of
Valorsul. This facility also absorbed 83% of the total investment costs of the project, i.e. EUR
153.81 million13. The WtE plant is a traditional mass burning incineration with three lines
capable of treating 28 tonnes/hour each, corresponding to a capacity of approximately
662,000 tonnes MSW per year. The civil works and equipment that are part of the
infrastructure are the following (see Figure 1.1):
a discharge platform (101 m* 28 m), receiving the MSW;
a waste bunker with a capacity of 18,000 m3;
two semi-automatic mixing and feeding cranes and one mill for bulky objects;
13
In current terms.
Discharge platform
Furnace
Boiler
Gas scubber
Bag house filter
Stack

9
three identical independent incineration lines composed of hydraulic feeders,
furnaces, boilers (at 420° C) and flue gas treatment systems14;
one steam turbine with a capacity of 50 MW;
one generator of electricity with a capacity of 49.3 MW;
a 60 m high chimney;
storage tanks and buildings for input materials as well as for slag and materials from
the air cleaning system.
The plant layout allows for the possibility of enlarging the incineration’s capacity with a fourth
line, if needed: access roads, delivery and storage facilities are also dimensioned for this
possibility.
In the intervening years, Valorsul has experienced a series of important developments:
additional initiatives were implemented by the company in order to provide an integrated
waste treatment service to the target area. They include, in particular, the construction of the
bio-waste Anaerobic Digestion (AD) Plant in 2005: this plant receives and processes organic
waste, separately collected, to generate – through anaerobic digestion – compost for
agricultural and domestic use and electricity from the biogas produced. This was part of
another project, approved in 1999 with an investment cost of EUR 20.5 million15, 40.42% of
which was co-financed by the Cohesion Fund16.
The WtE plant and the rest of the infrastructure and services of the company form the Valorsul
Integrated Waste Management System. As shown in Figure 1.2, Valorsul’s facilities are not
concentrated in a single complex, but are located across the served municipalities. The WtE
plant is located about 10 km North-East of central Lisbon, in the municipality of Loures. The
Bottom Ash Processing and Recovery is located in the municipality of Villa Franca de Xira; in
this municipality also the Mato da Cruz landfill is located. The Materials Recovery Facility and
the drop-off centre are in the municipality of Lisbon. Finally, the Anaerobic Digestion Plant has
been built in the municipality of Amadora.
An event which has to be highlighted is the recent merger (in 2010) of Valorsul and another
public company, Resioeste S.A.17, responsible for waste treatment in the municipalities located
in the west area of Lisbon: as a result, a ‘new’ Valorsul has been established, which includes 14
14
Hazardous waste resulting from flue gas treatment are channelled to the National System of hazardous waste component. Such waste is estimated to reach 3% to 4% of the weight of MSW incinerated. 15
Reference number 1999/PT/16/C/PE/005. 16
In the same years Valorsul implemented a project for the sealing of other dump sites (Carenque, Montemor, Boba), at an investment cost of EUR 9.27 million, 75% of which was co-financed through the European Regional Development Fund (ERDF). This project has not been included in the project under assessment, because it does not affect the integrated solid waste management system put in place. 17
Resioeste is the multi-municipal system created in 1997 by Decree-Law 366/97 December 20th
.

10
new municipalities18, serves 400,000 inhabitants and processes some 20% more waste,
corresponding to almost 200,000 tonnes per year. Furthermore, this merger has allowed
Valorsul to ‘acquire’ additional infrastructures and facilities for waste management (see
Section 2.4 for details).
Figure 1.2 VALORSUL INFRASTRUCTURES19
c : h ’ c f , 2009
The scope of this evaluation is the set of infrastructures built by Valorsul and forming the
Integrated Waste Management System of the Northern Lisbon metropolitan area. These
infrastructures are part of different projects, all of them implemented by Valorsul and co-
financed by EU funds; it has been decided to focus the analysis on the whole waste treatment
system, given its integrated nature. Nevertheless, in assessing the long-term performance of
the infrastructures, whenever possible, we have tried to distinguish, at least in qualitative
terms, between the effects produced by each project and, in particular, by the construction of
the sanitary landfill, the WtE plant, the materials recovery facility and the bottom-ash
18
The list of municipalities include Alcobaça, Alenquer, Amadora, Arruda dos Vinhos, Azambuja, Bombarral, Cadaval, Caldas da Rainha, Lisboa, Loures, Lourinhã, Nazaré, Óbidos, Odivelas, Peniche, Rio Maior, Sobral de Monte Agraço, Torres Vedras e Vila Franca de Xira. 19
Main infrastructures of Valorsul prior to the merge with Resioeste.
Waste-to-Energy plant (WtE)
Materials Recovery Facility (MRF) and Drop-off Centre
Bottom ash processing and recovery installation
Anaerobic Digestion Plant (Station for Organic Valorisation and Treatment)
Landfill in Mato da Cruz

11
processing and recovery installation on the one hand, and by the Anaerobic Digestion Plant on
the other hand.
By contrast, Resioeste has not been incorporated in the analysis, although some elements of
the ‘new’ Valorsul have been taken into account where this was considered necessary for the
analysis, e.g. to estimate the future amount of waste to be treated, particularly in the future
scenario of the Cost-Benefit Analysis (CBA) exercise20.
The total investment cost undertaken by Valorsul to finance the waste management facilities
and considered in this evaluation is presented in Table 1.1. As shown, further investment were
made by Valorsul in subsequent years to improve the facilities and equipment financed in the
1995-2002 major project. Some cost overruns are recorded as far as the AD plant project is
concerned. While the approved expenditure was EUR 20.5 million, the total investment cost to
date has been EUR 29 million (current prices). As explained in the next Sections of this report,
these expenditures were required to solve a number of technical problems affecting the Plant.
Table 1.1 INVESTMENTS UNDERTAKEN BY VALORSUL (EUR THOUSAND, CURRENT
PRICES)
Initial Investment*
Subsequent Investments
Total
Investments
Buildings 4,226 0 4,226
Closure and rehabilitation of dumps at S. Iria/Vale do Forno 5,888 0 5,888
Waste to Energy plant - Loures 153,810 18,944 172,754
Sanitary Landfill - Mato da Cruz (Vila Franca de Xira) 10,111 12,413 22,524
Sorting Plant - Lisbon 7,519 6,256 13,775
Bottom Ash Recovery plant - Vila Franca de Xira 2,021 511 2,532
Vehicles for selective waste collection 7,061 10,392 17,453
Anaerobic Digestion plant – Amadora ** 0 29,429 29,429
Total 190,636 77,945 268,581
* Multi-municipal System for Urban Solid Waste Treatment for the Metropolitan Area of Northern Lisbon (CF Project 95/10/61/026). ** CF Project 1999/PT/16/C/PE/005
Source: Valorsul
1.2 TARGET POPULATION
The WtE plant, as well as other facilities and services provided by Valorsul are situated within
the EU NUTS321 sub region Greater Lisbon22. This area, together with the other NUTS3 sub-
region Peninsula de Setúbal, constitutes the NUTS2 region of Lisbon23. The Greater Lisbon area
20
See Annex II. 21
The NUTS classification (Nomenclature of territorial units for statistics) is a hierarchical system for dividing up the economic territory of the EU. NUTS1 are major socio-economic regions, NUTS 2 are basic regions identified for the application of regional policies and NUT3 regions are small regions for specific diagnoses. 22
Code PT171. 23
Code PT17.
12
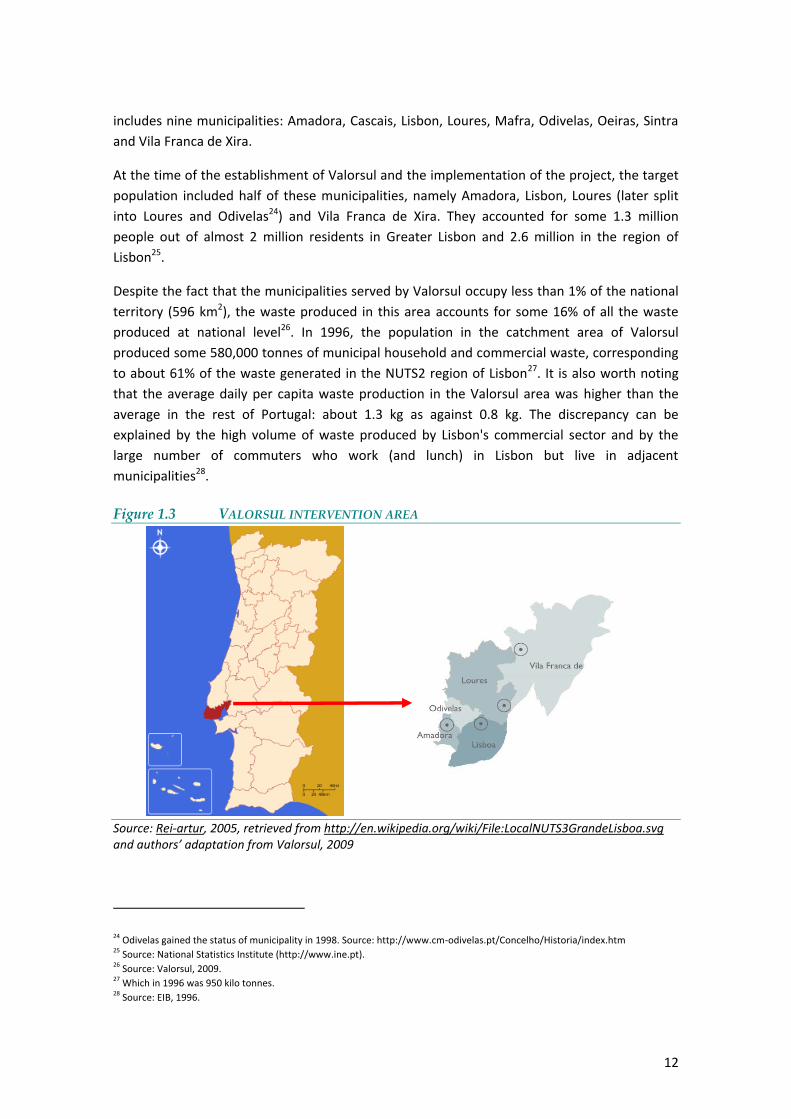
includes nine municipalities: Amadora, Cascais, Lisbon, Loures, Mafra, Odivelas, Oeiras, Sintra
and Vila Franca de Xira.
At the time of the establishment of Valorsul and the implementation of the project, the target
population included half of these municipalities, namely Amadora, Lisbon, Loures (later split
into Loures and Odivelas24) and Vila Franca de Xira. They accounted for some 1.3 million
people out of almost 2 million residents in Greater Lisbon and 2.6 million in the region of
Lisbon25.
Despite the fact that the municipalities served by Valorsul occupy less than 1% of the national
territory (596 km2), the waste produced in this area accounts for some 16% of all the waste
produced at national level26. In 1996, the population in the catchment area of Valorsul
produced some 580,000 tonnes of municipal household and commercial waste, corresponding
to about 61% of the waste generated in the NUTS2 region of Lisbon27. It is also worth noting
that the average daily per capita waste production in the Valorsul area was higher than the
average in the rest of Portugal: about 1.3 kg as against 0.8 kg. The discrepancy can be
explained by the high volume of waste produced by Lisbon's commercial sector and by the
large number of commuters who work (and lunch) in Lisbon but live in adjacent
municipalities28.
Figure 1.3 VALORSUL INTERVENTION AREA
Source: Rei-artur, 2005, retrieved from http://en.wikipedia.org/wiki/File:LocalNUTS3GrandeLisboa.svg and authors’ adaptation from Valorsul, 2009
24
Odivelas gained the status of municipality in 1998. Source: http://www.cm-odivelas.pt/Concelho/Historia/index.htm 25
Source: National Statistics Institute (http://www.ine.pt). 26
Source: Valorsul, 2009. 27
Which in 1996 was 950 kilo tonnes. 28
Source: EIB, 1996.
13
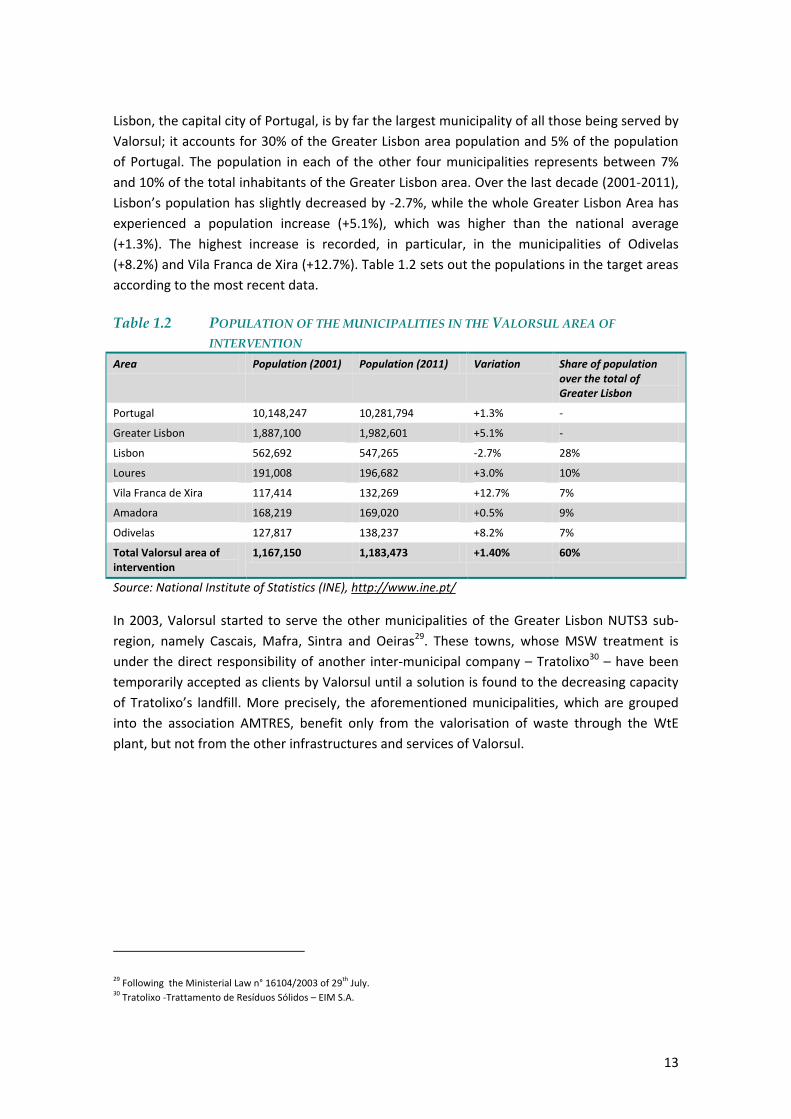
Lisbon, the capital city of Portugal, is by far the largest municipality of all those being served by
Valorsul; it accounts for 30% of the Greater Lisbon area population and 5% of the population
of Portugal. The population in each of the other four municipalities represents between 7%
and 10% of the total inhabitants of the Greater Lisbon area. Over the last decade (2001-2011),
Lisbon’s population has slightly decreased by -2.7%, while the whole Greater Lisbon Area has
experienced a population increase (+5.1%), which was higher than the national average
(+1.3%). The highest increase is recorded, in particular, in the municipalities of Odivelas
(+8.2%) and Vila Franca de Xira (+12.7%). Table 1.2 sets out the populations in the target areas
according to the most recent data.
Table 1.2 POPULATION OF THE MUNICIPALITIES IN THE VALORSUL AREA OF
INTERVENTION
Area Population (2001) Population (2011) Variation Share of population over the total of Greater Lisbon
Portugal 10,148,247 10,281,794 +1.3% -
Greater Lisbon 1,887,100 1,982,601 +5.1% -
Lisbon 562,692 547,265 -2.7% 28%
Loures 191,008 196,682 +3.0% 10%
Vila Franca de Xira 117,414 132,269 +12.7% 7%
Amadora 168,219 169,020 +0.5% 9%
Odivelas 127,817 138,237 +8.2% 7%
Total Valorsul area of intervention
1,167,150 1,183,473 +1.40% 60%
Source: National Institute of Statistics (INE), http://www.ine.pt/
In 2003, Valorsul started to serve the other municipalities of the Greater Lisbon NUTS3 sub-
region, namely Cascais, Mafra, Sintra and Oeiras29. These towns, whose MSW treatment is
under the direct responsibility of another inter-municipal company – Tratolixo30 – have been
temporarily accepted as clients by Valorsul until a solution is found to the decreasing capacity
of Tratolixo’s landfill. More precisely, the aforementioned municipalities, which are grouped
into the association AMTRES, benefit only from the valorisation of waste through the WtE
plant, but not from the other infrastructures and services of Valorsul.
29
Following the Ministerial Law n° 16104/2003 of 29th
July. 30
Tratolixo -Trattamento de Resíduos Sólidos – EIM S.A.

14
Table 1.3 POPULATION OF AMTRES MUNICIPALITIES TEMPORARILY SERVED BY
VALORSUL - 2011
Municipality Population Share of population of Greater Lisbon
Cascais 198,262 10%
Mafra 73,810 4%
Sintra 361,559 18%
Oeiras 165,497 8%
Total 799,128 40%
Source: National Institute of Statistics (INE), http://www.ine.pt/
1.3 SERVICE DELIVERY
The Figure below illustrates the life-cycle of waste in the Valorsul waste management system,
from the moment it is delivered by citizens to its final disposal into the landfill or other
Valorsul facilities for their energetic valorisation or recycling.
Valorsul clients may include municipalities as well as private bodies (mostly companies).
Municipalities have the overall responsibility for providing waste services: on their behalf,
Valorsul is responsible for waste treatment and recycling activities and for the collection of
separated recyclable waste discharged by individuals at the drop-off centre. The transport of
the rest of the MSW to the Valorsul facilities is the responsibility of the municipalities, with the
exception of the following cases: solid waste produced by companies in excess of 1,100 litres
and other solid waste produced by individuals not originating from houses, such as waste
originating from moving house. In both cases, the companies/individuals bear the
responsibility for delivering the waste themselves.
Recyclable materials are delivered at the drop-off centres and then transported by
municipalities at Valorsul Materials Recovery Facility, where waste bags are opened and the
contents are separated into different materials (paper and cardboard, plastic, metal and glass).
Packaging waste is then collected by the private non-profit company Sociedade Ponto Verde,
which takes responsibility for putting it onto the recycling market. Valorsul receives a
compensation by Sociedade Ponto Verde for each tonne of packaging waste materials
recovered (see Section 2.5 for further details on Sociedade Ponto Verde). Organic waste is
separately sorted by households and delivered to the AD plant, where it is used to produce
compost. The rest of unsorted waste is either delivered to the WtE plant or to the landfill, if it
not suitable for incineration. Valorsul provides for transporting the bottom ash resulting from
incineration to the Bottom Ash Processing and Recovery installation, where metal is extracted
to be recycled.

15
Figure 1.4 VALORSUL WASTE LIFE-CYCLE
c : h ’ f , 2009
Tariffs are differentiated by kind of waste treatment service provided by Valorsul and by type
of client. For instance, municipalities do not pay any tariff for delivering the organic fraction to
the Anaerobic Digestion Plant, but a tariff has been set for private clients. In this case, Valorsul
charges private clients for the composting service depending on the volume of organic waste
delivered and its level of contamination, i.e. the share of improper materials within the organic
waste. In order to encourage the recycling of organic waste, the plant accepts material free of
charge from clients who deliver high volumes of waste with low levels of contamination (see
Table 1.4).
Table 1.4 TARIFFS FOR THE ANAEROBIC DIGESTION PLANT
Volume of organic waste delivered Level of contamination (share of improper waste)
Tariff (paid only by private clients)
> 500 t/year ≥ 11% EUR 53.84/t
< 11 % EUR 0.00/t
< 500 t/year
≥ 11% EUR 53.84/t
5% - 11% EUR 20.97/t
< 5% EUR 10.49/t
Note: VAT is not included. The tariff is paid on the total weight delivered by the producer.
Source: http://www.valorsul.pt/pt/clientes/quanto-custa-depositar-os-residuos-na-valorsul.aspx as of
20.02.12

16
The tariff for the treatment service provided by the WtE plant or for waste disposal at the
Mato da Cruz landfill31 is the same, but Valorsul charges different prices depending on whether
the client is a municipality or a private body, with the former benefiting from special rates. This
is particularly notable in the case of the price paid for the discharge of MSW to the landfill or
the WtE plant, which represents the main service delivered by Valorsul. In this case the
discharge tariff set for private bodies is more than double the tariff set for municipalities (EUR
53.84/t against EUR 22.31/t).
Besides the discharge tariff, Valorsul also charges a tariff for the destruction of MSW: this is an
additional service provided in special situations to governmental entities, mainly at the
incineration plant, when the products, mostly for legal or fiscal reasons, have to be destroyed
before being incinerated (e.g. apprehended counterfeit goods, drugs, special foods, etc.).
Table 1.5 VALORSUL TARIFFS FOR THE WTE PLANT AND LANDFILL
Type of Service Facility Municipalities Private bodies
Discharge of MSW WtE EUR 22.31/t EUR 53.84/t
Landfill EUR 25.70/t EUR 57.23/t
Destruction of MSW (fixed rate) WtE EUR 132.58/day EUR 136.03/day
Landfill EUR 132.58/day EUR 136.03/day
Destruction of MSW (variable rate) WtE EUR 135.46/t EUR 164.44/t
Landfill EUR 138.85/t EUR 169.83/t
Note: All rates shown include the waste management tax (Taxa de Gestão de Resíduos) and “aggravation” waste management tax (Agravamento TGR), which amount to EUR 1.11/tonne and EUR 0.23/tonne respectively for the WtE Plant, and EUR 4.15/tonne and EUR 0.58/tonne respectively for the Mato Da Cruz landfill. VAT is not included.
Source: Valorsul (http://www.valorsul.pt/pt/clientes/quanto-custa-depositar-os-residuos-na-
valorsul.aspx as of 20.02.2012)
Finally, the discharge of MSW at the drop-off centres is free both for municipalities and private
clients: this measure, which allows Valorsul’s clients to save on the costs of delivering the
waste to the landfill, the WtE Plant or the Anaerobic Digestion Plant, aims to promote the
recycling of materials.
These tariffs per se would not guarantee the financial sustainability of Valorsul waste
management system. Actually, operating costs are mostly covered by another source of
revenues, which is the sale of energy; tariffs are kept low enough to allow the firm to earn a
surplus, without pursuing profit maximisation32. No return is being earned on the element of
the investment that was funded by the EU. The main beneficiaries of such a tariff setting are
Valorsul’s municipalities, who have to pay a lower price than the opportunity cost of the
service, as further discussed in Section 3.2.
31
The sanitary landfill of Mato da Cruz accepts MSW sent by the municipalities and as well as private bodies, whilst the sanitary landfill do Oeste in Cadaval, previously managed by Resioeste and today managed by the ‘New Valorsul’, only accepts MSW from the municipalities. The tariff applied in both the landfills is the same. 32
Retained profits in the firm as of the end of 2009 were EUR 22 million.

17
The so-called European “polluter pays” principle, set in Directive 2004/35/EC and requiring the
producers of waste to bear the costs for its disposal, is not fulfilled by the project. Actually,
although the proportionality nature of Valorsul’s tariffs for unsorted waste (which are variable
according to the volume of waste produced) is in line with the notion of the “polluter pays”
principle, since it ensures that those who produce more waste pay a higher fee for their
disposal, the very low level of tariffs compared to the real cost of treatment and disposal
incurred by Valorsul does not ensure that all costs are actually covered by waste producers.
1.4 CURRENT PERFORMANCE
The volume of MSW processed by Valorsul over the last decade has increased, reflecting the
economic growth of Portugal in the same period, and in particular, the growth of Lisbon NUTS2
region. Today Valorsul processes in its facilities about 800,000 t of MSW per year (see Figure
1.5).
Figure 1.5 VALORSUL WASTE RECEPTION GROWTH (TONNES) – 1998-2010
Source: Authors’ elaboration based on data from Valorsul, 2009
The most significant increase in volume took place during the early years of Valorsul. In 1998,
when the company inaugurated its first modern landfill, it was processing 306 thousand
tonnes of MSW; one year later, the landfill was processing 430 thousand tonnes and the WtE
plant, which was going through its first test, treated another 225 thousand tonnes; in 2000,
the WtE Plant was officially inaugurated and processed 595 thousand tonnes, while the
volume of MSW disposed of to the landfill decreased to 112 thousand tonnes. In just three
years, Valorsul had increased its total treatment capacity by 139%, from 306 thousand to 731
thousand tonnes of MSW.
Over the intervening years, the company has continuously increased the volume of reception
and processing of MSW, whilst at the same time adding new facilities and services. In 2000 the
Material Recycling facility started operations, adding 22,987 t to the system; in 2005, the
Anaerobic Digestion Plant received 7,020 t in a testing phase; by 2007 this had risen to 27,858
200,000
300,000
400,000
500,000
600,000
700,000
800,000
900,000
18
t. In short, Valorsul has gone from processing 306,296 MSW t in 1998 to 817,032 t in 2009,
which represents an increase of 167% within a timeframe of 12 years.
The landfill and the WtE treatment plant outweigh the recycling facilities in terms of volume of
MSW processed, although the relative share of MSW processed by different types of facilities
has changed over time (Figure 1.6 and 1.7). In particular:
The volume of MSW sent to landfill has significantly decreased over the years, going from
306,297 t in 1998 to 137,449 t in 2009, a reduction of 55%. As a result, in 2009 the MSW
discharged to the landfill represented only 17% of all MSW processed by Valorsul, as
compared to 100% in 1998.
The WtE facility is the largest receiver of MSW. Leaving aside its test year, 1999, when
volumes processed where lower than those sent to the landfill, it has processed an
average of 561,940 t per year (2000-2009). In 2009, the MSW sent to the WtE plant
accounted for 72% of all MSW processed by Valorsul. The WtE plant, which quickly took
over significant volumes of waste previously sent to the landfill, has lost some share over
the years, partly due to the establishment of additional facilities (e.g. recycling and
compost production plants), and partly due to the current economic crisis, which has
contributed to reducing the generation of waste.
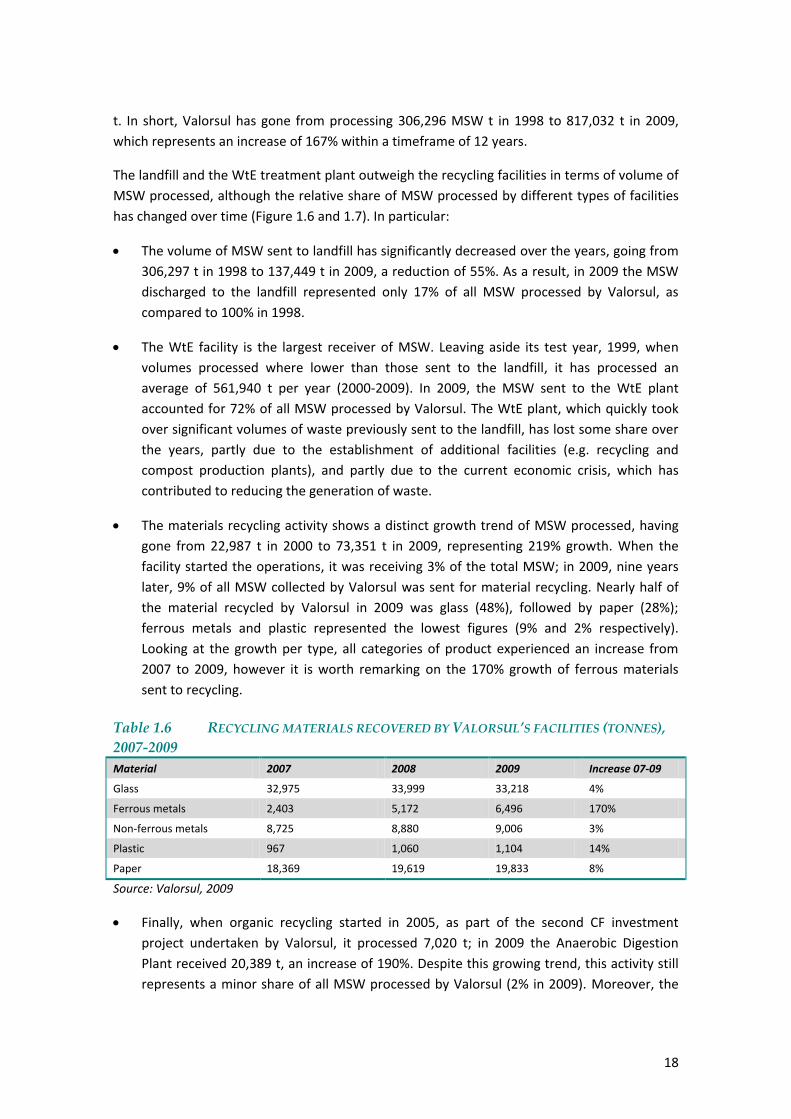
The materials recycling activity shows a distinct growth trend of MSW processed, having
gone from 22,987 t in 2000 to 73,351 t in 2009, representing 219% growth. When the
facility started the operations, it was receiving 3% of the total MSW; in 2009, nine years
later, 9% of all MSW collected by Valorsul was sent for material recycling. Nearly half of
the material recycled by Valorsul in 2009 was glass (48%), followed by paper (28%);
ferrous metals and plastic represented the lowest figures (9% and 2% respectively).
Looking at the growth per type, all categories of product experienced an increase from
2007 to 2009, however it is worth remarking on the 170% growth of ferrous materials
sent to recycling.
Table 1.6 RECYCLING MATERIALS RECOVERED BY VALORSUL’S FACILITIES (TONNES),
2007-2009
Material 2007 2008 2009 Increase 07-09
Glass 32,975 33,999 33,218 4%
Ferrous metals 2,403 5,172 6,496 170%
Non-ferrous metals 8,725 8,880 9,006 3%
Plastic 967 1,060 1,104 14%
Paper 18,369 19,619 19,833 8%
Source: Valorsul, 2009
Finally, when organic recycling started in 2005, as part of the second CF investment
project undertaken by Valorsul, it processed 7,020 t; in 2009 the Anaerobic Digestion
Plant received 20,389 t, an increase of 190%. Despite this growing trend, this activity still
represents a minor share of all MSW processed by Valorsul (2% in 2009). Moreover, the

19
quality of compost produced is not high enough to allow its utilisation as fertiliser (see
Sections 2.3 and 3.2).
Figure 1.6 PERFORMANCE OF VALORSUL IN WASTE PROCESSING OVER TIME
(TONNES)
Source: Authors’ elaboration based on data from Valorsul, 2009
Figure 1.7 SHARE OF MSW PROCESSING BY TYPE OF FACILITY AS A %AGE OF THE
TOTAL MSW PROCESSED BY VALORSUL - FROM START OF OPERATION
YEAR TO 2009
Note: Start of operation years: Landfill (1998); Waste-to-Energy (test 1999); Material recycling (2000); Organic recycling (2005).
Source: h ’ elaboration based on data from Valorsul, 2009
0
100,000
200,000
300,000
400,000
500,000
600,000
700,000
Landfill Waste-to-Energy Material recycling Organic recycling
ton
nes
1998 1999 2000 2001 2002 2003
2004 2005 2006 2007 2008 2009
17%
72%
9%
2%
100%
34%
3%
1%
Landfill
Waste-to-Energy
Material recycling
Organic recycling
Start year
2009

20
As a consequence of the economic crisis which has reduced consumption, in 2010 the total
volume of MSW processed by Valorsul decreased compared to the previous year, going from a
total of 817,302 t in 2009 to 777,243 t in 2010, which represents a 4.9% reduction.
The municipality of Lisbon is the largest client of Valorsul, as it delivers 39% of the total volume
of waste treated by the company, followed by Loures (21%); each of the other municipalities
delivers between 7% and 10% of the total, while the AMTRES group of municipalities
temporarily benefitting from Valorsul services (as explained in Section 1.2) accounts for 13%
(Figure 1.8).
Figure 1.8 ORIGIN OF MSW PROCESSED BY VALORSUL - 2009
(*) AMTRES is the association that represents the municipalities of Cascais, Mafra, Sintra and Oeiras
Source: h ’ f Valorsul, 2009
The recycling rates of waste amongst municipalities vary between 6% and 14%. The average
recycling rate in the Valorsul area of intervention (9%) is slightly above Portugal’s rate (8%),
although still far from the targets set by the European Union (24%), which are recalled in the
Box below. Hence, the project did not ensure compliance with EU Directive 2004/12/EC on
packaging and waste packaging, as discussed also in other Sections of this report.
Although a large share of organic waste is now diverted away from landfill, as required by
Directive 1999/31/EC on landfill management (see Box 2.1 for more details), the recycling
rates of organic waste are also very low, ranging between 0% and 2%.
The largest share of collected waste (between 84% and 94%) consists of unsegregated MSW,
sent either to the WtE plant or to landfill. As shown in Figure 1.9, Lisbon is the municipality
with the highest share of recycling and the lowest share of waste delivered to the incinerator
or landfill.
As far as private parties are concerned (both individuals and companies), only 1% of the total
waste delivered to Valorsul consists of materials (paper, glass, packaging and metals) to be
recycled; the share of organic waste collected from private parties, by contrast, is higher than
the average volume collected by municipalities (accounting for 27%), probably due to
Lisbon39%
Loures and Odivelas
21%
V.F. Xira7%
Amadora10%
Private parties
10%
AMTRES(*)13%

21
collection from restaurants, food-shops, hotels, etc. In any case, for this typology of clients,
unsegregated waste sent to the WtE Plant and to landfill also accounts for the largest share.
Figure 1.9 TYPE OF MSW COLLECTION BY CLIENT - 2009
(*) AMTRES is the association that represents the municipalities of Cascais, Mafra, Sintra and Oeiras
c : h ’ , 2009
Box 1.1 EU TARGETS ON THE RECOVERY AND RECYCLING OF PACKAGING
WASTE
The EU Directive 94/62/EC on packaging and packaging waste, amended by Directive 2004/12/EC, set specific targets for Member States on the recovery and recycling share of packaging waste. These are:
1. No later than 30 June 2001 between 50% as a minimum and 65% as a maximum by weight of packaging waste will be recovered or incinerated at waste incineration plants with energy recovery;
2. No later than 31 December 2008 60% as a minimum by weight of packaging waste will be recovered or incinerated at waste incineration plants with the energy recovery;
3. No later than 30 June 2001 between 25% as a minimum and 45% as a maximum by weight of the totality of packaging materials contained in packaging waste will be recycled with a minimum of 15% by weight for each packaging material;
4. No later than 31 December 2008 between 55% as a minimum and 80% as a maximum by weight of packaging will be recycled;
5. No later than 31 December 2008 the following minimum recycling targets for materials contained in packaging waste will be attained: 60% by weight for glass; 60% by weight for paper and board; 50% by weight for metals; 22.5% by weight for plastics, counting exclusively material that is recycled back into plastics; 15% by weight for wood.
Source: Authors based on Directive 94/62/EC
0%
10%
20%
30%
40%
50%
60%
70%
80%
90%
100%
Non-selective collection
Selective collection oforganic waste
Selective collection ofrecyclable waste(excluded the organicfraction)

22

23
2 ORIGIN AND HISTORY
2.1 CONTEXT AND LEGISLATIVE FRAMEWORK IN THE ENVIRONMENTAL
SECTOR
The OECD 2001 Environmental Report on Portugal highlights the significant growth in
Portugal’s economy by the early 1990s following structural changes in a number of sectors,
namely industry, agriculture, coastal urbanization and tourism: “I h 1990 , P g ’ GDP
increased by about 25% and its population by 1%. GDP per capita rose by 23%, but is still more
than 25% below the OECD average”. Its level of economic development has improved,
although it is still below the level of other Member States: in 2010, per capita Gross Domestic
Product (GDP)33 is 80% of the EU average, while in 1988 it was only 56%34 and in 1995, 76%. It
is worth pointing out, however, that the Lisbon region records a higher level of economic
development, even higher than the EU average (approximately 130% of the EU average).
Figure 2.1 TREND OF PER CAPITA GDP EXPRESSED IN PURCHASING POWER PARITY -
PORTUGAL AND EU (1995-2009)
Source: h ’ E
During the Nineties, Portugal was facing the challenge of balancing this economic progress
with social and environmental developments, in order to meet the standards set by EU policies
and legislation, in particular with regard to water supply, waste water treatment and solid
waste treatment.
33
In Purchasing Power Parity terms. 34 Direc ão Geral do Ambiente, 2000.
0
5,000
10,000
15,000
20,000
25,000
30,000
35,000
1995 1996 1997 1998 1999 2000 2001 2002 2003 2004 2005 2006 2007 2008 2009
European Union (27 countries) Portugal Greater Lisbon
24
Prior to 1993 the water and waste sectors in the country were managed in an unsustainable
way and Portugal had difficulties addressing the new challenges arising from entry to the EU35,
asking for strong reduction of land filled waste an increase of recycling rates (see Box 1.1).
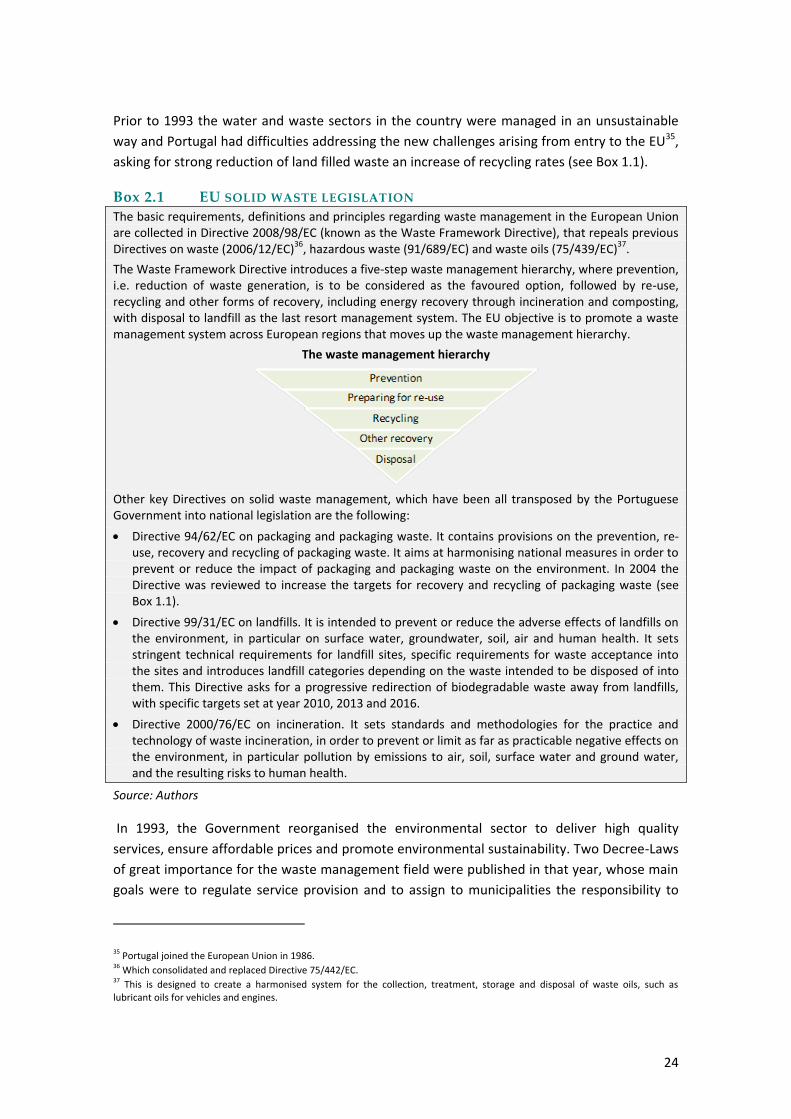
Box 2.1 EU SOLID WASTE LEGISLATION
The basic requirements, definitions and principles regarding waste management in the European Union are collected in Directive 2008/98/EC (known as the Waste Framework Directive), that repeals previous Directives on waste (2006/12/EC)36, hazardous waste (91/689/EC) and waste oils (75/439/EC)37.
The Waste Framework Directive introduces a five-step waste management hierarchy, where prevention, i.e. reduction of waste generation, is to be considered as the favoured option, followed by re-use, recycling and other forms of recovery, including energy recovery through incineration and composting, with disposal to landfill as the last resort management system. The EU objective is to promote a waste management system across European regions that moves up the waste management hierarchy.
The waste management hierarchy
Other key Directives on solid waste management, which have been all transposed by the Portuguese Government into national legislation are the following:
Directive 94/62/EC on packaging and packaging waste. It contains provisions on the prevention, re-use, recovery and recycling of packaging waste. It aims at harmonising national measures in order to prevent or reduce the impact of packaging and packaging waste on the environment. In 2004 the Directive was reviewed to increase the targets for recovery and recycling of packaging waste (see Box 1.1).
Directive 99/31/EC on landfills. It is intended to prevent or reduce the adverse effects of landfills on the environment, in particular on surface water, groundwater, soil, air and human health. It sets stringent technical requirements for landfill sites, specific requirements for waste acceptance into the sites and introduces landfill categories depending on the waste intended to be disposed of into them. This Directive asks for a progressive redirection of biodegradable waste away from landfills, with specific targets set at year 2010, 2013 and 2016.
Directive 2000/76/EC on incineration. It sets standards and methodologies for the practice and technology of waste incineration, in order to prevent or limit as far as practicable negative effects on the environment, in particular pollution by emissions to air, soil, surface water and ground water, and the resulting risks to human health.
Source: Authors
In 1993, the Government reorganised the environmental sector to deliver high quality
services, ensure affordable prices and promote environmental sustainability. Two Decree-Laws
of great importance for the waste management field were published in that year, whose main
goals were to regulate service provision and to assign to municipalities the responsibility to
35
Portugal joined the European Union in 1986. 36
Which consolidated and replaced Directive 75/442/EC. 37
This is designed to create a harmonised system for the collection, treatment, storage and disposal of waste oils, such as lubricant oils for vehicles and engines.

25
conduct waste management (both collection and treatment). This task can be carried out
either directly or indirectly, through the concession of such activities to private parties or
public associations of municipalities specialised in the operation of waste management
systems, or in partnership with the State38. Conditions have been laid down to allow shared
management of waste treatment issues between municipalities.
In the same year Águas de Portugal was established, a private-law company with public
shareholders whose main goal was to overcome the governance fragmentation characterising
the water supply, waste water and solid waste management sectors, by favouring the
development of multi-municipal systems39. By 2000, all Portuguese government-owned
environmental subsidiaries were integrated into the Águas de Portugal group. Within this
framework, the public company Empresa General de Fomento (EGF), a sub-holding company
of Águas de Portugal, became responsible for all activities aimed at guaranteeing proper waste
treatment, within a framework of environmental and economic sustainability.
By July 1995 the National Waste Plan was drafted, which set the groundwork for the
construction of future infrastructures necessary to implement the Strategic Plan for Municipal
Solid Waste 1997-2006 (PERSU), adopted on 13th November 1996. This Plan fostered most
waste management activities carried out in the national territory over the following years. It
was the first ever strategic document to be published establishing concrete targets to improve
the sector, including in terms of volume of waste to be disposed of and recycled. Besides
envisaging the construction of infrastructures for waste recovery and valorisation and the
implementation of separate collection systems for recyclable materials, the Plan identified
different types of MSW management systems: inter-municipal bodies (formed only by
municipalities), multi-municipal bodies (formed by State-owned companies and the
municipalities) and public-private companies40.
A new Plan (PERSU II) was approved in 2006 for the period 2007 to 2016. This builds on
previous MSW policies but also takes in the new and more ambitious requirements formulated
at national and EU level. In particular, it focuses on increasing the share of biodegradable
waste diverted away from landfill, and of packaging waste recycled (consistently with
Directives 99/31/EC and 94/62/EC). One of the actors which contributed to drafting this Plan
was the National Institute of Waste41, set up at the beginning of 1998. It is in charge of
developing planning tools in the waste field, bringing together inter-ministerial representatives
38
As it was for the municipalities in the metropolitan area of Northern Lisbon, which assigned the MSW management activities to Valorsul. 39
Up until then, there had been just one case of integration of operations for several administrative divisions. It was EPAL, the company that at the time supplied water to some 20 municipalities in the Greater Lisbon area, and is now integrated into AdP Group as one of its business units. 40
In particular, Decree-Law 294/94 of 16 November 1994 established that the operation and management of municipal systems could be performed directly by the respective municipalities and associations of municipalities, or alternatively, performed (through a concession) by public or private business, as well as associations of users. On the other hand, Decree-Law 58/98 of 18 August regulated the conditions under which the municipalities or associations of municipalities can create enterprises with equity. 41
Instituto Nacional de Residuos.

26
from the Ministries of Economy, Agriculture, Rural Development and Fisheries, Health and
Environment, and the National Association of Portuguese Municipalities.
A few months earlier another institution had been established: the Regulatory Institute of
Water and Waste (IRAR)42. It took on the role of regulatory authority for drinking water supply,
wastewater management and municipal waste management in Portugal. Since 2004, IRAR has
also taken on the responsibilities for drinking water quality control. In 2009 IRAR was
transformed into the Regulation Authority for Water and Waste Services (ERSAR)43: this
change was aimed at increasing the regulatory intervention scope to all operators of these
services, irrespective of the management model, and at standardising procedures with them.
The mission of ERSAR is to regulate drinking water supply services, wastewater management
services and municipal waste management services, with the objective of ensuring adequate
protection for consumers and users of water supply and waste services, avoiding possible
subsequent abuse of exclusive rights with regard to the guarantee and quality control of the
public service provided, on the one hand, and supervision and control of prices, on the other.
Along with the legislative and institutional developments, it has to be mentioned that public
awareness of environmental matters experienced a significant increase in the 1990s. The
number of environmental Non-Governmental Organisations (NGOs) operating in Portugal
steadily increased, from 42 in 1987 to 180 in 1997, nearly a 330% increase. By 1999, 3% of the
population was directly involved in environmental associations and 71% declared themselves
to be in favour of these activities. The areas of population most concerned with environmental
issues were mainly the largest metropolitan areas of Lisbon and Porto as well as the coast of
Portugal in zones such as the Algarve, i.e. where traffic growth, urban sprawl and tourism
development were perceived as the main causes for environmental concern.
Figure 2.2 NUMBER OF ENVIRONMENTAL NGOS IN PORTUGAL
c : D c G , 2000
42
Under Decree-Law no. 230/97, 30th
August. 43
Decree Law no. 277/2009, 2nd
October.
42
65
8698
105114
125
141152
163
180188
1987 1988 1989 1990 1991 1992 1993 1994 1995 1996 1997 1998

27
2.2 MSW TREATMENT PRIOR TO THE IMPLEMENTATION OF THE
VALORSUL PROJECT
Total production of MSW in Portugal has experienced a growing trend since 199044, rising by
an average of 3.5% per annum over the years 1990-1998 (see Figure 2.3). Treatment of MSW
in the early 1990s mainly relied on landfill disposal and, to a minor extent, on compost
production. A large share of waste (about 50%) was disposed of in illegal dumping grounds,
without receiving adequate treatment. Recycling was still largely under-developed: separate
collection was focused on paper and cardboard, with a recycling rate of approximately 40% of
total paper consumed. No incinerator plants were in operation to treat and valorise waste.
The PERSU 1997-2006 plan defined several lines of action for Portugal in the solid waste
management field, including:
the closure of all dumps by 2000;
the closure and rehabilitation of landfills with a view to their total eradication;
the carrying out of works and operations for the construction of infrastructures for
MSW treatment;
the support of collection and recycling services;
the reduction of MSW generation: a 2.5% reduction target was set for the period 1995
to 2000 and 5% for the period 2000 to 2005.
Starting from 1997 and in compliance with the PERSU, some efforts were made to seal dumps,
with a focus on the illegal ones, given their major negative impacts on the environment. Out of
the 340 dump sites identified in 1996, 45 had been closed by the end of 1998, but 180 were
still at the construction or awarding phases and 115 were active. As a result, the goal of closing
all dumps in Portugal by 2000 had not been achieved. In parallel, the use of sanitary landfills,
which was supposed to decrease, actually increased, given the lack of alternative treatment
routes. Also, a decrease in the percentage of waste used to produce compost was observed,
due to the very poor quality of compost produced, making it unusable in the agriculture sector.
44 Direc ão Geral do Ambiente, 2000.

28
Figure 2.3 TOTAL MSW PRODUCTION IN PORTUGAL (MILLION TONNES AND
ANNUAL PERCENTAGE VARIATIONS) – 1990-1998
c : D c G , 2000
Figure 2.4 FINAL DESTINATION OF MSW – 1994-1998
c : D c G , 2000
Moreover, recycling rates in Portugal were generally still far below targets for both municipal
and industrial waste and waste generation kept growing, even faster than GDP and private
consumption45.
From a narrower perspective, the situation in the Valorsul area of activity was very similar to
the national picture. In 1994, at the time of project inception, waste management in the
Greater Lisbon area relied upon two old landfills and one composting plant for the processing
of MSW. The landfills included the Vale do Forno in Lisbon, which, in addition to having run out
of capacity, did not have a proper artificial sealing at its bottom, and the Santa Iria de Azóia
landfill in Loures, which was close to its capacity limit. Recycling levels in the area were very
low. According to the European Investment Bank (EIB), less than 5% of waste collected was
recycled and composted and more than 95% was discharged into landfills without any kind of
45
OECD, 2001.
0
0.5
1
1.5
2
2.5
3
3.5
4
4.5
1990 1991 1992 1993 1994 1995 1996 1997 1998
+ 8.7%+ 7.4%
-8.6%
+2.8%+2.9%+9.4%
+2.7% +2.6%
0%
10%
20%
30%
40%
50%
60%
70%
80%
90%
100%
1994 1995 1996 1997 1998
Compost production
Sanitary landfills
Illegal dumping

29
treatment46. The only other municipal solid waste facility, the Solid Waste Treatment Station of
Beirolas, was located in Lisbon, and received non-differentiated collection of waste, producing
compost of low quality.
In 1992 the Portuguese Government submitted a proposal to host the 1998 Wold Exhibition
(Expo ‘98), which was eventually approved. A 100 hectare area in the Oriental Quarter of
Lisbon was selected for the future venue of the exhibition, i.e. where the Beirolas plant and
the obsolete landfill of Lisbon were located. In preparation for this event, the Government and
the State-owned company in charge of organising the Expo ‘98 (Parque Expo) decided to
“clean up” and reorganise this area. The aim was to reduce the heavy soil pollution caused by
the landfill and other industrial pollution sources and to improve the visual impact on the
landscape. As a result, the Government decided to decommission the existing waste treatment
plant and to provide the Greater Lisbon municipalities with more modern and adequate
facilities for waste management.
2.3 ESTABLISHMENT OF VALORSUL AND PROJECT IMPLEMENTATION
In response to the challenges presented in the previous Section, Valorsul was established in
199447 as the multi-municipal company responsible for waste treatment in the Northern
Lisbon metropolitan area, including the municipalities of Amadora, Lisbon, Loures and Vila
Franca de Xira. The company was fully publicly owned, with shares distributed as follows:
Society Expo '98 Park (26%), EGF – Empresa General de Fomento S.A.48 (25%), City Hall Lisbon
(20%), EDP - Energias de Portugal S.A. (11%), Loures City Council (10%), City of Amadora (4%)
and the Municipality of Vila Franca de Xira (4%).
Figure 2.5 VALORSUL SHAREHOLDERS IN 1994
Source: Authors
46
EIB, 1996. 47
Decree-Law 297/94, of 21 November. 48
Which is part of the AdP Group (see Section 2.1).
EDP Electricity of Portugal,
11%
Society EXPO'98 Park, 26%
EGF, 25%
Municipality of Lisbon, 20%
Municipality of Loures, 10%
Municipality of Vila Franca de
Xira, 4%
Municipality of Amadora, 4%

30
In 1995 the company signed a concession contract for 25 years with the Ministry for
Environment, Spatial Planning and Regional Development to become responsible for the
conception, construction and management of all necessary installations to recover or dispose
of MSW produced in the above mentioned municipalities.
In designing the new waste treatment infrastructures, Valorsul took into account the PERSU’s
goals. The investment major project “Multi-municipal System for Urban Solid Waste Treatment
for the Metropolitan Area of Northern Lisbon” included several initiatives: the construction of
a WtE plant and Bottom ash processing and recovery installation, a new sanitary landfill (Mato
da Cruz), the Materials Recovery Facility and the drop-off centre. In parallel, the project
involved sealing and rehabilitation of the Vale Forno and Sta Iria de Azoia dumps. In 1996
Valorsul obtained financing from the EU (through the Cohesion Fund49) and the European
Investment Bank. The construction of these facilities started in 1995 and was concluded by
2002.
The decision about where to locate the different infrastructures was strongly influenced by the
target municipalities: instead of concentrating the waste treatment activities in a single
complex, the municipalities pushed Valorsul to implement a decentralised management
system, building at least one facility in each of them. The main reason to have the four
facilities (landfill, incinerator plant, organic waste treatment plant and sorting plant) spread
over the four initial municipalities is due to the “NYMBY” (Non in my backyard) syndrome: at
that time, actually, nobody wanted a waste treatment plant in their area and the decentralised
management system was the only accepted solution by municipalities.
In the process of Environmental Impact Assessment, different sites were analysed as
alternatives but the current locations were considered the most suitable, according to the two
main criteria used, i.e. accessibility and sensitivity to air pollution50. In addition to that, the
selected areas presented further advantages, such as lower density of population51. As
anticipated in Section 1.1, the Loures and Lisbon municipalities were chosen as the location for
the WtE plant and sorting stations respectively, while the Bottom Ash Processing and Recovery
Installation and the Mato da Cruz landfill were located in Vila Franca de Xira.
Nearly a decade later, Valorsul was awarded another CF project52 for the construction of an
Anaerobic Digestion Plant in the municipality of Amadora. This ran its first tests in February
2005, but because of technical problems which were preventing it from properly functioning, it
had to be stopped. In the following two years all the problems were solved and the plant could
be formally inaugurated only in 2008.
49
CF Project 95/10/61/026. 50
http://www.citidep.pt/ims/EIA/CII2.html. 51
http://www.citidep.pt/ims/EIA/CI1.html. 52
1999/PT/16/C/PE/005.

31
Box 2.2 MILESTONES IN THE DEVELOPMENT OF VALORSUL INTEGRATED
WASTE MANAGEMENT SYSTEM
1994 – Establishment of Valorsul
1995 – Signature of a 25-year contract concession with the Ministry for Environment
– Directors approve the Plan for an Integrated Management of Municipal Solid Waste (POGIRSU)
1996 – Valorsul is awarded CF Project 95/10/61/026 ‘Multi-municipal System for Urban Solid Waste Treatment for the Metropolitan Area of Northern Lisbon’
1998 – Inauguration of Mato da Cruz landfill
2000 – Inauguration of the WtE Plant for the incineration of MSW with energy recovery
– Inauguration of Sta Iria de Azóia park (a former uncontrolled dump)
2002 – Inauguration of the Materials Recovery Facility MRF and drop-off centre in Lumiar (Lisbon)
2003 – Acceptance of MSW produced in Cascais, Mafra, Oeiras and Sintra53
2005 – Valorsul is awarded CF Project 1999/P T/16/C/PE/005 ‘Anaerobic Digestion Plant
– Initial tests of the Anaerobic Digestion Plant
2007 – Approval of the new Environmental, Safety and Quality Policy
– Awarded the ‘Prize to Water and Waste Management Quality of Service’ by ERSAR
2008 – Inauguration of the Anaerobic Digestion Plant
2010 – Merger with Resioeste to establish a ‘new’ Valorsul
Source: Authors
Besides building the infrastructures, Valorsul has played an active role in raising awareness on
environmental matters, particularly on waste treatment, amongst the wider public of Greater
Lisbon Area. In a way, this was imposed by the initial situation during the early years of the
company when it had to face some opposition to the construction of the incinerator from
various NGOs and communities living near the planned site. In response, Valorsul took a
leadership role in involving and informing all stakeholders affected by the project. The
approach taken resulted in significant levels of public participation in Valorsul decision process
– particularly among two groups, namely, local citizens and environmental NGOs54.
From these early days, Valorsul has continued involving, communicating and raising awareness
on waste management at two levels:
at institutional level, through cooperation with external bodies involved in public
health and environmental issues55 (see Section 3.5 on environmental effects);
at a wider public level, in the context of its Corporate Social Responsibility (CSR) policy,
through a large number of initiatives, such as communication campaigns to encourage
the population to separate their waste and collaboration with schools to promote
53
Ministerial Law Nº 16104/2003, of 29 July. 54
It is worth adding that, since 2004, with the aim of becoming more transparent and closer to its stakeholders, Valorsul publishes an annual sustainability report based on the Global Reporting Initiative guidelines. 55
Such as the Institute of Environment and Development (Instituto do Ambiente e Desenvolvimento - IDAD), the Hydrographic Institute, The Oceanographic Institute, the Laboratory dBLab, the Institute of Preventive Medicine of the University of Lisbon and the Centre for social research and intervention.
32
environmentally-conscious behaviour amongst youngsters (via the ‘Ecovalor’
programme).
Moreover, Valorsul promoted initiatives aimed at increasing recycling rates. These include the
Ecovia project, which fostered the recycling of special types of materials, normally submitted
for energetic valorisation or dumped to landfills (see Box 2.3).
Box 2.3 THE PROJECT ECOVIA – ECOLOGICAL ROAD
The project Ecovia - Ecological Road was funded by the EU LIFE Environment Programme56 (LIFE ENV/P/000366 05) and led by Brisa, Auto-Estradas de Portugal S.A., in partnership with many actors, including Valorsul57. The project was developed over 42 months during the period 2005-2009 and had a total budget of about EUR 1,24 million, EUR 617,727 of which financed by the EU58.
The main goal of the project was to contribute to the recycling of particular materials, i.e. mixed plastic, rubber and beverage cardboard. Through a special technology (the “ART Technology”) based on a process that permits mixtures of plastics incorporating a high level of ingredients, these materials were used to manufacture new products for road safety purposes, such as rails, acoustic barriers, rumble strips, road signs, road dividers and other roads-related articles.
The main outcomes of the project were:
434 fencing posts: these were installed along the entire road network, replacing the old wooden posts, used to demarcate the highway and block access to animals and people;
10 pathways or passages for telematics sites: these had the objective to facilitate the access to telematics sites for the maintenance tasks of technicians.
15 kerb protectors: these were installed in all concrete pavings just below the entrance to highways tolls so that the door of the vehicles were protected when stopped at toll gates, in case of unexpected opening.
Furthermore, the project raised awareness on the environment and the need for selective collection and recycling among the public. The communication and awareness raising side of the project was achieved through the building of a green mile of motorway near Lisbon (the "green stretch"), within which all building material and infrastructure were made of recycled substances.
Whilst pursuing these goals, the project covered the following fields:
a. Collection, sorting, treatment and preparation of the materials to be used in the manufacturing of new products;
b. Manufacturing of the new products, performance of tests and product certification to ensure a safe use and installation;
c. Creation of the “green stretch”, where the products made from recycled material were placed;
d. Feasibility studies on the new products and drawing up of technical documentation on the properties of the products, their performance in real scenario and production process;
e. Public awareness campaigns to increase recycling and the potential of using products made from recycled material.
The Ecovia project demonstrated the feasibility of using recycled products in road sector and the possibility of increasing recycling rates. In total, 5,900 kg of recycled materials that would have been otherwise land-filled or incinerated were used. The project promoter believes that Ecovia is very replicable to other regions of the EU.
56
LIFE is the EU’s financial instrument supporting environmental and nature conservation projects throughout the EU since 1992 (http://ec.europa.eu/environment/life/). 57
Other actors involved were the Association of manufacturers of cardboard for liquids and food, the Portuguese Environmental Agency, the Portuguese Association for the Defence of Consumers, Plastval S.A., Sociedade Ponto Verde S.A., Tratolixo S.A. and Valorpneu Lta. 58
In current prices.

33
Source: Authors based on http://ec.europa.eu/environment/life/project/Projects/index.cfm?fuseaction=search.dspPage&n_proj_id=2827&docType=pdf, http://www.ecovia.brisa.pt/uk/ and http://ec.europa.eu/environment/life/project/Projects/index.cfm?fuseaction=home.showFile&rep=file&fil=LIFE05_ENV_P_000366_LAYMAN.pdf
When the Anaerobic Digestion Plant was opened, some efforts were made by Valorsul to raise
awareness in the area of composting. The Programme ‘+ Valor’ was launched in 200559. It
attempted to bringing behavioural changes among restaurants, markets and canteens of
Greater Lisbon Area with regard to organic waste separation. The final goal was to obtain a
proper quality of separated organic waste, collected and ultimately sent to the Anaerobic
Digestion Plant. Actually, it is worth mentioning that only if the improper fraction contained in
the organic waste is very low it is possible to produce compost of high quality for use in the
agricultural market. The compost produced by the Anaerobic Digestion Plant, which was
assigned the name "RICATERRA"60 was primarily intended to be used as organic fertiliser for
the improvement of the physical, chemical and biological features of the soil, and
consequently contribute to a greener production in the agriculture sector.
However, this campaign failed to bring the expected behavioural change among waste
producers: the organic waste sorting is still very poor and the quality of RICATERRA is very low,
so that Valorsul finds difficult to put it onto the market. Thus it was decided to give compost61
away to some employees and Valorsul would use the rest for landscaping works at its premises
and for maintenance of municipal gardens62.
The bad quality of organic waste sorting is confirmed by the figures of the organic fraction
incinerated in the WTE plant: in principle, the AD plant should have diverted the organic
fraction of waste away from the WtE plant. Instead, the share of organic waste received at the
incinerator plant remained unchanged in the last years, even after the AD plant started
operations (ranging between 45% and 52% over the period 2002-2011).
2.4 SUBSEQUENT DEVELOPMENTS
Since its establishment, Valorsul has been continuously growing both in terms of new services
and infrastructures, as well as areas of activity. Since 2003 Valorsul has been temporarily
delivering its services to the association of municipalities AMTRES, representing the towns of
Cascais, Mafra, Oeiras and Sintra. Tratolixo63 is the public company responsible for waste
management in the area of AMTRES. In compliance with the Ministerial Law N. 16104/2003,
Valorsul WtE plant agreed to receive undifferentiated and untreated MSW from the AMTRES
municipalities to deal with the decreasing capacity at Tratolixo's landfill, until a permanent
59
The Programme was launched by Valorsul but after 5 years, the responsibility was transferred to the municipality of Lisbon. Nevertheless, Valorsul is still part of the Programme, offering the necessary help (technical and communication assistance) to the municipalities involved. 60
The RICATERRA name is registered at the National Institute of Industrial Property. 61
130 tonnes in 2009. 62
Source: Valorsul, 2009. 63
Tratolixo - Tratamento de Resíduos Sólidos, EIM, S.A. (http://www.tratolixo.pt/).

34
solution was found. According to Valorsul Sustainability Report 2010, Tratolixo is now building
new waste treatment facilities (an Anaerobic Digestion plan, three support Technical
Confinement Cells and an Ecocentre) to treat its waste, which are expected to be completed
by 2012. Hence, Tratolixo is expected to progressively cease delivering waste to Valorsul
facilities.
The major enlargement experienced by Valorsul took place in July 201064 and consists of the
merger between Valorsul and Resioeste. Resioeste is the multi-municipal system created in
199765 and responsible for the waste management of the municipalities in the West region of
Lisbon. Its system integrates the association of municipalities AMO-MAIS, including 14
municipalities – Alcobaça, Alenquer, Arruda dos Vinhos, Azambuja, Bombarral, Cadaval, Caldas
da Rainha, Lourinhã, Nazaré, Óbidos, Peniche, Rio Maior, Sobral de Monte Agraço e Torres
Vedras – with a total population of 403,000 inhabitants. They are distributed over three sub-
regions: Greater Lisbon, Leiria and Santerém. In 2008 Resioeste treated 198,000 tonnes of
waste. The Resioeste system includes a number of infrastructures: these are a sanitary landfill
and a sorting plant in Cadaval, a Mechanical Biological Treatment (MBT) plant in Leiria,
producing compost and five transfer stations.
In recent years, Valorsul has experienced a decrease of volumes of waste delivered at the WtE
plant, due to the economic slowdown in Portugal and, to a lesser extent, to an increasing
diversion of waste to other facilities for MSW treatment (e.g. recycling units and the bio-waste
plant). This had an immediate impact in the form of lower incomes coming from the sale of the
electricity generated by the WtE plant, the major source of revenues for Valorsul. The merger
with Resioeste was seen as an opportunity to increase the volumes of waste incinerated and
valorised through energy recovery and thus to run the WtE plant at full capacity, by processing
part of the MSW of the municipalities of Resioeste.
Upon the merger, a ‘new’ Valorsul was born, with a joint capital of EUR 25.2 million. It is now
responsible for treating the MSW produced by 1.5 million citizens in 19 municipalities covering
3,378 km2: the MSW volume generated amounts to almost 1 million tonnes per year, which
corresponds to 20% of all MSW produced in Portugal66.
A last development in the Valorsul waste management system that is worth mentioning
regards the Mato da Cruz landfill. As stated in Section 1.1, in compliance with EU Directive
99/31/EC on the landfill of waste, biogas (composed of methane and carbon dioxide)
generated by Valorsul landfill67 is collected and flared, so as to reduce the volume of gas
actually emitted in the atmosphere68. Valorsul has recently installed the technology to allow
for the production of electric energy from burning the biogas, which was not originally
envisaged, and in 2011 it actually commenced producing energy from its landfill.
64
Decree-Law 68/2010 June 15th
. 65
Decree-Law 366/97 December 20th
. 66
A percentage increase of +4% compared to the situation prior to the merger (see Section 1.2). 67
The anaerobic decomposition of biodegradable waste in a landfill generates gas, which is composed of methane (for about 55%) and CO2 (for about 45%). 68
In the combustion process methane is oxidised to water and CO2.
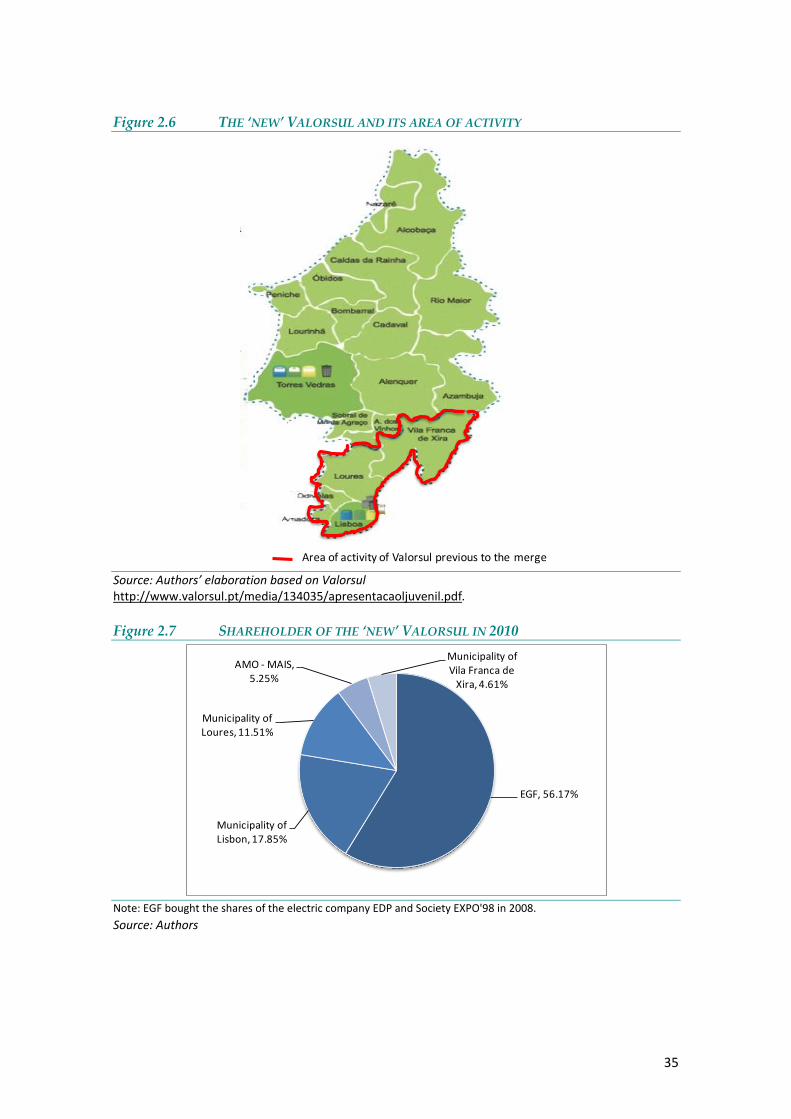
35
Figure 2.6 THE ‘NEW’ VALORSUL AND ITS AREA OF ACTIVITY
Source: h ’ based on Valorsul http://www.valorsul.pt/media/134035/apresentacaoljuvenil.pdf.
Figure 2.7 SHAREHOLDER OF THE ‘NEW’ VALORSUL IN 2010
Note: EGF bought the shares of the electric company EDP and Society EXPO'98 in 2008.
Source: Authors
Area of activity of Valorsul previous to the merge
EGF, 56.17%
Municipality of Lisbon, 17.85%
Municipality of Loures, 11.51%
AMO - MAIS, 5.25%
Municipality of Vila Franca de
Xira, 4.61%

36
Table 2.1 MUNICIPALITIES INCORPORATED IN THE ‘NEW’ VALORSUL AND WASTE
PRODUCTION
NUTS 3 sub-region Municipality Waste production in 2010 (Tonnes)
Valorsul Greater Lisbon Amadora 83,564
Greater Lisbon Lisbon 314,873
Greater Lisbon Loures / Odivelas 159,778
Greater Lisbon V.F. Xira 59,061
Total Valorsul area 1 sub-region 5 municipalities 617,276
Resioeste Greater Lisbon Alenquer 19,521
Greater Lisbon Arruda 5,324
Greater Lisbon Azambuja 11,589
Greater Lisbon Cadaval 6,245
Greater Lisbon Lourinha 11,668
Greater Lisbon Sobral M. Agraçco 4,311
Greater Lisbon Torres Vedras 37,374
Leiria Alcobaça 24,891
Leiria Bombarrant 6,708
Leiria Caldas Rainha 24,309
Leiria Nazaré 10,974
Leiria Óbidos 6,472
Leiria Peniche 19,014
Santerém Rio Maior 9,277
Total Resioeste area 3 sub-regions 14 municipalities 197,677
Total ‘New’ Valorsul 3 sub-regions 19 municipalities 814,953
Source: Authors based on Valorsul http://www.valorsul.pt/media/134035/apresentacaoljuvenil.pdf
2.5 KEY STAKEHOLDERS AND MANAGEMENT STRUCTURES
Within Valorsul’s system, all services and facilities are structured in such a way as to provide a
wide range of waste processing activities, in which suppliers and final users are linked through
Valorsul’s integrated approach. The main suppliers to the system are the population, the
municipalities and companies in Valorsul's catchment area, which deliver their waste for
processing. The users of the system are the population from Valorsul's surroundings, the
customers for recyclable products or compost or energy, as well as other actors involved in the
activities of Valorsul, such as visitors, students, the Scientific Community69 and NGOs.
At a broader level, the Portuguese waste sector encompasses diverse entities that, in various
ways, have responsibility for the regulation and planning of the sector and played a role in the
Valorsul project. They are briefly presented in this sub-section.
69
As explained in Section 3.5, a number of institutions operating in the environmental sector have been involved in the Environmental Monitoring Programme, such as the Institute of Environment and Development, the Oceanographic Institute and the Centre for Social Research and Intervention.
37
The Directorate General of Regional Development of the Ministry of Planning and
Territorial Administration holds the managing authority role and is responsible for
liaison with the European Commission with regard to the implementation and status
of projects. It was the body responsible for submitting the Valorsul project for funding
under the CF instrument in 1994. The Directorate ensured proper monitoring of the EU
assistance in Portugal by means of bi-annual meetings of a Monitoring Committee,
supervising both transport and environmental projects. From 2000 onwards, the
general Monitoring Committee was complemented by a specific Committee for solid
waste projects. In 2007 the DGDR became the Financial Institute for Regional
Development (IFDR) operating under the supervision of the Ministry of Economy and
Employment.
The Directorate-General of Treasury and Finance of the Ministry of Finance, acted as
the payment authority of the project, whilst financial control was the responsibility of
the General Inspectorate of Finance.
The Regulatory Authority for Water and Waste Services (ERSAR)70 provides national
guidance and regulation with regard to the activities of public water supply, urban
wastewater sanitation and management of municipal solid waste utilities, to ensure
universal access, quality of service and equitable prices (also see Section 2.1). ERSAR
aims to ensure the quality of the services rendered by drinking water supply systems,
urban wastewater and municipal waste, supervising the creation, execution,
management and operation of the systems, as well as to guarantee stability within the
sector and the financial sustainability of these systems. As “regulatory authority”
ERSAR deals with approximately 500 water and waste management operators,
including Valorsul71.
The Portuguese Environmental Agency is the National Authority for Waste. It is in
charge of proposing, developing and monitoring the implementation of strategies for
waste management, as well as issuing licences to waste management operations, and
providing administrative and operational controls. Moreover, the Agency regulates the
market for recyclable waste72.
During the construction of the WtE Plant, Valorsul set up a dedicated committee
responsible for monitoring the various economic, financial, and technical aspects.
Quarterly reports were submitted in conjunction with the Ministry of Environment,
reporting the status of physical progress and financial accomplishment.
While Valorsul was responsible for the management – and subsequent operation - of
the project, during the construction phase the company’s permanent staff received
assistance from Proet - Projectos, Engenharia e Tecnologia, the engineering branch of
70
Entidade Reguladora dos Serviços de Águas e Resíduos. 71
Source: ERSAR, 2011. 72
http://www.apambiente.pt/apresentacao/apaENG/Paginas/default.aspx
38
EDP. Proet also participated in the preparation of tender documents. Use was made of
additional specialised experts as needed73.
Sociedade Ponto Verde S.A. is a private non-profit-making organisation that was set up
in November 1996 to promote the separate collection and recycling of packaging
waste in Portugal. Since 2000, Sociedade Ponto Verde collaborates with Valorsul and
provides support by means of separate collection and non-reusable packaging waste
sorting programmes; it guarantees the take-back, recovery and recycling of sorted
waste under its contracts with manufacturers of packaging and packaging waste
(paper and cardboard, glass, plastic, wood, and steel and aluminium). It also manages
and deals with the final disposal of non-reusable packaging placed on the Portuguese
market by packers, fillers and importers, after consumption. More information about
this actor are provided in Box 2.3.
Box 2.4 FOCUS ON SOCIEDADE PONTE VERDE
According to EU legislation (Directive 94/62/EC) transposed into Portuguese law, economic operators placing packaging on the market are responsible for the management and final disposal of packaging waste. However, this responsibility can be transferred to a properly licensed entity, i.e. Sociedade Ponto Verde. In 2009, Sociedade Ponto Verde reached around 99% of Portugal’s population.
The mission of Sociedade Ponto Verde is to promote the selective collection, take back and recycling of waste packaging in Portugal through the integrated packaging waste management system (SIGRE).
Sociedade Ponto Verde is licensed to manage all types of non-reusable packaging materials placed on the Portuguese market and articulates with the business operators indicated below in the management of their waste:
Fillers, packers and/or entities responsible for placing packaged products on the Portuguese market;
Manufacturers of packaging and raw materials for the production of packaging;
Packaging waste managers;
Municipalities and/or managers of multi-municipal or inter-municipal systems74 (e.g. Valorsul).
Household packaging waste that comes from selective collection (i.e. recycling drop-off-containers, door-to-door collection and/or Valorsul drop-off centres) is directly taken back and put it onto the market by Sociedade Ponto Verde. The municipal and multi-municipal systems (e.g. Valorsul) receive the corresponding financial compensation for each tonne of packaging waste material collected.
Regarding recycling materials from complementary flows (e.g. pre-treatment of compost and incineration), these are sold directly by the municipal systems or their concessionaires (e.g. Valorsul).
Source: Authors based on Sociedade Ponto Verde, 2009
73
EIB, 1996. 74
In 2009, Sociedade Ponto Verde proceeded with previously existing partnerships with Municipal systems (SMAUT) which allowed it to reach around 99% of Portugal’s population

39
3 LONG-TERM DEVELOPMENT
EFFECTS
3.1 KEY FINDINGS
This Section describes the main long-term development effects generated by the project. In
accordance with the guidance set out in the First Interim Report and summarised in Annex I of
this report, seven categories of effects are considered and for each of them an assessment of
the contribution of the project to that specific effect is given. For the most relevant effects,
either positive or negative, descriptions of the timing of their materialisation and evolution are
presented. The seven categories of effects are: Direct economic growth, Endogenous
dynamics, Social cohesion, Environmental effects, Territorial cohesion, Institutional quality and
Social happiness.
These categories are analysed using two broad methodological approaches – quantitative (i.e.
Cost-Benefit Analysis) and qualitative. The nature and strength of the long-term impacts of the
investment across the above categories are analysed, as well as the degree to which short-
term as well as long-term impacts arise (see Table 3.1). The criteria considered to assign the
scores shown by the following Tables are presented in Annex I.
In broad terms, the direct economic impact is identified quantitatively in the CBA, while the
other categories are largely identified qualitatively. However, elements of these other
categories, in particular environmental aspects, are captured to some extent in the
quantitative analysis too.
The main impact generated by the project is on environment, thanks to the closure of all illegal
landfills and to the provision of a modern and effective waste management system. Due to the
nature of the initiative, the environmental effects were noticeable from the very early days of
the project. In year two of the project, the first modern sanitary landfill in the Lisbon region
was inaugurated, to replace the old open dumps in the area; two years later, the WtE plant
started working. Around the WtE plant, additional facilities and services have been growing
over the years, offering complementary waste treatment solutions that have had a positive
impact on the environment (i.e. separate collection, recycling facilities, drop-off centres, etc.).
The bad quality of recyclable waste separation carried out by households, however, prevented
from maximising this effect, by limiting the total volume of materials actually recycled.
In the long-term, the project has contributed to direct economic growth in different ways:
By contributing to the production of energy;

40
By effectively carrying out waste management and treatment services for about 1.2
million inhabitants75;
By contributing to the development of the recycling market, through the sale of
recyclable materials collected;
By generating employment in the catchment area: this economic benefit is reflected in
the ex-post CBA through the use of a conversion factor of less than one for labour cost,
to reflect its cost.
Impacts on economic growth could have been higher under a number of conditions presented
in Section 3.2. Among these, higher revenues could have been generated if the compost
produced at the Anaerobic Digestion Plant could have been put onto the market; instead,
because of its poor quality, people are reluctant to use it as fertiliser. Moreover, the decision
to not concentrate the various facilities of Valorsul into one single area (mainly due to political
interests, as explained in Section 2.3) has a negative impact in terms of transportation costs
and higher quantities of emissions produced.
These benefits have been quantified in the CBA, as set out in detail in Annex II. On a financial
basis, the project generates a Net Present Value of EUR -122 million (net of EU aid, it generates
a positive financial return on national capital of EUR 148 million). On a socio-economic basis,
the project has a slightly negative return over a 30 year timeframe76, with an economic Net
Present Value of EUR -44 million and a rate of return of +3.2%. However, when these results
are compared to the counterfactual scenario, consisting in disposing of all waste to a
controlled landfill without energy recovery, the project generates a net positive return for
society, of approximately EUR 135 million (the economic internal rate of return is 5.9%).
The project had a positive effect in the endogenous dynamics of capacity building and
technological progress acquired thanks to the expertise 'imported' from other countries for
some phases of the project. It also contributed to the implementation and testing of the multi-
municipal management system proposed in PERSU.
As far as social cohesion is concerned, this was defined in the First Interim Report of this
evaluation study as the capacity to reduce inequalities arising across gender and different
socio-economic groups, as well as reducing income and welfare inequality for less well-off
groups. Since the project was not particularly focused on specific social groups, but brought an
equal quality of services and economic opportunities to all sectors of the catchment
population, no effect on social cohesion is recorded.
In terms of territorial cohesion, the project has had some influence in reducing welfare
disparities in the metropolitan area of Lisbon: the differences, for example, between the
capital city of Lisbon and the rest of the areas were quite clear before and after the project.
75
If the AMTRES municipalities are considered, the total population served by Valorsul reaches almost 2 million. 76
The effects of the increased volume of MSW to be treated by Valorsul’s facilities as a consequence of the merger with Resioeste have been taken into account in the analysis.
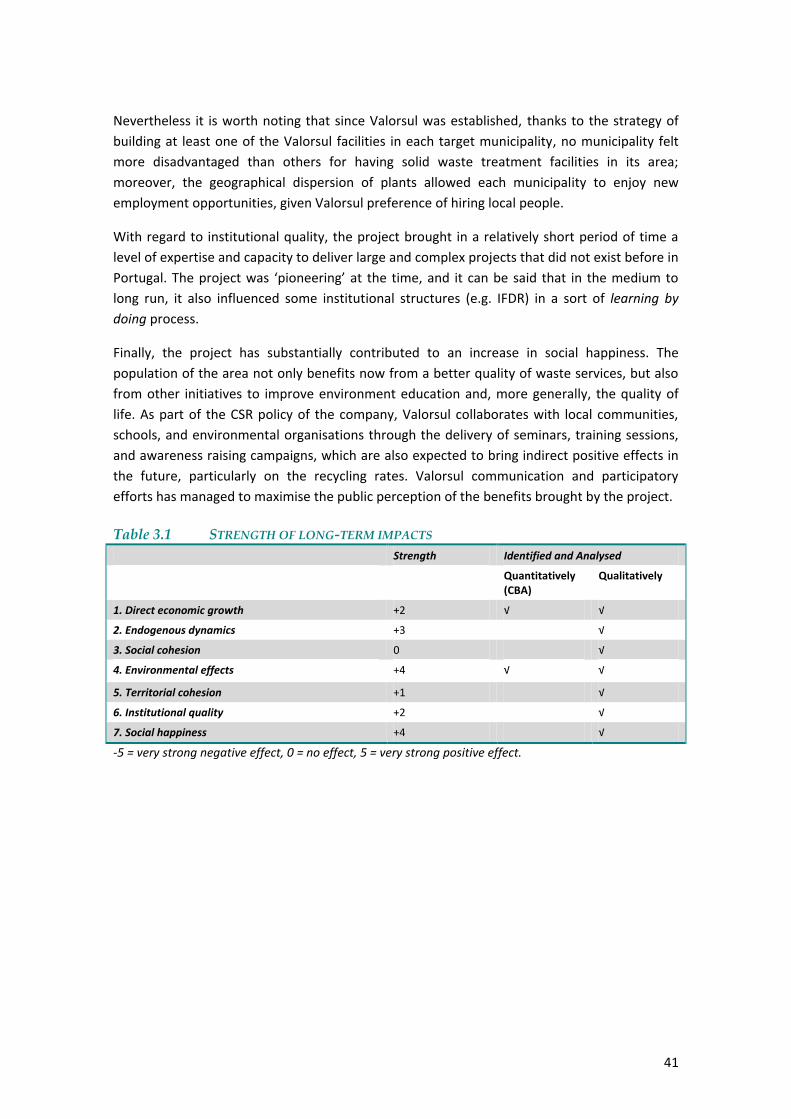
41
Nevertheless it is worth noting that since Valorsul was established, thanks to the strategy of
building at least one of the Valorsul facilities in each target municipality, no municipality felt
more disadvantaged than others for having solid waste treatment facilities in its area;
moreover, the geographical dispersion of plants allowed each municipality to enjoy new
employment opportunities, given Valorsul preference of hiring local people.
With regard to institutional quality, the project brought in a relatively short period of time a
level of expertise and capacity to deliver large and complex projects that did not exist before in
Portugal. The project was ‘pioneering’ at the time, and it can be said that in the medium to
long run, it also influenced some institutional structures (e.g. IFDR) in a sort of learning by
doing process.
Finally, the project has substantially contributed to an increase in social happiness. The
population of the area not only benefits now from a better quality of waste services, but also
from other initiatives to improve environment education and, more generally, the quality of
life. As part of the CSR policy of the company, Valorsul collaborates with local communities,
schools, and environmental organisations through the delivery of seminars, training sessions,
and awareness raising campaigns, which are also expected to bring indirect positive effects in
the future, particularly on the recycling rates. Valorsul communication and participatory
efforts has managed to maximise the public perception of the benefits brought by the project.
Table 3.1 STRENGTH OF LONG-TERM IMPACTS
Strength Identified and Analysed
Quantitatively (CBA)
Qualitatively
1. Direct economic growth +2 √ √
2. Endogenous dynamics +3 √
3. Social cohesion 0 √
4. Environmental effects +4 √ √
5. Territorial cohesion +1 √
6. Institutional quality +2 √
7. Social happiness +4 √
-5 = very strong negative effect, 0 = no effect, 5 = very strong positive effect.

42
Table 3.2 EVOLUTION OF THE EFFECTS
Evolution of Impacts Comment
Short run
(years 1-6)
Long run
(years 6-10)
Future years
1. Direct economic growth
+ ++ +++ Effects on economic growth have increased as new facilities and services were offered by Valorsul.
2. Endogenous dynamics
+ ++ ++ Learning by doing process favouring institutional quality.
3. Social cohesion
4. Environmental effects
+ ++ +++ Large benefits produced since the short-term with the opening of the new controlled landfill and WtE plant. Environmental quality increased after the construction of additional facilities for waste management, particularly the recycling centre. The positive impact on environment could further improve via the increase of the recyclable rates.
5. Territorial cohesion
+ + + Reduction of disparities between Lisbon and the peripheral municipalities thanks to the provision of an integrated service and to the distribution of employment opportunities.
6. Institutional quality
+ ++ ++ Improvement of institutional capacities in the medium term.
7. Social happiness
+/- + + In the short term Valorsul experienced some opposition from civil society, which, although being in favour of finding a sustainable solution for waste management, was against the incineration technology. Awareness campaigns and high involvement of stakeholders facilitated an improvement in perceptions of the project’s benefits, with a positive impact on social happiness.
+ = slightly positive, ++ = positive, +++ = strongly positive, +/- = mixed effect
3.2 DIRECT ECONOMIC GROWTH
Whilst the main rationale behind the establishment of Valorsul and the construction of its
different treatment plants was to tackle the waste problem in the metropolitan area of
Northern Lisbon, the project was designed in such a way that it has transformed a problem
into an opportunity for making business (via the selling of electricity to the national grid and
other products, such as recyclable materials to industry and compost to the agriculture sector)
and contributing to the economic growth of the target municipalities.
The Valorsul project has contributed to direct economic growth in several areas. The main
beneficiaries include the construction firms that built the infrastructures; the residents,
businesses and municipalities of the Greater Lisbon Area, who now enjoy a proper and
integrated MSW management system, as well as having the old illegal dumps closed down and
converted to public amenities; the Portuguese recycling sector, which is supplied with
recyclable materials by Valorsul; the Portuguese national electricity grid, which is supplied with
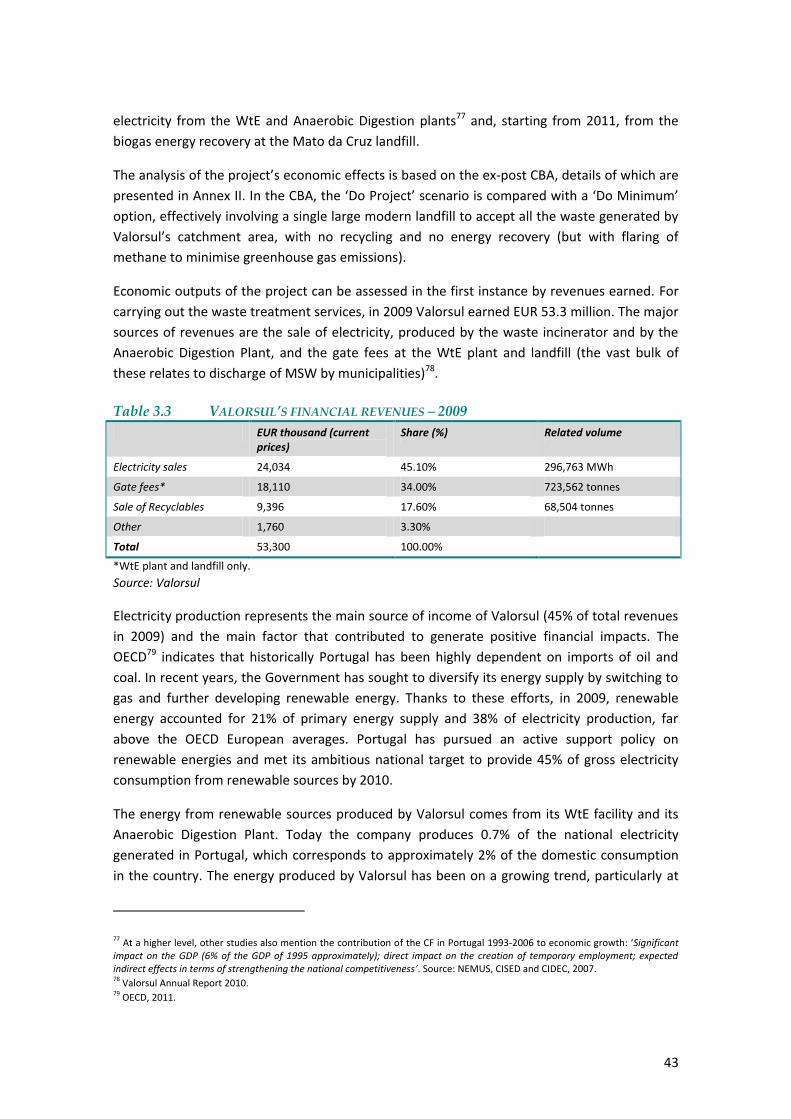
43
electricity from the WtE and Anaerobic Digestion plants77 and, starting from 2011, from the
biogas energy recovery at the Mato da Cruz landfill.
The analysis of the project’s economic effects is based on the ex-post CBA, details of which are
presented in Annex II. In the CBA, the ‘Do Project’ scenario is compared with a ‘Do Minimum’
option, effectively involving a single large modern landfill to accept all the waste generated by
Valorsul’s catchment area, with no recycling and no energy recovery (but with flaring of
methane to minimise greenhouse gas emissions).
Economic outputs of the project can be assessed in the first instance by revenues earned. For
carrying out the waste treatment services, in 2009 Valorsul earned EUR 53.3 million. The major
sources of revenues are the sale of electricity, produced by the waste incinerator and by the
Anaerobic Digestion Plant, and the gate fees at the WtE plant and landfill (the vast bulk of
these relates to discharge of MSW by municipalities)78.
Table 3.3 VALORSUL’S FINANCIAL REVENUES – 2009
EUR thousand (current prices)
Share (%) Related volume
Electricity sales 24,034 45.10% 296,763 MWh
Gate fees* 18,110 34.00% 723,562 tonnes
Sale of Recyclables 9,396 17.60% 68,504 tonnes
Other 1,760 3.30%
Total 53,300 100.00%
*WtE plant and landfill only.
Source: Valorsul
Electricity production represents the main source of income of Valorsul (45% of total revenues
in 2009) and the main factor that contributed to generate positive financial impacts. The
OECD79 indicates that historically Portugal has been highly dependent on imports of oil and
coal. In recent years, the Government has sought to diversify its energy supply by switching to
gas and further developing renewable energy. Thanks to these efforts, in 2009, renewable
energy accounted for 21% of primary energy supply and 38% of electricity production, far
above the OECD European averages. Portugal has pursued an active support policy on
renewable energies and met its ambitious national target to provide 45% of gross electricity
consumption from renewable sources by 2010.
The energy from renewable sources produced by Valorsul comes from its WtE facility and its
Anaerobic Digestion Plant. Today the company produces 0.7% of the national electricity
generated in Portugal, which corresponds to approximately 2% of the domestic consumption
in the country. The energy produced by Valorsul has been on a growing trend, particularly at
77
At a higher level, other studies also mention the contribution of the CF in Portugal 1993-2006 to economic growth: ‘Significant impact on the GDP (6% of the GDP of 1995 approximately); direct impact on the creation of temporary employment; expected indirect effects in terms of strengthening the national competitiveness’. Source: NEMUS, CISED and CIDEC, 2007. 78
Valorsul Annual Report 2010. 79
OECD, 2011.

44
the WtE Plant, which has increased its production by 20% from 2007 to 2009 (1,029 Tj80 to
1,236 Tj respectively). Most of this energy is sold to the national energy grid (86% in 2009) at
an average selling price of EUR 81 per MWh, leaving the remainder for self-consumption. The
sale ratio of the Anaerobic Digestion Plant is not so high, with an average of some 50% in the
years 2007-2009. In any case, the energy produced by this facility barely reaches 1.8% of the
total produced by Valorsul. In GWh terms, the WtE Plant produced in 2009 a total of 343 GWh
and sold 294 GWh to the national grid. The Anaerobic Digestion Plant produced 6 GWh and
sold 3 GWh to the grid. In 2010, 296 GWh and 7 GWh respectively were sold81.
Table 3.4 ELECTRICITY PRODUCED BY VALORSUL (GWH) – 2007 -2009
Electricity from WtE Plant 2007 2008 2009
Production 285.8 322.5 343.3
Self-consumption 43.6 45.8 49.4
Sold to the national grid 242.2 276.7 293.9
Electricity from Anaerobic Digestion Plant 2007 2008 2009
Production 8.1 8.9 6.4
Self-consumption 3.6 3.9 3.6
Sold to the national grid 4.4 5.0 2.8
Source: Valorsul, 2009
By producing energy from waste, Valorsul enables Portugal to reduce its usage of conventional
energy sources, mainly based on imported fossil fuels. Valorsul estimates that the electricity
sold to the grid by the WtE and the Anaerobic Digestion plants corresponds to some 64,000
tonnes of oil equivalent. From 2011 Valorsul started producing energy also from the
combustion of biogas generated in the Mato da Cruz landfill. This activity will further increase
its revenues deriving from the sale of energy,
Gate fees paid by municipalities and private clients to deliver MSW to the Valorsul facilities
represent the second source of income (34% of total revenues recorded in 2009). As explained
in Section 1.3, different tariffs are applied by Valorsul, mainly depending on the type of client.
It has to be pointed out that the major part of this revenue stream derives from the fee paid by
municipalities for the use of the WtE plant. The average gate fee is approximately EUR 25 per
tonne of waste, generating an income of more than EUR 18 million in 2009.
With regard to the sales of recycled products, they represent only 17.6% of the total revenues,
although there has been a 41% increase from 2007 to 2009 (from EUR 6,687,042 to 9,395,968).
By type of product, packaging waste (cans, tetra pak and plastic) is the most important,
accounting for 42% of the sales in 2009, followed by the sales of paper and cardboard with
29%, a situation that was nearly the opposite in 2007 when the sales of paper and cardboard
represented 48% and packaging 30% of total sales of recyclables. The remaining products
include glass, aluminium slag, steel slag and others.
80
TeraJoule. 81
Source: Valorsul, 2009.

45
Table 3.5 REVENUES FROM THE SALE OF RECYCLED PRODUCTS (2007 - 2009)
Type 2007 2008 2009
EUR % EUR % EUR %
Paper / cardboard
3,219,161 48% 3,104,495 35% 2,748,376 29%
Glass 564,103 8% 602,491 7% 859,539 9%
Packaging 2,010,390 30% 4,002,606 45% 3,937,690 42%
Aluminium slag 280,691 4% 305,833 3% 32,310 0%
Steel slag 398,453 6% 141,577 2% 487,380 5%
Others 214,244 3% 712,005 8% 1,330,673 14%
Total 6,687,042 100% 8,869,007 100% 9,395,968 100%
Source: Valorsul, 2009
As for the sales of compost, this is not of sufficient quality to command a positive price and, in
fact, there is no reference to sales of compost in the reports analysed. Valorsul management
explained that the market for such a product is still underdeveloped and consumers prefer to
use other traditional products as fertilisers. Their lack of confidence is mainly due to the poor
quality of RICATERRA, the compost produced at the Anaerobic Digestion Plant, which does not
comply yet with the guidelines for the quality of compost set by the national authorities.
Actually, notwithstanding that Valorsul has made some efforts to improve the organic waste
sorting (see the Programme ‘+ Valor’ presented in Section 2.3), the high share of improper
material contained in the organic material prevents the production of good quality compost.
The project has contributed to economic growth also by generating employment82. Significant
direct employment has been generated over the years by Valorsul, from 67 initial jobs to 260
in 2010, with a payroll of EUR 11 million (this excludes waste collection employment)83. More
than 70% of staff are reported to be residents of Valorsul’s catchment area. The presence of
Valorsul has also encouraged new companies to establish in the waste and environmental
industry. Amongst these are the Association of Manufacturers of Cardboard Packaging for
Liquid Aliments84, Plastval S.A. and Sociedade Ponto Verde S.A., both of them involved in the
recycling sector85.
For the Cost-Benefit Analysis, we compared the project to the counterfactual of a single large
modern landfill that would accept all the waste from the area of operations of Valorsul
(including waste diverted from the Resioeste catchment area from the point of merger
onwards). On a purely financial basis, the project is not viable, returning a Net Present Value
(NPV) of EUR -122 million over 30 years and an Internal Rate of Return (IRR) of +3.6%. This
confirms that grant aid or subsidisation was required. Net of EU funding, the project generates
a return on national capital (NPV of EUR 148 million and IRR of 7.4%). This is reflective of the
82
This is valued in the ex-post CBA by means of a conversion factor minor than 1 (0.97), in order to reflect the opportunity cost for this input. 83
This compares to initial expected direct employment of 76 staff (source: European Commission, 1994). 84
Associa ão dos Fabricantes de Embalagens de Cartão para Alimentos Líquidos – AFCAL. 85
The economic effects of this indirect employment have not been included in the CBA.

46
financial arrangements for Valorsul, agreed between its stakeholders, i.e. that, after electricity
sales, gates fees are set in order to allow the firm to earn a modest surplus.
The financial results are corrected for in the economic analysis, which converts all costs and
benefits to shadow prices, in order to reflect their opportunity cost. Net of the counterfactual,
the socio-economic CBA generates a positive return for society, with a Net Present Value of
EUR 135 million and an internal rate of return of 5.9%86. The project’s economic return could
have been higher under the following conditions:
Higher recycling share, generating an increase in the sale of recyclable materials;
A better quality of compost produced, which would have generated higher revenues
from the Anaerobic Digestion Plant;
If the facilities had been built in a single complex: this would have reduced costs of
waste transportation between facilities and overhead costs, while generating relevant
synergies.
The CBA exercise has been particularly useful to figure out a crucial feature of Valorsul
financial arrangement: both the gate fees paid by municipalities and the energy selling prices
are highly distorted (as widely discussed in Annex II). When considering the shadow price for
energy, estimated as the average selling price of electricity in the Iberian market (Portugal and
Spain), it is clear that Valorsul is being “overpaid” for its electricity: its average selling price is
EUR 81 per MWh, against a shadow price of EUR 52.89 per MWh87. This high price reflects the
existence of national subsidies to promote the production of energy from renewable sources,
including waste incineration.
As a result of the large revenues deriving from the sale of energy, Valorsul is able to charge
much lower gate fees at both the WtE plant and the landfill. It is not straightforward to find a
proper shadow price for waste management services, as the costs specifically depend upon a
number of factors, such as the technology used and the plant’s capacity. For comparison, the
gate fee for the Porto incineration, built contemporaneously to the Valorsul WtE, is
approximately EUR 40 per tonne (2009 data88). As for Spain, we know that the tariff paid by
municipalities for waste treatment ranges from EUR 35 per tonne to EUR 96 per tonne89.
Hence, an average gate fee of EUR 25 per tonne seems very low and it is very likely to be
distorted. The merger with Resioeste, by allowing to reach scale effects, and the sale of energy
produced from biogas may lead to a further tariff decrease.
86
See Annex II for details. 87
This is the average price of electricity in Spain and Portugal over the period January-September 2011. It is provided by the Quarterly Report on European Electricity Markets
of the European Commission
(http://ec.europa.eu/energy/observatory/electricity/electricity_en.htm). 88
http://www.wtert.eu/default.asp?Menue=31&ShowNews=7. 89
Source: interviews and Greenpeace, 2010.
47
Through this cross-subsidisation mechanism, one can conclude that the Valorsul municipal
waste management system is being subsidised by the electricity tariff system90, thus in
contravention of the already mentioned ”polluter pays” principle. When considering the
shadow prices in the economic analysis, the economic benefit deriving from the sale of energy
significantly reduces compared to the financial analysis; by contrast, the economic benefits
from waste management are higher than what the financial revenues would indicate.
3.3 ENDOGENOUS DYNAMICS
Valorsul was the engine of a major infrastructure development for the metropolitan area of
Northern Lisbon, which has undergone continuous expansion and improvement through
numerous projects and initiatives up to the present time, as described in Section 2. The 1995
project, in particular, represented one of the flagship projects for the creation of an integrated
waste management system of Portugal at the time91, given its large scale and the new waste
treatment technology introduced: actually, incineration was a treatment system previously not
used in the country. Whilst the technology used by the project could not be regarded as
pioneering per se, at the time of the project, and in the context of Portugal, the project was
considered to be highly innovative. Also, the Evaluation Report of the CF 1993-2006 explicitly
refers to Valorsul when describing innovative approaches in the environmental sector92.
Since the technical expertise for such a project was missing in Portugal, much of the know-how
was ‘imported’ from other countries such as Spain, France, Austria and Germany, through
international experts that collaborated with Valorsul during the design and implementation
phases. The European Investment Bank also provided valuable support to enhance the quality
of the project design. This had a clear positive impact on local knowledge and capacity building
both in terms of technical knowledge and managerial skill development among those
stakeholders directly or indirectly involved in the implementation of the project.
As it was to be the first incinerator in the country, there was a great need for technical expertise. Foreign experts and EDP – Energias de Portugal S.A. – provided technical assistance for the incinerator. For the aerobic digestion plant, Austrian consultants provided technical assistance.
Source: Fiedler and Artim, 2006
Furthermore, the project led to the establishment of a multi-municipal system for waste
management in the area of Greater Lisbon through the participation of public companies as
well as the municipalities. In doing so, Valorsul contributed to the implementation of one of
the organisational models for MSW management recommended in the PERSU, but above all it
favoured the establishment of an efficient organisation system for waste management and
treatment services; actually, the multi-municipal management system facilitated the
attainment of relevant economics of scale in the service delivery.
90
It is worth noting that final users contribute as tax payers to the subsidisation of the energy sector. 91
Another one was the Lipor project in Porto. 92
“Organic recovery: high technology CVO (Valorsul); separate collection of organic waste on a large scale (Valorsul); integration of all infrastructures for MSW management in one single system for which the management company is responsible for the construction and operation (Valorsul); provision of knowledge transfer v c ( )”. Quoted from European Commission, 2004.
48
3.4 TERRITORIAL COHESION
The macro-analysis on the impact of CF in Portugal highlights a positive effect on territorial
cohesion, most particularly in relation to waste management. In particular, a study93 focusing
on the period 1993-2006 concludes that CF support not only contributed to improving the
quality of the service but also its coverage. In this respect, the Portuguese population
benefitting from municipal waste services went from 42% in 1993 to 94% in 1999. By 2005, the
service coverage reached 100%.
Whilst it is obvious that all these effects cannot be exclusively attributed to the project, it is
worth remembering that Valorsul was one of the major initiatives at the time and that the
municipalities initially involved in the Valorsul project included nearly 13% of the population of
Portugal (some 1,330,000 inhabitants94): hence it is likely the project had some influence on
the generation of these positive effects.
In terms of territorial development there were (and are) inter- and intra-municipal differences.
Lisbon, as a capital city, shows higher levels of economic indicators, as compared to, for
example, Amadora or Odivelas. The Valorsul project produced some positive effects on
territorial cohesion, by contributing to the reduction of those “welfare disparities”. The project
improved the waste management services in five municipalities of the Greater Lisbon area; the
level of services provided was raised and the territorial differences in terms of quality were
reduced.
Additionally, by having the different plants dispersed across the catchment municipalities, the
project indirectly favoured the generation of employment and development in all the
municipalities involved, including both the large and developed municipality Lisbon and the
other smaller and less economically important neighbouring municipalities. This was made
possible by Valorsul’s preference to hire local personnel for its facilities.
3.5 ENVIRONMENTAL EFFECTS
Our analysis points towards a positive impact of the Valorsul project in contributing to a
proper processing of municipal waste, thus favouring environmental quality. As already
explained, at the time Valorsul and the project started, in the mid-1990s, the processing of
municipal solid waste in the Greater Lisbon Area (as well as in the rest of Portugal) mainly
relied on landfills and open dumps. Thanks to the project, the rate of MSW properly treated
has increased, by providing the municipalities, private companies and individuals with
adequate disposal facilities.
The main ways by which the project contributed to improving environmental quality are the
following:
93
NEMUS, CISED, and CIDEC, 2007. 94
Population of Portugal in 2011 is 10.555 million.
49
i. The closure of the existing open dumps and uncontrolled landfills. The construction of
the WtE plant and of a sanitary landfill made it possible to eliminate the amount of
MSW disposed of in illegal dumping sites, thus reducing greenhouse gas95 emissions as
well as soil and water contamination96. Furthermore, Valorsul’s WtE plant made it
possible to divert 80% of the MSW previously sent to landfill to incineration.
ii. The production of electricity from the WtE and Anaerobic Digestion Plants. As already
pointed out in Section 3.2, Valorsul produces 0.7% of the national electricity generated
in Portugal, which corresponds to approximately 2% of the domestic consumption of
the country. This allows a diversification of the Portuguese energy supply by switching
from oil and coal energy sources to partly renewable energy. It has been estimated by
Valorsul that the electricity sold in 2009 corresponded to the non-utilisation of about
64 thousand tonnes of oil equivalent97.
iii. The increase in recycling rates of materials. In this respect, it is worth noting how
Valorsul reduced the MSW sent to landfills, from 100% in 1998 to 17% in 2009, in
favour of other alternatives, including mainly waste incineration and, to a lesser
extent, material recycling through its Materials Recovery Facility or organic recycling
through the Anaerobic Digestion Plant. The types of material received in the sorting
plant and then sent to the recycling industry include glass, metals, plastic and paper.
Starting from 2008, Valorsul engaged also in the recycling of the organic fraction of
waste, which is transformed into compost in the Anaerobic Digestion Plant. The
volume of MSW treated by this facility is very low in comparison to the other facilities
of Valorsul, i.e. 20,389 tonnes in 2009. The goal of increasing recycling rates in this
area has been pursued not only by means of ‘hard’ initiatives (i.e. the construction of
the required facilities for recycling), but also of ‘soft’ initiatives, such as environmental
awareness campaigns (such as the ECOVIA project and the ‘+ Value’ Programme).
It is worth highlighting, however, that recycling rates (which in the target
municipalities vary between 6% and 14% of total recyclable materials98) are still below
the national and EU targets. Despite the numerous education campaigns implemented
by Valorsul, the project did not allow to comply with EU Directive 2004/12/EC99 on the
95
‘Greenhouse gases are those gaseous constituents of the atmosphere, both natural and anthropogenic, that absorb and emit radiati c f c w v g h w h h c f h f y h E h’ f c , h h itself, and by clouds. This property causes the greenhouse effect. Water vapour (H2O), carbon dioxide (CO2), nitrous oxide (N2O), methane (CH4) and ozone (O3) h y g h g h E h’ h v , h f entirely human-made greenhouse gases in the atmosphere, such as the halocarbons and other chlorine and bromine containing substances, dealt with under the Montreal Protocol. Beside CO2, N2O and CH4, the Kyoto Protocol deals with the greenhouse gases sulphur hexafluoride (SF6) hydro fluorocarbons (HFCs) and per fluorocarbons (PFCs)’. Source: The Intergovernmental Panel on Climate Change (IPCC); http://www.ipcc.ch/pdf/assessment-report/ar4/syr/ar4_syr_appendix.pdf 96
The decomposition of waste in landfills releases the so-called biogas which has significant concentrations of methane (CH4) and carbon dioxide (CO2). Both these gases contribute to the Greenhouse effect. Once the global warming of impact of the methane is higher than the CO2, the landfill starts to flare the biogas, a process that transforms the CH4 to CO2. Other gases emitted – at almost negligible values compared to those of CH4 and CO2 – are SOx, HCI, NO2, and particles. Source: Valorsul, 2009. 97
Valorsul, 2009. 98
See Section 1.4. 99
Amending the previous Directive 94/62/EC. See Box 1.1 for details on the EU targets on the recovery and recycling of packaging waste.

50
recovery and recycling of packaging waste (glass, paper, metals, plastics and wood).
More time and efforts are probably needed in order to change the waste sorting
behaviour of citizens.
Figure 3.1 VOLUME OF MSW RECYCLED (KG PER CAPITA) – 1999-2009
Note: For previous years, no data for Portugal are available.
c : h ’ E .
The project had a positive impact on the environment thanks also to rigorous control and
monitoring activities. Prior to the start of the project, Valorsul conducted a full Environmental
Impact Assessment. The plant was designed to meet EU emission standards, in compliance
with all requirements set by the EU Directive 2000/76/EC on incineration: even dioxins and
furans, the most dangerous pollutants, are below the legal limits100. Also, temperature
increases in the Tagus caused by its use as cooling water were within Portuguese norms101. As
part of the Integrated Waste Management System of Valorsul, the company established an
Environment, Safety and Quality Committee ( , g ),
in September 2001, which set the groundwork for the establishment and implementation of an
environmental management system, in accordance with the requirements of ISO
14001:1996102, and also set the basis for an occupational health and safety management
system, in accordance with the norms OHSAS 18001:1999.
Valorsul has established an Environment Monitoring Programme which includes the
participation of external institutions for the monitoring and surveillance of the following areas:
a. Air quality (Institute of Environment and Development103);
b. Water quality and sediments (Hydrographic Institute104);
100
In 2010 dioxins and furans emitted from Valorsul WtE plant were 0.012 grams. 101
EIB, 1996. 102
The ISO 14000 series of norms aims to promote more effective and efficient environmental management in organizations and to provide useful and usable tools - ones that are cost effective, system-based, flexible and reflect the best organizations and the best organizational practices available for gathering, interpreting and communicating environmentally relevant information. 103
IDAD - Instituto do Ambiente e Desenvolvimento.
0
20
40
60
80
100
120
140
EU (27 countries)
Portugal

51
c. Terrestrial ecosystems and estuaries (Oceanographic Institute105);
d. Noise exposure (Laboratory dBLab);
e. Public health monitoring (Institute of Preventive Medicine of the University of Lisbon);
f. Residents’ behaviour and attitudes (Centre for Social research and intervention106),
focused on the perception of environmental risks among people.
The total costs of these activities during 2009 was EUR 605,836 (see Table below).
Table 3.6 DIRECT COST OF ENVIRONMENT MONITORING ACTIVITIES, 2009
Concept EUR
Analysis of Dioxins, Furans, Heavy metals 29,099
Analysis of Wastewater and Leachate 10,345
Air Quality Programme 158,160
Water quality and sediments 94,755
Noises 5,433
Terrestrial ecosystems 127,805
Public health 164,231
Residents’ behaviour 16,009
Total 605,836
Source: Valorsul, 2009
According to stakeholder feedback and information analysed, the activity of Valorsul does not
seem to pose a threat either to the health of the neighbourhood areas or to the environment.
What follows are the main general conclusions of experts in the different environmental areas:
Air quality: the area of population affected by the WtE plant is subject to very low
concentration of pollutants (in compliance with legal limits), not inducing any risk to
human health (Institute of Environment and Development)107.
Wastewater: there is no evidence of an increase in pollutants in the Tagus River
comparing the current level of pollutants to the levels obtained in the year of
reference, i.e. a year before the WtE plant started operations (Hydrographic
Institute)108.
Noise: the levels of noise in the neighbourhood area of the WtE plant are below the
limit values set by the General Rules of Noise (Ailton Santos & Associates -
Consultants in Environment and Safety) 109.
104 Instituto Hidrogr fico.
105 Instituto de Oceanografia.
106 Centro de Investiga ão e de Interven ão Social.
107 http://www.valorsul.pt/pt/monitorizacao-do-ambiente/qualidade-do-ar/monitorizacao-descontinua.aspx
108 http://www.valorsul.pt/pt/monitorizacao-do-ambiente/outros-programas-de-monitorizacao/monitorizacao-da-qualidade-
agua.aspx 109
http://www.valorsul.pt/pt/monitorizacao-do-ambiente/outros-programas-de-monitorizacao/monitorizacao-do-ruido.aspx
52
Terrestrial ecosystems: Valorsul facilities did not have significant impacts on the
vertebrate fauna over time110 (Faculty of Science of the University of Lisbon) 111.
Public health: the overall results from the study of various social groups (general
public, pregnant women, and children) suggest an effective control of exposure to
heavy metals (Institute of Preventive Medicine, faculty of Medicine of the University
of Lisbon) 112.
Residents’ behaviour and attitudes: the psycho-social monitoring results over recent
years indicate a low and decreasing perception of environmental risk amongst
residents of the WtE plant area (Factor Social - Consulting in Social Psychology and
the Environment) 113.
The only element identified that may have a negative impact on the environment is the
selection of the location for the different facilities of Valorsul. Having dispersed locations
means that the waste has to be transported much longer distances (from households to first
destination facilities, and from first to second destination facilities) than would be desirable. In
any case, whilst the dispersed locations may have not been the most satisfactory from an
environmental point of view, this strategy could be explained as a way to reduce the NIMBY
syndrome of citizens (see Section 2.3).
Increased local traffic problems created by the garbage collection trucks were minimised
through the construction of a ring road, strongly demanded by the politicians of local
communities114. This road is used by trucks to access the WtE plant, thus avoiding congestion
in other municipal roads.
3.6 INSTITUTIONAL QUALITY
At the time of the project and through the following years, many legislative changes, strategies
and plans have been developed in Portugal with regard to the environment sector and also the
waste treatment sub-sector. The OECD 2001 Report confirms that considerable progress had
been achieved in the 1990s, namely with regard to:
modernisation of the legal environmental framework in response to EU environmental
Directives;
development of national environmental planning;
investing in and programming waste-related infrastructure, particularly in the context
of EU Community Support Frameworks;
110
Except for some that are due to external factors (e.g. climate change). 111
http://www.valorsul.pt/pt/monitorizacao-do-ambiente/outros-programas-de-monitorizacao/monitorizacao-dos-ecossistemas.aspx 112
http://www.valorsul.pt/pt/monitorizacao-do-ambiente/outros-programas-de-monitorizacao/monitorizacao-da-saude-publica.aspx 113
http://www.valorsul.pt/pt/monitorizacao-do-ambiente/outros-programas-de-monitorizacao/monitorizacao-psicossocial.aspx 114
Although not considered particularly necessary by Valorsul Management (source: field interviews).

53
capacity building and institutional development with the creation of several
environmental bodies at State and regional level.
In particular, as far as institutional development is concerned, two key institutions were
established (Section 2.1): Águas de Portugal in 1993, focusing on developing multi-municipal
systems for water supply and waste water and solid waste treatment, and the Regulatory
Authority for Water and Waste Services in 1997, taking on the responsibilities of regulatory
authority of the water supply, waste water management and municipal waste management.
Prior to 1993, the water and waste sector in Portugal was managed in an unsustainable way and had difficulties answering the new challenges that followed the entry to the European Union. The Portuguese Government reorganized the sector in 1993 in order to more effectively ensure universal access to continuous services, guarantee a high quality of service (particularly water quality), ensure affordable prices and promote environmental sustainability.
Source: ERSAR, 2011.
The causal link between the establishment and development of new institutions and the
project is twofold. On the one hand, the setting up of these entities was the basis for
establishing Valorsul and designing the Integrated Waste Management system for the Greater
Lisbon area. On the other hand, the establishment of Valorsul, and the implementation of the
project under assessment as well as subsequent projects have induced or at least has had
some influence on the development of regulatory capacity and changes in institutional
structures in the waste sector. As highlighted by some interviewees, the project improved the
quality, in particular, of the Financial Institute of Regional Development (IFDR): prior to this
major project, Portuguese officials did not have sufficient knowledge of the EU public
procurement rules and had little experience in the production of tender drafts of adequate
quality. The IFDR made use of all of the knowledge acquired with Valorsul. Institutional quality
improved and, the IFDR even started to export the new expertise acquired, by assisting EU
candidate countries through the EC’s Twinning instrument.
A learning process has been started also the weaknesses of the Valorsul management system,
consisting mainly in the very low recovery and recycling shares of waste: actually, the new
national plan for waste management (PERSU II) includes several measures aimed at improving
the separate collection among households.
3.7 SOCIAL HAPPINESS
By producing positive impacts, particularly on the environment, for the population of the area
of activity, the project contributed to improving their quality of life. Waste management now
compared to the ex-ante situation of the project has changed considerably and, with this, the
quality of life of the population in the area. Old open dumps have been closed and
transformed into green areas and parks for leisure activities and a more efficient waste
management system had been put in place.
As part of the company’s CSR policy, the company has developed further initiatives aimed at
improving the quality of life of the population, increasing public awareness of waste

54
management issues and supporting other activities to the benefit of the population: to name
some of these, Valorsul financed the construction of an indoor swimming pool in collaboration
with the municipality of Loures and the planting of 600 trees and 16,500 bushes in the area of
Casal Ventoso. These initiatives have been positively welcomed by the population and have
contributed to raise social happiness and the level of satisfaction with Valorsul’s activities.
However, at its initial stage the project faced opposition from several stakeholders, which
could be classified into two groups: a) politicians and local communities, who initially opposed
the project and b) environmental organisations, some of which are still against it. Opposition
from local communities was a means to obtain the construction of waste treatment facilities
across all the involved municipalities and their hostility vanished as soon as their demands
were conceded. Environmental organisations, by contrast, did not oppose the project per se: in
fact they recognised the need for taking urgent actions to improve the environment. Yet they
were mostly hostile to the technology selected (mass burning)115 and were instead more in
favour of Mechanical Biological Treatment (MBT), which envisages the transformation of
waste to produce compost and energy116.
After some years of operation, some NGOs117 have taken a more positive view of the impact of
the project and have started to consider the incineration technology as an acceptable and
necessary solution to the problem that the area had. This has been achieved thanks to
communication activities carried out by Valorsul, as well as higher level of involvement of
these organisations in the decision process. Moreover, the opening in 2008 of an Anaerobic
Digestion Plant to produce compost, strongly demanded by the environmentalist groups,
certainly contributed to widening consensus. Other NGOs, however, such as Quercus118, still
show some hostility to the Valorsul project119.
Hence, even if opposition from NGOs may have initially reduced to some extent people’s
perception of the project, Valorsul’s efforts to increase the transparency of its operations and
implement awareness-raising campaigns amongst stakeholders certainly helped to change
local community perceptions, to the point that today this opposition is considered negligible.
115
From the environmentalists’ point of view, the incineration option was considered to have the following negative impacts:
the WtE plant would produce more energy than a MBT unit at the cost of diminishing recycling rates, since it would not allow the recovery of the organic or the plastic fraction;
the WtE plant would contribute to increasing gas emissions;
WtE plants usually have higher maintenance cost and breakdowns. 116
In an MBT facility, waste goes through some forms of biological and mechanical processes, though the order and precise nature of these processes can vary. The mechanical stage has two main roles: (a) to break down waste into smaller parts, e.g. by shredding; (b) to remove some recyclable material. In the biological stage the waste is either composted or digested, usually in an enclosed system. If an anaerobic digestion system is used, it should produce methane which can provide energy for the plant (and possible for export to the grid). Some systems take the composted waste and then remove more recyclables, for example plastics which are no longer contaminated by food residues due to the composting process. (Source: Friends of the Earth, 2008). 117
Such as GEOTA, one of the most significant environmental NGOs in the region. 118
Quercus – National Association for the Conservation of the Nature (Associação Nacional de Conservação da Natureza); http://www.quercus.pt/. 119
In 2005 Quercus accused Valorsul of burning excessive amount of plastic, instead of ensuring its recycling. These allegations have been strongly rejected by Valorsul (http://www.cmjornal.xl.pt/detalhe/noticias/nacional/portugal/quercus-acusa-valorsul; http://noticias.portugalmail.pt/artigo/valorsul-nega-acusacoes-da-quercus_176911). More recently, Quercus opposed the merger between Valorsul and Resioeste, claiming that Valorsul WtE would in fact lack the capacity to treat all the collected waste (http://www.jornaldascaldas.com/index.php/2009/08/26/quercus-contesta-fusao-entre-a-resioeste-e-a-valorsul/).

55
A recent study by the University of Lisbon indicates that the attitude of local communities
towards the incinerator shows a neutral to positive response120. The study also highlights that
the psychosocial monitoring results over the last few years indicate no widespread disruption
in the population, since the average levels of annoyance and risk perception related to the
Valorsul waste management infrastructures are low. The author concludes that despite the
good results, these could be improved through further work, particularly in those areas which
are closer to the WtE Plant121. In addition, the customer satisfaction data produced by ERSAR
shows positive results in relation to Valorsul Anaerobic Digestion Plant, as far as service
coverage, selecting coverage, and claim responses are concerned 122.
120
Palma-Oliveira, 2010. 121
Actually, it has been shown that the closer the population to the WtE site, the higher the level of opposition: the population living within 1 kilometre of the facility site showed the highest rate of opposition to the construction (40%), which confirms the “Not-In-My-Backyard” effect of these types of infrastructure. 122
Source: NEMUS, CISED and CIDEC, 2007.

56

57
4 DETERMINANTS OF PROJECT
OUTCOMES
4.1 KEY FINDINGS
Table 4.1 IMPACT OF KEY DETERMINANTS OF THE PROJECT PERFORMANCE
Strength*
1. Appropriateness to the context +5
2. Project design +3
3. Forecasting capacity +3
4. Project governance ±3
5. Managerial response +2
*-5 = very strong negative effect; 0 = no effect; 5 = very strong positive effect (see in Annex I the criteria considered to assign these scores)
The delivery and performance of the project was mainly influenced by five drivers, and the
interplay between them. We believe that context was the strongest determinant, especially in
terms of responding to the large waste management problem in Portugal in the 1990s,
aggravated by the increasing pressure from society, which was growing in environmental
awareness123, the formalisation of MSW policies, the World Exhibition Expo '98, and the
availability of EU funding.
Design was influenced by the context of the project. On the one hand it was necessary to
provide a robust solution to an important problem, within a relatively short period of time,
since stakeholder pressure from all levels (EU, national politicians, NGOs, wider society, etc.)
was growing stronger over time. On the other hand, Portugal had little experience (technical
and managerial) in dealing with this type of project. Thanks to collaboration with a large
number of experts coming from other countries and institutions (such as the European
Investment Bank), the project design effectively managed to guarantee project performance
and generate the expected effects.
The limited capacity to exactly forecast the demand for infrastructures led to the slight
overcapacity of the WtE plant compared to the actual demand. On the contrary, forecasting
capacity proved to be good when considering that Valorsul anticipated the possible opposition
from the public and NGOs and successfully minimised their effects through strong
communication campaigns and a participatory approach.
Managerial response also helped at building consensus regarding the project. By addressing
the demands of municipalities (e.g. regarding the location of facilities) and of NGOs (which
have always been in favour for the construction of an Anaerobic Digestion Plant to
complement the Integrated Waste Management System), Valorsul managed to increase the
123
As shown by the growing number of environmental associations established (Section 2.1).

58
positive perceptions of the project and thus to improve social happiness. Yet, these measures
represent additional costs which constrain the project’s effects on direct economic growth, as
stressed in Section 3.2: on the one hand, having dispersed facilities increased the cost of
transport, as well as the environmental costs due to higher transport emissions; on the other
hand, the composting plant, besides generating a small quantity of energy to be sold, in fact to
date has produced poor quality compost which is unusable in the agriculture sector.
Valorsul showed good managerial response also when it merged with Resioeste, in order to
ensure full utilisation of the WtE plant’s capacity and, specifically, to maximise the revenues
generated from electricity sale.
The main feature of the project governance structure that influenced the project is the role
played by municipalities, which are both shareholders of Valorsul and users of the Integrated
Waste Management System. This gives them a strong role in the decision-making process
within the company: in particular, by influencing the infrastructures’ locations they somewhat
limited the economic return to the company and increased the emissions from transport (as
discussed in Section 3.2 and 3.5), while contributing to some extent to improving territorial
cohesion (Section 3.4) and building social consensus regarding the project.
4.2 APPROPRIATENESS TO THE CONTEXT
The project was highly appropriate to the context existing at the time it took place. The very
significant deficit in waste management in the Lisbon Metropolitan Area until the end of the
1990’s, mainly due to poor infrastructures, represents the main driver for the conception of
the Valorsul project. The Integrated Waste Management System put in place by Valorsul
managed to provide a large number of households with a modern and functioning waste
management system, mainly based on waste valorisation, rather than disposal to landfill.
Valorsul also duly took into account the goals and targets set by the PERSU – Strategic Plan or
Municipal Solid Waste – covering the period 1997-2007. The Plan was intended to promote
waste prevention, reuse and recycling policies, to strengthen the separate collection services
and to establish associations of municipalities involved in the management of MSW.
Hence, the urgent need to provide a solution to the waste management issue, so as to comply
with the national strategy as well as EU Directives requiring a progressive reduction in waste
disposal to landfill and an increase in waste valorisation, recycling and re-use, had strong
relevance in the justification and conception of the project. The increased public awareness of
environmental matters (as the increasing involvement in environmental associations has
shown, see Section 2.1) further pushed the implementation of a more sustainable waste
management system.
The decision to build a WtE plant has also to do with the strengthening of national incentives
for the production of ‘green energy’. The public demand for alternative and more sustainable
energy sources and the willingness of governments to subsidise, through financial incentives,
the production of electricity from alternative sources, in order to diversify the energy
production mix, contributed to justifying the decision to build facilities for energy recovery

59
from waste. Additionally, the average selling price of electricity produced by the incinerator
and the anaerobic digestion plant (an average of EUR 0.081 per KWh) is key to the financial
viability of the system, as it contributes the largest part of Valorsul’s revenues.
Another context specificity was considered, i.e. the preparation for and celebration of the
World’s Fair Exhibition Expo ’98. This event had a strong symbolic focus with regard to
sustainable development, preservation of environment and urban renewal. The Valorsul
project was being planned in a highly demanding context in which Portugal aimed to solve key
environmental problems, including waste management in Lisbon. One of the priorities laid
down by Parque Expo, the state-owned company in charge of organising the exhibition, was
the transformation of the brownfield site in the Oriental Quarter of Lisbon where Expo ’98
would be located, as well as the sealing of the large uncontrolled landfill in the area (see
Section 2.2).
Urged on by strong social and political pressure, Valorsul became part of the solution to that
specific problem, i.e. the regeneration of the Oriental Quarter of Lisbon, but also to the wider
situation of poor waste management in Lisbon and in the adjacent municipalities.
Furthermore, the Valorsul project was considered necessary to bring on-stream higher
capacity to deal with increasing demands for waste treatment services in the area of Lisbon
during the construction phase and the celebration of Expo ’98.
The availability of funding through EU Structural Funds for large environmental infrastructures
is another context trait which Valorsul took advantage of. The CF in Portugal in the 1990s and
early 2000 was very active in promoting the construction of large environmental
infrastructures with the aim of bringing Portugal closer to EU standards. In addition to the CF
aid, there were other sources of funding at the time from which the company benefitted, to
develop its Integrated Waste Management System, i.e. the EIB loans and the ERDF for
subsequent projects. It is worth noting, in particular, the role played by the EIB whose financial
contribution to the initial project was close to the aid obtained from the CF.
4.3 PROJECT DESIGN
There is a general consensus amongst stakeholders on the adequacy of the main technology
chosen to treat MSW, i.e. incineration. As previously explained, some local NGOs directly
opposed the choice made, favouring alternatives such as MBT technology. At that time,
however, the effectiveness of MBT was still being debated. Some interviewees stressed that
there was no evidence indicating that MBT was a better option than incineration and, from
this point of view, the project was designed with the best technology available to guarantee an
effective and sustainable solution to the waste management issues in the Northern Lisbon
area124. The incinerator plant was designed to meet all EU standards laid down in Directive
2000/76/EC, including on the level of emissions, and its construction was based on an
124
It is worth noting the fact that MBT technology was included in the typology of projects promoted by PERSU II – ‘Capacity g f B f g h w f ff c c ’ – but not in the first PERSU. This could be considered revealing and supportive of the fact that in the Nineties there was a large degree of uncertainty about the effectiveness of MBT technology.

60
international open competition, which was won by the best offer on a technical and economic
basis125.
The project was planned in a comprehensive and step-by-step delivery approach. First, the
most urgent issues were tackled, namely sealing of open dumps and construction of a modern
landfill, followed by the WtE Plant. This was followed by further initiatives (recycling; organic
valorisation; ash recovery) until an integrated waste management system of complementary
treatments had been established.
Moreover, in order to cater for possible future increase of the volume of waste, Valorsul
decided to design the WtE Plant with spare capacity so that it could easily incorporate a 4th
burning line at a later stage. This enlargement, however, has not taken place so far, and it does
not seem likely in the short-term, since the economic crisis is resulting in lower volumes of
waste processed.
There is a feature of the project design, however, that did not allow the maximisation of total
benefits: the territorial dispersion of Valorsul facilities. The Integrated Waste Management
System is based on several infrastructures spread throughout the area of activity of Valorsul.
This decision, justified by the impossibility to find one municipality willing to have all the waste
treatment plants in its territory (because of the so-called NIMBY syndrome), had negative
impacts from various angles, namely economic (cost of waste transportation between
facilities, low level of synergies and overhead costs, etc.) and also environmental (higher
emissions due to longer trips to move waste between facilities). A centralised solution would
have been feasible but that was never considered.
In addition to the pressures from local politicians, Valorsul also decided to meet the demands
of environmental NGOs to integrate the waste management system with an Anaerobic
Digestion Plant. Valorsul’s Management admitted that the construction of this facility was
“imposed” by external pressures: ‘we were forced to start with the organic waste treatment
despite being very expensive and not profitable; yet we received huge pressure from
stakeholders’. Furthermore, Valorsul management has claimed that the gate fee to the WtE
plant would be EUR 6 lower if Valorsul did not have to bear the operation costs of the
composting plant.
The construction of the AD plant has been problematic; during the test period, many technical
problems were detected, which, according to Valorsul management, were caused by errors
made by the supplier company. This implied to stop the waste processing for several times in
order to repair the equipment. It took two years to solve all the technical problems and to
eventually start the composting processing.
125
Valorsul’s WtE plant uses the traditional combustion technology (as described in Section 1.1. Even if different and more efficient technologies could have been used (such as the Circulating Fluidised Bed combustion which allows to generate lower emissions of dioxins), the plant complies with all legal limits of emissions, including of dioxins.

61
4.4 FORECASTING CAPACITY
The WtE plant has the capacity to treat up to 662,000 tonnes of MSW per year and over the
period 2000-2009 it has received on average 561,940 tonnes per year. It was equipped with
three burning lines, plus spare capacity for an extra fourth line. As of yet, the fourth line has
not been needed, as the plant’s capacity is already larger than actual demand. The current
economic situation, which is constraining consumption and, consequently, waste generation,
the increasing share of recyclable waste delivered to the Materials Recovery Facility and the
construction of the Anaerobic Digestion Plant, which further reduced the volume of MSW
incinerated, have prevented maximisation of the use of the WtE plant. Hence, it can be argued
that Valorsul was a somewhat optimistic in its forecasts.
The sub-optimal forecasting capacity, which led to the construction of a larger plant than was
necessary, did not significantly affect the project’s performance. The unforeseen need to
provide services, even if temporarily, to the AMTRES municipalities contributed to increasing
the use of the WtE plant; subsequently, in order to maximising its plant’s treatment capacity
utilisation and thus the revenues from gate fees and electricity sale, Valorsul decided to merge
with Resioeste (this decision is further discussed in Section 4.6 on managerial response).
Valorsul’s forecasting capacity, on the other hand, proved to be very appropriate in another
circumstance: the company managed to anticipate the problems that the initial public and
NGO resistance to the project might have caused, and to minimise its effect. The opposition to
the use of the incineration technology solution was minimised through the adoption of a
participatory approach. Valorsul invited the environmental NGOs to join a committee in charge
of monitoring the studies conducted during the Environmental Impact Assessment process:
representatives from these organisations participated as observers in the meetings of the
committee126. Several public discussion forums were organised by Valorsul to involve the
public and provide them with all the relevant information about incineration. Furthermore,
Valorsul assured real time information on emissions and access to its facilities, in order to gain
trust and ensure social acceptance of the project.
Valorsul’s initiatives and efforts to inform and involve the public proved to be successful as
they enabled an increase in the perception of wellbeing among the public.
126 The participatory approach undertaken by Valorsul was in line with the recommendations in the OECD 2001 Report, which
indicated that a greater involvement of environmental associations was needed: “Environmental Impact Assessment procedures
should rely more on public hearings and open participatory processes. Environmental training is further needed to support many
local communities in managing environmental projects and enforcing environmental legislation”.
62
The major lesson learnt is that all that transparency was worth it, and today, 15 years later, Valorsul is regarded by the surrounding populations with great respect and confidence and as an example in terms of environmental issues to be followed by other companies.
Source: Field interview
Furthermore, the company’s CSR activities, including awareness campaigns but also other
activities aimed at increasing the quality of life of the target population (e.g. co-funding of a
public swimming pool or planting trees in public parks) were recognised by the “InnoTrain
CSR” project of the EC as a best practice example127.
Concerns and reservations in the public associated with the construction of the WtE plant were prevalent, because this was the first facility of its kind in Portugal. Therefore, the company responded to protests and concerns with intensive communication during the planning and construction phase and pushed through strategic partnerships with companies, city administrations and local associations. By implementing comprehensive and transparent environmental monitoring as well as various social and c v , f y cc w g c cc c (“ c c “) and in establishing itself as a trustworthy company.
Source: InnoTrain CSR, 2010
4.5 PROJECT GOVERNANCE
Valorsul is governed by public bodies, both national (such the public company EGF) and local,
i.e. the municipalities, which own shares in the company in proportion to the MSW produced.
The total share of municipalities has always been less than the aggregate of public national-
wide companies: in 1994 the municipalities had 38% against the ‘national’ shareholders (i.e.
EGF, EDP Electricity of Portugal and Expo ’98 Park); in 2010, after the merger with Resioeste,
municipalities’ share grew to 43% against the rest owned by EGF128.
Since the company’s establishment in 1994, Valorsul’s strategic decisions, such as the
enlargement of the integrated waste management system with the AD plant and the inclusion
of former Resioeste municipalities within its catchment area, have been promoted by the
public national authorities. Nevertheless, municipalities participated to the decision-making
process and they have the possibility to significantly influence the company’s activities.
Valorsul management considers essential to keep smooth and continuous communication with
all its shareholders due to the nature of the company and its business, in which municipalities
are both “owners” and “users” of the Integrated Waste Management System.
In order to satisfy the pressure of local politicians, Valorsul agreed to build the waste
treatment facilities in different municipalities, so as to minimize the NIMBY syndrome. This
solution, however, was not the best option that could have been pursued, as it led to higher
transport economic and environmental costs. The municipalities also gave their approval to
the construction of the AD plant and to the Resioeste merger. The latter proposal has been
127
The “InnoTrain CSR” project is funded by the Leonardo da Vinci Programme of the European Union and provides material to promote Corporate Social Responsibility (CSR). "InnoTrain CSR" aims to provide practice-oriented and flexible formats to involve all employees in vocational education and training (http://www.csr-training.eu/en/home/). 128
See Figure 2.5 in Section 2.3.

63
particularly well accepted, because, by allowing the WtE plant to operate at full capacity and
increase the energy sale, it may allow a tariff decrease for waste treatment. The pressure of
political parties represented in the municipality where the incinerator was located (Loures)
were particularly strong at the initial stages of project implementation: they asked Valorsul a
number of compensatory measures against the construction of the WtE plant, including the
financing of a ring-road connecting Loures and Lisbon and serving the plant and other social
projects to the benefit of Loures citizens (such as a public swimming pool).
Tariff setting was influenced both by the national legislation and the municipalities. The high
incentives granted by the Government to energy generation from renewable sources
(including waste incineration) and municipalities’ interest in keeping the gate fees as lowest as
possible determined a cross-subsidisation mechanism such that the tariff is neither in line with
the “polluter pays” principle nor guarantees the financial sustainability of Valorsul’s system (as
remarked in Section 1.3). Valorsul is aware that its financial viability is much dependent upon
the energy sale, and its latest strategic choices, i.e. the merger with Resioeste and the energy
recovery from landfill biogas, highlight the company’s aim of maximising this source of
revenue. A raise of the gate fees, which would make the company less dependent upon the
energy price, is not under discussion.
Figure 4.1 PROJECT GOVERNANCE STRUCTURE
Source: Authors

64
In short, the Valorsul governance structure had a strong and mixed influence on the project
design and thus its effects. On the positive side, the national influence allowed to put in place
an effecting and integrated waste management system, which diverted most of unsorted
waste away from landfills and put the basis for waste valorisation and recycling increase. The
condition imposed by one municipality of building a ring-road from Loures to Lisbon slightly
raised the investment cost, but it positively affected the environment, by reducing road
congestion. Most of all, what the compromise between the municipalities’ and Valorsul’s
interests allowed was to minimise opposition from local communities to the project.
On the negative side, political and social interference constrained Valorsul management room
of manoeuvre: the AD plant, strongly advocated by environmentalist and political parties, was
built despite been considered not profitable by Valorsul; on the same vein, municipalities
pressure on the decentralised location of the plants prevented from designing the most
efficient option, thus increasing economic and environmental cost of waste transport (as
explained in Section 4.3). Finally, the national and local focus on generating revenues most
from the energy sale rather than from tariffs may potentially put at risk the financial
sustainability of the project.
4.6 MANAGERIAL RESPONSE
This sub-section is concerned with the adaptability/flexibility of project management to
unforeseen events. It is worth noting the constant evolution of the Valorsul facilities and
services from the outset. As Valorsul management stated, ‘we started with just two projects,
the incineration plant and the landfill’. Seventeen years later, the company has widened its
range of services and adapted to new legislative, political and social demands.
Valorsul made concerted efforts to anticipate potential changes and problems related to the
wider public, as explained in other sections of this report. The company, for instance, is very
active in working with schools and younger people. This allows Valorsul not only to deliver
environmental education to these groups, thus improving recycling rates and the positive
perceptions about the project, but also to learn about concerns and demands of future
generations and take action in anticipation of these concerns and demands. The merger with
Resioeste is another good example to illustrate the capacity of Valorsul to adapt to new
circumstances, in this particular case, the economic crisis. With this, Valorsul aims to
guarantee that the WtE Plant works at full capacity and increase its revenues.
Much more efforts, however, are still needed to increase the recycling shares, by organising
awareness and communication campaigns to improve waste sorting behaviour among
households. This will increase the volume of recyclable materials recovered and favour the
production of good quality compost.
Adapting to stakeholder demands has not always proved successful for Valorsul, at least from
a financial point of view. A good example of this is the Anaerobic Digestion Plant, a service that
was imposed by pressure from NGOs and politicians, despite being considered very expensive
65
and not profitable by Valorsul management129. Besides the difficulty encountered in selling the
compost produced, particularly without a behavioural change among households about waste
sorting, Valorsul claims that the plant has had too many technical problems which raised
investment costs.
The Anaerobic Digestion Plan is an environmental cost that we had to pay.
Source: Valorsul management interviewed
4.7 THE ROLE OF THE EU INSTITUTIONS
Most stakeholders agree on the key role played by the EC in the implementation of the
Valorsul project. As noted in the Evaluation Report of CF 1993-2006 in Portugal, financial aid
was critical in helping Portugal:
Meet EU targets and legislation regarding the environment: ‘The CF has been the key
for a closer alignment of Portugal with the EU targets on water supply, sanitation and
W (…) h c v g c w f g h f F (1993-1999) due to
a concentration of investments in major urban areas.’
And by providing the required financial assistance: ‘All project promoters stressed the
importance of CF co-financing in the implementation of infrastructures. In fact, without
this funding, and given the lack of financial and technical capabilities, most local
governments would not have been able to support the investments. The only
alternative would have been a very high increase of tariffs, a situation that would have
been socially unbearable as this concerns the provision of essential public services’.
Whilst these statements refer generally to the CF investments in Portugal during the Nineties,
they could be related to the Valorsul project as well. The EC was not only of great importance
in the establishment of Valorsul and the implementation of its first CF project, but also it has
contributed to Valorsul’s continuous improvement through the co-financing of further
initiatives. With regard to this issue, it is worth noting the rehabilitation of municipal landfill
sites (ERDF funds), the construction of the Anaerobic Digestion Plant (Portugal CF project
1999/PT/16/C/PE/005) and the Ecovia - Ecological Road project (LIFE Programme project LIFE
ENV/P/000366 05).
The EC DG Regional Policy Unit for Portugal also carry out monitoring field missions to check
on the projects' progress and acquire on-the-spot knowledge of implementation problems and
advise on solutions. Therefore it can be stated that the role of the EC has been key for the
success and sustainability of the projects and initiatives of the company.
129
Source: Field interview.

66
If we had not had the support of the EU to construct the WtE Plant, maybe we would have been able to build it anyway. However, one thing is clear: it would have been impossible for us to carry out the construction of further infrastructures and the delivery of additional v c f w ’
Source: Valorsul management interviewed
Interviewees also stressed the important role played by the EIB. The EIB loan facilitated
Valorsul in accessing financial resources under better conditions than other banks on the
market. Considering all the investments made to set up the Integrated Waste Management
System, the contribution that Valorsul received from the EIB loan (33% of total investment
cost) was quite significant and close to that from CF (36.1%).
The loan was very important at the time to Valorsul, mainly because of the interest rates involved and h / g c y gh j c […] W ( ) h f v k deeply interested in funding our project, but could not compete with EIB conditions.
Source: Interview to the President of the Executive Commission of Valorsul
In addition to the aforementioned financial conditions, the involvement of the EIB offered an
added value to the project. Pre-loan assessment processes carried out by EIB are notably very
demanding: the project is assessed by finance experts as well as economists and engineers,
who also provide recommendations to enhance the quality of the project, in line with the
Bank’s eligibility guidelines and rules. Such a thorough and comprehensive process does not
exist in other banks and ensured the robustness of the project.

67
5 CONCLUSIONS
Conclusions and the main lessons learnt from this case study are presented in this last Section.
The success of the Valorsul project in increasing environmental quality was not a surprise
taking into consideration the serious problems that Portugal was facing in the 1990s in the
area of environmental management. The waste sector was managed in an unsustainable way
and Portugal faced difficulties in complying with the policies and legislation arising from EU
membership. The priority for the managers and authorities at the time was to respond quickly
to an increasing problem, and the construction of modern facilities for waste treatment
managed to eliminate the volume of waste being illegally dumped in uncontrolled landfills.
In order to fully understand the long-term contribution brought by the project and the
mechanisms which influence the generation of effects, it is worth noting the challenge that a
company of the nature of Valorsul has to face. On the one hand, as a private-law company, the
management has to respond to the demands of the market and ensure the financial
sustainability of the company. This is largely ensured by the national subsidies for the
production of energy from waste, which generate high revenues for Valorsul. Furthermore, in
order to increase income from waste treatment services and to maximise the WtE plant’s
utilisation, Valorsul decided to merge with Resioeste in 2010.
On the other hand, as a government-owned company, it is subject to much pressure from its
shareholders, particularly municipalities, and from wider society and NGOs. In order to satisfy
their requirements and secure a high level of consensus, Valorsul has had to put financial
priorities in a secondary position: the construction of the Anaerobic Digestion Plant, the very
low gate fees (in contravention of the EU “polluter pays” principle) and the geographical
dispersal of facilities, secured the consensus of NGOs and municipalities, but also reduced the
system’s profitability. Additionally, the ‘need’ to comply with political pressures to distribute
the facilities amongst all the municipalities instead of concentrate them in one area, has been
detrimental to the environment, due to higher transport emissions.
It has to be acknowledged that the capacity of Valorsul to engage with the main stakeholders
from an early stage was a key successful factor of the project. In response to initial protests
and opposition, the company carried out communication campaigns, during the design phase,
and built strategic partnerships with companies, authorities and associations. The
implementation of subsequent CSR initiatives has also been very important in gaining and
maintaining public acceptance. These efforts are reflected in a high impact of the project on
social happiness.
From an economic viewpoint, the Valorsul project has contributed to direct economic growth
by producing electricity, providing a proper waste management system to the metropolitan
area of Northern Lisbon and, to a lesser degree, contributing to the development of the
recycling market through the sale of recyclable products. However, despite the numerous
educational campaigns to improve waste sorting, recycling rates are still below the EU targets,

68
in contravention of EU Directive 2004/12/EC on the recovery and recycling of packaging waste.
Also, the high share of improper materials in the organic material prevent Valorsul from
marketing the compost produced in the AD plant. More awareness campaigns are still needed
to change the sorting behaviour of Valorsul’s clients.
The CBA exercise has enabled the quantification of the economic return on the project. On
both a financial and economic basis, the project generates a negative Net Present Value (EUR -
122 million in the financial analysis and EUR -44 million in the economic analysis). However, if
compared to the counterfactual of a landfill, which generates a much larger and negative
economic NPV of EUR -179 million, the project generates a net positive return for society of
approximately EUR 135 million.
The reasons for the project’s limited economic return are partly related to the lost revenue
opportunities from the sale of compost and recyclable materials and the higher costs deriving
from decentralised infrastructures, and partly to the fact that the CBA does not incorporate a
large number of other effects, the largest one related to the already mention benefit on social
happiness. Other non-quantified benefits are summarised below.
The lack of expertise in Portugal in managing and delivering large scale projects such as
Valorsul and the collaboration with a number of experts from other countries did have an
impact on endogenous dynamics during the preparation and early implementation of the
project. The undeveloped state of Portugal in the environment area made it possible that the
project had a positive impact also on institutional quality. In a short period of time, the project
enhanced the capacity to deliver large projects in Portugal. In the medium to long run, the
‘pioneering’ nature of the project has also influenced some institutional structures (e.g. IFDR)
through a learning by doing process. The lessons learnt by Portugal through this process have
been used to assist other EU candidate countries that have gone through similar processes
(lack of expertise) in recent years. This has been done through the EC Twinning instrument for
the Candidate Countries. Moreover, the very poor results in terms of recycling pushed the
Government to elaborate new measures to improve waste collection and separation among
households, which have been included in the new national waste management plan (PERSU II).
It is worth remarking that the Valorsul project became an emblematic project in Portuguese
waste treatment. It achieved a symbolic dimension, mainly due to the pioneering character
and the large scale of the Integrated Waste Management System implemented. In fact,
according to stakeholders’ feedback, at the time, Valorsul was considered the flagship project
that would show the strengthened capacity of Portugal with regard to the implementation of
large and complex infrastructures. This factor further improved the positive perception and
consensus about the project.
Valorsul turned out to be an emblematic project for Portugal, further to the needs that it would solve
Source: CF Coordinator, IFDR)
Regarding the determinant factors of the project’s performance, the analysis shows a very
positive role played by the project’s appropriateness to the context: the urgent need for a

69
better waste management solution, strengthen by the forthcoming Expo ’98 event and by
increased public awareness of environmental issues, as well as the high incentives granted by
the Government for the production of energy from ‘green’ sources, including waste
incineration, represented the main determinant factors of performance.
Project design attempted to provide the best solution to the waste management issue and at
the same time secure the consensus of stakeholders, by satisfying requests concerning the
localisation of facilities and the construction of the AD plant. Forecasting capacity could have
been stronger, as far as the WtE plant’s capacity setting is concerned, but it proved the be
adequate in terms of anticipating potential opposition from residents and NGOs and of taking
steps to minimise this opposition.
Both project governance and managerial response had mixed effects on the project. By
reacting to the municipalities’ and other actors’ demands, Valorsul improved social happiness
to the detriment of other aspects of the project.
The importance of EU funding for the Valorsul project was fundamental. The large scale and
dimension of the project (initial eligible investment cost of EUR 186.41 million in current
terms) required innovative technology and modern management structures. The CF
contributed 49.41% of this cost and it seems unlikely that the Portuguese Government could
have financed the whole cost alone. The role of the EIB was also of great value. It contributed
with some 32% of total investment cost, and also provided robustness to the technical and
economic design of the project.

70
71
ANNEX I. METHODOLOGY OF
EVALUATION
The present Annex summarises the methodological approach undertaken for carrying out the
project case studies and presented in the First Intermediate Report of this evaluation study.
Moreover, the Annex further elaborates on and specifies the definition of long-term effects
considered throughout the case study and the typology of determinant mechanisms analysed
in interpreting the project outcomes. The main objective is to provide the reader with a set of
information describing how the project evaluation was conducted and to enable him/her to
replicate this methodology.130
The Annex is divided into three parts: in the first one, the overall conceptual framework of the
evaluation study is recalled and the definition of long-terms effects and project determinants
are laid out; in the second one, the methodology of analysis followed to implement the ex-post
evaluation is discussed; finally, the structure of the case study reports and the tools used to
standardise them is described in the third part.
CONCEPTUAL BASIS
The Conceptual Framework of this evaluation study is based on three dimensions of analysis:
the object of the evaluation (the ‘What’), the timing of the long-term effects (the ‘When) and
the determinants of the project’s outcomes (the ‘How’).
The ‘What’ dimension
The Team developed a classification of long-term effects, with the aim of identifying all the
possible impacts of public investments on social welfare. A broad distinction of project effects
is among effects on ‘Economic development’ or ‘Quality of life’. Investment projects can foster
economic development, which is generally quantifiable by aggregate indicators, such as the
Gross Domestic Product; although economic development is not disconnected from the
wellbeing of society, it is acknowledged that there are a number of other factors that may
affect public welfare, that are not captured by the traditional economic indicators131. For the
purpose of this study, the notion of quality of life132 refer to the factors that affect social
development, the level of social satisfaction, the perception of social reality and other
dimensions which are outside the conventional economic dimension. Under these two broad
categories, a taxonomy of more specific long-term development effects of investment projects
has been developed. The definition of each type of effect is provided in Table I.1.
130
Specific recommendations which may enable application of the same evaluation methodology to future projects are discussed in the Final Report of this evaluation study. 131
Dasgupta, 2011 and Stiglitz et al., 2009. 132
Used also as synonymous with wellbeing, as mentioned in the ToR.
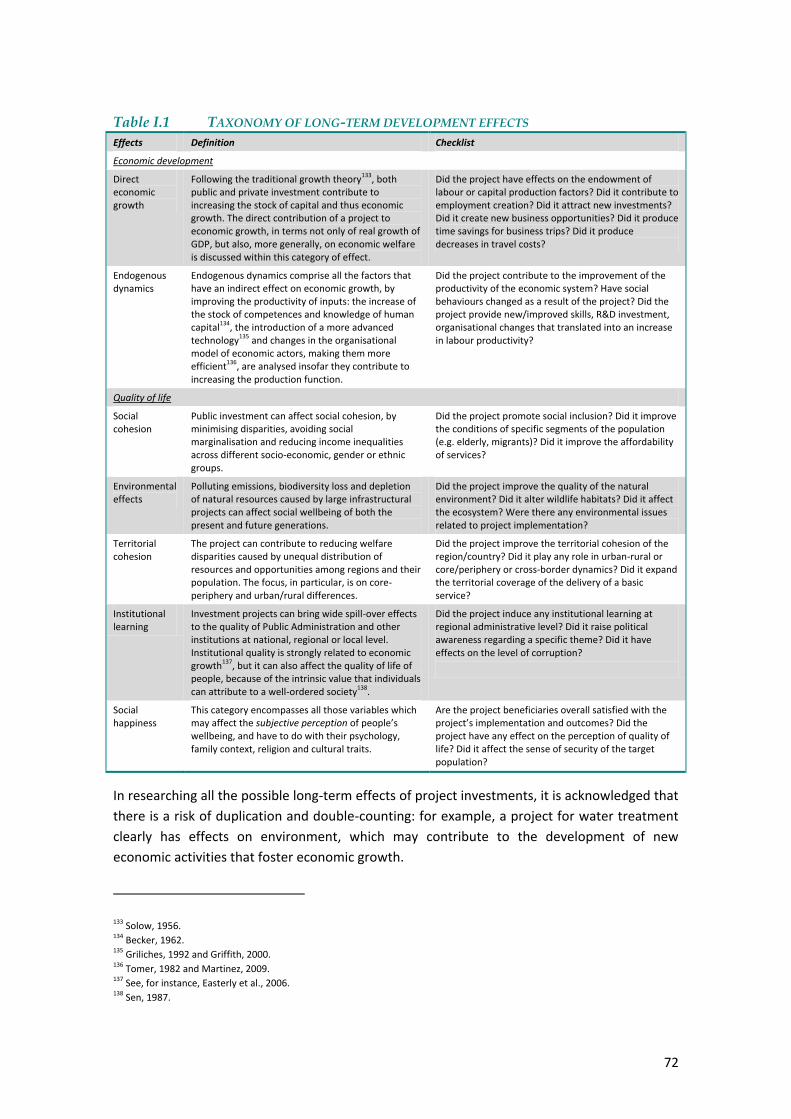
72
Table I.1 TAXONOMY OF LONG-TERM DEVELOPMENT EFFECTS
Effects Definition Checklist
Economic development
Direct economic growth
Following the traditional growth theory133
, both public and private investment contribute to increasing the stock of capital and thus economic growth. The direct contribution of a project to economic growth, in terms not only of real growth of GDP, but also, more generally, on economic welfare is discussed within this category of effect.
Did the project have effects on the endowment of labour or capital production factors? Did it contribute to employment creation? Did it attract new investments? Did it create new business opportunities? Did it produce time savings for business trips? Did it produce decreases in travel costs?
Endogenous dynamics
Endogenous dynamics comprise all the factors that have an indirect effect on economic growth, by improving the productivity of inputs: the increase of the stock of competences and knowledge of human capital
134, the introduction of a more advanced
technology135
and changes in the organisational model of economic actors, making them more efficient
136, are analysed insofar they contribute to
increasing the production function.
Did the project contribute to the improvement of the productivity of the economic system? Have social behaviours changed as a result of the project? Did the project provide new/improved skills, R&D investment, organisational changes that translated into an increase in labour productivity?
Quality of life
Social cohesion
Public investment can affect social cohesion, by minimising disparities, avoiding social marginalisation and reducing income inequalities across different socio-economic, gender or ethnic groups.
Did the project promote social inclusion? Did it improve the conditions of specific segments of the population (e.g. elderly, migrants)? Did it improve the affordability of services?
Environmental effects
Polluting emissions, biodiversity loss and depletion of natural resources caused by large infrastructural projects can affect social wellbeing of both the present and future generations.
Did the project improve the quality of the natural environment? Did it alter wildlife habitats? Did it affect the ecosystem? Were there any environmental issues related to project implementation?
Territorial cohesion
The project can contribute to reducing welfare disparities caused by unequal distribution of resources and opportunities among regions and their population. The focus, in particular, is on core-periphery and urban/rural differences.
Did the project improve the territorial cohesion of the region/country? Did it play any role in urban-rural or core/periphery or cross-border dynamics? Did it expand the territorial coverage of the delivery of a basic service?
Institutional learning
Investment projects can bring wide spill-over effects to the quality of Public Administration and other institutions at national, regional or local level. Institutional quality is strongly related to economic growth
137, but it can also affect the quality of life of
people, because of the intrinsic value that individuals can attribute to a well-ordered society
138.
Did the project induce any institutional learning at regional administrative level? Did it raise political awareness regarding a specific theme? Did it have effects on the level of corruption?
Social happiness
This category encompasses all those variables which may affect the subjective perception of people’s wellbeing, and have to do with their psychology, family context, religion and cultural traits.
Are the project beneficiaries overall satisfied with the project’s implementation and outcomes? Did the project have any effect on the perception of quality of life? Did it affect the sense of security of the target population?
In researching all the possible long-term effects of project investments, it is acknowledged that
there is a risk of duplication and double-counting: for example, a project for water treatment
clearly has effects on environment, which may contribute to the development of new
economic activities that foster economic growth.
133
Solow, 1956. 134
Becker, 1962. 135
Griliches, 1992 and Griffith, 2000. 136
Tomer, 1982 and Martinez, 2009. 137
See, for instance, Easterly et al., 2006. 138
Sen, 1987.

73
The ‘When’ dimension
The temporal dimension of analysis relates to the point in the project’s lifetime at which the
effects materialise for the first time, how they develop over time and whether they have
already stabilised or are still evolving. A clear distinction emerges between short-term and
long-term effects, with the former being the first contributions made by the project and
enjoyed by society after a relatively short time following project completion (about 1-5 years);
the latter, on the other hand, become visible after a longer period of time and tend to stabilise
over many years. It is acknowledged that, given the varying timeframe for different effects to
appear and stabilise, the choice of the time horizon and the timeframe at which the ex-post
evaluation is carried out can significantly affect the results of the evaluation.
The ‘How’ dimension
Project outcomes, i.e. the way projects affect the generation of certain effects and the varying
timeframe for effects to appear and stabilise, are not certain, but result from a non-
deterministic combination of different and interrelated factors. Five stylised determinants of
project outcomes have been identified: appropriateness to the context, project design,
forecasting capacity, project governance and managerial response. Five Working Hypotheses
are related to these dimensions and explain how each of them can influence the generation of
the project’s short or long-term effects (see Table I.2).
The three dimension of analysis are logically interconnected and by combining the ‘What’,
‘When’ and ‘How’ dimensions the evaluator can disentangle the causal chain between the
project’s inputs and the outputs.
METHODOLOGY OF ANALYSIS
The methodology developed to answer the evaluation questions consists of a combination of
quantitative (Cost Benefit Analysis) and qualitative (personal interviews, surveys, searches of
government and newspaper archives, etc.) techniques. Qualitative techniques are probably
better at determining why certain effects are generated, along what dimensions, and
underlying causes and courses of action of the delivery process. The media (including websites
or blogs), in particular, have proved to be an excellent source of evidence identifying or
revealing both objective information and perceptions about the project, thus concurring to
assess the project’s impact on social happiness. At the same time, quantitative data can
provide an important support to test and validate certain findings derived from interviews and
other sources. The most important contribution of the CBA exercise is to provide a framework
of analysis to identify the most crucial aspects of the projects’ ex-post performance and final
outcome139.
139
More details on the approach adopted to carry out the ex-post CBA exercise and, in particular, indications on project identification, time horizon, conversion factors and other features are extensively described in the First Intermediate Report of this evaluation study.

74
Table I.2 KEY DETERMINANTS OF PROJECT OUTCOMES CONSIDERED
Determinant Definition Working Hypothesis Questions to be answered
Appropriateness to the context
Includes the consideration of institutional, cultural, social and economic environment into which the project is inserted.
Context traits can be more or less favourable for project performance and deserve early and careful consideration about which to take or to make.
The terminology of context traits that can be either ‘taken’ (that is, accepted, as they are considered unchangeable) or ‘made’ (by changing existing or creating new traits) is drawn from Hirschman (1967).
Has the (political, cultural, socio-economic, institutional, regulatory) context played a role in influencing the attainment of long-term effects?
Were there any political, social, cultural, economic, regulatory, or institutional constraints to project implementation and performance?
Was the project ‘trait taking’ or ‘trait making’ in its nature? If it was intended to be trait making, did it succeed?
Project design Refers to the technical capacity to design the infrastructure project and to select the best project option.
The technical and engineering capacity to design an infrastructure and to provide the appropriate mechanism for its financial sustainability should be sufficiently disciplined to reduce future risks; at the same time it should leave some degrees of ‘latitude’ to enable adjustments for unforeseen circumstances.
Following Hirschman, latitude is the characteristic of a project that permits the project planner and operator to mould it, or to let it ‘slip’, in one direction or another. Some projects are so structured that latitude is severely restricted or completely absent: in these cases, the project is considered highly ‘disciplined’.
To what extent and in what way did the technical, structural and financial features of the project influence its performance?
Did the option selection process lead to the implementation of the most promising project idea?
Was project design capacity a relevant factor in determining the observed ex-post performance of the project?
Was the project design flexible enough to be adjusted, if needed, to external and unexpected constraints?
Forecasting capacity
Relates to the feasibility and capacity to predict future variables, such as the demand level.
A good initial investment in building the forecasting capacity does not eliminate risks, but it increases the knowledge of the context, improves the project design and optimises the distribution of responsibilities without lowering the commitment to performance.
Were the ex-ante forecasts based on a sound methodology and a comprehensive set of information?
Were some important factors not sufficiently considered ex-ante?
Was the forecasting capacity a relevant factor in determining the observed ex-post performance of the project?
Project governance
Concerns the number and type of stakeholders involved throughout the project cycle and how responsibilities are attributed and shared.
High stakeholder involvement, well-defined roles and responsibilities and incentive mechanisms require commitment of resources and increase the complexity of the decision-making process, which may be subject to particular pressures, but they can favour the project performance and its sustainability over time.
What are the interests and motives of different actors and incentives for decision-making? How did they change over the time-span considered?
Was the ownership of the project clearly identified?
Did contractual arrangements improve the co-ordination of different stakeholders towards achievement-oriented results?
Was project visibility a relevant political incentive to foster proper project implementation? Was the project subject to political or other forms of pressure?
Managerial response
Defined as the managerial and professional ability to react to unforeseen events.
Unpredicted events that occur and undermine the sustainability of the project and its capacity to lead to expected benefits can be overcome by prompt and adequate response from the decision-makers and project managers, driven either by professionalism and experience or by creativity and imagination.
How did the project react to exogenous, unpredictable, events?
What remedial actions were put in place? What mechanisms were used to incentivise proactive responses?
Why were these events unexpected? Was it due to their purely exogenous and ex-ante unpredictable nature? Or, was it due to poor planning capacity?

75
STRUCTURE OF CASE STUDIES AND STANDARD TABLES OF RESULTS
Qualitative and quantitative findings are integrated in a narrative way, in order to develop ten
project ‘histories’ and to isolate and depict the main aspects behind their long-term
performance. All case study reports share the same outline, presented in the following Table:
Table I.3 OUTLINE OF THE CASE STUDY REPORT
SECTION CONTENT
Projects description The first section provides a brief sketch of the unit of analysis. It describes the key structural features of the infrastructure and the service delivered, the context in which it takes place, the target population and the current performance of the project.
Origin and history This section describes the background in which the decision to initiate the project was taken, the need and objectives expected be met and the key stakeholders involved and their role. The section should present a brief chronicle of the main developments after the construction phase and the most recent facts.
Description of long-term development effects
This section should describe the main long-term development effects provided by the project. The seven categories of effects should be considered and for each of them an assessment of the contribution of the project to that specific effect, and the timing of their materialisation and evolution, should be given.
Determinants of project outcomes
The main drivers influencing the performance observed are described and elaborated here. The evaluators should provide their own assessment for each of the five key determinants of project outcomes identified in the conceptual framework.
Conclusions The key messages in terms of lessons learnt are developed here.
Annexes Ex-post cost-benefit analysis report, list of interviewees, other ad hoc analysis if relevant (such as stakeholder mapping).
In order to maintain the structure of all the case study reports as similar as possible, and
facilitate the cross-project analysis of findings, a set of standard tables is used to summarise
the main evaluation results related to three dimensions of analysis (‘What’, ‘When’ and ‘How’).
Section 3 and 4 of each case study include standardised tables in which scores are assigned to
each type of long-term effect and each determinant. Scores ranging from -5 to +5 are given in
order to intuitively highlight which are the most important effects generated for each case
study and which are the most relevant determinants explaining the project outcomes. In other
words, scores are used to rank the effects and determinants, showing which ones are the most
relevant. Moreover, the plus or minus signs indicate the nature of the effects produced by the
project (was the impact positive or negative?) and of the determinant of project performance
(did the determinant positively or negatively contribute to the project outcome?).
The same scores are used to disentangle the project’s impacts on different stakeholders. This
table allows one to better interpret the aggregated score given to each effect, by
understanding on which actor the project impacted the most: for example, a +3 score to
“Direct economic growth” may be reflected by a very high positive effect on the infrastructure
operator (valued, for instance, +5) and a slightly negative effect on other actors (valued -2). As
shown by this example, the aggregate score of each effect and the scores related to different
stakeholders should be consistent with each other and should results from a sort of weighted
average of the impacts on individual stakeholders: an aggregate positive score is inconsistent
with negative impact scores on all the different stakeholders involved.

76
Table I.4 SCORES ON PROJECT’S IMPACT AND DETERMINANTS OF PROJECT OUTCOMES
Score Meaning
+5 Given the existing constraints, the highest positive effects have been generated.
+4 Given the existing constraints, high positive effects have been generated, but more could have been achieved under certain conditions.
+3 Moderate positive effects have been generated, with large scope for further improvement.
+2 Some positive effects have been produced.
+1 Very little, almost negligible, positive effects have been generated.
0 No effects have been generated.
-1 Very little, almost negligible, negative effects have been generated.
-2 Minor negative effects have been produced.
-3 Moderate negative effects have been generated, but they could have been worse.
-4 Highly negative effects have been generated.
-5 The highest negative effects have been generated.
Note: The same scores have been used for assessing both the project’s impacts and determinants. In the first case, they have to be interpreted as the nature and strength of effect generated by the project; in the latter, they indicate the strength of each determinant factor in influencing the project outcomes.
The ‘When’ dimensions results are synthetically presented by means of another table: for each
kind of effect, a score is given to explain how the nature and strength of the impact evolved
over the years, by focusing in particular, on the short-run (approximately 1-5 years after the
project’s completion), the long-run (6-10 years after the project’s completion) and the future
period. The Table contains information that allows the reader to immediately understand
whether the project impacts have already stabilised or not. The meaning of the symbols used
and an example of their application is presented in the following two Tables.
Table I.5 SYMBOLS USED TO DESCRIBE THE TEMPORAL DYNAMICS OF THE EFFECTS
Symbol Meaning
+ or - Positive or negative effect.
++ or -- Positive or negative effects reinforced (in positive or negative direction) with respect to the previous stage.
+++ or --- Positive or negative effects further reinforced (in positive or negative direction) with respect to the previous stage.
+/- Mixed effect, it is not possible to assess whether the impact was positive or negative.
Table I.6 EXAMPLES OF TEMPORAL DYNAMICS OF THE EFFECTS
Short run (years 1-5)
Long run (years 6- 10)
Future years
Comments
+ + + The positive effect stabilised in the short-run.
+ ++ ++ The positive effect stabilised in the long-run.
+ ++ +++ The effect has grown over the years and will increase also in the future.
- + ++ The effect was at first negative; after some years it turned positive and it is still not stabilised yet.
+/- + ++ Effects have been mixed in the initial stage, became positive in the long-run and are expected to further increase in the future.

77
ANNEX II. COST-BENEFIT ANALYSIS
This annex presents the ex-post CBA of the integrated Municipal Solid Waste (MSW) treatment
system for North Lisbon140, operated by
Metropolitana de Lisboa Norte S.A. (Recovery and Solid Waste Management of North Lisbon
Metropolitan Area S.A.), hereinafter Valorsul. It also takes into account the 2010 expansion of
the system on the Merger of Valorsul with the waste management system of West Lisbon
(Resioeste - Valorização e Tratamento de Resíduos Sólidos, S.A.), hereinafter Resioeste141, as it
affects the infrastructures which are the subject of this evaluation.
The purpose is to quantitatively assess the performance of the project. The methodology
applied is in line with the technical note provided in the First Interim Report and, more
generally, with the EC Guide (European Commission, 2008). This annex presents in more detail
the assumptions, inputs and results of the CBA, along with scenario and risk analysis.
METHODOLOGY, ASSUMPTIONS AND DATA GATHERING
The CBA incorporates the following assumptions:
Project identification
The unit of analysis comprises all the activities carried out by Valorsul, specifically at
the following infrastructures:
o A modern engineered landfill in the municipality of Vila Franca de Xira, with
flaring of methane (CH4) to minimise global warming impact. In 2011 Valorsul
commenced burning this methane to generate electricity.
o A Waste-to-Energy (WtE) plant, in the municipality of Loures142, which burns
municipal waste to generate electricity.
o An incineration bottom ash treatment facility143, to recover ferrous and non-
ferrous metals for recycling, located in Vila Franca de Xira.
o Construction of a stretch of public road connecting Loures and the municipality
of Lisbon, to facilitate access to the WtE plant.
140
Comprising the municipalities of Lisbon, Amadora, Loures and Vila Franca de Xira. 141
Resioeste served 14 municipalities - Alcobaça, Alenquer, Arruda dos Vinhos, Azambuja, Bombarral, Cadaval, Caldas da Rainha, Lourinhã, Nazaré, Óbidos, Peniche, Rio Maior, Sobral de Monte Agraço e Torres Vedras – with a total population of 403,000. 142
Since the WtE plant has been in operation, the key function of the landfill has been to act as a backup for when the Waste-to-Energy Plant is not available, and for the disposal of non-hazardous incineration ash not usable for other purposes. The Valorsul 2011 Financial Report indicates that in 2011 approximately 47% of the material deposited in the landfill was inert incineration ash. 143
Hazardous fly ash (ash removed from the emissions to air from the WtE plant), which represents 3-4% the
weight of MSW incinerated, is channelled to the National System of hazardous waste.

78
o Provision of trucks to the municipalities to assist implementation of separate
collection of the recyclable elements of MSW (e.g. paper, cardboard, glass,
metal and plastic) and of the biodegradable fraction.
o A Materials Recovery Facility (MRF) and bring centre for sorting recyclable
streams, in the municipality of Lisbon.
o An Anaerobic Digestion (AD) Plant, which accepts the organic fraction of MSW
and converts it into compost and biogas, which is then burned to generate
electricity, located in Amadora.
In addition, the project involved sealing and rehabilitation of uncontrolled dumps in
Vale Forno and Sta Iria de Azoia144.
It can thus be seen that Valorsul comprises an integrated and comprehensive system
for the processing of MSW in its catchment area (see Figure 1.3 of main report).
Valorsul does not undertake waste collection itself; this remains the responsibility of
the respective municipalities, although Valorsul has provided trucks to the
municipalities to facilitate separate collection.
A question arises, regarding how to deal with the merger with Resioeste in 2010. With
this merger, the system was expanded to incorporate a further 14 municipalities,
along with a number of infrastructure facilities, namely:
o Sanitary Landfill in Cadaval;
o Separate collection of MSW streams in the region;
o Sorting Plant in Cadaval;
o Mechanical Biological Treatment (MBT) plant in Leiria.
Resioeste has also closed and rehabilitated a number of uncontrolled dumps in the
region, over the years, and has received CF co-funding.
On the one hand, one could incorporate all of Resioeste from 2010 onwards, but one
would have to also include its infrastructure. What then of its pre-merger operations
(volumes treated, revenues, costs)? On the other hand, one cannot simply ignore the
merger, as it impacts significantly on the future financial and economic viability of
Valorsul. Our solution was to include only:
(i) The infrastructure for the ‘original’ Valorsul;
(ii) The amount of waste from the Resioeste system that is/will be treated in the
‘original’ Valorsul infrastructure.
144
In subsequent years, Valorsul also closed and rehabilitated old landfills at Carenque, Montemor and Boba, in an ERDF-funded project. However, this is not included in the current project (as also explained in Section 1.1).

79
(iii) The ‘original’ Valorsul’s operating costs and revenues, as adjusted for the
increased volumes treated in the future.
Thus, we ignore the waste streams from the Resioeste system that continue to be
treated in Resioeste infrastructure, along with all the related costs and benefits.
On this basis, the total capital cost incurred up to and including 2010 is summarised in
Table II.1. In current prices, total capital cost amounted to EUR 268.6 million; in
constant 2011 prices, it amounts to EUR 366 million. A fuller description of the project
is presented in Section 1 of the main report.
Table II.1 CAPITAL EXPENDITURE (EUR THOUSAND, CURRENT PRICES)*
Initial Investment
Subsequent Investments
Total
Investments
Building 4,226 0 4,226
Waste to Energy plant - Loures 153,810 18,944 172,754
Sanitary Landfill - Mato da Cruz (Vila Franca de Xira) 10,111 12,413 22,524
Anaerobic Digestion plant - Amadora 0 29,429 29,429
Sorting Plant - Lisbon 7,519 6,256 13,775
Bottom Ash recovery plant - Vila Franca de Xira 2,021 511 2,532
Selective waste collection (vehicles) 7,061 10,392 17,453
Initial capital for concession and closure & rehabilitation of dumps at S. Iria/Vale do Forno
5,888 0 5,888
Total 190,636 77,945 268,581
*Valorsul only, excluding Resioeste;
Source: Valorsul
Time horizon
The time horizon has been set at 30 years for all the project case studies. This means
that the timeframe for the CBA of the Valorsul project spans from 1996 (year zero), the
year in which construction of the first element of the project – the landfill –
commenced, to 2026 (year 30). Since the perspective of the analysis is 2011, it
presents a mix of historical and forecast data. Actual historic data are available up to
and including 2011.
Constant prices
The analysis is carried out in constant 2011 Euros. The latest year for which actual
financial data are available is 2011 (for the merged entity). Data from 2012 onwards
are estimated in real terms (2011 prices, no inflation), while available data up to and

80
including 2010 are historical and therefore have been inflated to convert them to 2011
Euro145.
Discount rates
Discount rates are as per the guidance in the First Interim Report. The financial
discount rate is 5.0% real for both backward and forward analysis. In the economic
analysis, specific social discount rates for Portugal for past and the future periods have
been calculated. A real backward social discount rate of 4.2% and a real forward social
discount rate of 2.9% have been used.
Counterfactual scenario
All cash flows are incremental against a ‘do nothing’ scenario, i.e. a continuation of the
position pre-Valorsul. However, this ‘do-nothing’ option was not considered tenable,
as it would involve a continuation of uncontrolled and illegal dumping of waste and
unacceptably poor environmental standards.
Therefore, we considered a ‘do minimum’ option, whereby all waste is disposed of in a
single large modern landfill, located at Vila Franca de Xira (where the current Valorsul
landfill is located). This is situated approximately 13 km north of the WtE plant, in a
relatively sparsely populated area, and hence it was considered feasible to locate this
very large landfill there.
We have assumed that no recycling, anaerobic digestion or other treatment of waste
would be undertaken146; landfill gas would be flared but not used to generate
electricity.
The capital investment required for this option is based on a grossing up of the known
landfill development cost, pro rata with the additional volumes that would need to be
catered for. No economies of scale in the construction or operation are considered,
which is conservative, but the existing actual landfill is quite large, and it may be that
most economies of scale were exhausted in its sizing. We have assumed that the
capital expenditure is incurred over a period of 20 years, starting in 1996 (Year 0).
We are not in a position to separate the actual operating costs of Valorsul’s landfill
from its WtE plant and other facilities, but we can make an estimate, allocating costs
pro rata with staffing levels (in 2010, the landfill employed 8.5% of Valorsul’s total
staff).
145
Inflation of historic prices has been done using the yearly average percentage variation of consumer prices provided by the International Monetary Fund (IMF). With regard to construction costs and transport costs, we have used the Euroconstruct construction deflator for Portugal (www.euroconstruct.org), and the Portuguese transport price inflation index (source www.ine.pt), respectively, as these should more accurately reflect actual inflation experience for these categories of expenditure. 146
Pre-Valorsul, it is estimated that some 5% of MSW was recycled, but for convenience we assume all waste goes to landfill in the counterfactual.

81
We have further assumed that gate fees per tonne in the landfill would be sufficient
for the infrastructure to breakeven on a financial basis (given a cost of capital of 5%
real), and that no other revenue would be earned. On this basis, the gate fee would
average EUR 39.65/tonne (2011 money), considerably greater than the actual landfill
gate fee in place currently (EUR 25.70/tonne, see Table II.2). The setting of gate fees in
Valorsul is discussed in more detail later.
We also assume that EU grant aid rate would not be available for this counterfactual
project, as it is unlikely that the EU would co-fund such a project.
Net additional transport costs and related environmental costs are included in the
indirect/external costs of this facility, to reflect the additional 13 km to be travelled by
waste trucks to access the landfill compared to the WtE plant147.
An alternative counterfactual scenario, whereby each municipality would operate its
own modern landfill, might also be feasible. On the one hand, transport costs would be
lower, but on the other hand economies of scale might be lost, and it might not be
optimal for a densely populated municipality such as Lisbon to build a modern
municipal landfill within its own territory. On balance, we believe the counterfactual as
set out above is a reasonable one against which to judge the project.
It should be noted that the counterfactual does not take into account the implications
for Portugal of not meeting the terms of the Landfill Directive (99/31/EC), which
requires a significant and progressive redirection of biodegradable waste away from
landfill over the coming decade (targets to be met in 2010, 2013 and 2016). Failure to
achieve these targets leaves Portugal open to potentially significant fines from the EU.
One might argue that, because the counterfactual as set out above is not compliant
with EU legislation, it should not be used in our analysis. However, the purpose of the
counterfactual is to have a physically feasible basis for comparison of the costs and
benefits of ‘Do Project’, rather than present a fully realisable (politically as well as
physically) alternative project per se.
147
Strictly speaking, we should include all transport costs incurred in both ‘Do Project’ as well as ‘Do Minimum’ in the economic analysis (but not the financial analysis), because they are part of the necessary costs of waste management, regardless of the fact that they are not incurred by Valorsul. However, we do not know the transport costs incurred by the municipalities under ‘Do Project’, so as a second best we include an estimate of the additional transport costs only in the counterfactual.

82
Table II.2 TARIFFS FOR THE VALORSUL WTE PLANT AND LANDFILL, 2012
Type of Service Facility Municipalities Private bodies
Discharge of MSW WtE 22.31 EUR / (t) 53.84 EUR/ (t)
Landfill 25.70 EUR/ (t) 57.23 EUR/ (t)
Destruction of MSW (fixed rate) WtE 132.58 EUR / day 136.03 EUR / day
Landfill 132.58 EUR / day 136.03 EUR / day
Destruction of MSW (variable rate) WtE 135.46 EUR / (t) 164.44 EUR / (t)
Landfill 138.85 EUR / (t) 169.83 EUR / (t)
Notes: All rates shown are inclusive of waste management tax (Taxa de Gestão de Resíduos) and “aggravation” waste management tax (Agravamento TGR), which amount to EUR 1.11/tonne and EUR 0.23/tonne respectively for the WtE Plant, and EUR 4.15/tonne and EUR 0.58/tonne respectively for the Mato Da Cruz landfill. Destruction of waste relates to specific materials, which, mainly for legal or fiscal reasons, must be destroyed before being incinerated (e.g. apprehended counterfeit goods, drugs, special foods, etc.) The vast bulk of gate fees are in respect of discharge of waste by municipalities.
Source: http://www.valorsul.pt/pt/clientes/quanto-custa-depositar-os-residuos-na-valorsul.aspx as of 20.02.12.
Data sources
The primary source of data was Valorsul’s annual financial reports (2006-2011) and
annual environmental sustainability reports (2006-2010), available on Valorsul’s
website148. Attempts to access earlier reports in these series failed. From these reports
we were able to identify the volumes of waste processed in each year in each
infrastructure, since the commencement of Valorsul. Waste volumes processed by
Resioeste, as well as those transferred from Resioeste to Valorsul infrastructure, were
also available for 2009, 2010 and 2011. The full record of capital expenditure and
funding sources was also provided by Valorsul, including Resioeste’s expenditure. As
indicated above, we are ignoring Resioeste’s financial data, and its volumetric data
except insofar as it supplies waste material to the ‘original’ Valorsul infrastructure.
However, financial operating data could only be identified for the years 2005-2011
(including Resioeste from 2009149). Estimates of income and expenditure for the years
1998-2004 had to be generated based on the relationships between volumetric and
monetary data for the years 2005-2011.
Environmental data on emissions to air from the Valorsul landfill and the WtE plant
were only available for 2007-2009 (with limited data for 2010), and these also had to
be used to backcast estimates for previous years.
At a more general level, the usual economic and demographic data are available,
including population census data for 1991, 2001 and 2011. In particular, population
148
http://www.valorsul.pt/pt/biblioteca/relatorios/artigo-1.aspx 149
The 2009 Annual Report included the ‘original’ Valorsul only. In the 2010 and 2011 reports, data for the merged entity are presented, including restated data for 2009, in accordance with generally accepted accounting principles for merged entities.
83
and GDP data were available for the Lisbon NUTS II region, which incorporates the
territory of both Valorsul and Resioeste.
Residual Value
The civil engineering elements of built assets are taken to have a useful life of fifty
years, and this useful life is assumed to depreciate on a straight-line basis. As of
project year 30, the undepreciated residual value of these assets is credited back to
the project. Land is taken to have an infinite life and thus its residual value is the same
as its purchase price. All machinery and equipment is taken to have a NIL value at year
30.
FUTURE SCENARIO
This CBA is a combination of an ex-ante and an ex-post analysis, since the time horizon covers
16 years in the past (1996-2011), for which (albeit incomplete) historical data are available and
15 years in the future (2012-2026). Some hypotheses have to be made on the future trend of
waste volume variables. Our approach is as set out below.
We found that there was a close historic relationship between aggregate GDP in the Lisbon
NUTS II region and the volume of waste processed by the Valorsul system. We estimated this
relationship using a simple regression equation.
We have assumed that the population of Lisbon and of Portugal will continue to grow at the
modest rates recorded between 2001 and 2011 (-0.15% per annum and 0.19% per annum
respectively).
With regard to economic forecasts, Eurostat estimates that Portuguese GDP fell by 2.2% in
2011150. The IMF’s long term GDP forecast for Portugal151 predicts a further contraction of 3.0%
in 2012, followed by stabilisation in 2013 and a return to modest growth of approximately 2%
per annum thereafter. We assume that the Lisbon region economy will grow at the same pace
per capita (historically, Lisbon’s GDP has grown at a somewhat faster pace, see Figure 2.1 in
the main report). This allows us to forecast future GDP in the region, and via the regression
equation, to forecast future waste volumes.
It is then assumed that the percentage split of volumes to each treatment stream remains
constant, except in one respect: in future, a proportion of the stream of waste going to landfill
in the Resioeste region will divert to the WtE plant at Loures152, to match the actual proportion
diverted in 2011 (17.5% or approximately 31,000 tonnes). This reflects the rationale of the
merger, to guarantee a flow of material to the WtE plant and hence protect the electricity
generation income stream. This is the only element of Resioeste that is included in our CBA. To
150
http://epp.eurostat.ec.europa.eu/tgm/table.do?tab=table&init=1&plugin=1&language=en&pcode=tsieb020 151
IMF Country Report No. 11/363, p.37 http://www.imf.org/external/pubs/ft/scr/2011/cr11363.pdf 152
Resioeste’s future volumes and the waste it supplies to the WtE plant are expected to grow in line with those in the ‘original’ Valorsul.

84
maintain comparability, under the counterfactual scenario, we assume that this same volume
of Resioeste waste is disposed of in the Vila Franca de Xira landfill going forward.
FINANCIAL ANALYSIS
Sources of financing
The Valorsul project was initially financed via a combination of CF funding, EIB and commercial
banking finance, and Valorsul’s own equity. Subsequent investments over the years have been
financed largely through internal cashflow and commercial borrowing. These are summarised
in Table II.3.
Table II.3 FUNDING SOURCES FOR CAPITAL COST TO DATE (CURRENT EUR
THOUSAND)*
Initial Investment
Subsequent Investments
Total %age Split
Total Investment cost (see Table II.1 for breakdown) 190,636 77,945 268,581 100.0%
Funded by
Cohesion Fund 92,108 8,300 100,408 37.4%
EIB Loan 92,278 0 92,278 34.4%
Equity/Commercial loans/internal cash flow 6,250 69,645 75,895 28.3%
%age Non-EU funding 51.7% 89.4% 62.6%
*Valorsul only, excluding Resioeste; **Valorsul’s paid up share capital totals EUR 22.5 million (growing to EUR 25.5 million on the merger with Resioeste). ‡ Valorsul management indicates that the EIB loan was applied for and granted in 1996, although it was split into 2 contracts, the second of them signed in 1998. The disbursements took place between 1997 and 2002, to be repaid over the period to 2016.
Source: Valorsul
Overall, the CF has contributed 37% of total capital expenditure. A further 34% has been
financed by the EIB; the balance of 28% has been financed by equity (i.e. the Portuguese public
sector), internal cash flow and commercial borrowings.
Operating cost and revenues
Operating costs are drawn from the Valorsul annual financial reports. Table II.4 summarises
the position in 2009 (the last year for which separate financial data for the ‘original’ Valorsul
are available):

85
Table II.4 OPERATING COSTS 2009, VALORSUL (CURRENT EUR THOUSAND)*
EUR Thousand %age Split
Payroll 11,487 32.1%
Non-payroll 21,618 60.4%
Concession fee & other payments to Exchequer** 876 2.4%
Interest payments to EIB 2,391 6.7%
Other net interest payments -562 -1.6%
Total 35,810 100.0%
*Valorsul only, excluding Resioeste; ** excluding profits taxes.
Source: Valorsul
Depreciation, amortisation and profits taxes are not included. Note also that the cost of
collecting waste is not included, since the municipalities are responsible for collection (albeit
Valorsul has bought trucks for the municipalities to facilitate separate collection of waste
streams, and the cost of these is included in the project’s capital costs).
Revenues are likewise derived from the Valorsul financial reports. Table II.5 summarises
revenues in 2009 (the last year for which unmerged data are available).
Table II.5 REVENUE 2009, VALORSUL (CURRENT EUR THOUSAND)*
EUR Thousand %age Split Related Volumes
Gate fees** 18,110 34.0% 723,562 tonnes
Electricity sales 24,034 45.1% 296,763 mWh
Sale of Recyclables 9,396 17.6% 68,504 tonnes
Other 1,760 3.3%
Total 53,300 100.0%
Average Gate Fees EUR per Tonne ** 25.03
Electricity Selling Price EUR per kWh 0.081
*Valorsul only, excluding Resioeste; **WtE plant and landfill combined.
Source: Valorsul
Electricity sales are the largest element of revenue, contributing 45% of the total. Gates fees
contribute a further 34% while recyclables sales contribute 18%. The electricity tariff (average
8.1c/kWh) is key to the financial viability of the system, and is reflective of the renewable
characteristics of the source (incineration of MSW, anaerobic digestion of biodegradable MSW
and landfill gas153). For comparison, a modern Portuguese gas-fired powergen plant in 2010
earned on average EUR 0.0525/kWh electricity export charge154, tentatively indicating a price
premium of over 50%%155 for Valorsul.
153
The vast bulk of the revenue comes from the incinerator electricity sales. 154
With a further average EUR 0.0163 capacity charge; http://www.turbogas.pt/fotos/gca/rc_en_130495022319382528024dc7f5cf8b095.pdf 155
The pricing of electricity is not straightforward, and can reflect among other things despatchability, place in the merit order (whether or not the generator is base load), and other factors. Hence the estimate above must be treated as tentative.

86
On this basis, earnings before taxes, depreciation and amortisation (EBTDA) in 2009 amounted
to approximately EUR 17 million. Gate fees are set at a rate that allows Valorsul to make a
modest surplus156 (accumulated profits and other reserves to end 2009 are approximately EUR
22 million). See further discussion later on.
As indicated above, the latest financial data available for the ‘original’ Valorsul relate to 2009.
However, we do have separate volumetric data (tonnages) up to 2011, and used this to
estimate financial values for 2010 and 2011, which are then uplifted to 2011 prices.
With regard to future financial variables, we assume that all prices, wages, etc., remain at 2011
levels, and we then use our future volumetric forecasts as a basis for forecasting financial data.
We are mindful that the EIB loan is to be repaid in full by 2016, and we assume that no
additional financing is required to replace it, i.e. that this cost element is run down and
eliminated by 2016.
Results of Financial Analysis
Using the cost-benefit methodology described above, we calculated:
the Financial Net Present Value and the Financial Rate of Return on investment –
FNPV(C) and FRR(C), and
the Financial Net Present Value and Financial Rate of Return on national capital –
FNPV(K) and FRR(K), i.e. net of EU grant aid.
The results are presented in Table II.6 (detailed tables at back of Annex)157.
Table II.6 FINANCIAL ANALYSIS OF VALORSUL PROJECT
FNPV(C)
EUR million
FRR(C) FBCR(C)
Investment Return -122 3.6% 0.93
FNPV(K)
EUR million
FRR(K) FBCR(K)
National Return 148 7.4% 1.11
The table confirms that, on a purely financial basis, the project as an investment would not
have been viable, and required grant aid. NPV(C) of the project is EUR -122 million. With
external grant aid, it generates a positive financial return on national capital of EUR 148 million
or 7.4%.
156
This implies ‘cost plus’ pricing, which in a monopoly situation may not be economically efficient. 157
The ‘Do Minimum’ option is not presented here, as our methodology sets the financial NPV for this at NIL.

87
ECONOMIC ANALYSIS
Having assessed the purely financial performance of the project, the next step is to consider the project from a socio-economic viewpoint. This involves:
conversion of market prices to accounting (true economic or shadow) prices, and
inclusion of external costs and benefits.
The methodology used here mirrors that used in the evaluation of the Sogama project in
Galicia, Spain, as part of the wider evaluation project.
FROM MARKET TO ACCOUNTING PRICES
Financial Costs and Benefits
In the economic analysis all input data are converted from financial to shadow prices, in order
to reflect their opportunity costs. The conversion factors defined in the First Interim Report
have been applied, namely:
Table II.7 SHADOW PRICE CONVERSION FACTORS
Resource Conversion Factor Source
Land 0.994 1st Interim Report, Volume 1, Table AII.8
Labour 0.97 1st Interim Report, Volume 1, Table AII.13
Traded goods & Services 0.994 1st Interim Report, Volume 1, Table AII.8
Non-traded goods & Services 0.994 1st Interim Report, Volume 1, Table AII.8
Other 0.994 1st Interim Report, Volume 1, Table AII.8
Public funds 1.00 EU Commission 2008 Guide to CBA, p.54.
In the case of the revenues from the sales of recyclables, the standard conversion factor of
0.994 was applied.
Identifying the appropriate shadow prices to apply to the other main categories of revenue –
electricity sales and gate fees - requires some consideration, as the markets in which they are
sold are to a large degree regulated by the public sector. As indicated above, the electricity
tariffs are set by reference to the electricity’s “green credentials”, and are significantly higher
than the normal market price. Gate fees are effectively set in consultation with the
municipalities, to allow Valorsul to generate a modest financial surplus.
We have indicated that Valorsul earns a premium on electricity sales, reflecting the (partially)
renewable characteristics of the fuel sources. In order to estimate the shadow price of
electricity sales, one can consider the long-run marginal costs of energy production in the
Iberian market (the Spanish and Portuguese energy markets are integrated) of the energy
88
source that is “displaced” by the electricity generated and exported by Valorsul. It is
reasonable to work on the basis that this electricity substitutes pro rata with the typical
production mix for electricity in the Iberian Peninsula.
However, given the difficulty of finding data on electricity generation costs for Spain and
Portugal, another method has been applied. The weighted average price of electricity in Spain
and Portugal was considered, assuming that the energy sale price equals the production cost.
These data are provided by the Quarterly Reports on European Electricity Markets158 of the
European Commission, which indicate for the period January-September 2011 (the latest
available) a weighted average price of EUR 52.89 per MWh (i.e. 5.289c/KWh). This is used as
the shadow price of Valorsul’s electricity production. It is notably lower than the actual
electricity tariff paid, averaging over 8c/KWh.
That leaves the shadow gate fees for the landfill and the incinerator. The actual gate fees are
effectively set as a “residual”, after electricity revenue is taken into account, and we have
ascertained above that Valorsul earns a significant price premium on electricity sales. This
would be justifiable if the emissions characteristics of Valorsul’s electricity relative to those of
“conversional” electricity generation in the Iberian Peninsula were sufficiently positive.
However, as will be seen in the discussion below on externalities, this is not the case.
The implication is that Valorsul’s gate fees are underpriced, indeed, that the electricity tariff
regime is subsidising Lisbon’s waste management system159, in contravention of the “polluter
pays” principle.
What then are the appropriate shadow prices to use? These should reflect the true economic
opportunity cost of the landfill and WtE services provided by Valorsul, including the relevant
externalities. However, we estimate the externalities separately below, so for the moment we
can ignore them.
In evaluating the counterfactual, we estimated that a breakeven price for landfill usage was
approximately EUR 40/tonne, and for convenience we use this as the shadow price of
landfill160.
Estimating a shadow price for the incineration service is not straightforward. While estimates
can be made of its operating costs, the WtE plant is operationally a mixture of waste
management and electricity production, with an income stream for each. Where does one
operation (and its costs) finish and the other start? In principle they may not be separable. An
alternative approach is to try to identify the appropriate price from average levels elsewhere.
For instance, we understand that the gate fee at the other MSW WtE plant on the Portuguese
158
http://ec.europa.eu/energy/observatory/electricity/electricity_en.htm 159
A complaint made by at least one Portuguese NGO in the past (http://www.endseurope.com/8375/portugal-quotillegally-subsidising-incinerationquot?referrer=search). 160
Valorsul’s Financial Report for 2010 notes that Resioeste enjoyed a significant reduction in gate fees, from EUR 38.49/tonne to EUR 22.86/tonne, when it merged with Valorsul (page 80).
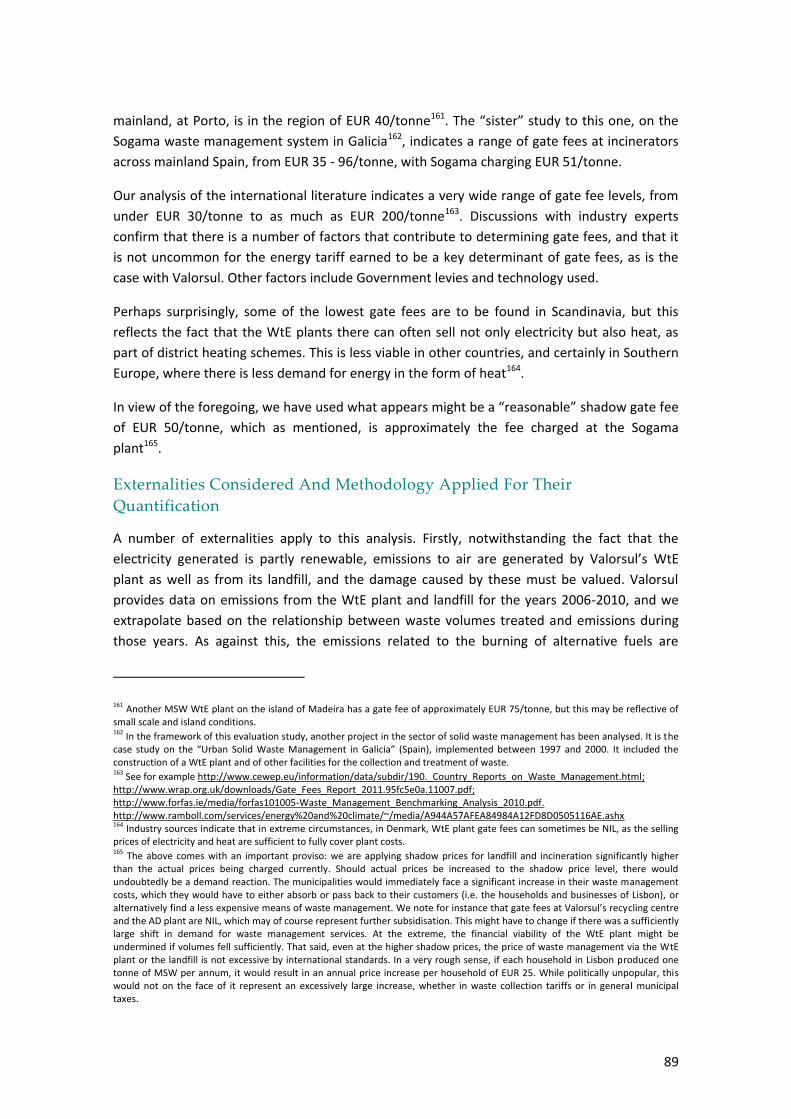
89
mainland, at Porto, is in the region of EUR 40/tonne161. The “sister” study to this one, on the
Sogama waste management system in Galicia162, indicates a range of gate fees at incinerators
across mainland Spain, from EUR 35 - 96/tonne, with Sogama charging EUR 51/tonne.
Our analysis of the international literature indicates a very wide range of gate fee levels, from
under EUR 30/tonne to as much as EUR 200/tonne163. Discussions with industry experts
confirm that there is a number of factors that contribute to determining gate fees, and that it
is not uncommon for the energy tariff earned to be a key determinant of gate fees, as is the
case with Valorsul. Other factors include Government levies and technology used.
Perhaps surprisingly, some of the lowest gate fees are to be found in Scandinavia, but this
reflects the fact that the WtE plants there can often sell not only electricity but also heat, as
part of district heating schemes. This is less viable in other countries, and certainly in Southern
Europe, where there is less demand for energy in the form of heat164.
In view of the foregoing, we have used what appears might be a “reasonable” shadow gate fee
of EUR 50/tonne, which as mentioned, is approximately the fee charged at the Sogama
plant165.
Externalities Considered And Methodology Applied For Their
Quantification
A number of externalities apply to this analysis. Firstly, notwithstanding the fact that the
electricity generated is partly renewable, emissions to air are generated by Valorsul’s WtE
plant as well as from its landfill, and the damage caused by these must be valued. Valorsul
provides data on emissions from the WtE plant and landfill for the years 2006-2010, and we
extrapolate based on the relationship between waste volumes treated and emissions during
those years. As against this, the emissions related to the burning of alternative fuels are
161
Another MSW WtE plant on the island of Madeira has a gate fee of approximately EUR 75/tonne, but this may be reflective of small scale and island conditions. 162
In the framework of this evaluation study, another project in the sector of solid waste management has been analysed. It is the case study on the “Urban Solid Waste Management in Galicia” (Spain), implemented between 1997 and 2000. It included the construction of a WtE plant and of other facilities for the collection and treatment of waste. 163
See for example http://www.cewep.eu/information/data/subdir/190._Country_Reports_on_Waste_Management.html; http://www.wrap.org.uk/downloads/Gate_Fees_Report_2011.95fc5e0a.11007.pdf; http://www.forfas.ie/media/forfas101005-Waste_Management_Benchmarking_Analysis_2010.pdf. http://www.ramboll.com/services/energy%20and%20climate/~/media/A944A57AFEA84984A12FD8D0505116AE.ashx 164
Industry sources indicate that in extreme circumstances, in Denmark, WtE plant gate fees can sometimes be NIL, as the selling prices of electricity and heat are sufficient to fully cover plant costs. 165
The above comes with an important proviso: we are applying shadow prices for landfill and incineration significantly higher than the actual prices being charged currently. Should actual prices be increased to the shadow price level, there would undoubtedly be a demand reaction. The municipalities would immediately face a significant increase in their waste management costs, which they would have to either absorb or pass back to their customers (i.e. the households and businesses of Lisbon), or alternatively find a less expensive means of waste management. We note for instance that gate fees at Valorsul’s recycling centre and the AD plant are NIL, which may of course represent further subsidisation. This might have to change if there was a sufficiently large shift in demand for waste management services. At the extreme, the financial viability of the WtE plant might be undermined if volumes fell sufficiently. That said, even at the higher shadow prices, the price of waste management via the WtE plant or the landfill is not excessive by international standards. In a very rough sense, if each household in Lisbon produced one tonne of MSW per annum, it would result in an annual price increase per household of EUR 25. While politically unpopular, this would not on the face of it represent an excessively large increase, whether in waste collection tariffs or in general municipal taxes.

90
avoided, and a benefit derives from this. Table II.8 summarises the values per tonne we have
placed on emissions.
Table II.8 DAMAGE COSTS OF EMISSIONS (2011 EUR)
Gases EUR 2011 price per kg
Source
Non biogenic CO2 0.025 European Commission, 2008 (CBA Guide) and 1st Interim report.
CH4 - methane 5.50 Average computed on the basis of European Commission, 2001
SO2 – sulphur dioxide 7.74 OECD: http://www.oecd.org/dataoecd/32/41/2053990.pdf
Particulates 9.55 OECD: http://www.oecd.org/dataoecd/32/41/2053990.pdf
NOx - nitrogen oxides 11.62 OECD: http://www.oecd.org/dataoecd/32/41/2053990.pdf
Hg - mercury 38,440 European Commission: http://ec.europa.eu/environment/waste/studies/pdf/ econ_eva_landfill_report.pdf
Dioxins 22,558,397 European Commission: http://ec.europa.eu/environment/waste/studies/pdf/ econ_eva_landfill_report.pdf
A review of the environmental costs of landfills was carried out by the European Commission
(2000). The anaerobic decomposition of biodegradable waste in landfills generates gas, whose
quantity and quality vary over time. Landfill gas is composed of methane (CH4 - approximately
55%) and carbon dioxide (CO2 – approximately 45%)166. In managed landfills, biogas is collected
and used to generate electricity or at least flared, so as to minimise the environmental impact
(CH4 is a highly potent greenhouse gas [GHG])167. In the Valorsul landfill gas flaring has been
used for a number of years, and electricity generation from this burning commenced in 2011.
However, even in well-managed landfills a proportion of landfill gas is not captured and
escapes to the atmosphere. European Commission (2000) indicates that the recovery
efficiency of methane at modern landfills ranges from 40% to 90%.
As far as the CO2 emissions (including those from flared/burned methane) are concerned, in
general one can disregard these, as they derive from biogenic sources168. For the purpose of
this CBA, therefore, CO2 emissions from landfill are not valued, while the damage cost of
methane is valued.
The environmental damage caused by the methane emitted, whose amount depends on the
volume of waste deposited in the landfill over time, is valued at EUR 550 per tonne (2011
166
Landfill gas contains also a small percentage of trace gases. 167
In the combustion process methane is oxidised to water and CO2. Very low volumes of pollutants not previously present in the biogas are also formed, such as dioxins, HCl and NOx. 168
Fossil-based carbon deposited to MSW landfills is mainly in the form of plastics, and would only decompose in the very long term.

91
prices), which reflects values found in the literature169, but would grow in line with the forecast
growth in the damage costs of CO2.
A feature of landfills is that they will continue to generate emissions for a long period, even
after waste is no longer being deposited to them. For current purposes it is assumed that the
methane emissions will continue for a further 10 years after our period of evaluation; thus the
residual damage costs of these subsequent emissions are included at the end of the evaluation
time horizon.
Other negative externalities usually considered for landfills are in terms of disamenity impacts
as a result of noise, dust, litter and odours close to the dumping site, and the risk of accidents.
Undesirable wildlife can also be an issue (rats, birds, etc.). However, these are difficult to
evaluate, and we are forced to leave them unvalued (in any event they are likely to be similar
for both ‘Do Project’ and the counterfactual).
A proportion of the WtE plant’s CO2 emissions which are anthropogenic (estimated at 60%170)
must likewise be valued, in accordance with the guidance in the First Interim Report (base case
value/tonne in 2000 equals EUR 10, rising to EUR 25 in 2010, EUR 40 in 2020 and EUR 55 in
2030, all in 2011 prices).
With regard to the electricity generated at the WtE and AD plants, we must also give credit for
the saving of emissions that would have been caused by an alternative mix of energy sources.
The energy production mix in the integrated Iberian market (Portugal and Spain) has been
calculated171, and the corresponding emissions avoided as a result of the amount of energy
produced by Valorsul are quantified172. Based on these and the damage costs per Table II.8, we
can place a value on the emissions avoided as a result of the electricity generated by
Valorsul173.
Under the counterfactual, we must:
Gross up the landfill-related emissions to reflect the higher volumes, a key result of
which is a large increase in the volume of methane emissions recorded, and the
resultant damage costs.
169
According to European Commission (2001), for example, the damage cost of the methane ranges between EUR 528 per tonne to EUR 867.5 per tonne. 170
http://www.ipcc-nggip.iges.or.jp/public/gp/bgp/5_3_Waste_Incineration.pdf. 171
The Spanish and Portuguese production mix has been estimated on the basis of Red Eléctrica de España (2010) (http://www.ree.es/sistema_electrico/pdf/infosis/Avance_REE_2010.pdf) and Rede Eléctrica Nacional (2010) (http://www.centrodeinformacao.ren.pt/PT/publicacoes/CaracterizacaoRNT/Caracteriza%C3%A7%C3%A3o%20da%20RNT%2031-12-2009.pdf). The source for the emissions for each powergen plant is the Database on life cycle emissions for electricity and heat generation technologies per CASES, 2008 (http://www.feem-project.net/cases/links_databases.php). 172
Per CASES (2008). 173
It is of interest to compare the estimated valuation of the emissions from the WtE plant with that of the emissions avoided through the replacement of electricity generated from “conventional” sources. We estimate these values at 4.9c/kWh and 3.2c/kWh respectively. In other words, Valorsul’s WtE plant generates more emissions per kWh of electricity than does the average conventional powergen plant on the Iberian Peninsula. However, as stated already, the WtE plant performs two functions – waste management and electricity generation – and hence one cannot draw conclusions from a straight comparison of the emissions as presented here.
92
Include additional operating costs, emissions and accidents, all at the appropriate
shadow price, related to the additional transport of waste materials to the landfill as
opposed to the WtE plant (the landfill is a further 13 km distant from the centre of
Lisbon, and for simplicity we assume that each deposition of waste, averaging 13
tonnes, requires an additional truck journey of 26 km).
ECONOMIC PERFORMANCE
The economic performance of the project – Economic Net Present Value (ENPV), Economic
Rate of Return (ERR) and Benefit-Cost ratio (EBCR) – is summarised in Table II.9 (detailed tables
at back of Annex).
Table II.9 SOCIO-ECONOMIC CBA OF VALORSUL PROJECT
ENPV
EUR million
ERR EBCR
Do Project -44 3.2% 0.97
Do Minimum -179 -5.9% 0.84
Project NPV compared to Do Minimum 135 5.9%
As can be seen, at a socio-economic level, the project imposes costs on society, of just over
EUR 44 million over a 30 year timeframe. However, the valid measure is compared to the
counterfactual of a landfill. On this basis, the project generates a positive return for society, of
EUR 135 million. Therefore the project is worthwhile on a socio-economic basis.
SCENARIO AND SENSITIVITY ANALYSIS
A number of scenarios can be tested, based on alternative forecasts, namely:
Higher and Lower economic growth, which will translate into higher and lower future
waste volumes;
Higher and lower value of CO2, and hence of methane, and
As an alternative to the base case social discount rates, we also test a rate equivalent
to the social opportunity cost of capital, i.e. the return that can be generated on the
marginal project in the private sector174. The Guide to Cost Benefit analysis of
Investment Projects recommends 5% real as a benchmark figure, and this is what we
use.
The results are presented in the tables below (socio-economic analysis only).
We also test one scenario from a financial as opposed to socio-economic perspective:
as an alternative to the actual electricity tariff earned by Valorsul, we can test a
scenario whereby in future the price paid equals the shadow price.
174
In a closed economy with perfect information, no distortions and no externalities the social discount rate and the social opportunity cost of capital are equivalent.

93
Table II.10 SOCIO-ECONOMIC CBA OF VALORSUL PROJECT – HIGH ECONOMIC
GROWTH
ENPV
EUR million
ERR EBCR
Do Project -36 3.3% 0.98
Do Minimum -186 -7.9% 0.85
Project NPV compared to Do Minimum 151 6.1%
Table II.11 SOCIO-ECONOMIC CBA OF VALORSUL PROJECT – LOW ECONOMIC
GROWTH
ENPV
EUR million
ERR EBCR
Do Project -51 3.1% 0.97
Do Minimum -173 -4.7% 0.84
Project NPV compared to Do Minimum 122 5.8%
Table II.12 SOCIO-ECONOMIC CBA OF VALORSUL PROJECT – HIGH PRICE OF CARBON
ENPV
EUR million
ERR EBCR
Do Project -220 0.4% 0.88
Do Minimum -313 * 0.76
Project NPV compared to Do Minimum 93 5.3%
*not calculated.
Table II.13 SOCIO-ECONOMIC CBA OF VALORSUL PROJECT – LOW PRICE OF CARBON
ENPV
EUR million
ERR EBCR
Do Project 107 4.9% 1.07
Do Minimum -69 1.1% 0.93
Project NPV compared to Do Minimum 175 6.5%
Table II.14 SOCIO-ECONOMIC CBA OF VALORSUL PROJECT – SOCIAL OPPORTUNITY
COST OF CAPITAL (5% THROUGHOUT)
ENPV
EUR million
ERR EBCR
Do Project -141 3.2% 0.92
Do Minimum -196 -4.9% 0.83
Project NPV compared to Do Minimum 55 5.9%

94
Table II.15 FINANCIAL CBA OF VALORSUL PROJECT – ELECTRICITY TARIFF EQUALS
SHADOW PRICE
FNPV(C)
EUR million
FRR(C) FBCR(C)
Investment Return -266 1.3% 0.84
FNPV(K)
EUR million
FRR(K) FBCR(K)
National Return 5 5.1% 1.00
While the various socio-economic scenarios have the expected impact on the results, none
overturns the ranking of the alternative projects, and thus we can conclude that our results are
robust to these scenarios. However, at a social opportunity cost of capital of 5%, the net
benefit of the project compared to the counterfactual is much reduced. Interestingly, the
project appears more positive with a low price of carbon than with a high price. This is because
of the significant volumes of GHG emissions associated with the project.
With regard to the financial scenario of electricity tariff equal to the shadow price, the project
is clearly vulnerable to this, just about breaking even after the benefit of CF assistance has
been factored in. This highlights the importance of the electricity tariff to the financial
sustainability of the project. However, as discussed above, if the electricity revenue earned by
Valorsul were to fall, gate fees (which are very low by both international and national
standards) would have to be adjusted to compensate.
Furthermore, as noted above, the counterfactual does not take into account the implications
for Portugal of not meeting the terms of the Landfill Directive (99/31/EC), which requires a
significant and progressive redirection of biodegradable waste away from landfill over the
coming decade (targets to be met in 2010, 2013 and 2016). Failure to achieve these targets
leaves Portugal open to potentially significant fines from the EU.
RISK ANALYSIS
Monte Carlo Analysis was also performed on our CBA model, assigning a triangular distribution
to three input variables, to simulate the future uncertainty associated with these variables.
The peak of the distributions and their upper and lower bounds (at which points their
probabilities fall to zero) are outlined in Table II.16175.
175
The software used to generate the Monte Carlo results is Risk Analyzer Release 11.02 (http://www.add-ins.com/analyzer/index.htm).

95
Table II.16 PARAMETERS FOR PROBABILITY DISTRIBUTIONS FOR MODEL INPUTS
Input Variable
(Annual Growth Rates)
Peak (Baseline Scenario) Value
Lower Bound
(Probability=0)
Upper Bound
(Probability=0)
Future GDP Growth 1.4% 3.5% -0.5%
Value of CO2 emissions growth 4.50% 9.0% 0.0%
Population Growth Lisbon NUTS III region 0.46% 1.5% -0.5%
The results (Table II.17) confirm a strong economic NPV and internal rate of return for the
project. The simulations were run two thousand times. The computed expected value of ENPV
EUR 141 million and ERR 6.0% compare to the base case values of EUR 135 million and 5.9%
respectively.
Table II.17 OUTPUT STATISTICS OF MONTE CARLO SIMULATIONS
Economic Net
Present Value
(EUR million)
Economic Internal
Rate of Return
Computed Expected Value 140.9 6.0%
Standard deviation 10.6 0.1%
Minimum value 115.4 5.7%
Maximum value 178.1 6.3%
Probability of being not higher than the reference value 45.8% 45.4%
Probability of being higher than the reference value 54.2% 54.7%
Probability of being lower than EUR NIL (ENPV) & 4% (EIRR) NIL NIL
Source: Authors
The results are further elaborated in the charts overleaf.

96
Figure II.1 PROBABILISTIC DISTRIBUTION OF ECONOMIC NET PRESENT VALUE (EUR
MILLION)
Source: Authors
Figure II.2 CUMULATIVE PROBABILISTIC DISTRIBUTION OF THE ECONOMIC NET
PRESENT VALUE (EUR MILLION)
Source: Authors

97
Figure II.3 PROBABILISTIC DISTRIBUTION OF ECONOMIC INTERNAL RATE OF RETURN
Source: Authors
Figure II.4 CUMULATIVE PROBABILISTIC DISTRIBUTION OF ECONOMIC INTERNAL RATE
OF RETURN
Source: Authors

98
Table II.18 DETAILED CBA – DO PROJECT (EUR THOUSAND, 2011 PRICES) DIRECT COSTS (OPERATOR)
DIRECT BENEFITS (OPERATOR)
DIRECT IMPACTS (OPERATOR) EXTERNAL/INDIRECT IMPACTS
FACILITY OPERATIONS
SHADOW PRICE ADJUSTMENTS SOCIO-ECONOMIC CBA
year Capital Expendi
ture
Operating costs
TOTAL DIRECT
OPERATOR
COSTS
cale
nd
ar
pro
ject
Total Investment cost
Total operating
costs
REVENUES - Gate Fees
REVENUES
- Electri
city
sale of Recycl
ables &
Other
TOTAL FINANCIA
L BENEFITS
UNDIS COUNT
ED
DISCOUNTED (@
financial discount
rate)
DISCOUNTED
@ social
discount rate
Waste Volumes (tonnes)
EMISSIONS
generated
EMISSIONS
avoided
Other
TOTAL Electricity Sales
Others TOTAL
NET DIRECT
IMPACT
INDIRECT/
EXTERNAL
IMPACTS
SHADOW
PRICE ADJUS
TMENT
NET SOCIO
-ECONOMIC
BENEFIT
(UNDISCOU
NTED)
NET SOCIO-
ECONOMIC
BENEFIT (DISCOU
NTED)
1996 0 -8,011 0 -8,011 0 0 0 0 -8,011 -16,653 -14,848 0 0 0 0 0 0 48 48 -8,011 0 48 -7,963 -14,759
1997 1 -82,909 0 -82,909 0 0 0 0 -82,909 -164,153
-147,485 0 0 0 0 0 0 497 497 -82,909 0 497
-82,41
1 -146,600
1998 2 -84,961 -13,959 -98,920 8,053 0 0 8,053 -90,867 -171,344
-155,127 306,297 -8 0 0 -8 0 4,708 4,708 -90,867 -8 4,708
-86,16
7 -147,102
1999 3 -82,969 -30,017 -112,986 17,235 9,747 405 27,387 -85,599 -153,723
-140,243 658,664 -2,533 2,135 0 -398 -4,250 11,734 7,485 -85,599 -398 7,485
-78,51
2 -128,632
2000 4 -19,942 -33,271 -53,213 18,591
25,733 2,713 47,038 -6,175 -10,561 -9,709 730,085 -9,945 5,635 0 -4,310 -11,219 15,745 4,526 -6,175 -4,310 4,526 -5,958 -9,369
2001 5 -27,362 -34,364 -61,726 18,986
25,440 3,719 48,145 -13,581 -22,122 -20,493 754,053 -10,198 5,571 0 -4,627 -11,091 15,921 4,830 -13,581 -4,627 4,830
-13,37
8 -20,186
2002 6 -25,269 -34,718 -59,987 19,179
25,502 3,766 48,448 -11,539 -17,901 -16,711 761,829 -10,585 5,585 0 -5,001 -11,118 16,024 4,906 -11,539 -5,001 4,906
-11,63
5 -16,848
2003 7 -12,500 -34,267 -46,767 18,903
25,308 3,833 48,044 1,277 1,887 1,775 751,939 -10,870 5,542 0 -5,328 -11,033 15,758 4,725 1,277 -5,328 4,725 674 936
2004 8 -12,094 -36,175 -48,269 23,452
20,720 3,388 47,560 -709 -998 -946 793,812 -10,655 5,088 0 -5,567 -7,615 12,151 4,537 -709 -5,567 4,537 -1,739 -2,320
2005 9 -5,104 -36,360 -41,464 19,336
25,723 4,754 49,813 8,350 11,190 10,688 789,581 -11,759 5,520 0 -6,239 -9,607 16,404 6,798 8,350 -6,239 6,798 8,908 11,402
2006 10 -4,926 -35,117 -40,043 19,596
25,681 5,854 51,132 11,089 14,152 13,621 808,062 -10,484 5,397 0 -5,086 -9,543 16,446 6,903 11,089 -5,086 6,903
12,906 15,853
2007 11 0 -33,900 -33,900 17,695
20,453 7,199 45,347 11,447 13,913 13,494 774,430 -10,890 4,494 0 -6,395 -7,417 14,974 7,557 11,447 -6,395 7,557
12,608 14,864
2008 12 0 -36,775 -36,775 18,571
23,814
10,061 52,446 15,671 18,141 17,730 804,447 -13,059 4,843 0 -8,216 -8,919 15,245 6,326 15,671 -8,216 6,326
13,781 15,592
2009 13 0 -37,558 -37,558 18,994
25,207
11,701 55,902 18,344 20,224 19,917 817,302 -14,172 5,552 0 -8,620 -9,512 16,237 6,726 18,344 -8,620 6,726
16,450 17,860
2010 14 0 -37,753 -37,753 17,771
25,644
10,251 53,666 15,914 16,709 16,582 790,568 -15,173 9,439 0 -5,734 -9,603 15,863 6,260 15,914 -5,734 6,260
16,441 17,131
2011 15 0 -34,464 -34,464 17,583
28,990 8,745 55,318 20,854 20,854 20,854 762,776 -15,312 11,130 0 -4,182 -11,148 15,201 4,054 20,854 -4,182 4,054
20,726 20,726
2012 16 0 -35,730 -35,730 18,374
32,035 9,138 59,546 23,816 22,682 23,145 797,079 -16,428 11,051 0 -5,376 -12,318 15,885 3,567 23,816 -5,376 3,567
22,007 21,386
2013 17 0 -35,784 -35,784 18,551
32,316 9,226 60,094 24,310 22,050 22,959 804,777 -17,039 11,398 0 -5,641 -12,427 16,038 3,612 24,310 -5,641 3,612
22,281 21,043

99
DIRECT COSTS (OPERATOR)
DIRECT BENEFITS (OPERATOR)
DIRECT IMPACTS (OPERATOR) EXTERNAL/INDIRECT IMPACTS FACILITY OPERATIONS
SHADOW PRICE ADJUSTMENTS SOCIO-ECONOMIC CBA
year Capital Expendi
ture
Operating costs
TOTAL DIRECT
OPERATOR
COSTS
cale
nd
ar
pro
ject
Total Investment cost
Total operating
costs
REVENUES - Gate Fees
REVENUES
- Electri
city
sale of Recycl
ables &
Other
TOTAL FINANCIA
L BENEFITS
UNDIS COUNT
ED
DISCOUNTED (@
financial discount
rate)
DISCOUNTED
@ social
discount rate
Waste Volumes (tonnes)
EMISSIONS
generated
EMISSIONS
avoided
Other
TOTAL Electricity Sales
Others TOTAL
NET DIRECT
IMPACT
INDIRECT/
EXTERNAL
IMPACTS
SHADOW
PRICE ADJUS
TMENT
NET SOCIO
-ECONOMIC
BENEFIT
(UNDISCOU
NTED)
NET SOCIO-
ECONOMIC
BENEFIT (DISCOU
NTED)
2014 18 0 -36,466 -36,466 19,047
33,175 9,473 61,694 25,228 21,793 23,155 826,267 -17,980 11,960 0 -6,020 -12,757 16,467 3,710 25,228 -6,020 3,710
22,918 21,034
2015 19 0 -37,099 -37,099 19,517
33,961 9,707 63,184 26,085 21,461 23,267 846,673 -18,947 12,532 0 -6,414 -13,059 16,873 3,814 26,085 -6,414 3,814
23,485 20,948
2016 20 0 -37,677 -37,677 19,960
34,662 9,927 64,549 26,872 21,055 23,292 865,886 -19,937 13,114 0 -6,823 -13,329 17,256 3,927 26,872 -6,823 3,927
23,976 20,782
2017 21 0 -38,236 -38,236 20,393
35,340
10,142 65,875 27,639 20,625 23,283 884,666 -20,970 13,716 0 -7,253 -13,589 17,630 4,041 27,639 -7,253 4,041
24,427 20,577
2018 22 0 -39,110 -39,110 20,835
36,079
10,362 67,277 28,166 20,017 23,058 903,853 -22,067 14,354 0 -7,713 -13,874 18,013 4,139 28,166 -7,713 4,139
24,593 20,133
2019 23 0 -40,004 -40,004 21,287
36,801
10,587 68,675 28,672 19,406 22,810 923,457 -23,234 15,030 0 -8,203 -14,151 18,404 4,252 28,672 -8,203 4,252
24,721 19,667
2020 24 0 -40,917 -40,917 21,749
36,830
10,816 69,395 28,479 18,358 22,018 943,486 -24,474 15,747 0 -8,727 -14,162 18,803 4,640 28,479 -8,727 4,640
24,392 18,858
2021 25 0 -41,892 -41,892 22,242
37,666
11,062 70,970 29,078 17,851 21,848 964,896 -25,561 16,386 0 -9,175 -14,484 19,229 4,746 29,078 -9,175 4,746
24,648 18,520
2022 26 0 -42,890 -42,890 22,747
38,520
11,313 72,580 29,690 17,359 21,679 986,791 -26,701 17,055 0 -9,647 -14,813 19,666 4,853 29,690 -9,647 4,853
24,897 18,179
2023 27 0 -43,910 -43,910 23,263
39,395
11,570 74,227 30,317 16,882 21,513 1,009,183 -27,899 17,755 0 -10,144 -15,149 20,112 4,963 30,317 -10,144 4,963
25,137 17,837
2024 28 0 -44,954 -44,954 23,791
40,288
11,832 75,912 30,958 16,418 21,349 1,032,083 -29,157 18,490 0 -10,667 -15,492 20,568 5,076 30,958 -10,667 5,076
25,366 17,493
2025 29 0 -46,021 -46,021 24,331
41,203
12,101 77,634 31,613 15,967 21,186 1,055,503 -30,479 19,259 0 -11,220 -15,844 21,035 5,191 31,613 -11,220 5,191
25,585 17,146
2026 30 0 18,698 18,698 24,395
41,311
12,133 77,839 96,538 46,436 62,873 1,058,288 -37,827 19,672 0 -18,156 -15,886 20,702 4,816 96,538 -18,156 4,816
83,198 54,185
Total
-366,046
-1,010,690
-1,376,73
6 574,430 857,5
46 235,7
77 1,667,752 291,016 -122,026 -13,465 24,206,73
4 -
504,341 303,45
1 0 -
200,890 -333,407 479,641 146,2
33 291,016
-200,89
0 146,23
3 236,3
60 -43,665
Investment Return
NPV (€m) IRR
BCR (discounted)
Financial
-122 3.6% 0.93
Socio-economic
-44 3.2% 0.97

100
Table II.19 DETAILED CBA – DO MINIMUM (EUR THOUSAND, 2011 PRICES) DIRECT COSTS (OPERATOR)
DIRECT BENEFITS (OPERATOR)
DIRECT IMPACTS (OPERATOR) EXTERNAL/INDIRECT IMPACTS
FACILITY OPERATIONS
SHADOW PRICE ADJUSTMENTS SOCIO-ECONOMIC CBA
year Capital Expendit
ure
Operating costs
TOTAL DIRECT
OPERATOR COSTS
cale
nd
ar
pro
ject
Total Investment cost
Total operating
costs
REVENUES - Gate Fees
REVENUES -
Electricity
sale of Recycl
ables &
Other
TOTAL FINANCIAL
BENEFITS
UNDISCOUNTED
DISCOUNTED (@
financial discount
rate)
DISCOUNTED @ social
discount rate
Waste Volumes (tonnes)
EMISSIONS
generated
EMISSIONS
avoided
Other TOTAL Electricity Sales
Others
TOTAL NET DIRECT
IMPACT
INDIRECT/
EXTERNAL
IMPACTS
SHADOW
PRICE ADJUSTMEN
T
NET SOCIO-
ECONOMIC
BENEFIT (UNDISC
OUNTED)
NET SOCIO-
ECONOMIC
BENEFIT (DISCOU
NTED)
1996 0 -12,149 0 -12,149 0 0 0 0 -12,149 -25,258 -22,520 0 0 0 0 0 0 73 73 -12,149 0 73 -12,077 -22,385
1997 1 -12,149 0 -12,149 0 0 0 0 -12,149 -24,055 -21,612 0 0 0 0 0 0 73 73 -12,149 0 73 -12,077 -21,483
1998 2 -12,149 -13,959 -26,108 12,145 0 0 12,145 -13,964 -26,331 -23,839 306,297 -12 0 0 -12 0 0 0 -13,964 -12 0 -13,976 -23,859
1999 3 -12,149 -30,017 -42,166 26,116 0 0 26,116 -16,050 -28,824 -26,297 658,664 -25 0 0 -25 0 -84 -84 -16,050 -25 -84 -16,160 -26,475
2000 4 -12,149 -19,582 -31,732 28,948 0 0 28,948 -2,784 -4,762 -4,377 730,085 -1,596 0 -24 -1,619 0 -101 -101 -2,784 -1,619 -101 -4,504 -7,082
2001 5 -12,149 -20,226 -32,375 29,898 0 0 29,898 -2,477 -4,035 -3,738 754,053 -1,803 0 -26 -1,829 0 -106 -106 -2,477 -1,829 -106 -4,413 -6,659
2002 6 -12,149 -20,434 -32,584 30,207 0 0 30,207 -2,377 -3,688 -3,442 761,829 -1,994 0 -636 -2,630 0 -93 -93 -2,377 -2,630 -93 -5,100 -7,385
2003 7 -12,149 -20,169 -32,318 29,814 0 0 29,814 -2,504 -3,699 -3,480 751,939 -2,154 0
-1,625 -3,779 0 -65 -65 -2,504 -3,779 -65 -6,348 -8,822
2004 8 -12,149 -21,292 -33,441 31,475 0 0 31,475 -1,966 -2,767 -2,623 793,812 -2,489 0
-1,599 -4,088 0 -76 -76 -1,966 -4,088 -76 -6,131 -8,177
2005 9 -12,149 -21,400 -33,550 31,307 0 0 31,307 -2,243 -3,006 -2,871 789,581 -2,711 0
-1,571 -4,282 0 -76 -76 -2,243 -4,282 -76 -6,600 -8,448
2006 10 -12,149 -20,669 -32,818 32,040 0 0 32,040 -779 -994 -957 808,062 -3,037 0
-1,525 -4,562 0 -81 -81 -779 -4,562 -81 -5,422 -6,661
2007 11 -12,149 -19,953 -32,102 30,706 0 0 30,706 -1,396 -1,697 -1,646 774,430 -3,230 0
-1,412 -4,642 0 -76 -76 -1,396 -4,642 -76 -6,114 -7,208
2008 12 -12,149 -21,645 -33,794 31,896 0 0 31,896 -1,898 -2,197 -2,147 804,447 -3,777 0
-1,587 -5,364 0 -78 -78 -1,898 -5,364 -78 -7,340 -8,304
2009 13 -12,149 -22,106 -34,255 32,406 0 0 32,406 -1,849 -2,039 -2,008 817,302 -6,319 0
-1,592 -7,911 0 -81 -81 -1,849 -7,911 -81 -9,842 -10,686
2010 14 -12,149 -22,220 -34,370 31,346 0 0 31,346 -3,024 -3,175 -3,151 790,568 -4,274 0
-1,398 -5,672 0 -80 -80 -3,024 -5,672 -80 -8,776 -9,144
2011 15 -12,149 -20,285 -32,434 30,244 0 0 30,244 -2,190 -2,190 -2,190 762,776 -4,320 0
-1,514 -5,834 0 -71 -71 -2,190 -5,834 -71 -8,095 -8,095
2012 16 -12,149 -21,030 -33,179 31,604 0 0 31,604 -1,575 -1,500 -1,531 797,079 -4,730 0
-1,689 -6,419 0 -74 -74 -1,575 -6,419 -74 -8,069 -7,841
2013 17 -12,149 -21,061 -33,211 31,909 0 0 31,909 -1,301 -1,180 -1,229 804,777 -5,004 0
-1,659 -6,663 0 -77 -77 -1,301 -6,663 -77 -8,042 -7,595
2014 18 -12,149 -21,463 -33,612 32,761 0 0 32,761 -851 -735 -781 826,267 -5,384 0
-1,679 -7,063 0 -82 -82 -851 -7,063 -82 -7,996 -7,338
2015 19 -12,149 -21,835 -33,985 33,571 0 0 33,571 -414 -341 -370 846,673 -5,781 0
-1,757 -7,538 0 -85 -85 -414 -7,538 -85 -8,037 -7,168
2016 20 0 -22,176 -22,176 34,332 0 0 34,332 12,156 9,525 10,537 865,886 -6,195 0
-1,780 -7,974 0 -162 -162 12,156 -7,974 -162 4,020 3,485

101
DIRECT COSTS (OPERATOR)
DIRECT BENEFITS (OPERATOR)
DIRECT IMPACTS (OPERATOR) EXTERNAL/INDIRECT IMPACTS FACILITY OPERATIONS
SHADOW PRICE ADJUSTMENTS SOCIO-ECONOMIC CBA
year Capital Expendit
ure
Operating costs
TOTAL DIRECT
OPERATOR COSTS
cale
nd
ar
pro
ject
Total Investment cost
Total operating
costs
REVENUES - Gate Fees
REVENUES -
Electricity
sale of Recycl
ables &
Other
TOTAL FINANCIAL
BENEFITS
UNDISCOUNTED
DISCOUNTED (@
financial discount
rate)
DISCOUNTED @ social
discount rate
Waste Volumes (tonnes)
EMISSIONS
generated
EMISSIONS
avoided
Other TOTAL Electricity Sales
Others
TOTAL NET DIRECT
IMPACT
INDIRECT/
EXTERNAL
IMPACTS
SHADOW
PRICE ADJUSTMEN
T
NET SOCIO-
ECONOMIC
BENEFIT (UNDISC
OUNTED)
NET SOCIO-
ECONOMIC
BENEFIT (DISCOU
NTED)
2017 21 0 -22,505 -22,505 35,077 0 0 35,077 12,572 9,382 10,591 884,666 -6,632 0
-1,832 -8,464 0 -165 -165 12,572 -8,464 -165 3,944 3,322
2018 22 0 -23,019 -23,019 35,838 0 0 35,838 12,818 9,110 10,494 903,853 -7,100 0
-1,882 -8,982 0 -168 -168 12,818 -8,982 -168 3,668 3,003
2019 23 0 -23,545 -23,545 36,615 0 0 36,615 13,070 8,846 10,398 923,457 -7,602 0
-1,930 -9,531 0 -172 -172 13,070 -9,531 -172 3,367 2,678
2020 24 0 -24,082 -24,082 37,409 0 0 37,409 13,327 8,591 10,304 943,486 -8,139 0
-1,977 -10,116 0 -176 -176 13,327
-10,11
6 -176 3,035 2,347
2021 25 0 -24,657 -24,657 38,258 0 0 38,258 13,601 8,350 10,220 964,896 -8,591 0
-2,025 -10,616 0 -180 -180 13,601
-10,61
6 -180 2,806 2,108
2022 26 0 -25,244 -25,244 39,126 0 0 39,126 13,882 8,117 10,137 986,791 -9,069 0
-2,073 -11,142 0 -184 -184 13,882
-11,14
2 -184 2,556 1,866
2023 27 0 -25,845 -25,845 40,014 0 0 40,014 14,170 7,890 10,055
1,009,183 -9,574 0
-2,123 -11,697 0 -188 -188 14,170
-11,69
7 -188 2,284 1,621
2024 28 0 -26,459 -26,459 40,922 0 0 40,922 14,463 7,670 9,974
1,032,083
-10,10
7 0 -
2,176 -12,283 0 -193 -193 14,463
-12,28
3 -193 1,988 1,371
2025 29 0 -27,087 -27,087 41,851 0 0 41,851 14,764 7,457 9,894
1,055,503
-10,66
9 0 -
2,231 -12,900 0 -197 -197 14,764
-12,90
0 -197 1,667 1,117
2026 30 0 84,821 84,821 41,961 0 0 41,961 126,782 60,984 82,571
1,058,288
-94,67
7 0 -
2,283 -96,960 0 -868 -868 126,782
-96,96
0 -868 28,954 18,857
Total
-242,988 -539,144 -782,132
959,797 0 0 959,797 177,665 3,450 54,366
24,206,734
-236,9
95 0
-43,60
3 -280,598 0 -3,893 -3,893 177,665
-280,5
98 -3,893 -106,826 -179,040
Investment Return
NPV (€m) IRR BCR (discounted)
Financial
3 5.1% 1.00
Socio-economic
-179 -5.9% 0.84

102

103
ANNEX III. LIST OF INTERVIEWEES
Interviews and correspondence were undertaken with the following individuals. We would like
to thank them for their assistance in compiling our report.
Interviewee Affiliation Position Date
Mr Vitor Vieira
Mr Fernando Santos
Lisbon Municipality (CML)
Director of Department Urban Waste Management
28th October, 2011
Mr Rui Berkemeier
Quercus (Portuguese Environmental NGO)
Coordinator of Waste Management Information Centre
28th October, 2011
Ms Francisca Cordovil
Financial Institute for Reg. Dev. (IFDR)
Coordinator Cohesion Fund 31st October, 2011
Ms Luísa Pinheiro
Ms Ana Paula Simão
Mr Francisco Silva
Portuguese Environment Agency (APA)
Deputy Director-General
Director of Department Waste Management
Director of Division Urban Waste
2nd November, 2011
Mr João Figueiredo
Mr Tomás Serra
Ms. Ana Loureiro
Valorsul President Executive Commission
Executive Administrator
Director of Communication
2nd November, 2011
Ms. Paulina Martins
Ms. Maria Miguel Pereira Ms. Zélia Galinha
Lisbon Regional Administration
(CCDR-LVT)
Director of Department of Environment
Division Chief Environmental Licensing
17th November, 2011
Mr Helder Careto GEOTA / Portuguese Environmental NGO)
Executive Director 2nd December, 2011
Ms. Filomena Lobo
Mr Miguel Nunes
National Regulatory Entity for Water and Waste Services (ERSAR)
Director Department Waste Engineering 7th December, 2011
Mr René-Laurent Ballaguy
European Investment Bank (EIB)
Senior Evaluator – Inspectorate General / Operations Evaluation (IG/EV)
16th March, 2012

104

105
ANNEX IV. REFERENCES
List of cited references
Ag ncia Portuguesa do Ambiente, 2011, E 2011.
Agência Portuguesa do Ambiente, 2011, Resíduos Urbanos (RU),
http://www.apambiente.pt/politicasambiente/Residuos/gestaoresiduos/RU/Paginas/default.a
spx.
Agência Portuguesa do Ambiente, Gestao de Resíduos Urbanos (PowerPoint presentation).
Becker G.S., 1962, Investment in Human Capital: A Theoretical Analysis, The Journal of Political
Economy, Vol. 70, No. 5, Part 2: Investment in Human Beings (Oct., 1962), pp. 9-49.
CASES, 2008, Deliverable D.2.1 – Emissions database (LCI data) of electricity production,
(updated to 2008), Co-ordination Action Funded by the European Commission under the Sixth
Framework Programme “Cost Assessment for Sustainable Energy Systems”. Retrieved from
http://www.feem-project.net/cases/links_databases.php.)
Dasgupta P., 2001, Human Well-Being and the Natural Environment, Oxford University Press.
Direc ão Geral do Ambiente, 2000, Relatório do estado do ambiente 1999.
Easterly W., Ritzen J. and Woolcock M., 2006, Social Cohesion, Institutions, and Growth,
Economics and Politics Vol. 18 (2), pp. 103-120.
Entidade Reguladora dos Servi os de guas e Resíduos, 2011, v
g P g (2010) E c v - Avalia ão da qualidade do servi o
prestado aos utilizadores.
Entidade Reguladora dos Servi os de guas e Resíduos, 2011, v
g P g (2010) 1 - Caracteriza ão geral do sector.
Entidade Reguladora dos Servi os de guas e Resíduos, 2011, v
g P g (2010) 2 - Caracteriza ão econ mica e financeira do
sector.
Entidade Reguladora dos Servi os de guas e Resíduos, 2011, v
g P g (2010). Volume 3 - Avalia ão da qualidade do servi o prestado
aos utilizadores.
ERSAR et APA, 2011, PE II: P E g c 200 -2016.
Relat rio de Acompanhamento 2009.
European Commission, 1994, Fundo de Coesao. Pedido de Contribuiçao. Regulamento (CE) Nº
1164/94 do Conselho de 16 de Maio de 1994. Ref 95/10/61/026.
106
European Commission, 1999, Cohesion Fund: Portugal and Greece - 1999, Ref: I-027210-INT-1,
http://ec.europa.eu/avservices/services/showShotlist.do?out=HTML&lg=EN&iref=I-0.
European Commission, 2000, A Study on the Economic Valuation of Environmental Externalities
from Landfill Disposal and Incineration of Waste, Final Appendix Report. Available at
http://ec.europa.eu/environment/waste/studies/pdf/econ_eva_landfill_annex.pdf.
European Commission, 2001, The benefits of compliance with the environmental acquis for the
candidate countries – Part D: Waste Management Directives, prepared by ECOTEC, EFTEC,
IEEP, Metroeconomica, TME and Candidate Country Experts. Available at
http://ec.europa.eu/environment/enlarg/pdf/benefit_d.pdf.
European Commission, 2004 - Third Report on Economic and Social Cohesion.
European Commission, 2008, Green Paper on Territorial Cohesion. Turning territorial diversity
into strength, {SEC(2008) 2550}.
European Commission, Report from the Commission - Annual Report of the Cohesion Fund
2000.
European Investment Bank (EIB), 1996, Valorsul Thermal Waste Disposal. Detailed Appraisal
Report; Cohesion Fund No. 95/10/61/026.
Eurostat, 2011, Eurostat News Release, 37/2011 - 8 March 2011, Environment in the EU27,
http://epp.eurostat.ec.europa.eu/cache/ITY_PUBLIC/8-08032011-AP/EN/8-08032011-AP-
EN.PDF.
Friends of the Earth, 2008, Briefing. Mechanical and Biological Treatment (MBT).
Greenpeace, 2010, La incineracion de residuos en cifras, Madrid, July 2010.
Griffith R., 2000, How important is Business R&D for Economic Growth and should the
Government subsidise it?, The Institute for Fiscal Studies, Briefing Note No. 12.
Griliches Z., 1992, The search for R&D spillovers, Scandinavian Journal of Economics, vol.94, pp.
29-47.
Hirschman A.O., 1967, Development Projects Observed, The Brookings Institution, Washington,
D.C.
InnoTrain CSR, 2010, Best practice examples of CSR, document prepared for DG Education and
Culture of the EC, http://www.csr-training.eu/fileadmin/downloads/EN/EN_7/EN_7_3.pdf.
InnoTrain CSR, Best Practices Valorsul, http://www.csr-training.eu/en/csr-
movies/enviroment/.
Instituto Regulador de Águas e Resíduos, 2005, Relatório Anual do Sector de Águas e Resíduos
em Portugal (2004), Volume 1 - Caracterizaçaco geral do sector.

107
J. Fiedler and E. Artim, 2006, Environmental Projects Financed by the EU Funds Selected
Experiences and Challenges. Working paper.
Martinez M., 2009, “Il management delle aziende di Public Utilities tra cambiamento
istituzionale e compliance”, in Modelli di governance e processi di cambiamento nelle Public
Utilities, edited by Mercurio R. and Martinez M., Franco Angeli, 2009.
NEMUS, CISED and CIDEC, 2007, E v F P g (1993-
2006), prepared for Direc ão-Geral do Desenvolvimento Regional.
OECD, 2001, Environmental Performance Reviews: Portugal
[http://www.oecd.org/dataoecd/38/22/47466283.pdf].
OECD, 2011, Environmental Performance Reviews: Portugal. Executive Summary.
OECD, 2011, Environmental Performance Reviews: Portugal. Highlights,
http://www.oecd.org/dataoecd/38/28/47466200.pdf.
Palma-Oliveira, J.M, 2010, P c c rsul 2010, FPCE, Universidade de
Lisboa.
Red Eléctrica de España, 2010, El sistema eléctrico español - avance del informe 2010 available
at http://www.ree.es/sistema_electrico/pdf/infosis/Avance_REE_2010.pdf.
Rede Eléctrica Nacional, 2010, Caracterização da rede nacional de transporte para efeitos de
acesso à rede em 31 de Dezembro de 2009, available at
http://www.centrodeinformacao.ren.pt/PT/publicacoes/CaracterizacaoRNT/Caracteriza%C3%
A7%C3%A3o%20da%20RNT%2031-12-2009.pdf.
Sen A.K., 1987, On Ethics and Economics, Basil Backwell eds., Oxford.
Sociedade Ponto Verde, 2009, Activities Report.
Solow R.M., 1956, A Contribution to the Theory of Economic Growth, The Quarterly Journal of
Economics, Vol.70, No. 1 (Feb. 1956), pp. 65-94.
Stiglitz J.E., Sen A., Fitoussi J.P, 2009, Report by the Commission on the Measurement of
Economic Performance and Social Progress. Available at: http://www.stiglitz-sen-
fitoussi.fr/documents/rapport_anglais.pdf.
Tomer J., 1981, Organizational Change, Organization Capital and Economic Growth, Eastern
Economic Journal Vol. VII, No. 1.
Torres et al., Integrated Waste Management: Valorsul Case Study, document prepared for
Valorsul S.A.
Valorsul, 2009, Relatório de Sustentabilidade 2009 (Valorsul Sustainability Report 2009).
Valorsul, 2010, Relatório e Contas 2010 (Valorsul Annual Report 2010).

108
Other papers and reports consulted
ABB, Case Note,
http://www05.abb.com/global/scot/scot216.nsf/veritydisplay/4dc982bd826eeb3cc125790200
4fd299/$file/cn_valorsul_lowres.pdf.
Aguas de Portugal, Excellent performance for Grupo AdP in 2010,
http://www.adp.pt/content/index.php?action=detailfo&rec=2738&t=Excellent-performance-
for-Grupo-AdP-in-2010.
Associação de Fins Específicos – AMO MAIS, 2010,
http://www.oestecim.pt/News/newsdetail.aspx?news=eec94683-716b-4ffa-a27c-
99597b707ce9.
AWAST final Meeting presentation, 2003, Aid in the management and European comparison of
Municipal Solid Waste Treatment methods for a global and sustainable approach.
C. Neiva Correia et al., 2010, General mass and energy balance of a biodegradable waste
anaerobic digestion plant in the Lisbon Area,
http://www.iiasa.ac.at/Research/FOR/downloads/Kraxner/CD%20Venice%20Symposion%2020
10_Proceedings/data/data/files/338.pdf.
CCDRLVT, G E g c E .
CESPA, 2008, Gestión de los residuos urbanos en Miranda del Ebro.
Comisión Europea, 1997, F h : c 199 Nota informativa no 39
Abril de 1997 – ES.
Comisión Europea, 2001, Diario Oficial de las Comunidades Europeas (2001/C 361/01).
Di rio da Rep blica, 2007, 1.a s rie — N.o 30 — 12 de Fevereiro de 2007, MINIST RIO DO
AMBIENTE, DO ORDENAMENTO DO TERRIT RIO E DO DESENVOLVIMENTO REGIONAL Portaria
n.o 187/2007.
Ecologistas en Acción, 2004, Visita del Foro contra la Incineración a Portugal,
http://www.ecologistasenaccion.org/article733.html.
European Commission, 2011, Europe in figures - Eurostat yearbook 2011.
Instituo do Ambiente, 2005, Relatório do estado do ambiente 2005.
Instituto para la sostenibilidad de los recursos, 2007, III Ponencia Técnica. Cultura del
aprovechamiento de la Fracción Resto; Tratamientos Biológicos Mecánicos; Fracciones
Aprovechalbes (CSR).

109
NEMUS, CISED, and CIDEC, 2007, Presentation of Avaliação do Fundo de Coesão em Portugal
(1993-2006) during the 30.ª Reunião da Comissão de Acompanhamento do Fundo de Coesão -
Lisboa Outubro 2007.
Ministerio do Ambiente, do Ordenamento do Território e do Desenvolvimento Regional, 2007,
PERSU II Plano Estratégico para os Resíduos Sólidos Urbanos 2007-2016.
SIRUSA, Valorización energética de residuos urbanos.
Texeira de Lemos, Incineraçao de Resíduos Sólidos Urbanos: qual a melhor opçao de
aproveitamento energético?
Valorlis, 2008, Plano de Acçao Multimunicipal. Plano de Adequaçao ao PERSU II – PAPERSU.
Valorsul, 1999, 6 Relatório de execuçao referente a 30 de Junho de 1999
Acompanhamento dos Projectos de Tratamerit .
Valorsul, 2006, Relatório de Sustentabilidade 2006.
Valorsul, 2006, Relatório e Contas 2006.
Valorsul, 2007, Relatório de Sustentabilidade 2007.
Valorsul, 2007, Relatório e Contas 2007.
Valorsul, 2008,
http://www.isrcer.org/newweb/upload/publicaciones/docproyesp20080512151824.pdf.
Valorsul, 2008, Relatório de Sustentabilidade 2008.
Valorsul, 2008, Relatório e Contas 2008.
Valorsul, 2009, Relatório e Contas 2009.
Valorsul, Brochura juvenil sobra a Valorsul.
Websites consulted
A Comunidade Intermunicipal do Oeste: http://www.oestecim.pt/
Águas de Portugal: http://www.adp.pt/
Ecovia LIFE Project:
http://ec.europa.eu/environment/life/project/Projects/index.cfm?fuseaction=search.dspPage
&n_proj_id=2827&docType=pdf;%20and,%20Valorsul%20Sustainability%20Report,%202009
ERSAR: http://www.ersar.pt/
Eurostat: http://epp.eurostat.ec.europa.eu/portal/page/portal/eurostat/home/

110
Expo’98: http://www.parqueexpo.pt
http://dspace.estt.ipt.pt/dspace_estt/bitstream/1234/2589/1/Expo_98_Joao_Cabral.pdf
Global Finance: http://www.gfmag.com/gdp-data-country-reports/196-portugal-gdp-country-
report.html#axzz1hAitxyMX
INE: http://www.ine.pt
Questions and answers on the EIA of the WtE Plant: http://www.citidep.pt/ims/EIA/index.html
The Portuguese Environment Agency: http://www.apambiente.pt/
Valorsul: http://www.valorsul.pt/pt/
Valorlis: http://www.valorlis.pt/