indian labour market and position of women gender …
TRANSCRIPT

INDIAN LABOUR MARKET AND POSITION OF WOMEN: GENDER PAY GAP IN THE INDIAN FORMAL SECTOR
BIJU VARKKEY, RUPA KORDE AND DEVANSH PARIKH Author 1: Human Resource Area, Indian Institute of Management, Ahmedabad, India
Authors 2 & 3: Economics & Strategy, FLAME University, Pune, India [email protected]
Paper prepared for presentation at the
“5th Conference of the Regulating for Decent Work Network” At the International Labour Office Geneva, Switzerland
3-5 July 2017

2
Abstract Gender diversity and its consequences in relation to work and economy are much discussed topics in
India today. Women constitute almost half the population of India (48%) (Census India, 2011) and
thus half of its potential labour force. But the LFPR of women in India has been constantly declining
and stands at merely 28.6% for 2014 (The World Bank, 2016). This implies that half of the potential
talent base in India is under-utilized (Zahidi & Ibarra, 2010). Though the Indian Government has
taken various measures to prevent discrimination against women workers, there still exists a wide
gender pay gap in India and in fact no country has been able to close the gender pay gap completely
(Tijdens and Klaveren, 2012). The issue of wage inequality is also central to United Nations’ SDGs,
“decent work for all women and men, and lower inequality, as among the key objectives of a new
universal policy”, which highlight the importance of measuring and devising a mechanism to reduce
the pay gap (ILO, 2016).
This paper quantifies the magnitude of gender-based disparities that women face in the organized
sector of the Indian Labour Market, offers possible explanations for the same and tracks changes over
time. Using the WageIndicator (Paycheck.in) continuous and voluntary web salary survey dataset and
OLS regression analysis (Blau and Kahn, 2016), the paper identifies the key drivers, trends and
reasons of the gender pay gap in the Indian labour market. Key findings include that gender pay gap
increases with age, education and skill, occupational status and is significantly higher for married
women than single women.
To survive in an ever-changing world, in terms of political, economic, social, technological,
environmental and legal aspects is the challenge of each passing day. Moreover, to be able to subsist
in a dynamic environment, there is a need for a new mind-set that can discard old prejudices and
inertia, and accept new ideas and solutions (Hausmann, Tyson, & Zahidi, 2011). The paper explores
and expands on the different approaches used by various organizations to counter the gender pay gap.
We conclude by providing several concrete and innovative policy recommendations on how to enable
Indian women and men to overcome gendered barriers in the labour market.
Keywords: Gender, India, Labour Market, Pay Gap, Women Copyright 2017 by author(s). All rights reserved. Readers may make verbatim copies of this document for non-commercial purposes by any means, provided that this copyright notice appears on all such copies.

3
Indian Labour Market and Position of Women: Gender Pay Gap in the Indian Formal Sector
1. Introduction
To survive in an ever-changing world, in terms of political, economic, social, technological,
environmental and legal environment is the challenge of each passing day. Also, to be able to subsist in
dynamic environment, there is a need for a new mind-set that can discard old preconceptions and
inertia to problems faced by women in the labour market, and accept new mind-sets towards the
solutions (Hausmann, et al., 2011).
In today’s world, where men and women work together in almost all fields; the concern of fair and
equal treatment is of utmost importance. Gender inequality at work place is one of the issues that has
often been raised and debated. Women constitute almost half the population of India (48%) (Census
India, 2011) and thus half of its potential labour force. But the LFPR of women in India has been
constantly declining since 1991 (36%), and is only 28.6% for 2014 (The World Bank, 2016). This
implies that half of the potential talent base in India is under-utilized (Zahidi & Ibarra, 2010). Though
the government of India has announced numerous laws to disallow disparities or discrimination
against women at work, Gender Pay Gap (GPG) still exists1. It would be worth mentioning here that
most of these government interventions were instituted decades before economic reforms, and not
much has changed with respect to the status of women in Indian society and the labour market
structure. In most Indian work places, the so-called ‘glass ceiling’ is not completely broken yet. There
are many facets of gender inequality, and in the current setup, it is ‘professional inequality’ that
persistently acts as an impediment for women’s progression at the workplace. Professional inequality,
as explained by Amartya Sen in one of his lectures, refers to “discrimination in terms of employment,
remuneration, promotion at work and even occupation”, (Sen, 2001).
2. GPG: Theoretical Overview
The GPG measures the earning differences between women and men in paid employment in the labour
market. “It is one of the many indicators of gender inequality in a country that emerge on examining
the labour market participation in terms of gender” (Education International, 2011). The GPG exists in
almost all countries and no country has been able to close this gap completely (Tijdens & Klaveren,
2012). Various theories have been advanced to provide an explanation for this gap from an economic
perspective. Majority of them discuss either the human capital model (supply-side factor) that
emphases on gender differences in skills, particularly education and experience, or labour market
discrimination (demand-side factor) i.e., prejudiced treatment of equally qualified male and female
workers.
1 Refer to Exhibit 1 and Exhibit 2 in Annexure 12.1

4
One of the earliest works on labour market discrimination and its effects on pay has been done by
Edgeworth in 1922. He stresses that women will be paid lower than men because of multiple reasons
such as men are better organised than women (Marshall), hiring women is risky and costly for certain
jobs (Fawcett), there is pressure from trade unions and as a result women are crowded in certain types
of jobs, often women are not given opportunities to learn, some occupations are not chosen by women
themselves, women are liable to leave the job because they might get married, women are less useful
in case of emergencies, men being the principal breadwinner should be paid higher wages, and so on.
The "equality of utility to the employer as tested by the pecuniary value of the result, and equality of
disutility to the employee as tested by his freedom to choose his employment" (Edgeworth, 1922).
Bronfenbrenner also brings out the issue of wage-fixing activity, where the employer discriminates
when hiring, in terms of quantity and in payment, in terms of price or both (Bronfenbrenner, 1939). In
fact, it is stressed by economists that labour market discrimination is often used as an instrument of
divide and rule strategy by employers (Syzmanski, 1977).
The initial and the most dominant rationale of gender discrimination is given by human capital
theorists Becker (1962) and Mincer (1962). Human capital theory of wage determination suggests that
the observed gender wage differential is explained by the productivity differences between men and
women. Gender discrimination arises when the wage difference occurs between equally productive
female and male workers (taste for discrimination). Due to this gendered division of labour, women
are less likely to invest in formal education compared to men, which will translate in lower salary.
Thus, the human capital model explains the relationship between the demographic characteristics of
the workers and the gender wage gap. Furthermore, Becker’s (1971) discrimination theory and Mincer
and Polachek’s (1974) human capital theory attributes the gender wage gap to the endowment
variations in individual characteristics. On the other hand, Bergman’s (1974) crowding model
explains that the employer’s rational decision to hire a woman in the occupation is discriminatory,
when the employer uses gender as the variable in the hiring process. Roemer (1979) suggests that if
men can manage to penalize the authority that violates the concord against hiring women, then the
gender discrimination will be reduced. However, in Indian labour markets the existence of such
massive coordinated efforts for fighting gender discrimination is not currently plausible.
3. Literature Review
Some empirical studies conducted in India support the fact that there are human capital differences and
existence of labour market discrimination (Madheswaran & Khasnobis, 2007). The typical model used
by economists to analyse the GPG and its sources involves statistical decomposition of the total wage
gap into two categories generally called explained or endowment, and unexplained or treatment
components. The endowment effect explains that the wage gap is owing to differences in skills while

5
the unexplained or treatment effect postulates that wage differences arise owing to unequal gender
treatment with otherwise equally productive workers. The results of all such studies indicate that a
significant GPG does exist in India and discrimination revealed by the treatment effect is more
prominent as compared to the endowment effect (Jann, 2008). Almost two-thirds (63.5%) of the GPG
can be accounted for by discrimination, which is least at the beginning of one’s career but widens with
experience. More experienced women face higher inequality in pay (Duraisamy & Duraisamy, 1998).
The human capital theory argues that women deliberately choose lower paying jobs, but an empirical
study suggests that the greater part of the female earnings disadvantage lies in their poor wage position
owing to wage discrimination and not in their occupational distribution (Madheswaran &
Lakshmanasamy, 1996).
Majority of the empirical studies in India on GPG are based on data from different rounds of National
Sample Survey Organisation (NSSO)2 and using standard OLS regression. Gupta’s paper tries to
estimate the GPG using NSSO data and finds that GPG has declined over the years, from 58.9%
(1999-2000) to 52.1% (2009-2010). Agarwal’s study has examined GPGs for urban and rural
population (33% and 19% respectively) using Oaxaca-Blinder decomposition method with NSSO data
and asserts that pay gaps are because of labour market discrimination, but caste based discrimination
is mostly because of endowment differences (Agrawal, 2013). Bhattacharjee et al., studied the
evolution of GPGs in India for the time-period of 1983 to 2010 using NSSO and OLS regressions
with variables like age, caste, place of residence, etc. Their results suggest that GPGs have narrowed
over years, but are still high for illiterates and people with higher secondary education. The GPGs are
also high for white collared jobs as compared to blue collared jobs, whereas the GPGs in the
agricultural sector have not changed much over the years (Bhattacharjee, et al., 2015).
Some GPG studies have tried to study the effect of caste and religion on wages. Sengupta and Das
have tried to estimate the GPG for women across various social and religious groups using the NSSO
data with a Mincerian wage regression model. Their study shows that GPG has declined over the
years (1993-94 to 2009-10). But the GPG is more amongst Muslim women than Hindu women and
the GPG is less for ST3 than SC women for the same time-period (Sengupta & Das, 2014).
2 NSSO – “The National Sample Survey Office (NSSO) headed by a Director General is responsible for conduct of large scale sample surveys in diverse fields on All India basis. Primarily data are collected through nation-wide household surveys on various socio-economic subjects, Annual Survey of Industries (ASI), etc. Besides these surveys, NSSO collects data on rural and urban prices and plays a significant role in the improvement of crop statistics through supervision of the area enumeration and crop estimation surveys of the State agencies. It also maintains a frame of urban area units for use in sample surveys in urban areas.” Retrieved from http://www.mospi.gov.in/national-sample-survey-office-nsso on 29th May, 2017. 3 ST and SC – “The Indian constitution (1949) created broad categories of underprivileged groups in the Republic of India that were to be the object of special administrative and welfare efforts. Three categories were named, though not clearly defined: Scheduled Castes, Scheduled Tribes, and other Backward Classes. Very roughly, these were comprised respectively of (1) Untouchables or Harijans; (2) virtually all Adivasis or tribes; and (3) other economically disadvantaged groups not included in (1) or (2).” Retrieved from http://www.everyculture.com/South-Asia/Scheduled-Castes-and-Scheduled-Tribes.html on 29th May, 2017.

6
Chakraborty has used similar methodology along with NSSO data, and has comparable results for
religion and caste, but adds that education does not add much to the wages for women (Chakraborty,
2016).
A few others have tried to study the effect of geographical location and rainfall on GPG, again all
using NSSO data. Mohanty, et al., have computed the state-level GPG for the salaried class in India
using 2013 NSSO data. They found state-level variations in the GPG which were affected, majorly by
the decision-making power of women (with respect to their own health, participation in major
household decisions, big household purchases, etc.), to some extent by their labour supply decisions,
but not much by skill level, education, health, etc. (Mohanty, et al., 2014). Mahajan and Ramaswami’s
study also uses NSSO data and formally tests the Boserup hypothesis. They emphasize that women
have less opportunities in the non-farm sector and focuses on difference in wage rates of men and
women because of geographical location, which can explain 55% of the GPG between northern and
southern India (Mahajan & Ramaswami, 2017). Mahajan’s study on rainfall shocks and GPG, again
using NSSO data, confirms that female wages are vulnerable to rainfall shocks than male wages, but
are less responsive to rainfall shocks with high literacy rates (Mahajan, 2017).
Others have tried to find the effect of trade liberalisation on GPGs. Reilly and Datta have tried to find
some empirical evidence on the relationship between trade and GPG using NSSO data and Horrace
and Oaxaca regression method. They have found that GPG decreases with an increase in the level of
education, but have very little evidence of trade liberalisation measures affecting the GPG (Reilly &
Dutta, 2005). Paul and Paul have tried to compute the effect of trade exposure on gender pay in India
using the NSSO data and Oaxaca-Blinder method. They find that wage gap has decreased over the
years for India as whole, but has increased for rural India while it has registered a fall for urban India
with a significant impact of trade liberalisation (Paul & Paul, 2013).
There a few studies which have not used NSSO data to compute GPG in India. Agarwal and
Vanneman have used the Indian Human Development Survey and the matching comparison method
to find evidence of gender based pay gaps. They find that GPG declines with increase in the level of
education, but the GPG is higher in the rural area compared to the urban area with strong evidence for
labour market discrimination (Agrawal & Vanneman, 2014). Agarwal et al. have used data from
Ministry of Labour and Occupational Surveys and focus on only on a few major industry groups and
have found that wage discrimination based on gender is not very significant but occupational
segregation is quite significant (Agrawal, et al., 2014). Solanki and Zankharia have found a GPG of
Rs. 26 for migrant unskilled construction workers in Surat for the year 2013. Their study is based on
stratified random sampling of 200 workers (Solanki & Zankharia, 2014). Gangopadhayay’s
theoretical model predicts that with technological progress women will start entering the non-

7
traditional professions, and GPGs will subsequently reduce but will result in an increase in sexual
assaults (Gangopadhyay, 2015).
The Global Wage Report 2016-17 published by ILO has raised alarms with the revelation that the
GPG in India, which stands at 30%, is one of the highest in the world (ILO, 2016). According to a
report published by Korn Ferry Hay Group, women in India earn 18.8% less than men essentially
because of less representation in top management roles (Hay Group, 2016). According to a report
published by Accenture based on a global survey, women in India earn 67% less than men and have
estimated that it will take more than 100 years to close the gap (Accenture, 2017).
Most GPG studies in India are limited to time, area of coverage, inter-industry comparison, etc.
Majority of the studies concentrate on limited parameters and fail to provide a holistic picture. Very
few studies have been able to provide a Pan India analysis, and most of them use NSSO data. This
paper reinforces the conclusions of an earlier study by Varkkey and Korde (2013) along with an
updated dataset till 2016 and uses OLS regression analysis to support the results (Varkkey & Korde,
2013)4.
4. Possible reasons for the GPG in Indian Formal Sector:
The literature show that GPG exists in India, although the Constitution of India does not allow for any
discrimination in the labour market5. Though the number of educated women entering the labour
market has been on the rise in the past decade, the LFPRs for women have registered a fall. Our study
is broadly in line with other studies, and its results reinforce our earlier study (Varkkey, et al., 2012).
Some reasons for the existence of GPG in India are mentioned below:
• Direct labour market discrimination: people with same skill, education and work experience are
treated differently only because of gender, i.e., they are paid different wages for the same work
and/or there are different job requirements for the same pay level.
• Occupational segregation: women are mostly preferred for low paying jobs like secretaries,
teachers, nurses, etc., and even within these jobs they are paid less than their male counterparts
(IWPR 2009).
• Undervaluation of women’s work: it is assumed that a woman’s primary responsibility is that of
unpaid care work (e.g., family care work), and it therefore seems natural to provide women with
similar employment opportunites in the labour market (UNIFEM, 2005). Women in India
contribute three times more than men to unpaid care work (ILO, 2016).
4 An earlier version of this paper by same the authors (Biju Varkkey and Rupa Korde) has been uploaded as a working paper on the WageIndicator Foundation website (www.wageindicator.org) for comments and feedback. Paycheck India project (www.paycheck.in), a research initiative an Indian Institute of Management, Ahmedabad, is a part of WageIndicator Foundation. Full details are available at http://www.wageindicator.org/main/Wageindicatorfoundation/publications/2013/gender-pay-gap-in-the-formal-sector-in-india-2006-20135 Refer to Exhibit 1 and Exhibit 2 in Annexure 12.1

8
• The selection effect: women are often not given the choice of certain types of employment
(occupation), but in most cases, it is employers who favour men workers over women workers.
(Pertersen & Snartland, 2004).
• Bargaining Power: lack of bargaining power in the labour market, because of gendered division
of work, and hence women are forced to take up low paying jobs.
• Entry barriers: women are also faced with entry barriers to the labour market, which affects their
income growth and promotion prospects.
• Requirements and duties of parenthood: it may lead to gender bias in employment and as a result
occurrence of GPG. With motherhood duties, women often prefer to take up part-time jobs or
even consider a career break.
• Return to labour market after career break: women are often offered lower wages compared to
their male colleagues and there is no guarantee of an equivalent position in the organization after
their maternity leave (World Bank, 2016).
• Women with no children: women belonging to this category are not the first choice of the
employers, since they are looked at as potential mothers (Goldberg & Hill, 2007).
• Unmarried women: often are refused job prospects because the chances of them quitting jobs on
account of their marriage and wanting to relocate with spouse or may even take time off for
marriage ceremonies are higher compared to men.
• Social Fabric: unfavourable social interactions on the job can lead to decreased efficiency at
work. In Indian society, some male workers may become disgruntled when obligated to work with
or take orders from women. Therefore, in the interests of productivity and profits, employers may
decide to segregate men employees and women employees on the job.
• Preconceived notions about women’s productivity: women are often not the first choice for
promotion to higher positions in the occupational hierarchy, since they are thought to be less
productive. This may result in most women crowding at the lower end of the occupational
hierarchy6.
All these factors and many more tend to increase the GPG (Education International, 2011).
5. Hypothesis
• There exists a gender pay gap in the Indian organised labour sector.
• Gender has a significant relationship with the gross hourly wage for every individual,
controlling for other factors such as years of experience, marital status, industry and level of
education.
6 Bergmann's crowding model (1974).

9
6. Data
This research paper uses data collected from the continuous and voluntary Paycheck India web survey
(www.paycheck.in) that is posted in English and Hindi. The questionnaire is uploaded on the website
and the survey is answered through a process of non-controlled self-selection, whereby some
individuals complete the questionnaire others don’t7. “The survey has detailed questions about
earnings, benefits, working conditions and employment contracts, as well as questions about
education, occupation, industry and household characteristics” (Tijdens, Zijl, Klaveren, & Steinmetz,
2010), (Guzi & Pedraza, 2013)8.
In 2000, the WageIndicator project (www.wageindicator.org) started as a paper-pencil survey for
establishing a website with salary information for women’s occupation in Netherlands. By 2015, it
developed into an online data collection tool hosted in over 80 national websites with job-related
content, labour law and minimum wage information, collective bargaining agreements, public sector
wages, and a free and crowd-pulling salary checker presenting average wages for occupations. World-
renowned universities, trade unions and employer’s organization assist the WageIndicator project.9.
The primary data for this report is based on a voluntary online salary survey conducted by Paycheck
India10. After cleaning the data for outliers and missing data, of the online responses obtained through
the survey, 20,701 were males and 4,150 were females over 9 years spread across India. Respondents
came from different age groups, varied industries, and various hierarchical positions in their
respective occupations. The year-wise gender distribution of the overall respondents during the period
of survey shows that the ratio of male to female respondents has been 5:1 on an average. Literature
shows that the effect of gender may vary based on various factors. Keeping these in mind, we have
decided to focus on the organized labour sector only and attempted to understand the effect of
changes in gross hourly wage rates. The data is cross sectional and all variables have been taken in
absolute values.
Being an online volunteer survey, the dataset is biased towards those people who have access to the
Internet and are inclined to complete the questionnaire. Because of this limitation, the dataset captures
responses from the organized sector in India.
Table 1 gives us a broad overview of the dataset and shows the demographic and occupational profile
of the respondents. It clearly shows that the minimum gross hourly wage in our dataset is Rs. 40.03
7 This section “Survey Design and Data Collection” is same for all the papers that used Paycheck.in Salary data. This section describes the methodology of survey and data collection from http://www.paycheck.in/main/career-tips/research-publication 8 “Detailed information about WageIndicator project, the web survey, the questionnaire and a description of variables can be found on Wage Indicator website” 9 The above paragraphs are standard explanation in all wage indicator and paycheck publications. 10For more information about Paycheck India please visit http://www.paycheck.in/main/about-us

10
and the maximum is Rs. 15011.55 per hour. The mean wage is Rs. 718.85 per hour. The age variable
is set between 18 years and 60 years only, as this is the working age in India. The mean age is 31.53
years and mean of years of work experience is 8.53 years.
7. Analysis of Gender Pay Gap in India – Median Hourly Wage
The GPG is computed according to the formula:
It can be interpreted as the percentage difference between female and male median wages (CELSI,
2012)11. During the data analysis only those variables were considered where there were sufficient
numbers of female observations.
7.1. GPG in India (2008 – 2016): To analyze the pay differentials between males and females, and to
know the parity between the salaries of both the genders, year-wise data were analyzed as seen in
Table 2. The results showed an astonishing gap of 67.27% before 2009 (females earned less than
males). Though this gap has been constantly shrinking since 2010, the gap continues to be at a
disturbing rate of 36.12% in 2016. These figures point to the fact that unless there is drastic
action taken by the government, achieving pay equality as a matter of normal progression
appears to be a distant dream.
7.2. GPG across Indian States: The Indian Union is made up of 29 states and 7 union territories.
The states enjoy political and administrative freedom while working within the framework of the
constitution. Nonetheless, there are huge differences between the states in terms of social,
cultural and economic setup. Analysis of Paycheck data clearly shows that the GPG varies across
Indian states12 as seen in table 3. For the purpose of our analysis, the Indian Union has been
divided into six zones – North (Himalayan), East, West, South13, Central (the Plains) and North-
East14 as seen in Table 4.
Reasons:
• Difference in gender sensitivity perceptions
• Prevalence of different customs across different states
• Variations in LFPR rates in different states (CSO, 2006)
11 The formula used here for computation of GPG is used in various reports published by WageIndicator Foundation, Amsterdam (www.wageindicator.org). 12Only those states are considered for this analysis, which has sufficient number of female observations. 13 For this paper, Telangana and Andhra Pradesh are considered as one State. 14 In the light of the vision of Jawaharlal Nehru (first Prime Minister of India), five Zonal Councils were set up vide Part-III of the States Re-Organisation Act, 1956 (Ministry of Home Affaris, 2010).
Pay Gap = Median wage female - Median wage male
Median wage male * 100%
11
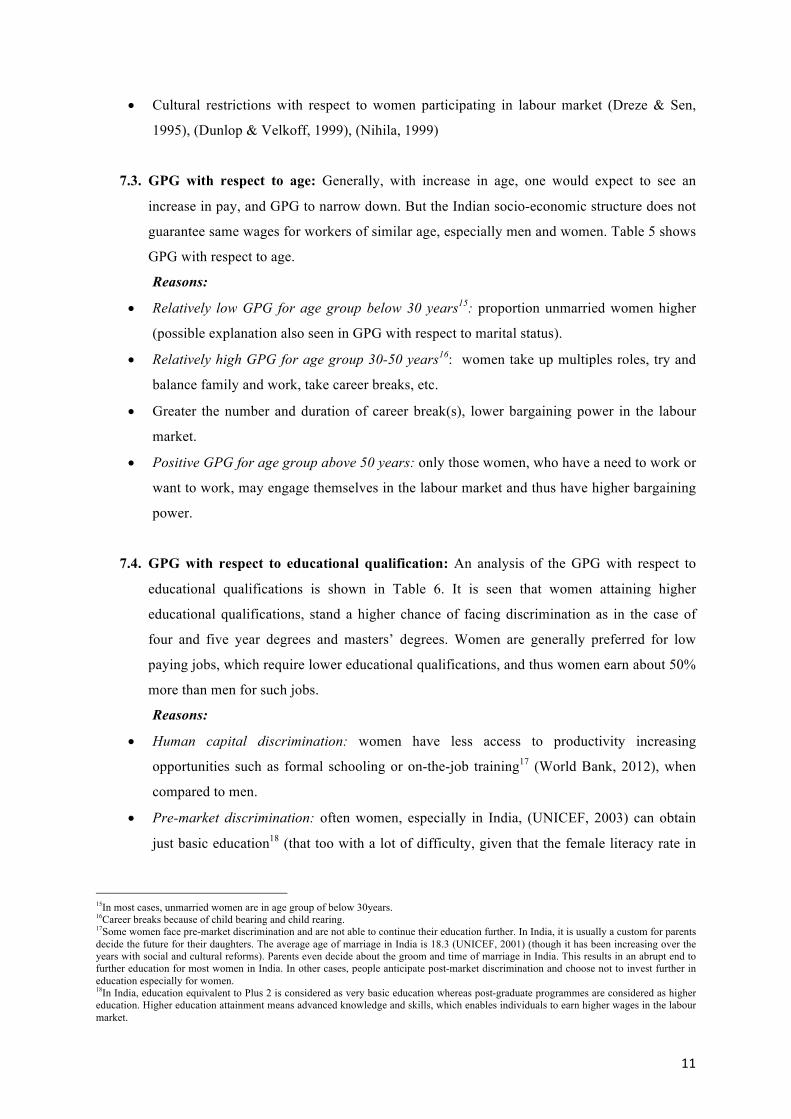
• Cultural restrictions with respect to women participating in labour market (Dreze & Sen,
1995), (Dunlop & Velkoff, 1999), (Nihila, 1999)
7.3. GPG with respect to age: Generally, with increase in age, one would expect to see an
increase in pay, and GPG to narrow down. But the Indian socio-economic structure does not
guarantee same wages for workers of similar age, especially men and women. Table 5 shows
GPG with respect to age.
Reasons:
• Relatively low GPG for age group below 30 years15: proportion unmarried women higher
(possible explanation also seen in GPG with respect to marital status).
• Relatively high GPG for age group 30-50 years16: women take up multiples roles, try and
balance family and work, take career breaks, etc.
• Greater the number and duration of career break(s), lower bargaining power in the labour
market.
• Positive GPG for age group above 50 years: only those women, who have a need to work or
want to work, may engage themselves in the labour market and thus have higher bargaining
power.
7.4. GPG with respect to educational qualification: An analysis of the GPG with respect to
educational qualifications is shown in Table 6. It is seen that women attaining higher
educational qualifications, stand a higher chance of facing discrimination as in the case of
four and five year degrees and masters’ degrees. Women are generally preferred for low
paying jobs, which require lower educational qualifications, and thus women earn about 50%
more than men for such jobs.
Reasons:
• Human capital discrimination: women have less access to productivity increasing
opportunities such as formal schooling or on-the-job training17 (World Bank, 2012), when
compared to men.
• Pre-market discrimination: often women, especially in India, (UNICEF, 2003) can obtain
just basic education18 (that too with a lot of difficulty, given that the female literacy rate in
15In most cases, unmarried women are in age group of below 30years. 16Career breaks because of child bearing and child rearing. 17Some women face pre-market discrimination and are not able to continue their education further. In India, it is usually a custom for parents decide the future for their daughters. The average age of marriage in India is 18.3 (UNICEF, 2001) (though it has been increasing over the years with social and cultural reforms). Parents even decide about the groom and time of marriage in India. This results in an abrupt end to further education for most women in India. In other cases, people anticipate post-market discrimination and choose not to invest further in education especially for women. 18In India, education equivalent to Plus 2 is considered as very basic education whereas post-graduate programmes are considered as higher education. Higher education attainment means advanced knowledge and skills, which enables individuals to earn higher wages in the labour market.

12
India is merely 65.46%) (National Comission on Population, 2013). Additionally, women
typically only have access to education of an inferior quality as compared to men19.
7.5. GPG with respect to Industry: The jobs taken up men and women are often different,
whether they are across sectors, industries, occupations, types of jobs, or types of firms. In
India, all industries (except agriculture) face a GPG crisis as seen in Table 7.
Reasons:
• Gender segregation: women not only in India but across the globe seem to be concentrated in
low paying and low productivity jobs (World Bank, 2012).
7.6. GPG with respect to work experience: Human capital can be gained not only by investing
in education but also through work experience. It is expected that over a period, people with
the same amount of work experience should be paid similar salaries. This also assumes that
education/skill levels are congruent. The analysis shows a rather unexpected trend, as
depicted in Table 8.
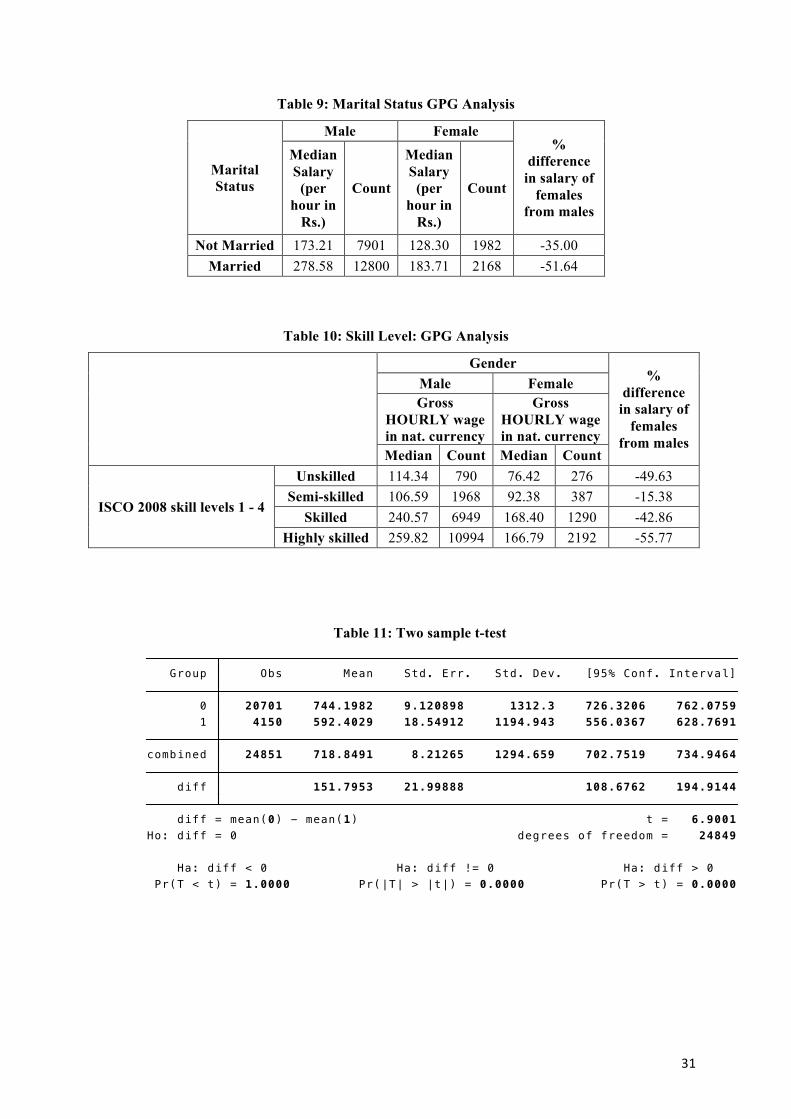
7.7. GPG with respect to marital status: Marital status also determines the amount of wages
paid to an individual, especially to women as seen in Table 9. GPG is higher for married
women than unmarried women.
Reasons:
• Elasticity of labour supply curve: women tend to have less elastic labour supply curve, and
hence are paid lower wages20.
• Mobility: women generally have less geographical and occupational mobility21.
• Occupational segregation: women do not have access to a wide range of occupations and
jobs as men.
• Responsiveness to wage change: women do not change jobs as quickly as men because of
increase in wages.
• Unionization: women have a lower tendency to join unions and have lesser bargaining
power22.
7.8. GPG with respect to skill level: It is evident from Table 10 that the GPG is high for
unskilled jobs and skilled jobs, it widens further for highly skilled jobs.
Reasons:
• Level of skill: women are not preferred for skilled or high skilled jobs. 19In India, due to social factors there is a preference for a male child and hence, more care is taken of the male child. 20 It should be noted that in this model, the employer need not be prejudiced towards hiring male employees. 21 For example, if a woman’s husband has a job in a particular locality, she may be unwilling to accept a job in another locality. 22 The significance of this is that union reduces monopsonistic employer’s ability to exploit workers.

13
• Association between level of skill and jobs: women are mostly crowded in lower paying jobs,
since they are offered only low skill jobs.
• Disadvantaged group: It is also easy to pay less to a disadvantaged group or less preferred
group (Milgrom & Oster, 1987).
The above GPG mentioned till now is in terms of percentage. To get a better understanding we also
calculate the pay gap in absolute values by regression analysis.
8. Methodology
For analysis, an OLS regression model is used commonly (for the benefit of coefficient
interpretation), as it will further highlight the variables which are significant and tell us how it impacts
hourly wages (Blau & Beller, 1988). Literature suggests that “treating the aggregated answers as
continuous variables leads to the same conclusions. The results from the analysis cannot be
interpreted in a causal way because these data sets do not follow the same individuals each year, and
therefore the analysis does not correct for unobserved individual effects” (Guzi & García, 2015). All
variables are taken as absolute values. While the aim is to find the effect of gender on the gross hourly
wage rate, all other variables will be controlled for in the analysis.
8.1. Variables
8.1.1. Dependent Variable
wagegrhr – gross hourly wage variable is the dependent variable for our research. In the ‘paycheck’
survey individuals were asked to enter their wage per hour not accounting for the tax they pay on it.
8.1.2. Independent Variables
• gender – the variable is binary. 0 is male and 1 is female. As stated in the hypothesis, it is
expected that with an increase in the value of gender; i.e. if the value changes from 0 to 1 there
will be a decrease in the wage. Thus, in regression analysis if the coefficient is negative then it
would signify that the GPG exists and men are paid higher than women.
• educat1 – signifies education qualification. There are 12 options an individual can pick from thus
it is a categorical variable. The options are as follows: no education, below 10 (10th grade or
lower), plus 2 (12th grade/ high school), 3-year degree (B.A., B.B.A., B.Com., etc.), 4/5-year
degree (B.Tech., B.Arch., L.L.B., etc.), C.A./C.S. (Chartered Accountant/ Company Secretary),
masters (M.Sc., M.Tech., etc.), advanced diploma, I.T.I. (Industrial Training Institute degree),
Ph.D., post doctorate and others. Dummy variables were generated for all the aforementioned
categories for the purpose of analysis. This is done to analyse the effect of individual categories
14
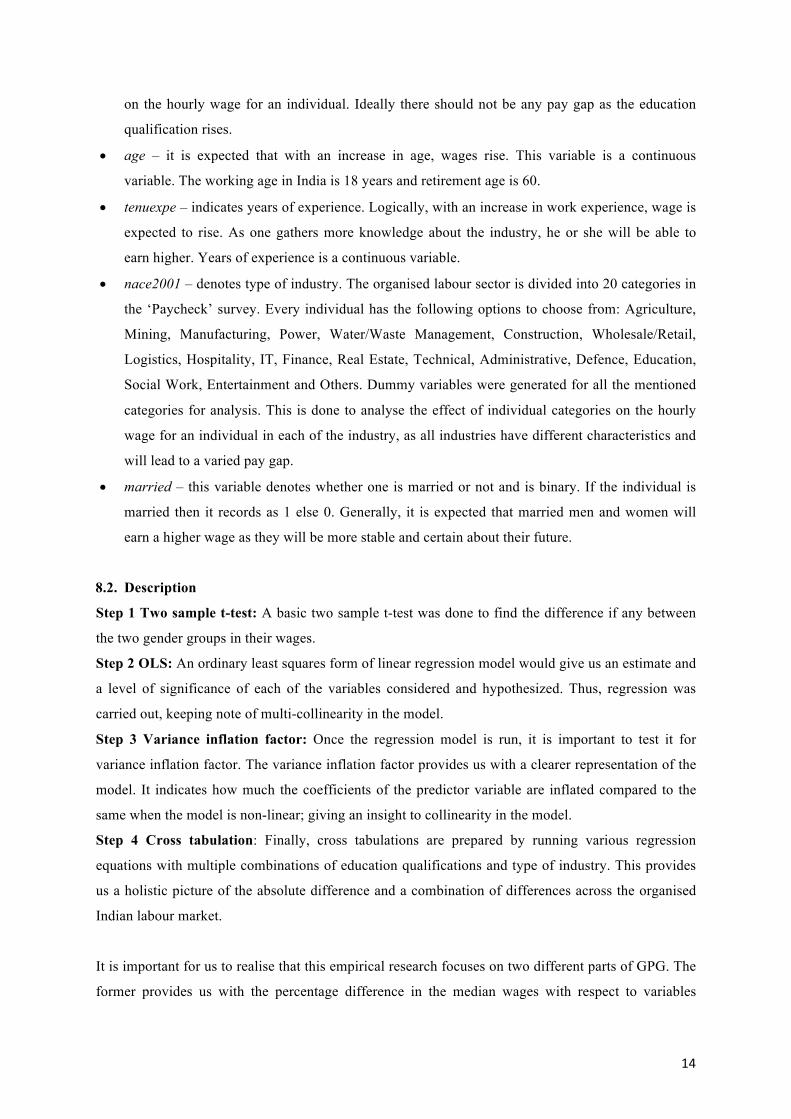
on the hourly wage for an individual. Ideally there should not be any pay gap as the education
qualification rises.
• age – it is expected that with an increase in age, wages rise. This variable is a continuous
variable. The working age in India is 18 years and retirement age is 60.
• tenuexpe – indicates years of experience. Logically, with an increase in work experience, wage is
expected to rise. As one gathers more knowledge about the industry, he or she will be able to
earn higher. Years of experience is a continuous variable.
• nace2001 – denotes type of industry. The organised labour sector is divided into 20 categories in
the ‘Paycheck’ survey. Every individual has the following options to choose from: Agriculture,
Mining, Manufacturing, Power, Water/Waste Management, Construction, Wholesale/Retail,
Logistics, Hospitality, IT, Finance, Real Estate, Technical, Administrative, Defence, Education,
Social Work, Entertainment and Others. Dummy variables were generated for all the mentioned
categories for analysis. This is done to analyse the effect of individual categories on the hourly
wage for an individual in each of the industry, as all industries have different characteristics and
will lead to a varied pay gap.
• married – this variable denotes whether one is married or not and is binary. If the individual is
married then it records as 1 else 0. Generally, it is expected that married men and women will
earn a higher wage as they will be more stable and certain about their future.
8.2. Description
Step 1 Two sample t-test: A basic two sample t-test was done to find the difference if any between
the two gender groups in their wages.
Step 2 OLS: An ordinary least squares form of linear regression model would give us an estimate and
a level of significance of each of the variables considered and hypothesized. Thus, regression was
carried out, keeping note of multi-collinearity in the model.
Step 3 Variance inflation factor: Once the regression model is run, it is important to test it for
variance inflation factor. The variance inflation factor provides us with a clearer representation of the
model. It indicates how much the coefficients of the predictor variable are inflated compared to the
same when the model is non-linear; giving an insight to collinearity in the model.
Step 4 Cross tabulation: Finally, cross tabulations are prepared by running various regression
equations with multiple combinations of education qualifications and type of industry. This provides
us a holistic picture of the absolute difference and a combination of differences across the organised
Indian labour market.
It is important for us to realise that this empirical research focuses on two different parts of GPG. The
former provides us with the percentage difference in the median wages with respect to variables

15
chosen in the analysis. The latter concentrates on the absolute difference between the wages of men
and women. This helps us realise the magnitude of the gap whereas the former helps us to identify the
gaps more clearly.
8.3. Regression Model
We have used multiple models across the paper:
Model 1: For OLS regression (Blau & Kahn, 2003): 𝑤𝑎𝑔𝑒𝑔𝑟ℎ𝑟 = 𝛼 +𝛽,𝑔𝑒𝑛𝑑𝑒𝑟 + 𝛽/𝑎𝑔𝑒 + 𝛽0𝑡𝑒𝑛𝑢𝑒𝑥𝑝𝑒 + 𝛽5𝑚𝑎𝑟𝑟𝑖𝑒𝑑
+ 𝛽8 𝑒𝑑𝑢𝑐𝑎𝑡1𝑣𝑎𝑟𝑖𝑎𝑏𝑙𝑒𝑙𝑖𝑠𝑡 + 𝛽? 𝑛𝑎𝑐𝑒2001𝑣𝑎𝑟𝑖𝑎𝑏𝑙𝑒𝑙𝑖𝑠𝑡
Model 2: For Cross-tab for absolute gender pay gap:
𝑤𝑎𝑔𝑒𝑔𝑟ℎ𝑟 = 𝛼 +𝛽,𝑔𝑒𝑛𝑑𝑒𝑟 + 𝛽/𝑡𝑒𝑛𝑢𝑒𝑥𝑝𝑒 +𝛽0 𝑒𝑑𝑢𝑐𝑎𝑡1𝑣𝑎𝑟𝑖𝑎𝑏𝑙𝑒𝑙𝑖𝑠𝑡
+ 𝛽5 𝑛𝑎𝑐𝑒2001𝑣𝑎𝑟𝑖𝑎𝑏𝑙𝑒𝑙𝑖𝑠𝑡
The educat1 and nace2001 variable list was run for all levels of education and industries.
8.4. Results and Discussion
Results from the two-sample t-test confirm that there exists a pay gap when it comes to gender. We
see that the difference in means is Rs. 151.80, which also represents the absolute difference in gross
hourly wage rate in table 11, amounting to ~Rs. 31,208 per month23. Evidently the GPG is vast and
demands further analysis.
OLS regression is presented in table 12. It is evident that there exists a GPG. Accounting for all the
controlling variables mentioned earlier we see that the gender coefficient is -91.98 in table 3,
suggesting that in the organised labour sector women are paid ~Rs 19,132 per month24 (Rs. 91.98 per
hour) less than men. Age does not play a major role in gender wage gap as the coefficient is close to
0. Years of work experience and marriage are highly significant as the variables have a p-value of <
0.0005. We see that with an increase in work experience the pay does increases. However, when it
comes to marriage in the Indian context, women who are not married are not paid well as their future
is uncertain, in keeping with the general labour market convention.
Regression analysis also gives us wages earned per hour for particular industry and level of education
qualification. We see that most of the lower education qualifications such as no education, below 10,
plus 2 and 3 year degrees are associated with a lower hourly wage. This is expected as by applying
simple logic one can say that if an individual is not educated the wages earned will be lower,
23 It is influenced by sample characteristics, for the high paying managerial occupations/jobs. For lower levels, monthly salary will be lower than that. Which are a part of the survey. Law of averages. But there exists a gap. 24 Calculation: Rs. 91.98 per hour * 8 hours per day * 26 days per month = ~ Rs. 19,132

16
irrespective of gender. Similarly, a different interpretation can be chalked out based on industries. To
understand the effects of educational qualification and industry specific pay gaps a further regression
study is done below.
For further check, a variance inflation factor (VIF) is calculated for every single variable used in the
regression model. Table 13 below shows the VIF for each variable. Results indicate that the model is
a relatively good fit with VIF for almost all variables being less than 10. Only 5 variables which are
master, deg45y, deg3y, it, manufact have a high variance inflation factor suggesting that the
regression coefficients might be inflated and the predictor variables are not linearly related.
After a collinearity check we can drop the age variable as we see collinearity existing with years of
work experience. Graph 1 expresses the mentioned relationship. The collinearity value is ~0.89
between age and years for work experience.
As mentioned earlier a cross-tab is prepared by the multiple regression model as represented in table
14. There exists a GPG even with the same educational qualification and working in the same
industry:
• In the agricultural sector, men earn more than women. Even after a 4/5-year degree women earn
Rs. 411.50 less than men per hour.
• Mining, manufacturing, power and water/waste management have a similar outcome to that of
agriculture; men have been earning more than women throughout.
• Sectors like construction have a gap of Rs. 472.40 even after a masters’ degree.
• Parallel comparisons can be made with educational qualifications. If one looks at the column of
masters or advanced diploma in Table 14, we realise that men still earn more than women.
There are some positives for women when it comes to the GPG:
• There are pockets created where women are earning more than men. However, this is a very
marginal amount when compared to the pay gap in favour of men.
• In sectors like social work, administrative jobs and technical services, women have a higher
wage per hour than men. Though not consistent but after an advanced diploma women receive
Rs. 114.60 per hour more than men in administrative jobs.
Crowding down effect is observed, where women are increasingly moving out of front-end and
customer interface jobs to back-end jobs. Gender stereotyping has led to women being concentrated
in certain industries and they are not preferred for highly skilled jobs, making the glass ceiling even
harder.

17
8.5. Limitations and future prospects
Omitted variables play a vital role in such analyses. As mentioned earlier, some variables were
removed from our models as they did not fit well in the regression equation. An omitted variable bias
exists which surely affects the model. Some variables are mentioned below which could have been
added to the model if available (variables mentioned under socio-economic factors).
Moreover, our analysis is based on national level data. Such an investigation would be substantially
more accurate and strong with the usage of individual level data, as that would clearly display what
causes these individuals to have a pay gap due to gender. National level analysis is a much wider and
broader aspect to look at. Interstate differences themselves are high, with each having varied
characteristics for jobs and dominating industries.
Further, more socio-economic household factors can be accounted for in further studies if this
information for the individuals were present. Information like total household income, parental
education, number of children, etc. would surely better the model.
Multicollinearity is faced as certain predictor variables in OLS regression model are highly correlated
and thus must be removed from the model completely. It is assumed that the cause and effect
relationship between the variables remains unchanged.
Another very important point to be reflected upon in the research is that the data are censored. The
data are highly skewed due to the nature of wage itself. As we consider higher wages, the number of
observations for that bracket starts reducing. The kernel density graph clearly depicts the same as seen
in Graph 2.
Therefore, we need to find a better model that fits the same. Censored modelling will be done in the
near future. Also, there is a selection bias which interferes with our research. A Heckman selection
model will be run to help us eliminate the selection bias. Though the aim of the paper is not to
decompose the model for finding how wage is predicted, we plan to run the Blinder-Oaxaca
decomposition which will help us explain the difference in means of the dependent variable with
respect to the model components.
9. Innovative ways to close the gap and Policy Recommendations
We know that GPG exists in every part of the world, and India is no exception. When we delve deeper
in the literature, we find that no single country has been able to close down the GPG entirely, but most
them are attempting to narrow the gap as far as possible (Tijdens & Klaveren, 2012). But this cannot
happen without simultaneous interventions at various levels. Thus, we have provided concrete and

18
innovative policy recommendations to enable Indian women and men to overcome gendered barriers
in the labour market (Matejczyk, n.d.; Lam, 2016; and Holmes & Corley, 2017).
9.1. Government Level:
• Watch the GPG on continuous basis and intervene proactively, rather than reactively. A robust
system for continuously monitoring wage levels and computing the gaps may be set up by the
government.
• The government should officially publish GPG data, which will increase the awareness and
mechanisms to reduce the gaps.
• India has one of the most progressive HR policies which are women friendly, in terms of 6-
month maternity leave for all organizations and 2 years’ child care leave for women in
government jobs. Such policies have influenced the private sector also, with more and more
firms introducing more liberal benefits for women.
• The government should strengthen compliance to equality, and since it is illegal for any
organization to pay men more than women for the same job under Equal Remuneration Act,
1976. The scope of Equal Remuneration Act, 1976 should be enhanced to cover all the levels of
employment.
• Revisit the Equal Remuneration Act, 1976. Understand the reasons why it is not working and
create a reporting mechanism.
• As a step to improve gender representation, the Companies Act 2013 has made it mandatory to
include at least one female member on the board of directors for publicly listed companies in
India. But the representation of women board members is still only 11.2% for Indian firms,
suggesting that India’s performance is still far below average. Many firms face challenges in
finding suitable women talent
• Under the Factories Act, the crèche (child care facility) rule is currently applicable based on
number of women employed. We suggest that it should be gender neutral. Keeping in view the
social realities, men also bring their kids to work in many cases, where both parents are working.
9.2. Organizational Level:
• Mechanisms which encourage transparency in salary reporting across all levels and tackle
discrepancies in the same should be introduced.
• Organizations also must critically examine GPG and strive that it does not exist at any level.
• Organizations need to approach recruitment and promotion with more sensitivity, and move
away from gender stereotypes (Comment made by Satya Nadella, Microsoft CEO, during a visit
to India “women should trust karma instead of asking for pay raises”. Later, he and the company
apologised for the comments, (Chowdhry, 2014))
• Very few women are promoted to higher levels in organizations, who then become ‘poster girls’
for the organisation instead of addressing the issue of inequality. Rather a policy of proportionate

19
employment and opportunity needs to be implemented. A meaningful progression plan for the
employees should be in place to build culture and career paths.
• Focused programs for women development and empowerment (Cummins India Ltd. encouraging
women to take up engineering jobs and GE’s Balancing the Equation Campaign).
• Work design should offer workplace flexibility along with client site flexible work arrangements,
subject to suitability to the firmThe work environment should be made less intimidating for
women in traditionally male dominated professions like finance, executive management,
engineering, etc.
• Organizations should promote a diverse and more inclusive environment by engaging women in
both senior and leadership roles. Organizations should create a culture which can acknowledge
all employees, preserve individuality and animate networking and life-long earnings.
• Across all sectors, women, both mother-to-be and mothers, can be given better maternity leave
policy arrangements, flexible working hours and if not free, at least affordable child care.
Women need not bear the ‘motherhood penalty’ by taking time off, reducing work hours or
quitting their job to take care of their children.
9.3. Academic Level:
• Expanding and encouraging efforts for pay data collection and reporting (Paycheck India and
WageIndicator.org are examples) and research with the aim to create more transparency in the
labour market, along with regular gender audits.
• Programs to sponsor women’s education and provide them with unbiased training should be
encouraged.
• Second opportunity programs, especially for women who join the workforce after a career break,
need to be encouraged (Tata’s Second Career Internship Program).
• Formal mentorship programs for women can be created in organisations.
• Universities/colleges can take lead in creating formal support networks for women, which can
give them access to crucial information regarding jobs and promotions.
• Academic policies to encourage women to take up careers in STEM, and other major profitable
areas.
9.4. Individual Level:
• Women need to show openness to risk taking and venture into non-traditional occupations and
roles.
• Women should be willing to take chances with their second opportunities, and not shy away from
different job options available in the labour market. There are several programs (Tata’s Second
Career Internship Program) and agencies (AVTAR Career Creators) which help women to
achieve meaningful second careers, but they need to work hard to become more aware and use
opportunities

20
• Women should also be willing to take more responsibilities at an individual level or even while
making conscious job choices.
9.5. Society Level:
• The society needs to change its mind-set and be open towards women working in industries
which are traditionally not women oriented (STEM).
• Family responsibility and unpaid care should be promoted as joint responsibility of couples
rather than imposing the entire burden on women, a movement of non-market jobs to market jobs
must be created for women.
• Encourage women to take up jobs that pay more and with higher growth prospects.
• Encourage women to take up full-time jobs instead of part-time jobs and enhance their earnings.
• Women are not looked at as good negotiators, and thus it results in widening the GPG. This
perception needs to change and for that, women need to proactively seek information, learn and
engage in negotiation, rather than accepting what is given or even underselling themselves.
• Tt is falsely assumed that mothers might not be as good at their jobs, as they were before their
pregnancy and thus, will not work as hard as men and thus, should not expect employment or
promotions. However, the assumption is not data based – but a continued rhetoric, supported by
anecdots or partial information. Conclusions based on emperical study about productivity gaps,
and if it exists, the reasons for the same can help to arrive at a realistic picture.
10. Conclusion
Although disheartening, GPG does exist in India. Paycheck data and its analysis have given us
insights to show that the gap exists with two effects. One being positive that clearly indicates the GPG
to be narrowing but still high and requiring immediate policy interventions. The other being, gender
stereotyping, where women are traditionally offered only certain types of jobs. More women choose
soft specializations in human resource roles and administration, because they are more female
friendly. Even the organizations that are trying to improve women ratio in the workplace, are hiring
women for backend jobs. This can be termed as blatant discrimination. The side effects of such a
policy can only be addressed by transparency and education. Since this gap is neither good for gender
equality nor for women empowerment.
Looking at the GPG figures in India, unless there are focused policy-level interventions, achieving
equality in pay as a matter of normal progression seems to be a distant dream. The Constitution of
India does promise equality in all aspects to its citizens, irrespective of any characteristic. But there
still exist vast differences in socio-economic aspects, which imply a direct violation of basic rights,
especially when it comes to not giving equal opportunity and equal pay to women who choose to
work in the organized sector. By denying equality to women, the nation is not harnessing the potential

21
of its labour force to the fullest. At the same time, it should also be noted that policy interventions
should focus on programs that encourage and support women to make their mark in the world of
work.
Apart from constitutional provisions, there have been administrative actions initiated in that direction.
For example, the government has tried to set norms that would limit discrimination of employees
through the Sixth Pay Commission (Ministry of Finance, 2008). With a continuously growing private
sector (Economic Survey, 2013) in India, firms will have to formulate their policies such that the gap-
induced limitations do not contaminate the labour market.
Despite the efforts of the government, over time, the GPG has become institutionalized, a matter of
grave concern. But the time has come now that we should focus on trying to reduce its impact on
society. If these issues are not contained as a matter of urgency, then the problem of the GPG is likely
to be further aggravated. Thus, policy-level interventions will have to be complemented with changes
in socio-cultural factors as well.
“Business, Government, International organizations and Academia all have an important role to play
in closing the gender pay gap. Collaboration among these organizations is key to providing the right
opportunities, environments and role models to lead the way for change” (Accenture, 2017). These
gaps can only be addressed if the results are made a part of the official reporting by NSSO. This in
turn would help in tracking the problem and designing policies to fill up the gaps. Diversity and
equity is required both, at an organizational and individual level along with acceptance. There are
positive trends, but much more needs to be done.

22
11. Works Cited Accenture, 2017. Getting to Equal 2017: Closing the Gender Pay Gap, s.l.: Accenture Research.
Agrawal, S., Khan, J. & Upadhyay, H., 2014. Labour Market Discrimination Against Women in India. Indian Development Review, January-December, 12(1-2), pp. 93-116.
Agrawal, T., 2013. Gender and caste-based wage discrimination in India: some recent evidence. Journal of Labour Market Research, 29 November, 47(4), pp. 329-340.
Agrawal, T. & Vanneman, R., 2014. Gender-based Wage Differentials in India: Evidence Using a Matching Comparisons Method. Boston, Princeton University.
Bhattacharjee, S., Hnatkovska, V. & Lahiri, A., 2015. The Evolution of Gender Pay. In: S. Shah, A. Panagariya & S. Gokarn, eds. India Policy Forum 2014-15: Volume 11. New Delhi: Sage Publications India.
Blau, F. D. & Beller, A. H., 1988. Trends in Earnings Differentials by Gender, 1971-1981. Industrial and Labor Relations Review, July, 41(4), pp. 513-529.
Blau, F. D. & Kahn, L. M., 2003. Understanding International Differences in the Gender Pay Gap. Journal of Labor Economics, January, 21(1), pp. 106-144.
Business Standard, 2016. Women in India earn nearly 19% less than men: Report, New Delhi: Business Standard India.
CELSI, 2012. Loonwijzer-Monsterboard Wage Index. Sector Analysis of the Netherlands, Amsterdam: Wage Indicator Foundation and Bratislava, Central European Labour Studies Institue (CELSI).
Census India, 2011. Chapter 5: Gender Composition of the Population. [Online] Available at: http://www.censusindia.gov.in/2011-prov-results/data_files/india/Final_PPT_2011_chapter5.pdf [Accessed 24 September 2013].
Chakraborty, S., 2016. The Price of Prefjudice: Employment Trend and Wage Discrimination of Women Workers in India. The Journal of Industrial Statistics, 5(2), pp. 192-226.
Chowdhry, A., 2014. Microsoft CEO Satya Nadella Apologizes for Comments on Women's Pay. [Online] Available at: https://www.forbes.com/sites/amitchowdhry/2014/10/10/microsoft-ceo-satya-nadella-apologizes-for-comments-on-womens-pay/#6d2b25bb6d2b [Accessed 1 May 2017].
CSO, 2006. Selected Socio-Economic Statistics - India, s.l.: Ministry of Statis and Programme Implemtation, Government of India.
Dreze, J. & Sen, A., 1995. India: Economic Development and Social Opportunity. Oxford: Oxford University Press.
Dunlop, J. E. & Velkoff, V. A., 1999. Women and the Economy in India. s.l.:U.S. Census Bureau, Offical Statistics.
Duraisamy, P. & Duraisamy, M., 1998. Accounting for Wage differentials in an Organized Labour Market in India. The Indian Journal of Labour Economics, 41(4), pp. 934-944.
Economic Survey, 2013. Economic Survey 2012-13, s.l.: Ministry of Finance, Government of India.

23
Education International, 2011. The Gender Pay Gap - Reasons and Implications. Brussels: http://download.ei-ie.org/Docs/WebDepot/feature2 - 100303 - reasons and implications - final EN.pdf.
Gangopadhyay, K., 2015. Sexual Violence: A Model of Occupational Choice and Gender Wage Gap. Journal of Interdisciplinary Economics, 26 June, 27(2), pp. 219-244.
Goldberg, J. D. & Hill, C. A., 2007. Behind the Pay Gap. Washington, DC: AAUW Educational Foundation.
Guzi, M. & García, P. d. P., 2015. A web survey analysis of subjective well-being. International Journal of Manpower, 36(1), pp. 48-67.
Haas, S., 2006. Economic Development and the Gender Wage Gap. The Park Place Economist, Volume 14, pp. 49-55.
Hay Group, 2016. The real gap: fixing the gender pay divide. A gender pay gap exists - just not in the way conventional wisdom holds, s.l.: Korn Ferry Hay Group.
Hausmann, R., Tyson, L. D. & Zahidi, S., 2011. The Global Gender Gap Report, Geneva: World Economic Forum.
Holmes, K. & Corley, D., 2017. International Approaches to Closing the Gender Wage Gap. [Online] Available at: https://www.americanprogress.org/issues/women/reports/2017/04/04/429825/international-approaches-closing-gender-wage-gap/ [Accessed 1 May 2017].
Lam, B., 2016. How Do We Close the Wage Gap in the U.S.?. [Online] Available at: https://www.theatlantic.com/business/archive/2016/03/equal-pay/472407/ [Accessed 1 May 2017].
ILO, 2016. Women at Work Trends 2016. Geneva, International Labour Office.
ILO, 2016. The Global Wage Rport 2016/17: Wage inequality in the workplace, Geneva: International Labour Office.
Jann, B., 2008. The Blinder-Oaxaca Decomposition for Liner Regression Models. The Stata Journal, 8(4), pp. 453-479.
Madheswaran, S. & Lakshmanasamy, T., 1996. Occupational Segregation and Earnings Differentials by Sex: Evidence from India. Artha Vijnana, 38(4), pp. 372-386.
Madheswaran, S. & Khasnobis, B. G., 2007. Decomposition of Gender Wage Gap in India: An Econometric Analysis. [Online] Available at: http://www.google.co.in/url?sa=t&rct=j&q=&esrc=s&frm=1&source=web&cd=7&ved=0CG4QFjAG&url=http%3A%2F%2Fwww.hss.iitb.ac.in%2Fties07%2Fpaper%2Fts5%2FpsB%2F1.doc&ei=4fgEULiGC4n5rQfu6_CxBg&usg=AFQjCNEHTQzJYQLkIpOoJqjErF5pslBs6w [Accessed 25 September 2013].
Mahajan, K. & Ramaswami, B., 2017. Caste, Female Labor Supply, and the Gender Wage Gap in India: Boserup Revisited. Economic Development and Cultural Change, January, 65(2), pp. 339-378.
Mahajan, K., 2017. Rainfall Shocks and the Gender Wage Gap: Evidence from Indian Agriculture. World Development, March, Volume 91, pp. 156-172.

24
Matejczyk, A., n.d. 5 Ways Top Companies are Closing The Gender Gap. [Online] Available at: https://www.ellevatenetwork.com/articles/7357-5-ways-top-companies-are-closing-the-gender-gap [Accessed 1 May 2017].
Milgrom, P. & Oster, S., 1987. Job Discrimination, Market Forces, and the Invisibility Hypothesis. The Quaterly Journal of Economics, 80(3), pp. 453-476.
Ministry of Finance, 2008. Report of the Sixth Central Pay Commission, s.l.: Government of India.
Ministry of Home Affaris, 2010. Zoncil Council. [Online] Available at: http://mha.nic.in/uniquepage.asp?ID_PK=470 [Accessed 25 September 2013].
Mohanty, S. S., Bisht, M. & Mohapatra, P., 2014. Gender Wage Gap among Salaried Workers in India: Results of a Principal Component Analysis of State Level Statistics. Economic Affairs, 59(2), pp. 175-190.
National Comission on Population, 2013. Literacy Rate. [Online] Available at: http://populationcommission.nic.in/content/933_1_LiteracyRate.aspx [Accessed 25 September 2013].
National Statistical Commission, 2012. Report of the Committee on Unorganised Sector Statistics, s.l.: Government of India.
Nihila, M., 1999. Marginalisation of Women Workers: Leather Tanning Industry in Tamil Nadu. Economic and Political Weekly, 17-24 April.
Paul, S. & Paul, S., 2013. Trade Reforms and the Gender Wage Gap in India. New Orleans, LA, Population Association of America 2013 Annual Meeting Program.
Pertersen, T. & Snartland, V., 2004. Firms, Wages, and Incentives: Incentive Systems and Their Impacts on Wages, Productivity, and Risks. Research in Social Stratification and Mobility, Volume 21, pp. 255-288.
Planning Commission, 2006. Report of the Working Group on Empowerment of Women for The XI Plan (2007 - 2012, s.l.: Ministry of Women and Child Development, Government of India.
Reilly, B. & Dutta, P. V., 2005. The Gender Pay Gap and Trade Liberlisation: Evidence for India. s.l.:PRUS Working Paper no. 32.
Rees, T. L., 1992. Women and the Labour Market. London: Routledge.
Sen, A., 2001. Many Faces of Gender Inequality. Frontline, Oct. 27 - Nov. 09, 18(22).
Sengupta, A. & Das, P., 2014. Gender Wage Discrimination across Social and Religious Groups in India. Economic & Political Weekly, 24 May, XLIX(21), pp. 71-76.
Solanki, A. & Zankharia, K., 2014. Discrimination in Wages: A Case Study of Migrant Construction Workers in Surat City. Journal of Economic and Social Development, December.X(2).
Tijdens, K. G. & Klaveren, M. V., 2012. Frozen in Time: Gender Pay Gap Unchanged for 10 Years, Brussels: ITUC.
The World Bank, 2011. Gender Equality Data and Statistics. [Online] Available at: http://datatopics.worldbank.org/gender/topic/economic-structure [Accessed 24 September 2013].

25
The World Bank, 2012. World Development Report, s.l.: World Bank.
The World Bank, 2016. Gender Equality Data and Statistics. [Online] Available at: http://datatopics.worldbank.org/gender/topic/economic-structure [Accessed 13 April 2016].
UNICEF, 2001. Age at Marriage - India. [Online] Available at: http://www.unicef.org/india/Media_AGE_AT_MARRIAGE_in.pdf [Accessed 25 September 2013].
UNICEF, 2003. India Statistics. [Online] Available at: http://www.unicef.org/infobycountry/india_statistics.html#103 [Accessed 25 September 2013].
UNIFEM, 2005. Progress of The World's Women: Women, Work and Poverty, New york: United Nations Development Fund for Women.
United Nations, 2011. World's Women - Chapter 4: Work. [Online] Available at: http://unstats.un.org/unsd/demographic/products/Worldswomen/WW2010%20Report_by%20chapter(pdf)/Work.pdf [Accessed 24 September 2013].
Varkkey, B., Korde, R. & Anand, L., 2012. [Online] Available at: http://www.wageindicator.org/documents/publicationslist/publications-2012/Gender%20Pay%20Gap%20FINAL%20REPORT.pdf [Accessed 7 December 2012].
Varkkey, B. & Korde, R., 2013. Gender Pay Gap in the Formal Sector: 2006-2013. Preliminary Evidences from Paycheck India Data, Amsterdam: WageIndicator.Org.
Zahidi, S. & Ibarra, H., 2010. The Corporate Gender Gap Report, Geneva: World Economic Forum.

26
Annexure 11.1. Exhibits
Exhibit 1: Articles of the Constitution of India
Source: Report of the Working Group on Empowerment for Women for the XI Plan, Ministry of Women and Child Development, Government of India (Planning Commission, 2006).
Exhibit 2: Acts passed by the Government of India for the Labour Market
Source: Planning Commission, 2006
Article Description Article 14 Men and women to have equal rights and opportunities in the political,
economic and social spheres. Article 15(1) Prohibits discrimination against any citizen on the grounds of religion,
race, caste, sex etc. Article 15(3) Special provision enabling the State to make affirmative discriminations
in favour of women. Article 16 Equality of opportunities in matter of public appointments for all citizens. Article 39(a) The State shall direct its policy towards securing the right to means of
livelihood for all citizens, men and women, equally. Article 39(d) Equal pay for equal work for both men and women. Article 42 The State to make provision for ensuring just and humane conditions of
work and maternity relief. Article51(A)(e) To renounce practices derogatory to the dignity of women.
Workmen’s Compensation Act, 1923 This Act was aimed at providing financial protection to the workman & his/her dependents in case of accidental injury by means of payment of compensation by a certain class of employers. Due to the difference in bargaining power, there are chances that the woman may be subject to exploitation. Minimum Wages Act, 1948 In accordance with Article 39 of the Constitution, this Act was passed to provide for a statutory fixation of minimum wages, since workers are poorly organized and have less bargaining power. It provides for fixation of minimum wages by the government for employment and provides for machinery for fixing and revision of minimum wages. Factories Act, 1948 This Act was introduced to regulate the condition of labourers employed in factories. However a number of provisions relating to safety, health & welfare of the workers are generally found to be inadequate in view of the large and growing industrial activities. Contract Labour (Regulation and Abolition) Act, 1970 This Act provides for the separate provision for utilities and fixed working hours for women. Equal Remuneration Act, 1976 This Act provides for equal pay to men and women for equal work. Article 42 of the Constitution states that the State shall make provisions for securing just and humane conditions of work and provide for maternity relief. This act was enacted keeping in mind the unequal physical & sociological burden a woman faces at the time of child bearing and rearing.

27
11.2. Tables
Table 1: Descriptive Statistics
Demographic Profile
Variable Minimum Maximum
gender Male = 20701 Female = 4150
age 18 60
married Currently Not Married = 9880 Currently Married = 14971
Occupational Profile
Variable Minimum Maximum
wagegrhr (Mean = Rs. 718.85) Rs. 40.03 Rs. 15011.55
educat1 11 categories (mentioned in the variable description)
Tenuexp (in years) 0 42
nace2001 20 categories (mentioned in the variable description)
Table 2: Year-wise GPG Analysis
Year
Male Female % difference
in salary of
females from
males
Median Salary (per
hour in Rs.) Count
Median Salary
(per hour in Rs.) Count
2008 282.35 2341 205.29 427 -37.54
2009 241.44 1902 144.34 306 -67.27
2010 240.57 4474 159.17 832 -51.14
2011 204.07 4441 138.57 881 -47.27
2012 181.13 2264 122.70 516 -47.62
2013 251.89 2401 168.40 357 -49.58
2014 279.06 1349 187.43 378 -48.88
2015 219.20 1162 164.23 349 -33.47
2016 200.02 367 146.94 104 -36.12

28
Table 3: State wise GPG Analysis
State Male Female % difference in
salary of females from
males Median Salary (gross hourly wage in Rs.)
Median Salary (gross hourly wage in Rs.)
Andhra Pradesh 225.28 153.96 -46.32 Arunachal Pradesh 173.21 115.47 -50.00 Bihar 173.21 1176.15 85.27 Chandigarh 181.99 96.72 -88.16 Chhattisgarh 123.72 106.42 -16.26 Delhi 236.08 166.73 -41.60 Goa 155.87 150.71 -3.42 Gujarat 151.77 95.27 -59.31 Haryana 300.23 200.92 -49.43 Himachal Pradesh 144.34 84.49 -70.83 Jammu & Kashmir 213.84 92.72 -130.63 Jharkhand 177.93 125.26 -42.04 Karnataka 334.87 205.29 -63.13 Kerala 179.35 124.57 -43.97 Madhya Pradesh 146.41 124.65 -17.46 Maharashtra 246.34 163.02 -51.11 Orissa 173.31 139.53 -24.21 Pondicherry 230.95 77.56 -197.76 Sikkim 178.98 179.88 0.50 Tamil Nadu 209.38 148.19 -41.29 Uttarakhand 97.19 72.39 -34.27 Uttar Pradesh 168.33 144.34 -16.62 West Bengal 170.32 120.28 -41.61
Table 4: Region wise GPG Analysis
Region
Male Female % difference in
salary of females from
males
Count Median Salary (gross hourly wage in Rs.)
Count
Median Salary (gross hourly wage in Rs.)
Southern India 6952 259.82 1338 173.55 -49.71 North-Eastern
India 310 125.37 110 70.42 -78.03
The Plains 4980 210.95 759 144.34 -46.15 Eastern India 1284 167.71 279 125.70 -33.42 Western India 6914 218.32 1622 145.17 -50.38
Himalayan North 261 134.72 42 78.52 -71.57

29
Table 5: Age-wise GPG Analysis
Age Group
Male Median Salary (per hour in Rs.)
Female Median Salary (per hour in Rs.)
GPG (in %)
Less than equal to 25 116.00 178.17 34.89 Greater than 25 Less than equal to 30 207.80 156.69 -32.62 Greater than 30 Less than equal to 35 299.86 201.86 -48.55 Greater than 35 Less than equal to 40 328.29 240.72 -36.38 Greater than 40 Less than equal to 45 305.97 228.44 -33.94 Greater than 45 Less than equal to 50 325.47 220.48 -47.62 Greater than 50 337.66 368.02 8.25
Table 6: Educational Qualification GPG Analysis
Highest Level of Education
Male Female %
difference in salary of
females from males
Median Salary
(per hour in
Rs.)
Count
Median Salary
(per hour in
Rs.)
Count
No formal education 91.42 63 80.83 11 -13.10 Below 10th standard 107.99 106 245.87 12 56.08 Plus 2 or equivalent 97.60 627 90.45 67 -7.90
Three-year degree (B.com., B.B.A., B.Sc., B.A. etc.) 143.30 4286 120.34 858 -19.08
CA/CS/ICWA or equivalent 415.70 595 242.17 106 -71.66 Four/five years’ degree (B.E.,
M.B.B.S, B.Arch., B.Pharm., L.L.B, etc.)
317.55 5734 227.82 623 -39.39
Masters (arts, science, engineering, commerce, MBA/equivalent) 256.61 7808 147.23 2201 -74.29
Advanced certificate/diplomas 178.02 898 168.83 187 -5.45 ITI/other certificates 93.82 235 262.70 12 64.29
PhD or equivalent 384.91 160 235.76 46 -63.27 Post-Doctoral 415.70 58 375.39 7 -10.74
Other education 155.89 131 151.00 20 -3.24

30
Table 7: Industry-wise GPG Analysis
Industry
Male Female %
difference in salary of
females from males
Median Salary
(per hour in
Rs.)
Count
Median Salary
(per hour in
Rs.)
Count
Agriculture, forestry and fishing 140.01 168 175.21 32 20.09 Mining and quarrying 276.04 131 243.78 25 -13.23
Manufacturing 202.17 4585 121.25 675 -66.74 Electricity, gas, steam and air
conditioning supply 253.49 228 176.80 24 -43.37
Water supply; sewerage, waste management and remediation activities 198.11 74 149.30 14 -32.69
Construction 193.42 1144 122.99 174 -57.26 Wholesale and retail trade; repair of
motor vehicles and motorcycles 164.76 933 141.13 185 -16.74
Transportation and storage 178.98 537 147.81 93 -21.09 Accommodation and food service
activities 134.72 333 119.67 106 -12.57
Information and communication 330.67 5023 208.95 889 -58.25 Financial and insurance activities 285.29 2522 233.89 463 -21.97
Real estate activities 207.37 229 124.43 60 -66.65 Professional, scientific and technical
activities 230.95 2370 150.62 605 -53.33
Administrative and support service activities 155.66 698 131.22 173 -18.62
Public administration and defence; compulsory social security 165.43 115 167.94 28 1.50
Education 161.02 683 132.58 299 -21.45 Human health and social work activities 169.74 544 118.96 184 -42.68
Arts, entertainment and recreation 243.69 152 125.86 40 -93.62 Other service activities 142.02 202 106.24 67 -33.68
Activities of households as employers 106.20 30 86.28 14 -23.09
Table 8: Work Experience GPG Analysis
Work Experience
Male Median Salary
(per hour in Rs.)
Female Median Salary
(per hour in Rs.)
% difference in salary of females
from males
Less than equal to 5 154.87 120.05 -29.01 Greater than 5 Less than equal to 10 277.86 186.70 -48.83
Greater than 10 Less than equal to 15 333.26 246.30 -35.31 Greater than 15 Less than equal to 20 335.77 222.65 -50.81 Greater than 20 Less than equal to 25 311.81 258.10 -20.81 Greater than 25 Less than equal to 30 288.89 270.90 -6.64
31
Table 9: Marital Status GPG Analysis
Marital Status
Male Female %
difference in salary of
females from males
Median Salary
(per hour in
Rs.)
Count
Median Salary
(per hour in
Rs.)
Count
Not Married 173.21 7901 128.30 1982 -35.00 Married 278.58 12800 183.71 2168 -51.64
Table 10: Skill Level: GPG Analysis
Gender %
difference in salary of
females from males
Male Female Gross
HOURLY wage in nat. currency
Gross HOURLY wage in nat. currency
Median Count Median Count
ISCO 2008 skill levels 1 - 4
Unskilled 114.34 790 76.42 276 -49.63 Semi-skilled 106.59 1968 92.38 387 -15.38
Skilled 240.57 6949 168.40 1290 -42.86 Highly skilled 259.82 10994 166.79 2192 -55.77
Table 11: Two sample t-test
Pr(T < t) = 1.0000 Pr(|T| > |t|) = 0.0000 Pr(T > t) = 0.0000 Ha: diff < 0 Ha: diff != 0 Ha: diff > 0
Ho: diff = 0 degrees of freedom = 24849 diff = mean(0) - mean(1) t = 6.9001 diff 151.7953 21.99888 108.6762 194.9144 combined 24851 718.8491 8.21265 1294.659 702.7519 734.9464 1 4150 592.4029 18.54912 1194.943 556.0367 628.7691 0 20701 744.1982 9.120898 1312.3 726.3206 762.0759 Group Obs Mean Std. Err. Std. Dev. [95% Conf. Interval]

32
Table 12: OLS Regression
_cons 178.4294 144.05 1.24 0.215 -103.9171 460.776 entertainment 91.59569 118.8269 0.77 0.441 -141.3121 324.5034 household -31.26416 209.441 -0.15 0.881 -441.7811 379.2528 socialwork 24.52186 89.65604 0.27 0.784 -151.2093 200.2531 edu -66.02158 86.32492 -0.76 0.444 -235.2236 103.1804 defence 67.1311 130.2538 0.52 0.606 -188.1742 322.4364 admin -4.401737 87.4428 -0.05 0.960 -175.7948 166.9914 technical 192.0305 79.69972 2.41 0.016 35.8143 348.2467 realestate -36.42168 106.559 -0.34 0.733 -245.2837 172.4403 finance 293.6857 79.69778 3.68 0.000 137.4733 449.8981 it 365.2112 78.10388 4.68 0.000 212.123 518.2995 hospitality -86.36961 97.3006 -0.89 0.375 -277.0846 104.3454 logistics -9.461799 91.34272 -0.10 0.917 -188.499 169.5754 whsaleretail 58.52588 85.0912 0.69 0.492 -108.2579 225.3097 construct -25.68768 83.87571 -0.31 0.759 -190.0891 138.7137waterwastemgmt -80.1236 154.7693 -0.52 0.605 -383.4807 223.2335 power 129.1738 110.3545 1.17 0.242 -87.12758 345.4752 manufact 20.19971 78.27859 0.26 0.796 -133.231 173.6304 mining 97.63541 126.9705 0.77 0.442 -151.2343 346.5051 agri -38.75265 117.6227 -0.33 0.742 -269.3002 191.7949 postdoc 630.6388 189.5229 3.33 0.001 259.1626 1002.115 phd 416.6053 136.4799 3.05 0.002 149.0966 684.1141 iti -170.4843 130.578 -1.31 0.192 -426.425 85.45648 advdip 38.01549 109.7607 0.35 0.729 -177.122 253.153 master 261.3677 103.7341 2.52 0.012 58.0427 464.6927 deg45y 433.7759 104.2561 4.16 0.000 229.4277 638.1241 cacs 343.7227 113.5065 3.03 0.002 121.2433 566.2021 deg3y -62.68394 104.3611 -0.60 0.548 -267.2379 141.8701 plus2 -221.2822 113.5809 -1.95 0.051 -443.9075 1.343195 below10 -212.7308 155.3443 -1.37 0.171 -517.2149 91.75329 noedu -81.30866 179.3991 -0.45 0.650 -432.9415 270.3242 married 130.8376 19.00417 6.88 0.000 93.58827 168.0869 tenuexpe 14.4672 2.886051 5.01 0.000 8.810367 20.12403 age -.1139315 2.85489 -0.04 0.968 -5.709686 5.481823 gender -91.97661 21.95167 -4.19 0.000 -135.0032 -48.95002 wagegrhr Coef. Std. Err. t P>|t| [95% Conf. Interval]
Total 4.1652e+10 24850 1676140.99 Root MSE = 1263 Adj R-squared = 0.0484 Residual 3.9584e+10 24816 1595080.11 R-squared = 0.0497 Model 2.0686e+09 34 60841045.3 Prob > F = 0.0000 F( 34, 24816) = 38.14 Source SS df MS Number of obs = 24851

33
Table 13: VIF
Variable VIF 1/VIF Variable VIF 1/VIF
master 40.36 0.024779 logistics 3.21 0.311348
deg45y 32.2 0.031055 iti 2.61 0.382546
deg3y 27.83 0.035929 hospitality 2.55 0.392442
it 17.28 0.05788 phd 2.35 0.425315
manufact 15.92 0.06282 realestate 2.03 0.493483
finance 10.46 0.095641 power 1.9 0.525083
technical 10.42 0.09597 below10 1.78 0.56283
advdip 7.83 0.127711 agri 1.71 0.584035
age 5.55 0.180059 entertainm~t 1.69 0.592953
cacs 5.49 0.181992 mining 1.56 0.642337
construct 5.49 0.182052 defence 1.51 0.661259
plus2 5.45 0.183536 noedu 1.49 0.671747
tenuexpe 5.38 0.185875 postdoc 1.44 0.695663
whsaleretail 4.84 0.206506 married 1.35 0.742029
edu 4.4 0.22716 waterwaste~t 1.32 0.7594
admin 4.02 0.248756 household 1.15 0.86725
socialwork 3.53 0.283068 gender 1.04 0.957528
Mean VIF 6.97

34
Table 14: Cross tab Analysis
Gender Pay Gap (Regress Wage with Gender and Work Experience)
Plus 2 3 Year Degree 4/5 Year Degree Masters Advance Diploma
Agriculture -280.9 -74.0 -411.5 -35.0
Mining -123.4 -347.3
Manufacturing -13.5 -66.6 -289.9 -69.7 Power -135.2 -448.1 -185.7
Water/Waste Mgmt -11.8 -391.2 -472.4
Construction -212.6 -6.0 -147.6 -288.4 -209.9
Wholesale/Retail -166.5 76.0 -100.0 299.0
Logistics -38.2 -194.9 -284.8 -130.5
Hospitality -282.2 21.8 -17.9 -176.7
IT -283.5 36.0 -84.6 -207.6
Finance -0.1 -127.3 Real Estate -261.7 18.1 -448.9 -247.6 Technical -161.1 -184.7 -124.2 167.9
Administrative -114.3 -183.2 35.4 114.6
Defence -191.0
Education -368.7 -75.8 -595.4 -51.5 -232.8
Social Work -50.9 57.9 -415.5 -72.4
Entertainment -273.1 -130.8 -581.9 -443.9 -397.5
Household 12.2 12.7 Others 34.0 -571.1

35
11.3. Graphs
Graph 1: Collinearity
Graph 2: Kernel Density
0.0
002
.000
4.0
006
.000
8D
ensi
ty
0 10000 20000 30000 40000 50000WAGEGRHR
Kernel density estimateNormal density
kernel = epanechnikov, bandwidth = 41.6052
Kernel density estimate