gender inequalities of the labour market
TRANSCRIPT

Gender inequalities of the labour market
Decomposition of the gender pay gap in Hungary
Authors: András Rigler, Maria Vanicsek (Vanicsek Zoltánné)
BérBarométer project – Equal H 005
Abstract
In Hungary the most important potential human capital reserve is the more powerful involvement of women labour force into the production. In order to help this process it is necessary to clarify what the components of the gender pay gap are. Creating equal opportunities in the labour market for men and women mean decreasing the gender pay gap. The two main components of the gender pay gap (endowment factors and remuneration part) can be managed with different tools. The discrimination of women in the field of production originates partly from cultural traditions. Beyond that men can represent their interests better in the labour market. The equal participation of women in the labour market is hindered by their family tasks and child rearing. In parallel with the number of children in the family the gender pay gap increases. This paper examines the differences between the average incomes of male and female employees working on the Hungarian labour market, based on a data of a survey of 5000 respondents. We introduce the decomposition method of Oaxaca and Blinder, and also apply the method to our data. According to Oaxaca (1973) and Blinder (1973), any wage differential between two groups of people (defined by gender, race, ethnicity etc.) can be decomposed into two parts. The first is explained by differences in human capital endowments of both groups, the second reflects differences in prices that is the remuneration of these endowments. This latter part of the wage differential is often interpreted as an estimate of wage discrimination. Hence, potential differences in the wages of women and men may stem both from differences in human capital endowments and other job-related variables (endowment effect) and from a difference in the values that are assigned to women’s and men’s characteristics (remuneration effect) and it shows the discrimination between the two groups.
Key Words: gender pay gap, decomposition method,
JEL Classification: J71
Create PDF files without this message by purchasing novaPDF printer (http://www.novapdf.com)

Gender inequalities of labour market. Decomposition of gender pay gap in Hungary
2
1. Gender inequalities of the labour market
Decomposition of the gender pay gap in Hungary
1 Introduction
This paper examines the differences of the average incomes of male and female employees (gender pay gap) working on the Hungarian labour market so that this difference is reintegrated into two main factors: endowment effect (structural composition of male and female groups) and remuneration effect ( discrimination of females in the labour market). The basis of this analysis is a first 5000, later 10000 item data survey in the labor market in 2006-2007. Here we present the results of 10000 item data survey . We apply the decomposition method of Oaxaca and Blinder to our data first in Hungary.
2. Representativeness of the sample
We demonstrate the representativeness of the sample by four demographic characteristics (breakdown by sex, age distribution, territorial repartition, education) and two social characteristics (sectoral (NACE) distribution and occupational (ISCO) distribution)
2.1. Demographic characteristics
Table 1 Gender Proportion, %
In the sample In the total population
Female 55 53
Male 45 47
Distribution of sexes fit well to the distribution of the Hungarian population. (1. table)
Table 2 Age distribution, %
Age groups In the total population In the sample
0-14 16 1
15-39 35 46
40-59 28 50
60-x 21 3
100 100
Create PDF files without this message by purchasing novaPDF printer (http://www.novapdf.com)

Gender inequalities of labour market. Decomposition of gender pay gap in Hungary
3
The sample, compared to population of the country, is slightly older. (2. table) It also represents the working-age population better. The reason is that the research was led by the trade unions and the target group was the working population. Within the working age population the elder 40-59 years old age-group is also better represented. We have to take this fact into consideration during analysis of the outcomes. Text Body
Table 3. Territorial distribution of the population. %
In the total population In the sample Difference of the sample
Regions % % Percentage point
28 26 -2
Central Region 11 15 4
Central Transdanubian Region 10 12 2
Western Transdanubian Region 10 9 -1
South Transdanubian Region 13 11 -2
North Hungarian Region 15 13 -2
North Lowland 13 14 1
The sample follows very nicely the territorial distribution of the population ( 3 . table) It shows 4 percentage point discrepancies in the Central Transdanubias region where the sample is better represented , but in other regions the extent of the discrepancy is not beyond the 2 percentage points .
Table 4. Educational distribution, %
Education Sample Population Difference of the sample
% % Percentage point
>8 class 0,6 0,4 0,2
8 class 7,5 14 -6,5
Vocational school 23,7 31,3 -7,6
Secondary school 28,4 33,6 -5,2
College 15,8 12,2 3,6
University< 10,2 8,5 1,7
100 100 0
Create PDF files without this message by purchasing novaPDF printer (http://www.novapdf.com)

Gender inequalities of labour market. Decomposition of gender pay gap in Hungary
4
The school qualifications represented in the sample reasonably reflect the population as a whole. (table 4), but here the fitting is not perfect. The lower educated groups ( the under 8 class, the 8 class and vocational school educated ) are less represented and the higher educated groups especially the high school graduated are represented slightly more than the population as a whole.
2.2. Social representativeness of the sample
During the social representativeness we will check upon two, for us, especially important characteristics: belonging to sectors and occupations.
Table 5. Employee distribution on NACE (level 1), %
Population Sample Difference of the sample
Sectors % % Percentage point
Agriculture, Fishing, Forestry 5,3 2,4 -2,9
Mining 0,4 0,7 0,3
Manufacturing 22,9 42,6 19,7
Electricity, Gas, Water supply 1,6 1,8 0,2
Construction 7,9 3 -4,9
Trade 14 9,5 -4,5
Hotel, storage, catering 3,8 1,8 -2
Transport, Post, Telecommunication 7,6 11,6 4
Finance 2 0 -2
Real estate, 7 1,8 -5,2
Public service, Social security 2,7 7,9 5,2
Education 8,5 5,1 -3,4
Health and social service 6,9 6,5 -0,4
Other service 4,4 4,8 0,4
Others 5 0,5 -4,5
Total 100 100
The sectoral distribution of the sample is remarkably different from the total population distribution in the manufacturing industry. Here the sample is almost 20 percentage points better
Create PDF files without this message by purchasing novaPDF printer (http://www.novapdf.com)

Gender inequalities of labour market. Decomposition of gender pay gap in Hungary
5
represented. In the other sectors we found a rather mild under representativeness especially: in the building and construction-, in the trade- , in the real estate- and in the public sectors .
Create PDF files without this message by purchasing novaPDF printer (http://www.novapdf.com)

Gender inequalities of labour market. Decomposition of gender pay gap in Hungary
6
Table 6. Employee distribution as occupations (ISCO level 1), %
Public Sample
Difference
of the sample
% %
Percentage
points 1 LEGISLATORS, SENIOR GOVERNMENT OFFICIALS, LEADERS OF ENTERPRENEURS 7,5 5,9 -1,6 2. PROFESSIONALS
13,4 16,3 2,9 3. TECHNICIANS AND ASSOCIATE PROFESSIONALS
14,3 19,9 5,6 4. OFFICE AND MANAGEMENT (CUSTOMER SERVICES) CLERKS
6,1 8,0 1,9
TOTAL PROFESSIONALS 41,3 50,1 8,8
5.SERVICES WORKERS
15,4 14,1 -1,3 6.SKILLED AGRICULTURAL AND FORESTRY WORKERS
3,0 1,2 -1,8 7.CRAFT AND RELATED TRADES WORKERS
19,7 19,5 -0,2 8.PLANT AND MACHINE OPERATORS AND ASSEMBLERS, VEHICLE DRIVERS
11,9 10,0 -1,9 9. ELEMENTARY OCCUPATIONS
7,6 5,2 -2,4
TOTAL PHYSICAL WORKS 57,6 50,0 -7,6
10. ARMED FORCES
1,1 0,0 -1,1
TOTAL 100,0 100,0 0,0
3. Methodological overview
3.1. Replacing of the missing data and filtering the sample
It is a well known phenomenon that one group of the respondents do not answer the question concerning their incomes. Different procedures are available , with which the missing facts and figures are „ exchangeable ,” namely they are substitutable with some kind of estimated value (e.g. average substitution or estimate with regression). These operations can be legal in every case, when we want to examine the effect of the income cleaned from the missing data on some kind of further variable in connection with which we can assume, that income is with impact on the question examined. In such cases it is a right requirement, that in so far we can give a relatively good estimation for income, not to
Create PDF files without this message by purchasing novaPDF printer (http://www.novapdf.com)

Gender inequalities of labour market. Decomposition of gender pay gap in Hungary
7
exclude from the analyses the non respondents, but let us replace with the estimation the missing items. However in the present research the income or the gender pay-gap are our focus, and we examine the influence of different variables to this income difference. In so far as we would replace the income in the imperfect questionnaires with the abovementioned methods, the estimated income would be some kind of function of those variables for which then we examine his effect on. Obviously this operation would distort our outcomes. . From this follows the replacement of the missing items is not possible, so we excluded from the analysis those who did not answer the question concerning their income.
For our examination of the income disparities we employ the operation known as the Oaxaca-Blinder decomposition method. This method is used in many studies to analyze the pay-gap components (e.g. Kim - Polachek, 1994; Miller - Rummery, 1991; Wright - Ermisch, 1991). So that our outcomes to be comparable with outcomes of different studies, it is advisable to us to accommodate ourselves to certain restraints , which they do at plurality of this studies .
These restraints are the followings :
Usually excluded from the analyses the self-employed people and home enterprise employees , because in these groups income can be followed less closely , often it is not possible to separate the personal income from the family or the enterprise income.
the examined population is often narrowed down onto the 25-55 years old group, to avoid distortion effects arising from the early retirement, or from the fact that young people start their career at different ages.
Most of the studies examine the gender pay gap based on differences appearing in the average hourly wage. However our database contains only monthly incomes, what is suitable for examination of the income inequality exactly as the man-hours, but we do not know how many hours the part time employed work weekly. For this reason, as we could not compare their income to the full time job workers, we have to exclude them from the database also.
Altogether we narrowed down the complete sample as follows: question regarding to the income has to be filled out, they to be in employee privity, have to be between25-55 years old and to work in full time employment. After filtering according to the abovementioned criteria (income data, full time job, age, and employee) we found 6269 items fit for the decomposition analyses.
3.2. Regression analyses and decomposition
The essence of the Oaxaca-Blinder decomposition method (Oaxaca, 1973 and Blinder, 1973) concerning the pay gap decomposition, is that we divide the observed pay difference into two components. The first is the endowment part which is arising due to the fact that structural characteristics of the men and women’s group are different and this are influencing their income (e.g. occupation, age, education, working experience etc.). This difference would exist if there was not discrimination. The second component is the remuneration part which is evolving from the women's negative discrimination, which even then would exist, if the women's structural characteristics agreed with the men’s.
During the decomposition in a first step we define with the help of regression analysis , what are those structural parameters , which are influencing the individual income. We define the gender pay gap as the logarithm of the difference of the men and women’s average income because the income distribution is logarithmical and the model that we want is the sum of the components.
Create PDF files without this message by purchasing novaPDF printer (http://www.novapdf.com)

Gender inequalities of labour market. Decomposition of gender pay gap in Hungary
8
Figure 1. : Net salary and its natural logarithm’s histogram
Nettó bér (ezer Ft)
260.0240.0
220.0200.0
180.0160.0
140.0120.0
100.080.0
60.040.0
20.00.0
Nettó bér (ezer Ft)
SEX: 1 nő
Freq
uenc
y
1200
1000
800
600
400
200
0
Std. Dev = 47.69 Mean = 96.6
N = 3530.00
ln(nettó bér)
13.63
13.38
13.13
12.88
12.63
12.38
12.13
11.88
11.63
11.38
11.13
10.88
10.63
10.38
10.13
9.88
9.63
9.38
ln(nettó bér)
SEX: 1 nő
Freq
uenc
y
700
600
500
400
300
200
100
0
Std. Dev = .37 Mean = 11.40
N = 3530.00
Nettó bér (ezer Ft)
280.0240.0
200.0160.0
120.080.0
40.00.0
Nettó bér (ezer Ft)
SEX: 2 férfi
Freq
uenc
y
700
600
500
400
300
200
100
0
Std. Dev = 71.86 Mean = 113.8
N = 2738.00
ln(nettó bér)
14.25
13.75
13.25
12.75
12.25
11.75
11.25
10.75
10.25
9.75
9.25
ln(nettó bér)
SEX: 2 férfiFr
eque
ncy
800
600
400
200
0
Std. Dev = .43 Mean = 11.53
N = 2738.00
Income shows lognormal distribution.
)ln()ln()ln( YYY NF Computing separately the regression analysis for men and women we can prescribe the men
and the women's average income, namely the above mentioned components, with the following equations with regression as follows:
F
i
FFi
Fi XY )ln( men’s income
N
i
NNi
Ni XY )ln( women’s income
or
FFF XY )ln(
NNN XY )ln(
Create PDF files without this message by purchasing novaPDF printer (http://www.novapdf.com)

Gender inequalities of labour market. Decomposition of gender pay gap in Hungary
9
where Y is the vector of incomes , as the dependent variable of the regression, X is the
vector of the examined explaining variables, ß is the regression coefficient vector belonging to each explanatory variable. It can be seen so that we defined the men's average income as an average of explanatory variables computed for men multiplied by coefficients belonging to them and also computed with this analogous inscription of the women's average income. From these components - and from that hypothesis, that the men's income is not discriminated but the women’s income is – we can compute a theoretical value that would show the women’s income if the structure of the two groups were identical. In this case we have to multiply the average of women’s explanatory variables by the regression coefficients counted for men.
FNN XY )ln(
with this auxiliary value we can write the gender pay gap as a sum of two differences. The first difference
)ln()ln( YY NF
shows how higher the men’s average income than the women’s average income without discrimination. This difference is a type of structural effect coming from that women’s individual characteristics influencing the income are different from men’s income. For the other part of gender pay gap is responsible the discrimination. The volume of this part comes from the difference between the theoretical women’ income and the effective women’s income
)ln()ln( YY NN .
We can write the total gender pay gap with the following equation:
)ln()ln()ln()ln()ln()ln( YYYYYY NNNFNF ,
Create PDF files without this message by purchasing novaPDF printer (http://www.novapdf.com)

Gender inequalities of labour market. Decomposition of gender pay gap in Hungary
10
we put the regression equations components into the right side of the equation
NFNNFF
NNFNFNFF
XXXXXXX
structural effect discrimination effect
The sum’s left part is the structural part that comes from the different structural characteristics of the men’s and women’s groups and we can count as a product of men’s coefficients that are hypothetically not discriminated. As this part is coming from the different structural characteristics of the men’s and women’s groups it is often considered as the explained difference of the gender pay gap. ( It is another question whether the difference appearing in structural characteristics is arising only because the men and the women have different characteristics, or we can discover in the background also discrimination appearing e.g. in different possibilities in education. In the present study we do not examine this question, but we rate the difference of structural characteristics as given.) The second part of the sum shows how much less the women’s pay is compared to the pay men with the same structural characteristics would earn. This amount is the product of the average of the women's structural characteristics by the difference between the men's and the women's regression coefficients.
The specialized literature shows many amendments , expansion of decomposition of Oaxaca-Blinder. Among these there are such versions, which look for an answer to „ simple ” analytical questions, as, for example, in the international comparisons where further breaking-off of structural and discrimination components into country inside and between countries’ parts. Other amendments are rephrasing theoretical null hypotheses of the method, e.g. the hypothesis according to that the men’s income is not discriminated and the women’s income is discriminated with the comparison to the men’s case is replaced with that hypothesis according to that there exists a theoretical income without discrimination and comparing this to the men’s income has a positive discrimination and women’s income has a negative discrimination. In this model the mathematical solution is different than in the original. (Cotton, 1988) In our present study we do not employ these qualified operations, we have carried out our analysis based on the basic model introduced upstairs. The method also has two marked advantages next to his relative complexity. The first is, that with its help we can quantify the extent of the discrimination, namely the women's lower income to what extent can be regarded as a result of the women's negative discrimination . The other important advantage is, that we can not only define with the help of parameters coming from the regression analysis in what extent they bias income against the individual characteristics in case of the men and the women, but we can also define those characteristics which are responsible for structural part of gender pay gap, and those which are based to a greater extent with the women's discrimination.
Create PDF files without this message by purchasing novaPDF printer (http://www.novapdf.com)

Gender inequalities of labour market. Decomposition of gender pay gap in Hungary
11
4. The model
Table 7. Gender pay gap
Gender Filtered sample Total sample
Female, Ft/month (€) 96 632 (383) 95 514 (379)
Male, Ft/month (€) 113 774 (451) 116 179 (461)
Gender pay gap, % 17,7% 21,6%
The gender pay gap is 17,7% on the filtered and 21,6% on the total sample.
4.1. The variables
Income’ natural logarithm is the dependent variable of the model. We introduced 96 structural variables (independent variables) into the model grouping as follows.
Table 8. Structural variables of the model
Variables Number of variables
Type of settlement 3+1 County 19+1 Age group 5 +1 Having children 1+1 Sector of the organization you work for 2+1 Branch of your organization you work for 24+1 Occupation 9+1 Position in the organization 3+1 Education 3+1 Other qualification 1+1 Number of employees of the organization you work for 10+1 Proportion of women in the organization you work for 5+1 Working experience 5+1 How many jobs do you have 5+1 How many time were you unemployed 2+1 Fixed term or indefinite agreement do you have 1+1
The 16 variables groups were transformed into dummy variables.
Create PDF files without this message by purchasing novaPDF printer (http://www.novapdf.com)

Gender inequalities of labour market. Decomposition of gender pay gap in Hungary
12
4.2. Regression coefficients
We formed two groups (male and female) and computed the coefficients of regression equation by variables (D,E columns, Table 9.) and the proportion of each variable within the sample (G,H columns, Table 9.) and multiply the units by groups (m*xm, f*xf) and we get the logarithm of the income belonging to each variable by gender groups ( H,I,columns, Table 9.)
We counted the structural (endowment)and discrimination (remuneration) effect.
Structural effect (ln) = Discrimination effect (ln) = We retransferred the logarithms and as a product of the two components we counted the total gender pay gap for the given variable. Calculation is in the appendix.
Table 9. Construction of the model
Mean,
x*beta
Endow
ment
Remu
neration
Unstandar
dizied
coeficient
B
Mean,
percent of
variable (ln) (ln)
Endow
ment
Remu
neration
En
dow
ment
effect
Re
mun
eration
effect
Total
pay
gap
B*D C*E C*(D*E) F*(C-B) Exp(J) Exp(K) J*K K-1 M-1 L-1
A B C D E F G H I J K L M N O
female male female male female male
Variable 1 -0,13 -0,025 0,338 0,298 -0,044 -0,007 0,001 0,036 100,10% 103,60% 103,70% 0,10% 3,60% 3,70%
Variable
96 0,023 0,016 0,462 0,447 0,01 0,007 0 -0,003 100% 99,70% 99,60% 0,00% -0,30% -0,40%
Constant 0,096 0,161 1 1 0,096 0,161 0 0,065 100,00% 106,70% 106,70% 0,00% 6,70% 6,70%
Total 11,479 11,643 -0,075 0,173 92,80% 126,90% 117,70% -7,20% 26,90% 17,70%
96 711 113 842 0,93 1,19
In the summary table the constant is an item of interest according to which over the effect of variables an additional discrimination effect (6,7%) influences women’s income. The total structural (endowment) effect is -7,2% (namely the women's income in the absence of discrimination would be7,2%-kal higher than that of men, barely due to different distribution of the structural factors). The total discrimination effect is 26.9% ( namely the women's income would be so much lower due to the discrimination if their structural characteristics
)(* XX FMM
)* ( FMFX
Create PDF files without this message by purchasing novaPDF printer (http://www.novapdf.com)

Gender inequalities of labour market. Decomposition of gender pay gap in Hungary
13
agreed with that of men. Arising from the two factors ( 0,928*1,269=1,177 ) the total pay gap is 17.7% , namely with actually so much higher the men's income than that of women. 4.3. Discrimination and structural effects of the variables
As the model has been built from below there is an opportunity to examine how the two effects prevail in the case of individual variables.
In the next tables the first category of the structural variables is considered as a reference category. This means so much in terms of the model with regression , so that the regression parameters giving the outcome income are counted comparing to this category. Namely we examine, how much more or less somebody can earn compared to the reference category if he is in the category given in terms of the factor examined. For example in the case of "type of settlement " variable, Budapest represents the reference category and the “county town” shows that for people in the category how much more or less they earn than the people living in Budapest. In addition use of the reference-category also means that in case of these categories we cannot calculate the structural and discrimination effect, and so for this reason we left the first row blank in the tables. We express the effects in percent and in signed format, what are showing , is how many percent the men's income would be higher or lower, than that of women.
Type of settlement
The discrimination effect is 3,6% in the county towns and 1,4% in the villages.
Table 10. Type of settlement
Structural effect Discrimination effect Total pay gap
Budapest - - - County town 0,1% 3,6% 3,7% City - - - Village 0,6% 1,4% 2,0%
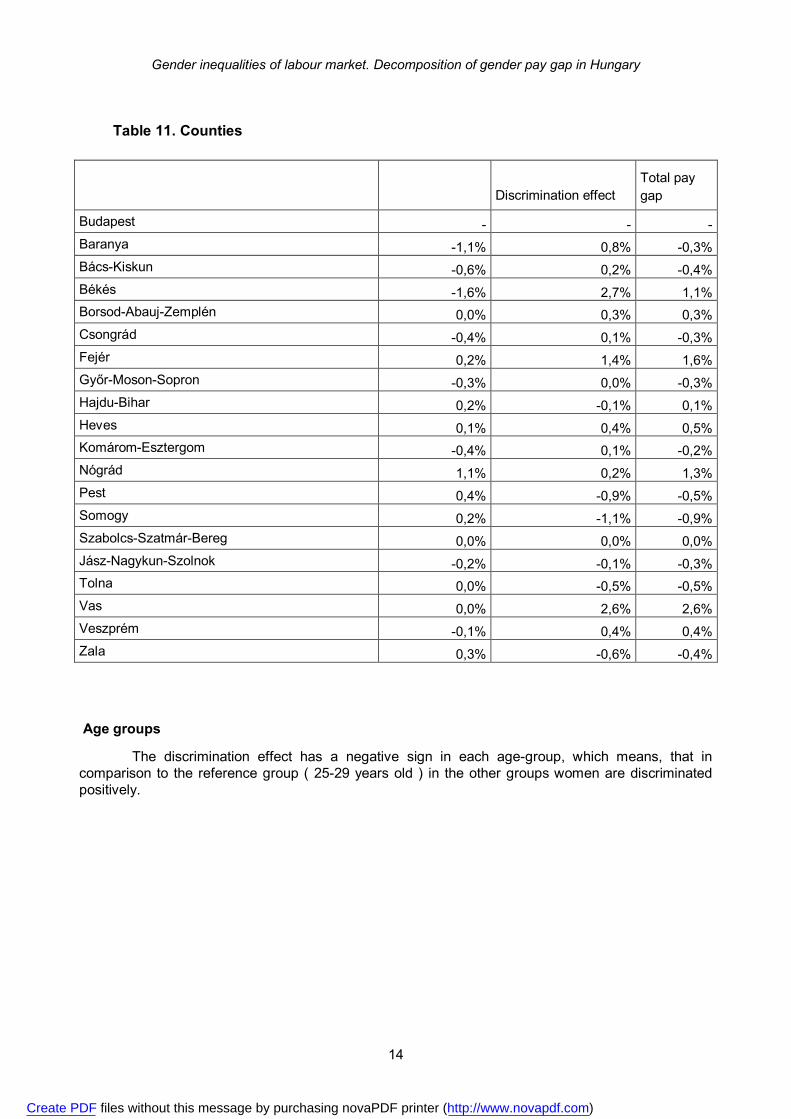
Counties
In respect of discrimination effect Vas and Békés counties are overhanging (2,6% and 2,7%).
More marked structural effect ( 1.1% ) in a county Nógrád is prevailing .
Create PDF files without this message by purchasing novaPDF printer (http://www.novapdf.com)
Gender inequalities of labour market. Decomposition of gender pay gap in Hungary
14
Table 11. Counties
Discrimination effect Total pay gap
Budapest - - - Baranya -1,1% 0,8% -0,3% Bács-Kiskun -0,6% 0,2% -0,4% Békés -1,6% 2,7% 1,1% Borsod-Abauj-Zemplén 0,0% 0,3% 0,3% Csongrád -0,4% 0,1% -0,3% Fejér 0,2% 1,4% 1,6% Győr-Moson-Sopron -0,3% 0,0% -0,3% Hajdu-Bihar 0,2% -0,1% 0,1% Heves 0,1% 0,4% 0,5% Komárom-Esztergom -0,4% 0,1% -0,2% Nógrád 1,1% 0,2% 1,3% Pest 0,4% -0,9% -0,5% Somogy 0,2% -1,1% -0,9% Szabolcs-Szatmár-Bereg 0,0% 0,0% 0,0% Jász-Nagykun-Szolnok -0,2% -0,1% -0,3% Tolna 0,0% -0,5% -0,5% Vas 0,0% 2,6% 2,6% Veszprém -0,1% 0,4% 0,4% Zala 0,3% -0,6% -0,4%
Age groups
The discrimination effect has a negative sign in each age-group, which means, that in comparison to the reference group ( 25-29 years old ) in the other groups women are discriminated positively.
Create PDF files without this message by purchasing novaPDF printer (http://www.novapdf.com)

Gender inequalities of labour market. Decomposition of gender pay gap in Hungary
15
Table 12. Age groups
Structural effect Discrimination effect Total pay gap
25-29 years - - - 30-34 years 0,2% -2,6% -2,4% 35-39 years 0,0% -3,8% -3,8% 40-44 years 0,0% -2,0% -2,0% 45-49 years 0,0% -3,9% -3,9% 50-55 years 0,4% -12,7% -12,4%
Children
Having children results in only a small discrimination effect (0,4%).
Table 13. Children
Structural effect Discrimination effect Total pay gap
No children - - - Have children -0,8% -0,4% -1,3%
Sector of the organization
In the public sector the discrimination effect is negative, but it is compensated by a 1,1%
structural effect.
Table 14. Sector of your organization
Structural effect
Discrimination effect Total pay gap
Business sector - - - Public sector 1,1% -0,6% 0,5% Non profit sector -0,5% 0,5% 0,0%
Industries (NACE level1)
The discrimination effect is negative in every branch, which means that compared to agriculture in all the other branches women are less discriminated. In the overwhelming majority of cases this is compensated with high structural effect.
Create PDF files without this message by purchasing novaPDF printer (http://www.novapdf.com)

Gender inequalities of labour market. Decomposition of gender pay gap in Hungary
16
Table 15. Industries (NACE level 1)
Structural effect
Discrimination effect Total pay gap
AGRICULTURE, HUNTING AND RELATED SERVICE ACTIVITIES - - -
MINING AND QUARRYING 2,8% -0,7% 2,1% MANUFACTURE OF FOOD PRODUCTS, BEVERAGES AND TOBACCO 0,9% -5,4% -4,5% MANUFACTURE OF TEXTILES AND TEXTILE PRODUCTS -8,1% -2,9% -10,7% MANUFACTURE OF LEATHER AND LEATHER PRODUCTS -1,4% -1,2% -2,5% MANUFACTURE OF WOOD AND WOOD PRODUCTS 2,5% -0,3% 2,2% MANUFACTURE OF PULP, PAPER AND PAPER PRODUCTS; PUBLISHING AND PRINTING 1,5% -1,7% -0,2% MANUFACTURE OF COKE, REFINED PETROLEUM PRODUCTS AND NUCLEAR FUEL 0,3% -1,4% -1,2% MANUFACTURE OF CHEMICALS, CHEMICAL PRODUCTS AND MAN-MADE FIBRES -0,4% -0,5% -0,9% MANUFACTURE OF OTHER NON-METALLIC MINERAL PRODUCTS -5,3% -2,4% -7,6% MANUFACTURE OF BASIC METALS AND FABRICATED METAL PRODUCTS 11,7% -3,2% 8,2% MANUFACTURE OF MACHINERY AND EQUIPMENT N.E.C. 9,3% -2,6% 6,5% MANUFACTURE OF ELECTRICAL AND OPTICAL EQUIPMENT 0,9% -8,4% -7,6% MANUFACTURE OF TRANSPORT EQUIPMENT 13,3% -1,9% 11,2% MANUFACTURING N.E.C. 1,8% -0,6% 1,2% ELECTRICITY, GAS AND WATER SUPPLY 1,0% -1,7% -0,7% CONSTRUCTION 11,1% -1,1% 9,9% WHOLESALE AND RETAIL TRADE; REPAIR OF MOTOR VEHICLES, MOTORCYCLES AND PERSONAL AND HOUSEHOLD GOODS -15,3% -8,7% -22,7% HOTELS AND RESTAURANTS -2,2% -2,0% -4,2% TRANSPORT, STORAGE AND COMMUNICATION 19,3% -10,9% 6,4% FINANCIAL INTERMEDIATION -4,8% -3,5% -8,2% REAL ESTATE, RENTING AND BUSINESS ACTIVITIES 3,5% -5,4% -2,1% PUBLIC ADMINISTRATION AND DEFENCE; COMPULSORY SOCIAL SECURITY 1,0% -6,0% -5,1% EDUCATION -14,6% -10,2% -23,3%
Create PDF files without this message by purchasing novaPDF printer (http://www.novapdf.com)

Gender inequalities of labour market. Decomposition of gender pay gap in Hungary
17
HEALTH AND SOCIAL WORK -27,2% -8,2% -33,2% OTHER COMMUNITY, SOCIAL AND PERSONAL SERVICE ACTIVITIES 1,3% -4,0% -2,7%
Occupation (ISCO level 1)
The highest discrimination is in the occupation group “Technicians and associate professionals”,(4%), but it is also high in the group of “Plant and machinery operators and assemblers, vehicle drivers”. Structural effect is extremely high (55,6%) among the crafts and related trades workers.
Table 16. Occupation (ISCO level 1)
Structural effect
Discrimination effect
Total pay gap
LEGISLATORS, SENIOR GOVERNMENT OFFICIALS, LEADERS OF ENTERPRISES - - - PROFESSIONALS -1,0% -1,7% -2,7% TECHNICIANS AND ASSOCIATE PROFESSIONALS -23,0% 4,0% -19,8% OFFICE AND MANAGEMENT (CUSTOMER SERVICES) CLERKS -18,4% -1,4% -19,5% SERVICES WORKERS 3,6% -0,2% 3,4% SKILLED AGRICULTURAL AND FORESTRY WORKERS 5,4% 0,3% 5,7% CRAFT AND RELATED TRADES WORKERS 55,6% 1,8% 58,5% PLANT AND MACHINE OPERATORS AND ASSEMBLERS, VEHICLE DRIVERS 13,7% 2,9% 16,9% ELEMENTARY OCCUPATIONS -5,5% 0,7% -4,8%
Position
High discrimination effect is found among the white collar women workers (7,4%), but the structural effect with a higher reversed value eliminate it. Among the managers the structural and discrimination effect is in summary prejudicial to women.
Table 17. Position
Structural effect Structural effect Discrimination effect
Total pay gap
Blue-collar worker - - - White-collar worker -16,7% 7,4% -10,6% manager 6,2% 2,2% 8,6% other 0,8% 0,3% 1,1%
Create PDF files without this message by purchasing novaPDF printer (http://www.novapdf.com)

Gender inequalities of labour market. Decomposition of gender pay gap in Hungary
18
Education
The discrimination effect is growing in parallel with the rise of the school qualifications held and in case of graduate at a university it achieves the 22,8%. Over this the structural effect is culminating among the uneducated people ( 18.8% ) and in the higher qualification GRPS it is already negative.
Table 18. Education
Structural effect Discrimination effect
Total pay gap
Less than 8 class - - - Vocational school 18,8% 7,2% 27,3% Secondary school -11,8% 17,3% 3,4% College, University -6,4% 22,8% 14,9%
Additional qualification
Acquisition of the additional qualifications are resulting 1.7% discrimination effect in favor of women.
Table 19. Do you have any additional qualifications?
Structural effect
Discrimination effect
Total pay gap
You don’t have other qualification - - -
You have additional qualification 0,0% -1,7% -1,8%
Size of the organization
The overriding discrimination effect ( 3.6% ) can be experienced in the 50-100 and 20-50 people employing organization.
Create PDF files without this message by purchasing novaPDF printer (http://www.novapdf.com)

Gender inequalities of labour market. Decomposition of gender pay gap in Hungary
19
Table 20. Number of employees in the organization
Structural effect Discrimination effect Total pay gap
Less than 10 - - - 10-20 -0,1% 1,6% 1,5% 20-50 -2,3% 3,1% 0,7% 50-100 -0,6% 3,6% 3,0% 100-250 1,6% 1,6% 3,3% 250-500 1,4% -0,5% 0,8% 500-1000 0,6% 0,3% 0,9% 1000-2000 0,7% 0,8% 1,5% 2000-5000 -0,2% -0,2% -0,4% More than 5000 0,3% 0,1% 0,3%
Proportion of women in the organization
The greater the proportion of women in an organization generally results in increased discrimination in favor of women. This shows , that the higher women' proportion comparing to the reference group (0-20%) the more men's discrimination.
Table 21. Proportion of women in the organization
Structural effect Discrimination effect
Total pay gap
0-20% - - -
20-40% 2,2% -7,2% -5,1% 40-60% -0,3% -11,6% -11,9% 60-80% 1,0% -16,6% -15,8% 80-100% 1,0% -14,1% -13,3%
Job experience
The discrimination effect rise with the growing number of years spent in the job. The largest jump can be experienced among workers and employees who have 8-10 years and 11-20 years working experience: till that in preceding 8.7% , that in latter 34.8% the value of discrimination effect.
Create PDF files without this message by purchasing novaPDF printer (http://www.novapdf.com)

Gender inequalities of labour market. Decomposition of gender pay gap in Hungary
20
Table 22. Job experience
Structural effect Discrimination effect Total pay gap
0-3 years - - - 4-7 years 0,5% 6,3% 6,9% 8-10 years 4,1% 8,7% 13,1% 11-20 years 10,9% 34,8% 49,5% 21-30 years -4,8% 38,2% 31,5% 31+ years -11,0% 38,2% 23,0%
How many jobs do you have?
The number of jobs causes low discrimination and negligible structural effects.
Table 23. Number of jobs you have
Structural effect Discrimination effect
Total pay gap
1 - - -
2 -0,1% -2,1% -2,2% 3 -0,3% -3,1% -3,4% 4 0,1% 0,3% 0,3% 5 0,1% 1,3% 1,4% 6 or more 0,4% -1,4% -1,0%
Unemployment
The number of times being unemployed shows no significant effect to either the structural or discrimination effect.
Table 24. How many times were you unemployed
Structural effect Discrimination effect
Total pay gap
Never - - -
Once 0,0% -1,2% -1,2% Twice or more 0,1% -0,1% 0,0%
Type of employment
Fixed time employment does not cause either structural effect, or discrimination effect.
Create PDF files without this message by purchasing novaPDF printer (http://www.novapdf.com)

Gender inequalities of labour market. Decomposition of gender pay gap in Hungary
21
Table 25. Type of employment
Structural effect Discrimination effect
Total pay gap
Indefinite agreement - - -
Fixed term agreement -0,1% -0,1% -0,2%
Collective agreement
It is amazing that the existence of the collective agreement is resulting high (15,5%) discrimination effect. Further examinations need to expose its reason.
Table 26. Collective agreement
Structural effect Discrimination effect
Total pay gap
No - - -
Yes -0,4% 15,5% 15,1%
Trade union membership
The trade-union membership has neither structural , nor discrimination effects .
Table 27. Trade union membership
Structural effect
Discrimination effect
Total pay gap
No - - -
Yes 0,0% -0,3% -0,4%
5. Conclusions
In our analysis we divided into two parts the gender pay gap with the help of Oaxaca Blinder decomposition method. The structural part of the gender pay gap shows the difference between men and women’s income that would exist because of different characteristics of men and women if there were not any discrimination. Over this the discrimination is that part of the difference which would be present, if the men and women's structural characteristics were similar. (Here we should like to call the attention to the fact that although in our study we are comparing only the situation of men and women, the method employed - with the appropriate amendments if necessary – could also be applied to different group characteristics including ethnic minorities.)
In Hungary today the gender pay gap is 17.7 percent , which means , that men's average income is significantly higher than that of women. We can state this value is generally representative of the European comparison. After breaking-off of the disparity it is showing a surprising outcome: the structural effects result in negative income' rate (- 7.2% ). This means that if there were not any discrimination, as outcome of the structural effects the men's income would be lower than women's.
Create PDF files without this message by purchasing novaPDF printer (http://www.novapdf.com)

Gender inequalities of labour market. Decomposition of gender pay gap in Hungary
22
This structural effect however not merely be compensated by the very high (26.9%) discrimination effect, but entirely reversed into the opposite direction and as an outcome, the women’s average income is lower by 17,7% than that of men.
Consequently if we wished to decrease the gender pay gap our priority target would not be the modification of the structural characteristics of women (education, job position, etc.), but the continuous ousting of discriminative waging.
The decomposition method shows from the universe of structural variables which could influence the volume of the income which ones are chiefly responsible for the gender pay gap, and within this which factors and parts rather contribute to the structural differences, and which are responsible for discrimination.
In terms of the discrimination effect four factors are emerging among those examined.
The discriminatory effect of the school qualifications obtained is very significant: a woman who has the higher education has to face higher discrimination. . The job experience, namely the length of the working life strengthen the discrimination to a woman's disadvantage. In other words, with increasing length of working life men’s income is rising faster, than the women's. The discrimination effect is also strong in case of the women's proportion in organization variable. Where the women's proportion in the offices is large the discrimination is small. Otherwise in workplaces where men outnumber women the discrimination is rather high. We also find discrimination in case of offices with collective bargaining agreement. This effect is due to the fact that in the men-dominated organizations the collective agreements are more frequent. These outcomes can provide a starting base to further analyses. They show those target groups within which it is necessary to examine the discrimination.
However, our current research data allows us to identify the most discriminated groups of women, which can help the authorities to take measures aimed at reducing the gender pay gap.
Create PDF files without this message by purchasing novaPDF printer (http://www.novapdf.com)

Gender inequalities of labour market. Decomposition of gender pay gap in Hungary
23
References
Author (Year), Title of Article, Title of Publication, Publisher, Pages. Belbo, Miriam et al. (2003): Methodological Issues Related to the Analysis of Gender Gaps in Employment,
Earnings and Carreer Progression. European Commission, Employment and Social Affairs DG. Blinder, A.S. (1973): Wage Discrimination: Reduced Form and Structural Estimates. The Journal of Human
Resources, 8(4), 436-455. Cotton, J. (1988): On the decomposition of wage differentials. The Review of Economics and Statistics,
70(2), 236-243. Juhn, C. - Murphy, K.M. - Pierce, B. (1993): Wage inequality and the rise in returns to skill. Journal of
Political Economy, 101 (3), 410-442. Kim, M.K. - Polachek, S.W. (1994): Panel Estimates of Male-Female Earnings Functions. The Journal of
Human Resources, 29 (2), 406-428 Miller, P. - Rummery, S. (1991): Male-Female Wage Differentials in Australia: A Reassessment. Australian
Economic Papers, 30 (56), 50-69. Oaxaca, R.L. (1973): Male-Female Wage differentials in Urban Labor Markets. International Economic
Review, 14(3), 693-709. Wright, R.E. - Ermisch, J.F. (1991): Gender Discrimination in the British Labour Market: A Reassessment.
The Economic Journal, 101 (406), 508-522.
Create PDF files without this message by purchasing novaPDF printer (http://www.novapdf.com)

Appendix
Regression coefficients
percent of
variable x*beta
Unstandardizied
coefficient B Mean Mean(lnw)
D*F E*G E*(G-F) F*(E-D) Exp(J) Exp(K) L*M 1-L M-1 N-1
A B C D E F G H I J K L M N O P
Variables Variable name
1
female
2
male
1
female
2
male
1
female 2 male
Endow
ment
(ln)
Discri
mination
( ln)
Endow
ment
Discri
mination
Total
pay
gap
Endow
ment
effect
Discrimi
Nation
effect
Total
pay
gap
DTTIP2 County town -0,130 -0,025 0,338 0,298 -0,044 -0,007 0,001 0,036 100,1% 103,6% 103,7% 0,1% 3,6% 3,7%
DTTIP4 Village 0,097 0,168 0,198 0,233 0,019 0,039 0,006 0,014 100,6% 101,4% 102,0% 0,6% 1,4% 2,0%
DMEGYE2 Baranya 0,187 0,336 0,053 0,020 0,010 0,007 -0,011 0,008 98,9% 100,8% 99,7% -1,1% 0,8% -0,3%
DMEGYE3 Bács-Kiskun 0,270 0,300 0,056 0,036 0,015 0,011 -0,006 0,002 99,4% 100,2% 99,6% -0,6% 0,2% -0,4%
DMEGYE4 Békés 0,248 0,610 0,073 0,047 0,018 0,029 -0,016 0,026 98,4% 102,7% 101,1% -1,6% 2,7% 1,1%
DMEGYE5 Borsod-Abauj-Zemplén 0,267 0,305 0,084 0,083 0,022 0,025 0,000 0,003 100,0% 100,3% 100,3% 0,0% 0,3% 0,3%
DMEGYE6 Csongrád 0,214 0,237 0,041 0,026 0,009 0,006 -0,004 0,001 99,6% 100,1% 99,7% -0,4% 0,1% -0,3%
DMEGYE7 Fejér 0,697 0,895 0,068 0,071 0,048 0,063 0,002 0,014 100,2% 101,4% 101,6% 0,2% 1,4% 1,6%
DMEGYE8 Győr-Moson-Sopron 0,458 0,456 0,030 0,024 0,014 0,011 -0,003 0,000 99,7% 100,0% 99,7% -0,3% 0,0% -0,3%
DMEGYE9 Hajdu-Bihar 0,174 0,155 0,033 0,046 0,006 0,007 0,002 -0,001 100,2% 99,9% 100,1% 0,2% -0,1% 0,1%
DMEGYE10 Heves 0,289 0,536 0,016 0,018 0,005 0,009 0,001 0,004 100,1% 100,4% 100,5% 0,1% 0,4% 0,5%
DMEGYE11 Komárom-Esztergom 0,477 0,511 0,038 0,031 0,018 0,016 -0,004 0,001 99,6% 100,1% 99,8% -0,4% 0,1% -0,2%
DMEGYE12 Nógrád 0,380 0,504 0,017 0,039 0,006 0,020 0,011 0,002 101,1% 100,2% 101,3% 1,1% 0,2% 1,3%
DMEGYE13 Pest 0,397 0,238 0,056 0,071 0,022 0,017 0,004 -0,009 100,4% 99,1% 99,5% 0,4% -0,9% -0,5%
DMEGYE14 Somogy 0,190 -0,248 0,025 0,018 0,005 -0,005 0,002 -0,011 100,2% 98,9% 99,1% 0,2% -1,1% -0,9%
DMEGYE15
Szabolcs-Szatmár-
Bereg 0,130 0,125 0,044 0,045 0,006 0,006 0,000 0,000 100,0% 100,0% 100,0% 0,0% 0,0% 0,0%
DMEGYE16
Jász-Nagykun-
Szolnok -0,077 -0,115 0,029 0,048 -0,002 -0,006 -0,002 -0,001 99,8% 99,9% 99,7% -0,2% -0,1% -0,3%
DMEGYE17 Tolna 0,305 0,012 0,018 0,031 0,005 0,000 0,000 -0,005 100,0% 99,5% 99,5% 0,0% -0,5% -0,5%
Create PDF files without this message by purchasing novaPDF printer (http://www.novapdf.com)

Gender inequalities of labour market. Decomposition of gender pay gap in Hungary
25
DMEGYE18 Vas 0,114 0,512 0,064 0,064 0,007 0,033 0,000 0,025 100,0% 102,6% 102,6% 0,0% 2,6% 2,6%
DMEGYE19 Veszprém 0,339 0,544 0,021 0,020 0,007 0,011 -0,001 0,004 99,9% 100,4% 100,4% -0,1% 0,4% 0,4%
DMEGYE20 Zala 0,536 0,441 0,065 0,071 0,035 0,031 0,003 -0,006 100,3% 99,4% 99,6% 0,3% -0,6% -0,4%
DISK42 Vocational school 0,961 1,315 0,195 0,326 0,188 0,429 0,172 0,069 118,8% 107,2% 127,3% 18,8% 7,2% 27,3%
DISK43 Secondary school 1,151 1,500 0,458 0,374 0,527 0,561 -0,126 0,160 88,2% 117,3% 103,4% -11,8% 17,3% 3,4%
DISK44 College, University 1,652 2,430 0,264 0,237 0,436 0,575 -0,066 0,205 93,6% 122,8% 114,9% -6,4% 22,8% 14,9%
DKCSOP2 30-34 years 0,227 0,061 0,158 0,186 0,036 0,011 0,002 -0,026 100,2% 97,4% 97,6% 0,2% -2,6% -2,4%
DKCSOP3 35-39 years 0,240 0,008 0,165 0,167 0,040 0,001 0,000 -0,038 100,0% 96,2% 96,2% 0,0% -3,8% -3,8%
DKCSOP4 40-44 years 0,137 -0,007 0,143 0,140 0,020 -0,001 0,000 -0,021 100,0% 98,0% 98,0% 0,0% -2,0% -2,0%
DKCSOP5 45-49 years 0,243 0,007 0,169 0,142 0,041 0,001 0,000 -0,040 100,0% 96,1% 96,1% 0,0% -3,9% -3,9%
DKCSOP6 50-55 years 0,395 -0,228 0,219 0,201 0,086 -0,046 0,004 -0,136 100,4% 87,3% 87,6% 0,4% -12,7% -12,4%
DSZFERA2 Public sector -0,072 -0,090 0,327 0,204 -0,023 -0,018 0,011 -0,006 101,1% 99,4% 100,5% 1,1% -0,6% 0,5%
DSZFERA3 Non profit sector 0,247 0,403 0,034 0,021 0,008 0,009 -0,005 0,005 99,5% 100,5% 100,0% -0,5% 0,5% 0,0%
DTEAOR4 MINING 5,072 3,297 0,004 0,012 0,020 0,041 0,028 -0,007 102,8% 99,3% 102,1% 2,8% -0,7% 2,1%
DTEAOR5 MANUFACTURE OF FOOD PRODUCTS, 4,135 3,038 0,050 0,053 0,207 0,162 0,009 -0,055 100,9% 94,6% 95,5% 0,9% -5,4% -4,5%
DTEAOR6 MANUFACTURE OF TEXTILES 4,085 3,317 0,038 0,012 0,155 0,041 -0,084 -0,029 91,9% 97,1% 89,3% -8,1% -2,9% -10,7%
DTEAOR7 MANUFACTURE OF LEATHER 4,236 3,228 0,012 0,008 0,051 0,025 -0,014 -0,012 98,6% 98,8% 97,5% -1,4% -1,2% -2,5%
DTEAOR8 MANUFACTURE OF WOOD 4,670 3,413 0,003 0,010 0,012 0,034 0,025 -0,003 102,5% 99,7% 102,2% 2,5% -0,3% 2,2%
DTEAOR9 MANUFACTURE OF PULP, PAPER 4,128 3,182 0,018 0,022 0,073 0,071 0,015 -0,017 101,5% 98,3% 99,8% 1,5% -1,7% -0,2%
DTEAOR10 MANUFACTURE OF COKE, REFINED PETROLEUM 4,426 3,078 0,011 0,012 0,048 0,036 0,003 -0,015 100,3% 98,6% 98,8% 0,3% -1,4% -1,2%
DTEAOR11 MANUFACTURE OF CHEMICALS, 4,309 3,530 0,007 0,006 0,028 0,019 -0,004 -0,005 99,6% 99,5% 99,1% -0,4% -0,5% -0,9%
DTEAOR12
MANUFACTURE OF OTHER NON-METALLIC
MINERAL PRODUCTS 4,297 3,288 0,024 0,008 0,104 0,025 -0,054 -0,024 94,7% 97,6% 92,4% -5,3% -2,4% -7,6%
DTEAOR13
MANUFACTURE OF BASIC METALS
AND FABRICATED METAL PRODUCTS 4,041 3,009 0,031 0,068 0,125 0,204 0,111 -0,032 111,7% 96,8% 108,2% 11,7% -3,2% 8,2%
DTEAOR14
MANUFACTURE OF MACHINERY
AND EQUIPMENT N.E.C. 4,353 3,174 0,022 0,050 0,097 0,160 0,089 -0,026 109,3% 97,4% 106,5% 9,3% -2,6% 6,5%
DTEAOR15 MANUFACTURE OF ELECTRICAL EQUIPMENT 4,215 3,402 0,108 0,111 0,457 0,378 0,009 -0,088 100,9% 91,6% 92,4% 0,9% -8,4% -7,6%
DTEAOR16 MANUFACTURE OF TRANSPORT EQUIPMENT 4,617 3,503 0,017 0,053 0,079 0,185 0,125 -0,019 113,3% 98,1% 111,2% 13,3% -1,9% 11,2%
DTEAOR17 MANUFACTURING N.E.C. 5,597 3,621 0,003 0,008 0,016 0,028 0,018 -0,006 101,8% 99,4% 101,2% 1,8% -0,6% 1,2%
DTEAOR18 ELECTRICITY, GAS AND WATER SUPPLY 4,012 3,154 0,020 0,023 0,080 0,073 0,010 -0,017 101,0% 98,3% 99,3% 1,0% -1,7% -0,7%
DTEAOR19 CONSTRUCTION 4,289 3,536 0,014 0,044 0,061 0,156 0,105 -0,011 111,1% 98,9% 109,9% 11,1% -1,1% 9,9%
Create PDF files without this message by purchasing novaPDF printer (http://www.novapdf.com)

Gender inequalities of labour market. Decomposition of gender pay gap in Hungary
26
DTEAOR20 WHOLESALE AND RETAIL TRADE; 4,384 3,530 0,107 0,060 0,468 0,211 -0,166 -0,091 84,7% 91,3% 77,3% -15,3% -8,7% -22,7%
DTEAOR21 HOTELS AND RESTAURANTS 4,413 3,318 0,019 0,012 0,083 0,040 -0,022 -0,021 97,8% 98,0% 95,8% -2,2% -2,0% -4,2%
DTEAOR22
TRANSPORT, STORAGE AND
COMMUNICATION 4,313 3,194 0,103 0,158 0,443 0,505 0,177 -0,115 119,3% 89,1% 106,4% 19,3% -10,9% 6,4%
DTEAOR23 FINANCIAL INTERMEDIATION 4,612 3,101 0,024 0,008 0,109 0,024 -0,049 -0,036 95,2% 96,5% 91,8% -4,8% -3,5% -8,2%
DTEAOR24
REAL ESTATE, RENTING AND
BUSINESS ACTIVITIES 4,503 3,583 0,060 0,070 0,272 0,251 0,035 -0,056 103,5% 94,6% 97,9% 3,5% -5,4% -2,1%
DTEAOR25
PUBLIC ADMINISTRATION
AND DEFENCE 4,437 3,370 0,058 0,061 0,258 0,205 0,009 -0,062 101,0% 94,0% 94,9% 1,0% -6,0% -5,1%
DTEAOR26 EDUCATION 4,117 2,932 0,091 0,037 0,373 0,108 -0,158 -0,107 85,4% 89,8% 76,7% -14,6% -10,2% -23,3%
DTEAOR27 HEALTH AND SOCIAL WORK 4,277 3,507 0,111 0,021 0,475 0,072 -0,317 -0,085 72,8% 91,8% 66,8% -27,2% -8,2% -33,2%
DTEAOR28
OTHER COMMUNITY, SOCIAL
AND PERSONAL
SERVICE ACTIVITIES 4,664 3,371 0,031 0,035 0,146 0,119 0,013 -0,041 101,3% 96,0% 97,3% 1,3% -4,0% -2,7%
DFEOR2 PROFESSIONALS 1,710 1,607 0,168 0,162 0,287 0,260 -0,010 -0,017 99,0% 98,3% 97,3% -1,0% -1,7% -2,7%
DFEOR3
TECHNICIANS AND
ASSOCIATE PROFESSIONALS 1,724 1,874 0,265 0,126 0,456 0,235 -0,261 0,040 77,0% 104,0% 80,2% -23,0% 4,0% -19,8%
DFEOR4 OFFICE AND MANAGEMENT CLERKS 1,747 1,647 0,140 0,016 0,244 0,027 -0,203 -0,014 81,6% 98,6% 80,5% -18,4% -1,4% -19,5%
DFEOR5 SERVICES WORKERS 2,153 2,132 0,116 0,132 0,249 0,282 0,035 -0,002 103,6% 99,8% 103,4% 3,6% -0,2% 3,4%
DFEOR6 SKILLED AGRICULTURAL WORKERS 4,627 5,087 0,007 0,017 0,030 0,086 0,053 0,003 105,4% 100,3% 105,7% 5,4% 0,3% 5,7%
DFEOR7 CRAFT AND RELATED TRADES WORKERS 2,182 2,337 0,117 0,307 0,256 0,716 0,442 0,018 155,6% 101,8% 158,5% 55,6% 1,8% 58,5%
DFEOR8
PLANT AND MACHINE OPERATORS,
VEHICLE DRIVERS 2,102 2,419 0,090 0,143 0,189 0,345 0,128 0,029 113,7% 102,9% 116,9% 13,7% 2,9% 16,9%
DFEOR9 ELEMENTARY OCCUPATIONS 2,497 2,624 0,057 0,036 0,142 0,093 -0,056 0,007 94,5% 100,7% 95,2% -5,5% 0,7% -4,8%
DSTAT2 White-collar worker 0,557 0,703 0,490 0,230 0,273 0,161 -0,183 0,071 83,3% 107,4% 89,4% -16,7% 7,4% -10,6%
DSTAT3 manager 1,138 1,432 0,075 0,118 0,086 0,168 0,060 0,022 106,2% 102,2% 108,6% 6,2% 2,2% 8,6%
DSTAT4 Other 0,393 0,432 0,073 0,092 0,029 0,040 0,008 0,003 100,8% 100,3% 101,1% 0,8% 0,3% 1,1%
DSIZE2 10-20 employee 0,768 0,973 0,075 0,075 0,058 0,073 -0,001 0,015 99,9% 101,6% 101,5% -0,1% 1,6% 1,5%
DSIZE3 20-50 0,829 1,071 0,125 0,104 0,104 0,111 -0,023 0,030 97,7% 103,1% 100,7% -2,3% 3,1% 0,7%
DSIZE4 50-100 0,842 1,121 0,126 0,121 0,106 0,135 -0,006 0,035 99,4% 103,6% 103,0% -0,6% 3,6% 3,0%
DSIZE5 100-250 0,969 1,072 0,155 0,170 0,150 0,182 0,016 0,016 101,6% 101,6% 103,3% 1,6% 1,6% 3,3%
DSIZE6 250-500 0,971 0,929 0,119 0,134 0,116 0,124 0,014 -0,005 101,4% 99,5% 100,8% 1,4% -0,5% 0,8%
Create PDF files without this message by purchasing novaPDF printer (http://www.novapdf.com)

Gender inequalities of labour market. Decomposition of gender pay gap in Hungary
27
DSIZE7 500-1000 0,854 0,890 0,091 0,098 0,078 0,087 0,005 0,003 100,6% 100,3% 100,9% 0,6% 0,3% 0,9%
DSIZE8 1000-2000 0,818 0,948 0,059 0,066 0,048 0,063 0,007 0,008 100,7% 100,8% 101,5% 0,7% 0,8% 1,5%
DSIZE9 2000-5000 0,788 0,767 0,106 0,104 0,084 0,080 -0,002 -0,002 99,8% 99,8% 99,6% -0,2% -0,2% -0,4%
DSIZE10 5000-more 0,805 0,819 0,056 0,059 0,045 0,048 0,003 0,001 100,3% 100,1% 100,3% 0,3% 0,1% 0,3%
DFEMA2 20-40% proportion of women 0,781 0,327 0,165 0,233 0,129 0,076 0,022 -0,075 102,2% 92,8% 94,9% 2,2% -7,2% -5,1%
DFEMA3 40-60% 0,572 0,076 0,248 0,204 0,142 0,015 -0,003 -0,123 99,7% 88,4% 88,1% -0,3% -11,6% -11,9%
DFEMA4 60-80% 0,522 -0,069 0,307 0,165 0,160 -0,011 0,010 -0,181 101,0% 83,4% 84,2% 1,0% -16,6% -15,8%
DFEMA5 80-100% 0,718 -0,056 0,197 0,026 0,141 -0,001 0,010 -0,152 101,0% 85,9% 86,7% 1,0% -14,1% -13,3%
DTAP2 4-7 year job experience 1,655 2,448 0,077 0,079 0,128 0,194 0,005 0,061 100,5% 106,3% 106,9% 0,5% 6,3% 6,9%
DTAP3 8-10 years 1,602 2,637 0,081 0,096 0,129 0,252 0,040 0,083 104,1% 108,7% 113,1% 4,1% 8,7% 13,1%
DTAP4 11-20 years 1,540 2,621 0,276 0,316 0,425 0,828 0,104 0,299 110,9% 134,8% 149,5% 10,9% 34,8% 49,5%
DTAP5 21-30 years 1,630 2,709 0,299 0,281 0,488 0,762 -0,049 0,323 95,2% 138,2% 131,5% -4,8% 38,2% 31,5%
DTAP6 31+ years 1,609 2,992 0,234 0,195 0,376 0,583 -0,117 0,324 89,0% 138,2% 123,0% -11,0% 38,2% 23,0%
DJHIST2 1 job 0,235 0,127 0,194 0,186 0,046 0,024 -0,001 -0,021 99,9% 97,9% 97,8% -0,1% -2,1% -2,2%
DJHIST3 2 0,243 0,104 0,226 0,195 0,055 0,020 -0,003 -0,031 99,7% 96,9% 96,6% -0,3% -3,1% -3,4%
DJHIST4 3 0,187 0,202 0,185 0,189 0,035 0,038 0,001 0,003 100,1% 100,3% 100,3% 0,1% 0,3% 0,3%
DJHIST5 4 0,189 0,311 0,105 0,110 0,020 0,034 0,001 0,013 100,1% 101,3% 101,4% 0,1% 1,3% 1,4%
DJHIST6 5 or more 0,276 0,137 0,101 0,131 0,028 0,018 0,004 -0,014 100,4% 98,6% 99,0% 0,4% -1,4% -1,0%
DBREAK2 Unemployed 0,082 0,039 0,288 0,282 0,024 0,011 0,000 -0,012 100,0% 98,8% 98,8% 0,0% -1,2% -1,2%
DBREAK3 Twice or more 0,039 0,032 0,107 0,127 0,004 0,004 0,001 -0,001 100,1% 99,9% 100,0% 0,1% -0,1% 0,0%
Van-e gyereke You have children 0,145 0,139 0,773 0,712 0,112 0,099 -0,008 -0,004 99,2% 99,6% 98,7% -0,8% -0,4% -1,3%
más
képesítést
szerzett Additional qualification 0,021 -0,011 0,538 0,573 0,011 -0,007 0,000 -0,018 100,0% 98,3% 98,2% 0,0% -1,7% -1,8%
kollektív
szerződés
Collective barganing agreement
is in the organization 0,071 0,266 0,742 0,727 0,053 0,193 -0,004 0,144 99,6% 115,5% 115,1% -0,4% 15,5% 15,1%
Munka
viszony-
határozott
idejű Fixed term agreement 0,108 0,094 0,080 0,070 0,009 0,007 -0,001 -0,001 99,9% 99,9% 99,8% -0,1% -0,1% -0,2%
Szak
szervezeti Trade union membership 0,023 0,016 0,462 0,447 0,010 0,007 0,000 -0,003 100,0% 99,7% 99,6% 0,0% -0,3% -0,4%
Create PDF files without this message by purchasing novaPDF printer (http://www.novapdf.com)

Gender inequalities of labour market. Decomposition of gender pay gap in Hungary
28
tag
konstans tag 0,096 0,161 1,000 1,000 0,096 0,161 0,000 0,065 100,0% 106,7% 106,7% 0,0% 6,7% 6,7%
Összesen 11,479 11,643 -0,075 0,173 92,8% 126,9% 117,7% -7,2% 26,9% 17,7%
Create PDF files without this message by purchasing novaPDF printer (http://www.novapdf.com)