fighting gender labour market inequalities in the labour
TRANSCRIPT

Family-Friendly Policies, Fertility, Poverty and Gender Inequalities in the Labour Market : Which relationships and disparities in OECD countries?
By Olivier Thévenon
INED (National Institute for Demographic Research), France 133 Boulevard Davoult, 75020 Paris Tel: +33 1 56 06 22 44 [email protected]
outline Please don’t quote without the permission of author
Introduction
The importance of family-friendly policies to balance work and family life is illustrated with a basic stylised fact: the inversion of the correlation between female employment and fertility rates, negative in the 70’s but positive since the middle of the 80’s (Engelhardt et al., 2003 ; D’Addio et Mira d’Ercole, 2005). Such a reverse of trend is often mentioned as a success of policies that can benefit to both fertility and female employment.
For this reason, the issue of work and family balance is brought as a priority in the policy agenda of a growing number of OECD countries. It is even a central concern of the European Employment and growth Strategy launched by the European Commission since the 1997 Amsterdam summit: the largest number of parents, and especially women are encouraged to participate in labour market continuously over their life-cycle in order to keep well qualified workers in the labour market to stimulate economic growth. Moreover, the increase in active population is also expected to offset the rise in the economic dependence ratio induced by the process of population ageing (Thévenon, 2004). However, many inequalities still remain between women and men in the labour market, in relation with their family situation. They concern nonetheless labour market participation, but also occupational situation and career development (OCDE, 2002a).
To reduce those inequaltities, the implementation of family-friendly policies faces two kinds of difficulties. One relies to the multiplicity of objectives attached to policies supporting families, since employment is not the only focus of these policies. As a consequence, employment issues should not be considered independently from the other concerns of family policies, such as the well-being and development of children, fertility, poverty, social and gender inequalities. However these diverse objectives are only partially congruent and their combination necessarily rests on a compromise that can vary across countries and over time. The other difficulty come from the large numbers of actors (public sector, associations, unions, firms) enrolled in the definition and implementation of policies, actors who have varying and potentially conflicting concerns. In such a context, policies and practices supporting families considerably vary from country to country. This paper aims to identify patterns of family policies and to investigate their relationships with countries situation relating to poverty, fertility and gender inequalities in the labour market. For that, we complete a mutifactorial analysis of data, based on most recent OECD Family data basis and other sources of OECD-European data. Such an analysis of correlations between family policy variables allows identifying the combination of family policy characteristics which differentiate countries. Thus, it sheds light on the various degree of complementarity settled between the different family policy instruments.

The first section starts with a brief the state of family policy research and presents the derived objectives of the present paper. The second section deals with data and methodology, and results are commented in the following parts. The third section presents the results of a classification procedure of patterns of family policy. The fourth section discusses the relationships between these policies and countries situation in terms of poverty, fertility and gender inequalities in the labour market.
I. Objectives and Means of Family-Friendly Policies
Family-friendly policies are driven by several objectives which are only partially congruent. For this reason, their combination rests on a sort of compromise which varies widely from country to others according to the coordination and the hierarchy settled between the dimensions of welfare included in those objectives (Thévenon, 2006). These compromises shape institutions, as well the specific attibutes with which some institutions can be designed as the coherence achieved to support people in their decision relating to family life and work.
I.1. The diverse objectives of family-friendly policies
In many countries, employment and poverty have been recently the main motivations for recasting social policies and especially those supporting families. However, policies have also to deal with other family related issues. Five objectives, potentially conflicting, are concerned.
Fertility is a first issue that appears in the policy agenda of a growing number of countries because of its relationships with long term economic growth and welfare state sustainability. Policy support is promoted to help households to get the number of children they desire, surveys showing a gap between this number and effective fertility (D’Addio et Mira d’Ercole, 2005).
Children well-being, social and cognitive development is a second objective of the support to families. The time allocated by parents to their child, as well as their enrolment in collective childcare and education structure are considered as beneficial for children well-being and development. However, the way policies promote their combination varies across countries, partly because of different ideologies on what is beneficial for children under 3 years: parental time or early frequentation of childcare structure? For older children, the large enrolment in preschool education is regarded in all cases as the key investment required for children development.
Balancing work and family lite, and creating the conditions to encourage the development of female employment is a third driven goal of family-friendly policies. In this case, both childcare structures and subsidies are developped to faciltate and, if need, to reduce the cost of a the participation of women in the labour market after the birth of a child. A key issue is how work and care are combined in order to satisfy both working life constraints and children needs. The design of several institutions is here consequently concerned: the organisation of childcare services, including timetable, the flexibility offered to parents to use these services in accordance with their working life constraints; childcare subsidies which contribute both to make services affordable and to make work pay; finally, working time regulations are also a key variable to adjust work to family-related constraints.

The reduction of poverty and other forms of inequalities are also important issues family policies have to deal with. Indeed, family benefits contribute to reduce inequalities between households with different composition. However, policy design differ in the extent to which those benefits are coordinated or integrated to employment issues. As employment of parents is also promoted to prevent from poverty, a policy issue is to get an adequate equilibrium between income support of poor families and the guarantee of financial return from work.
Finally, gender equity is also a concern of family-friendly policies, but its role in policy design considerably varies from country to country for several reasons. First, the ideological content of equality varies and policies can be focused on ‘outcomes’ or restricted to ‘opportunities’. Next, equality concern can be fixed as an objective or as instrument to increase the weight of other objectives. Even in this latter case, gender equity is important to consider since it can be conflicting with previous dimensions.
Thus, family policies have to deal with a relatively complex task since an equilibrium has to be found between these objectives of different nature. The equilibrium depends on how these objectives are coordinated, legitimised, and consequently varies across coutries1. Three levers can be used to settle such an equilibrium.
I.2. The three levers of family-friendly policies In order to influence behaviours, policies can act on three sets of ressources considered by
households to make their decision relating to work and the family: time, which can be allocated to work or care; income, which influences nonetheless the allocation of time but also the decision to have children; childcare services, which fequentation depends on availabity, but also affordability and quality of services. Public action have three levers to influence how households combine these ressources.
The investments in childcare services is a first lever, but many variations can be found across countries in the extent to which they are targeted to incresase care capacities, to promote quality or to enlarge affordability. Of course, the mix of these concerns clearly depends on how employment and child development purposes are coordinated.
The Tax and Benefits system is a second lever for public policy to influence household well-being and behaviour. Cross-national differences are prominent in the extent to which benefits and taxes are designed or not to guarantee returns from work. They differ also in the composition of household who benefit from redistribution and income support.
The legislation and rights surrounding employment relation and its adjustment to working life to family charges are the third lever that can be used. This includes the entitlments to child-related leaves, to reduce working hours or to have flexible working time, etc., which all influence practices of both employees and employers. Part-time work can be promoted in this perspective to balance work and family-life, but can also increase gender inequalities in the labour market.
Many cross-country differences appear in the extent to which policies resort to each of these levers. These differences also concern the way those levers are combined, and so the coherence which achieved or not.
1 See comprehensive analyses made by OECD

I.3. The comparison of Family Policies: where do we stand?
This balance between the key levers of action and the variable degree of coherence achieved have been examined through comparative analyses of family policy. Several studies point out some varieties in family-friendly policies and in the way those policies are anchored in employment, child development, poverty reduction or gender equity perspectives.
Gornick et al. (1997) provided a comparison between OECD countries policies developped to enhance mothers labour market opportunities. They show that cross-country differences only partially coincide with dominant welfare state regimes classification. Countries are compared according to the extent of which the conciliation between work and family life is supported for mothers with preschool children. Nordic countries, together with France and Belgium are found to provide a relatively continuous support to mothers who decide to combine work with family life before child enrolment in primary school system. In conservative-corporatists contexts such as Germany and the Netherlands, the support is weak or at least discontinuous and women have to adapt their labour market participation with an interruption or a switch to part-time work. The weakest support is provided in Anglo-Saxon countries, where career interuptions are consequently most frequent2. However the support is progressively developped when children are getting older. They also suggest that these policies have important and frequent overlooked implications for the economic well-being of families (including the well-being of children) since they are important part of policies designed to tackle poverty reduction and to support child development. Gornick et Meyers (2006) added important pieces on this topic, considering children outcomes through indicators of child poverty rates, infant portality rate, or science achievement scores (among others). They observed a relatively weak performance of the United States on children outcomes, performance that appears quite paradoxical because children’s well-being is a central dimension of Sate intervention on welfare issues.
Gauthier (2002) considers the evolution of family policy from the 70’s to the end of the XXth century, and focuses on children-related leaves and family-related benefits (i.e. services are not considered). She identifies the formation of four groups of countries during the 80s, but note an increasing dispersion within some group over the period. Southern European countries are not strictly similar, but they all reach a rather low level of support. By contrast, nordic countries provide a relatively moderate support to all families but a high support employed parents. The weakest provisions are found in Anglo-saxon countries, while the situation of continental countries appears most heterogeneous.
De Hénau et al. (2006) complete the analysis for the 15-UE countries with the addition of childcare services as a term of comparison together with the provision of leave and family-related benefits. Nevertheless, they also point out the limits of standard typologies by stressing again the similar emphasis on the support to employed parents in France, Belgium and the set of Nordic countries. Spain and the United Kingdom are also both characterised by a support through benefits, whereas services remain relatively limited and mostly provided by the private-marketed sector. 2 In that context, the development of part-time work and flexible ‘family-friendly’ working time schedules and the adaptation of the tax and benefit systems to ‘make work (including part-time work) pay’ are clearly the central policy variables considered to support female labour market participation, while public investment in childcare structure is not. In that respects, the Netherlands and the United-Kingdom share many of characteristic those characterististics. Part-time work and the alternance of short periods of labour market participation and interruptions are consequently most frequent in these both countries during the period of family formation. In that respects, many characteristics are as Thévenon (2003; 2006).

The following papers will extend these previous works by considering the relationships between the characteristics of family policies (including childcare services, benefits and transfers, leave provision) and the situations of countries in respects with fertility, poverty and gender inequalities in the labour market. Several aspects of these inequalities will be considered, such as differences in employent rates, part-time work, wages, and other forms of segregation. These siutations may be partly considered as outcomes of policies; however we won’t explore the causality relationships between the two sets of variables.
Most recent available data through the OECD Family Database are used to compare family policies across countries and reflect their situation in the early 2000’s. Thus, another purpose of the analysis is refresh our knowledge on the similarities and differences in family policies across countries and to take into account potentail evolution sincie previous works. Both Anglo-Saxon and Eastern Europe countries are added to the 15-UE countries to make the comparison.
II. Data and Methodoly The objective of the following analysis is to map family policies and their connection with
the situation of countries in terms of poverty, fertility and gender inequalities in the labour markets. In this perspective, a factorial analysis of data helps to identify the set of variables that structure the similarities and differences between countries. A classification of countries is derived from this analysis.
II.1. An exploratory approach through multiple factorial analysis A multiple factorial analysis (MFA) has been implemented to cope with the multiple
dimensions of family policies and to link these dimensions to several aspects of their outcomes. Here, the advantage of such MFA is to weight the influence of the different groups of variables, while the influence of one group can be overestimated in a standard Principal Component Analysis (PCA) only because the number of variables in this group is larger. To avoid that situation, each variable is weighted in the MFA by the influence of its group (as estimated by the first eigen-value of the PCA implemented seperately) (see Escoffier and Pagès, 1982).
As we are interested in the differences in family policies, only the related variables are declared as ‘active’ in the analysis. The variables referring to fertility, children outcomes, poverty and employment are treated as ‘illustrative’. This distinction means that the factorial identification and the derived classification are based only on the family policies variables. However, the correlations with the other group of ‘illustrative’ variables are also estimated although they do not contribute to the definition of factors.
24 OECD Countries are treated as individuals and policy variables are classified according to the 3 broad previously mentionned categories: child care and educational services, child-relative leave entitlements, and transfers and benefits to families. Most of the data are extracted from OECD sources (Family of Education data base, ).
Group 1 of variables refers to childcare and education services. We have included data on public spending on childcare and education services in % of GDP and per child. We also consider variables to capture the extent of service capacities (as measured by frequentation rates). A measure of services affordability is icluded through some estimations of the net cost paid by parents, arbitrarilly selected for a couple and for a sole parent with two children under the age 3. The two members of the couple are supposed to work and to earn individually the

income of the average production worker. The sole parents is supposed to receive only two thirds of the average production worker income. The ratio of children cared by one carer is also included in the analysis as a rough indication on childcare quality3.
Group 2 concerns the child-related leaves variables. This dimension is compared according to the amount of public money spent to offer a compensation income to employees on maternal or parental leaves. Country comparison are based on the estimation of a fully paid period, such as reported by the OECD Family databasis. Home care allowances have been included here, although they are not strictly connected to parental leave. However, we also consider coross country differences in the total period of available leave, since only a small period of the leave is paid in many countries. Paternity leaves etitlments are also included.
Both public and private transfers in cash and in time are considered as the group 3 of variables. One issue is to find out if public support stands rather as a substitute to a ‘lack’ of family support, or rather as a complement if private transfers are positively correlated with public transfers. A similar question is raised about transfers in cash or in time, since cash transfers within the family can be fostered to compensate the weakness of transfers in time, and reciprocally. However, it is also possible that larger transfers in time are produced in by richer households, leading to a positive correlation between those two kinds of transfers. Clearly, the macro level of our analysis here is limited to answer to these questions adressed to micro-economics behaviours. Nevertheless, it is possible to measure, at the aggregate level, if public and private transfers, on one side, and cash and time transfers, on the other side, are rather positively or negatively correlated. In this aim, our dataset includes the estimation of public benefits and tax advantages concerning families provided by by Adema and Ladaique (2005) as a percentage of GDP. Some estimations of the frequency of transfers in time and money given by senior households (including grandchile care) are also included in the analysis for a sub-group of countries, as reported by Attias-Donfut et al. (2005) from the SHARE survey. The frequence of of households with cohabiting generations is also included in the data set.
The ‘illustrative outcome’ variables have also been gathered in 3 groups, related to fertility (group 4), poverty and child achievement at school (group 5), and labour market perfomances (group 6). Children achievement is considered through their success in reading and science learning, such as reported in the PISA database. Differences in poverty rates are also included for households with children, sole parents and children. A large set of variables also refers to the labour market: female employment rates, the development of part-time or flexitime and the relative frequency of two (full-time or part-time) earners households. Moreover, several dimensions of gender differences are included, as regards to unemployment and employment rates, working hours (effective and preferred), for both households with and without children. Gender wage gaps are also taken into account, as well as some index of occupational and sectorial segregation for European countries, referring here to the Laeken indicators. Gender differences in the allocation of time to domestic and care activities are also included, but only for a limited number of countries where the information is available.
3 This is surely a limited to evaluate services quality which also depends among others on carer qualification and salaries. However, such data are not available on a comparative basis.

List of variables COMPOSITION DES GROUPES Groupe 1 ACTIF, ACP NORMEE ----------------------------- - Spending in childcare and preschool services (% GDP) - Spending in childcare per child (0-2 years, US PPP) - Spending in preschool per child (3-6 years, US PPP) - Frequentation of childcare services (0-2 years) - Frequentation of preschools (3-6 years) - freq in full-time equivalent (0-2 ans) - % of firms providing domestic or childcare services - Child-to-staff ratio (0-2 years) - Child-to-staff ratio in preschool (3-6 years) - Net cost of childcare services for couple (100-100 APW) - Net cost of chidlcare services pr sole par (67% APW)) Groupe 2 ACTIF, ACP NORMEE ----------------------------- - Public spendings on child related leaves (% GDP) - Spend per child in % GDP per capita (mat. & parental leave) - Parental leave duration - Weeks eq of 100% paid leave - mat+parental leave - Weeks eq of 100% paid leave - paternity leave Groupe 3 ACTIF, ACP NORMEE ----------------------------- - Benefits and tax avdantages for families (% GDP) - Freq of transfers in cash given - Freq of transfers in time given - Freq of grandchild care - No transfers in cash nor time - Freq of housholds with cohabiting generations (ECHP) Groupe 4 ILLUSTRATIF, ACP NORMEE ----------------------------------- - Poverty rates in househols with children - Poverty rates in monoparental households - Children poverty Groupe 5 ILLUSTRATIF, ACP NORMEE ----------------------------------- - Period rates of fertility - Decrease in fertility rates since 1970 - age at first birth - % of childless women at age 40-44 - fertility over 3 children at age 40-44 - Child performance in readings - Child performance in sciences Groupe 6 ILLUSTRATIF, ACP NORMEE ----------------------------------- - Female employment rate - Part-time rates for women with children under 6 - Part-time chosen - Part-time for caring motives - % of couples with M and W at full-time - % of couples with M at full-time and W at part-time - % of couples with M full-time, W inactive - % of unemployed couples - Diff M-W in weekly hours of work - % établissements avec flexitime - Diff M-W in overtime - Diff M-W in hours preferred (households with childr) - Diff M-W in hours preferred - childless households) - Diff H-W in full-time eq employment rates - Diff M-W in part-time work (15-64 years) - Diff H-W in emplyement rate (15-24 years) - Diff H-F in employment rate (25-54 years) - Diff H-F in employment rate (55-59 years) - Diff M-W mean age at retirement - Diff M-F in regional disparities emp. rates - Diff employment rate childess men/men with children - Diff employment rate childless women/with children - Gender wage gap in the private sector - Gender wage gap in the public sector - Gender wage gap - all sectors - Family wage gap (2 children, non adjusted) - occupational segregation index - Sectorial segregation index - Women presence in managerial jobs - Share of women in the public sector - Diff H-F in long-term unemployment - Diff M-W in domestic work - % time in chidlcares - Men - % time in childcare - Women
II.2. The general results of the MFA We first present the basic results of the MFA. Its comparative advantage reltively to the
Principal Component Analysis is illustrated by the differences in the first eigen-values derived from the 6 Principal Component Analysis applied separately to our six groups of variables (Table 1: variations from 2.73 to 7.99).

TABLE 1 of eigen values of partial analyses +------------------------+------------------------------------+-------------------------------+-------------------------------+ | | eigen values | POURCENTAGES D'INERTIE | Percentegae Cumulated | | |------------------------------------+-------------------------------+-------------------------------+ | GRP TYPE DIM | 1 2 3 4 5 | 1 2 3 4 5 | 1 2 3 4 5 | +------------------------+------------------------------------+-------------------------------+-------------------------------+ | 1 ACP NORMEE ACT 12 | 4.113 1.608 1.511 1.257 0.944 | 34.3 13.4 12.6 10.5 7.9 | 34.3 47.7 60.3 70.7 78.6 | | 2 ACP NORMEE ACT 5 | 2.759 1.315 0.447 0.342 0.136 | 55.2 26.3 8.9 6.8 2.7 | 55.2 81.5 90.4 97.3 100.0 | | 3 ACP NORMEE ACT 7 | 4.254 1.144 0.853 0.443 0.257 | 60.8 16.3 12.2 6.3 3.7 | 60.8 77.1 89.3 95.6 99.3 | | 4 ACP NORMEE ILL 3 | 2.727 0.217 0.056 | 90.9 7.2 1.9 | 90.9 98.1 100.0 | | 5 ACP NORMEE ILL 7 | 2.566 1.442 1.145 0.813 0.537 | 36.7 20.6 16.4 11.6 7.7 | 36.7 57.3 73.6 85.2 92.9 | | 6 ACP NORMEE ILL 23 | 7.995 5.867 4.089 2.424 2.204 | 23.5 17.3 12.0 7.1 6.5 | 23.5 40.8 52.8 59.9 66.4 | +------------------------+------------------------------------+-------------------------------+-------------------------------+
We can now analyse the results of the global multifactorial analysis (Table 2), and observe that the 2 first factors are important but certainly not sufficient as they capture only half of initial information. Moreover we can see that we have to consider the 5 first axes in order to capture the three quarter of initial information. That why our cluster analysis is parametrised to incude this 5 factors. Table 2 ANALYSE GLOBALE Eigen values APERCU DE LA PRECISION DES CALCULS : TRACE AVANT DIAGONALISATION : 6.3758 SOMME DES VALEURS PROPRES . : 6.3758 HISTOGRAMME DES 5 PREMIERES VALEURS PROPRES +--------+------------+----------+----------+----------------------------------------------------------------------------------+ | NUMERO | eigen | POURCENT.| Percentage.| | | | value | | CUMULE | | +--------+------------+----------+----------+----------------------------------------------------------------------------------+ | 1 | 2.1102 | 33.10 | 33.10 | ******************************************************************************** | | 2 | 1.0399 | 16.31 | 49.41 | **************************************** | | 3 | 0.5799 | 9.10 | 58.50 | ********************** | | 4 | 0.4765 | 7.47 | 65.98 | ******************* | | 5 | 0.4150 | 6.51 | 72.48 | **************** | +--------+------------+----------+----------+----------------------------------------------------------------------------------+ EDITION SOMMAIRE DES VALEURS PROPRES SUIVANTES 6 = 0.3301 7 = 0.2727 8 = 0.2085 9 = 0.1806 10 = 0.1760 11 = 0.1561 12 = 0.1251 13 = 0.0854 14 = 0.0745 15 = 0.0495 16 = 0.0324 17 = 0.0264 18 = 0.0177 19 = 0.0070 20 = 0.0064 21 = 0.0040 22 = 0.0017 23 = 0.0002 21 = 0.0751 22 = 0.0411 23 = 0.0245
Let us now examine the global coefficient of correlations between groups (Tabels 3). Rather weak correlations between groups are reported, which means that each group have relatively different structures (i.e. the relative position of countries differs within each group). However, correlations between the variable of the first (childcare services) and second (leave provision) groups and variable illustrating country situation in terms of poverty (group 4) are not negligible. Note also that there is no obvious correlations between the variables describing labour market situations (group 6) and those of other groups, which means that there is no simple translation of disparities in one group on the labour market. Table 3a : COEFFICIENTS RV DE LIAISON ENTRE GROUPES | 1 2 3 4 5 6 AFM ----+------------------------------------------------- 1 | 1.000 2 | 0.479 1.000 3 | 0.408 0.133 1.000 4 | 0.509 0.435 0.186 1.000 5 | 0.284 0.271 0.243 0.117 1.000 6 | 0.450 0.347 0.397 0.200 0.387 1.000
AFM | 0.856 0.722 0.666 0.511 0.355 0.531 1.000 ----+-------------------------------------------------
Table 3b COEFFICIENTS Lg DE LIAISON ENTRE GROUPES | 1 2 3 4 5 6 AFM ----+------------------------------------------------- 1 | 1.509 2 | 0.663 1.271

3 | 0.533 0.159 1.127 4 | 0.627 0.493 0.198 1.007 5 | 0.454 0.397 0.335 0.153 1.684 6 | 0.816 0.578 0.622 0.297 0.741 2.181
AFM | 1.282 0.992 0.862 0.625 0.562 0.955 1.486 ----+------------------------------------------------- | 1 2 3 4 5 6 AFM
Finally, a general assessment of the quality of the representation obtained by each of the 5 factors of the analysis is given by the ratios reeferred in table 4. This ratio is close to 1 when the implicated factor reflects a structure common to most of countries. Thus, if the structure relected by the first axis seems to be quite common to the set of countries, this is less clear for further factors. Following comments should not ignore these disparities.
RAPPORT : INERTIE INTER/INERTIE TOTALE AXES 1 A 5 +------+------------------------------+ | | RAPPORTS | +------+------------------------------+ | FAC. | 1 2 3 4 5 | +------+------------------------------+ | | 0.72 0.46 0.40 0.42 0.47| +------+------------------------------+
II.2. How many patterns of family policy? The agregated results of the AFM and the derived cluster analysis are presented in figures
1. This figure provides the result of the cluster analysis derived from the factorial analysis. The cluster tree evaluates the degree of similarities between countries and the distance between groups. As relatively expected, Nordic countries and France are clearly opposed to southern European together with Anglo-Saxons countries (including the Netherlands) and most of eastern and continental European countries. More unexpected is first the relative proximity between southern european countries (Italy, Greece and Portugal), Australia and the United States, while Spain appears to be relatively distant from this group. Furthermore, the set of nordic countries appears to be far from homogeneous since Sweden and Denmark are close and close to Iceland, but distinct from Norway and Finland. As stated in previous work, France is found again to share some similar characteristics with nordic countries, here Norway and Finland.
Figure 1: Classification of countries according to family policy

II.3. How to interpret the classification? Figures 2 presents the position of countries according to the two first axes derived from
the factorial analysis. Factors description allows an interpretation of those axes (Figure 3).
Figure 2a

Figure 2b: Variables correlated with factor 1 and 2

The first axis captures about one third of initial information and contrasts countries mainly according to the provision of childcare services and paid leave entitlements4. This contrast refers to the relative importance of family friendly policies and support given to parents (and especially employed parents) care for children: the spending on child related leaves (including the estimation of the total period fully compensated) and the spending in chidcare and education services (in % of total GDP) are higher on the left hand side. This support concerns also specifically children under the age of 3 years, since the amount spent in childcare services per children under 3 years (in % of GDP per capita) as well the coverage of these services are also higher on this side. Sweden and Denmark clearly distinguishes here from other countries with a relatively long period of fully compensated leave and high support in childcare services ; by contrast, the cost of childcare services paid by parents increases on the right hand side, markedly in Anglo-Saxon countries (Figure 2a). Provision of leave and childcare support is also weaker in countries like Spain where there is a relatively important share of households with cohabiting generations but also a high proportion of households that neither receive nor give any transfers in time or in cash (see tables 4 and 5).
The second axis, although less discriminant, more specifically opposes countries according to the support supplied either by private transfers and services provided by firms, or through long period of leave (either paid or not paid). The limited period of leave and more frequent provision of services by firms in the Netherlands and the Anglo-Saxon countries contrast here clearly to Eastern European countries or Spain on both aspects. Such an
4 Partial correlations between group variables and the factors derived from the MFA shows that the first group of variables, related to childcare services, is more markedly determined by the first factor than other groups; the structure of the leave-related variables is the more determined the second factor.

opposition indicates that both private transfers and firm-provided services stand as substitutes to parental time when the period of leave is limited. Note that care provided by grandparents is also higher when to the frequentation of childcare structure is relatively high, especially in Denmark, indicating that this two type of care seems rather complements than substitutes.
Higher frequencies of firms providing services are found in Anglo-Saxon countries where childcare is relatively expensive (on the right top hand side of the), but also in the Netherlands where childcare cost are though lower. Clearly, these firm-integrated services offset the limited capacity and affordability of public childcare support. Note also that the spendings per child in preschool education also covariate, as if there is a trade-off here in favour of preschool education against childcare services affordability.
Although less discriminating, further axes 3 and 4 show some other constrasts between countries. In particular, the third factor is correlated with the sources of care available for children under 3. On the one hand, the frequentation of childcare services by children under 3 is higher in countries whith higher levels of spending per child in all childcare and education services and when the compensated period of paternity leave is longer. Iceland is clearly singular on this aspect with a relatively limited period of 26 weeks of cumulated available period of maternity and parental leave, and with by contrast a relatively extended period of 13 weeks of paternity leave. Spain is again relatively specific with a relatively high frequentation of childcare service by children under 3 (20.7%) correlated with a relatively high share of households who do not receive nor give any transfer.
By contrast, the cumulated period of maternity and parental leave is longer when the set of benefit and tax advantages received by families, and the frequentation of services by children under 3 years is lower (and the associated cost for parents is higher). Thus, both and the possibility for mothers to care personnally for their child over a relatively long period and the cost of childcare services for parents seems to limit the frequentation of services by young children. This refers more specifically the case of Eastern European countries and Germany, where the period of available leave is relatively long and the frequentation of childcare services by children under age 3 is especially low. However, the benefits and taxes advantages received by families represent a relatively important share of the GDP (except in Poland). In Ireland, the period of leave is shorter, but the cost of childcare services is exceptionally high.
The fourth axis opposes countries mainly according to the nature of support in cash versus in time and services. Thus, the position of the Netherlands, France and Spain clearly contrast to other countries here, with a relatively low frequency of private transfers in cash but relatively frequent transfers in time and grandchild care, and important share of firms providing domestic and care services in the Netherlands. The share of benefits and tax advantages to families in the GDP is also particularly low in the Netherlands.
Figure 3a: Variables correlated with factors 3 and 4.

Figure 3b


Table 4: Provision of childcare and preschool services Spending in
care and education services (% GDP
Spending in care services per child ( US PPP)
Spending in preschool education per child (US PPP)
frequentation of childcare services (0-3 years)
frequentation of preschool services (3-6 years)
freq in full-time equivalent (0-3 ans)
% firms with childcare ou domestic support1
Child-to –staff ratio (0-2 years)
Child-to-staff ratios in preschool (3-6 years
Net childcare cost for parents (couple with earnings 100-100 of APW; two children under 3)
Net childcare cost for sole parents (earning 67% of APW, two children under 3)
Denmark 2.25 8000 4824 61.7 90 67.87 5 5 6.9 10 3Sweden 1.45 5300 4091 39.5 82 45.425 3 5.5 10.9 10 3Finland 1.4 4100 4069 35 68 35 7 4 12.7 11 2Norway 1.3 6050 3895 43.7 85 43.7 8 19 2Iceland 1.7 3200 6781 58.7 94.7 58.7 7.3 18 9France 1.6 4000 4744 26 99 26.52 7 5 18.8 23 6Autria 0.6 3150 6205 4.1 75 3.0545 6 8.7 14.7 26 9Germany 1.2 3000 4865 9 86 9 5 7.5 10.5 18 2Belgium 0.75 1900 4663 38.5 99 34.65 3 7 15.6 16 4Netherlands 0.5 2000 5497 39 77 40.95 41 5 20 28 6Luxembourg 0.6 3554 14 76 12.6 9 5 14.3 Ireland 0.32 1150 15 75 13.5 5 3 10.3 51 51United-Kingdom 0.75 1722 7153 25.8 82 12.9 17 3 17.4 45
14
Australia 0.7 29 47 14.5 5 10 34 10New-Zealand 0.35 1697 4325 32.1 98 16.05 4.5 9.4 34
10
United-States 0.65 1800 7755 29.5 53 29.5 5 11.9 33
1
Portugal 0.85 1220 4489 23.5 71 17.625 7 11 16.5 38 17Italy 0.65 2761 6116 6.3 71 6.3 2 7 12.5 Spain 0.65 1600 4151 20.7 77 14.49 8 13.7 13.9 Greece 0.4 1169 7 48 6.3 9 5 12.7 10 3Poland 0.5 3269 2 36 1.6 3 Czech Republic 0.65 1750 2660 3 85.3 2.4 3 11.6
Slovakia 0.6 1000 2641 17.7 72 14.16 12.5 Hungary 1.45 3985 6.9 87 5.52 4 6 10.5 12 12

Sources: OECD Family data basis http://www.oecd.org/document/4/0,2340,en_2649_34819_37836996_1_1_1_1,00.html; Education data basis and other OECD sources.1 Anxo, Fagan, Letablier, Perraudin, Smith, 2006, Parental Leave in European Companies. Establishment Survey on Working Time 2004-2005
Table 5: Child-related Leave entitlements Public
spending on leaves (% of GDP)
Spending per child in % of GDP per capita (maternity and parental leave)
Maternity leave period for a first birth
Full-time equivalent period of 100% paid maternity leave
Period of parental leave
Full-time equivalent period of 100% paid parental leave
Cumulated period pf maternity and parental leaves
Full-time equivalent period of 100% paid maternity and parental leaves
Paternity leave
Full-time equivalent period of 100% paid paternity leave
Denmark 0.49 49 18 18 32 28.8 50 46.8 2 2 Sweden 0.89 64 15 12 51 40.8 66 52.8 11 9.2 Finland 0.62 57 18 11.7 26 15.6 200 42.9 3 3 Norway 63 9 7.2 42 42 51 49.2 6 3.2 Iceland 50 13 10.4 13 10.4 26 20.8 13 10.4 France 0.6 28 16 16 156 40.2 172 56.2 2 2 Autria 0.37 32 16 16 104 21.84 120 37.84 0.4 0.4 Germany 0.2 22 14 14 156 11.4 170 25.4 0 0 Belgium 0.17 17 15 11.53 12 2.4 27 13.93 2 2 Netherlands 0.21 17 16 16 24 0 40 16 0.4 0.4 Luxembourg 46 16 16 62 16.12 78 32.12 0.4 0.4 Ireland 0.06 5 18 14.4 28 0 46 14.4 0.4 0.4 United-Kingdom
0.11 7 26 12 26 0 52 12 2 0.5
Au stralia 3 52 0 52 0 0 0 New-Zealand 0.05 4 12 6 0 0 12 6 0 0 United-States
12 0 0 0 12 0 0 0
Portugal 0.15 15 17 17 24 0 41 17 1 1 Italy 20 21 16.8 36 3.6 57 20.4 0 0 Spain 15 16 16 156 0 172 16 0.4 0.4 Greece 8 17 17 28 0 45 17 0.4 0.4 Poland 30 16 16 156 22.7 172 38.7 2 2 Czech Republic 59 28 19.32 156 15.6 184 34.92 0 0

Slovakia 60 28 15.4 156 37.44 184 52.84 0 0 Hungary 89 24 16.8 156 53 180 69.8 1 1
Sources: OECD Family data basis http://www.oecd.org/document/4/0,2340,en_2649_34819_37836996_1_1_1_1,00.html;
Table 6: Benefits and Transfers (private and public) Pays Benefits and
tax advantages to families (% GDP)1
Frequency of private transfers in cash given2
Frequency of transfers in time given2 grandchild care2 % of households not giving or receiving any transfers2
% of households with different generations cohabiting3
Denmark 1.51 27.4 47.9 53.3 30 2 Sweden 1.78 34.5 41.6 45.4 31.3 1.6 Finland 1.65 5.1 Norway 1.94 Iceland 2.57 France 2.28 24 32.6 48.6 40.6 4.4 Autria 2.37 27.2 24.9 41.5 43.9 15.7 Germany 2.09 33.5 32.8 40 33.4 6.8 Belgium 2.4 2.7 Netherlands 1.09 23.3 40.9 54.3 35.5 0.8 Luxembourg 3.5 8 Ireland 1.48 12.6 United-Kingdom 2 6.5 Australia 2.44 New-Zealand 2.09 United-States 0.79 Portugal 0.85 22.5 Italy 0.64 23.8 23 41.4 50.4 11.3 Spain 0.3 10.6 14.2 38.3 65.9 19.1 Greece 0.75 35.1 19.4 43 37 12.7 Poland 1

Czech Republic 2.07 Slovakia 1.83 Hungary 2.05
Sources: 1. Adema and Ladaique (2005) : « Net Social Expenditures – 3rd edition », Social, Employment and Migration Working Papers, OECD, Paris. 2 SHARE Survey from Attias-Donfut, Ogg, Wolff (2005), European patterns of intergenerational financial and time transfers, European Journal of Ageing, 2(3), pp. 161-173. 3. European Community Household Panel. Cohu, Lequet-Slama, Lelièvre, Thévenon 2005, Les politiques en faveur de la famille : de nouveaux enjeux pour les pays d’Europe du Sud, Etudes et Résultats, 449.

The information reported by these four axes can now be related to our initial classification. The relatively specific position of Nordic countries (Denmark, Sweden, Iceland, Norway Finland) and France appears now more clearly related to their relatively high provision towards child-related leaves and support in childcare provision for children under 6 years, as opposed mainly to Anglo-Saxon and Southern European countries. Thus they cumulate a high spending on leave and childcare provision per child and relatively large frequentation of childcare services by children under 3 years of age. However, their situation is not perfectly homogeneous. Denmark, Sweden and Norway show the longer period of fully compensated period of leave (around 1 year), while this period is significantly shorter in Iceland with only 20.8 weeks of full-time equivalent period of leave. However, the frequentation of childcare services by children under 3 is sensitively higher in Iceland, as it is in Denmark. The spending in childcare per child is a bit lower in Iceland, while the cost paid by parents living in couples is a bit higher as it is in Norway. Sweden and Denmark show also relatively important private transfers in time and grandchild care, while the information is not available for Iceland. Thus Denmark shows a quite specific figure with the highest combined support in terms of leave entitlements, and childcare support provided by both services and private intergenerational transfers5.
Finland and France are clearly distinct with a much longer total period of leave, available through the benefit of home care allowance over a period of 3 years. Nevertheless, the frequentation of childcare services is much higher than in most other continental countries – that concern especially for children under 3 in Finland and preschool children in France.
By contrast, a limited period of full-time compensated leave in observed in Anglo-Saxon countries, but also in Greece, Portugal, Italy, Belgium and the Netherlands. This situation is combined with quite medium enrolment of children in childcare and education services, and a clear emphasis on the access to preschool services from the age of 3 and onwards6. This emphasis can also be observed through the amount of spending per preschool children which are very higher than the spending in childcare services.
In other countries, the period of fully compensated leave is very limited but parents have the opportunity to leave employment for a long period (around 3 years) with no or a low rate of compensation. Nevertheless, their situations related to childcare and income support differ. Spain is characterised by a relatively high participation of children under age 3 in childcare services, but quite very low income support provided by either the State or the Family. Conversely, the frequentation of childcare services under 3 years of age is very low in Germany, Austria and Eastern countries, while income support received through public redistribution is relatively high (except in Poland).
5 Indeed, Denmark differs according with the three group of family policy variables when looking at the representation reported by the two first factors (cf figure A Annex). Spain, Sweden and the Netherlands are also distinct mostly with regards to the benefits and transfers, because all benefits and transfers (public and private) are very low in Spain, and private transfers in time rather important in the Netherlands. By contrast, countries which are best represented by the structure associated with these factors are Poland, Greece, the Czech Republic, France, Portugal and the United-States for the factor 1, and Iceland, Luxembourg and Austria for the second factor. 6 However the participation rates in childcare services of children under 3 is very lower in Italy (6.3%) but follows the same progression when children reach the age of preschool enrolment.

III. Patterns of family policies, fertility, poverty and gender inequalities in the labour market
We turn now to the analysis of the relationships between family policies and the three broad areas they are expected to impact, i.e. fertility, poverty and child well-being and gender inequalities in the labour market. We first examine the relationships between the factors derived from the factorial analysis and these three groups of illustrative variables in order to select the more important variables and to identify the potential correlations between fertility, poverty and employment.
Figure 4 shows the correlations between these variables and the factors derived from the analysis of family policies. The first axis shows clear correlation on the right hand side with poverty (as measured for children or for households with or without children) and gender differences in the labour market (in terms of employment rates and wage gap in the private sector). Conversely, the left hand side is rather correlated with the decline of fertility rates since the 70s, female employment rate, but also with differences between men and women in the labour market which concern regional disparities, wage gap in public sector and the degree of professional segregation.
Figure 4: Illustrative variables correlated with factors 1 and 2.
A closer look to the relations between poverty and female employment shows significant and positive correlation between the difference in employment rates between men and women and poverty within household with children and among children (Figures 5). Moreover, child poverty appears to be positively related to the differences between men and women in full-time equivalent employment rates.

Figures 5: Poverty rates and gender differences in employment rates
CZ
POL
GR
SP
IT
PO
US
NZAUS
UK
IR
LU
NLBE
GEAUFR
NZFISW
DK
0
5
10
15
20
25
30
35
0 2 4 6 8 10 12 14 16 18 20
Poverty rates in households with children
Diff
men
-wom
en in
em
ploy
men
t rat
es (2
5-54
ye
ars
old)
Correlation coefficient: 0.47
CZ
POL
GRIT
PO
UK
IR
NL
GEAU
FR
FI
SW
DK
0
5
10
15
20
25
30
35
0 2 4 6 8 10 12 14 16 18
Child poverty rates
Diff
men
-wom
in fu
ll-tim
e eq
em
pl ra
tes
Correlation coefficient: 0.57
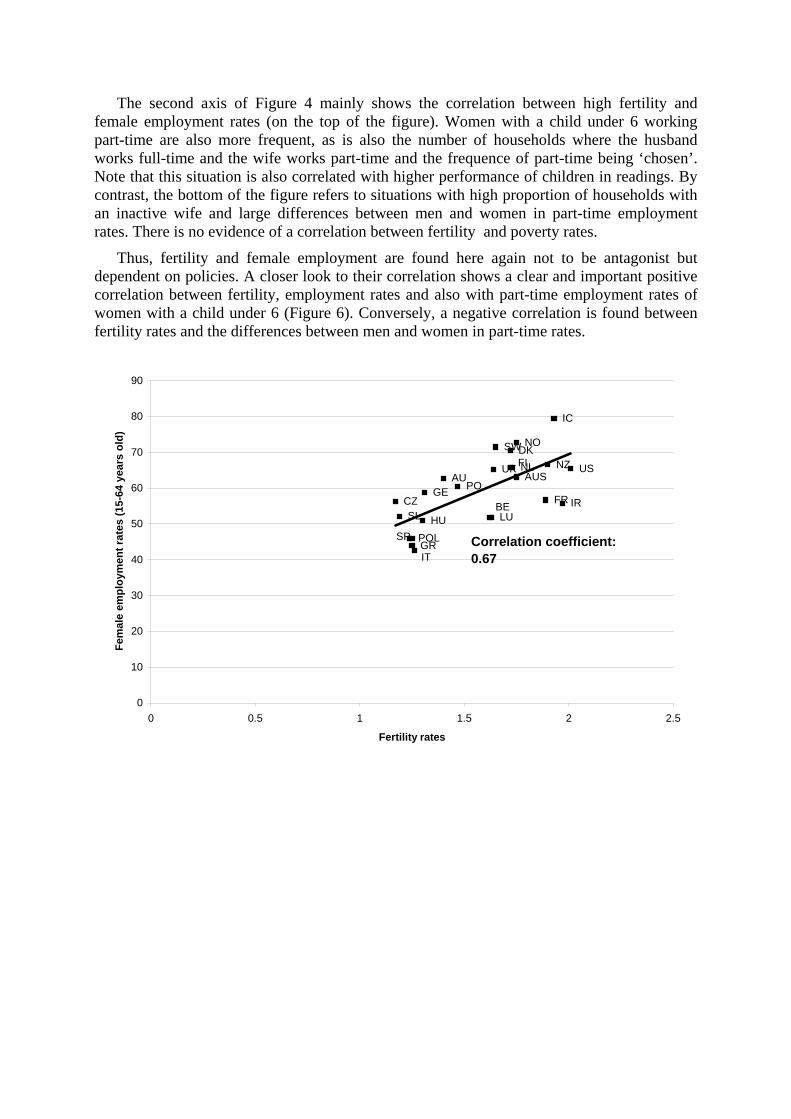
The second axis of Figure 4 mainly shows the correlation between high fertility and female employment rates (on the top of the figure). Women with a child under 6 working part-time are also more frequent, as is also the number of households where the husband works full-time and the wife works part-time and the frequence of part-time being ‘chosen’. Note that this situation is also correlated with higher performance of children in readings. By contrast, the bottom of the figure refers to situations with high proportion of households with an inactive wife and large differences between men and women in part-time employment rates. There is no evidence of a correlation between fertility and poverty rates.
Thus, fertility and female employment are found here again not to be antagonist but dependent on policies. A closer look to their correlation shows a clear and important positive correlation between fertility, employment rates and also with part-time employment rates of women with a child under 6 (Figure 6). Conversely, a negative correlation is found between fertility rates and the differences between men and women in part-time rates.
HUSLCZ
POLGR
SP
IT
POUSNZ
AUSUK
IRLU
NL
BEGE
AU
FR
IC
NO
FISWDK
0
10
20
30
40
50
60
70
80
90
0 0.5 1 1.5 2 2
Fertility rates
Fem
ale
empl
oym
ent r
ates
(15-
64 y
ears
old
)
Correlation coefficient: 0.67
.5

DK
SW
FI
FR
AU
GE
BE
NL
LU
IR
UK
AUS
NZ
US
PO
IT
SPGR
CZSL
HU
0
10
20
30
40
50
60
70
80
90
0 0.5 1 1.5 2 2
Fertility rates
Part
-tim
e em
ploy
men
t for
wom
en w
ith a
chi
ld u
nder
6
Correlation coefficient: 0.43
.5
DKSW
FI
NO
ICFR
AUGE
BE
NL
LU
IR
UK
AUS NZ
USPOIT
SPGR
POLCZ
SL HU
-60
-50
-40
-30
-20
-10
00 0.5 1 1.5 2 2
Fertility rates
Diff
men
-wom
en in
par
t-tim
e w
ork
(15-
64 y
ears
)
Correlation coefficient: -0.43
.5

Table 8: Poverty rates and child development. Poverty
rates in households with children1
Poverty in sole parents households1
Children poverty1
Child performance in readings2
Denmark 2.1 7.2 2.4 492Sweden 3.2 9.3 3.6 514Finland 3.3 10.5 3.4 543Norway 2.9 9.9 3.6 500Iceland 492France 6.7 26.6 7.3 496Austria 11.5 30 13.3 491Germany 10.4 31.4 12.8 491Belgium 3.5 507Netherlands 7.6 30.3 9 513Luxembourg 6 479Ireland 13 16 515United-Kingdom 13.6 40.7 16.2 495Australia 10.2 38.4 11.6 525New-Zealand 13.6 47.5 16.3 522United-States 18.4 48.9 21.7 495Portugal 13.1 32.5 15.6 478Italy 14.3 24.9 15.7 476Spain 11.5 481Greece 11.1 19.8 12.4 472Poland 11 34.7 14.5 497Czech Republic 5.6 23.2 7.2 489Slovakia 469Hungary 482
Sources: 1. OECD Society at glance (2005); 2 PISA database ; Clearinghouse on development in child.

Table 9: Fertility trends Period
fertility rate1Decrease in PFR since the 70s1
Age at first birth1
Definitive childlessness
% of women with at least 3 children (40-44 years)3
Denmark 1.72 -0.23 27.7 12.9 Sweden 1.65 -0.27 27.9 14.4 29.6 Finland 1.72 -0.11 27.4 21.8 29.4 Norway 1.75 -1.38 26.9 13.2 28.8 Iceland 1.93 -0.88 25.5 France 1.89 -0.58 27.9 10.2 36.7 Austria 1.4 -0.89 26.3 23.2 27.3 Germany 1.31 -0.72 28.2 20.3 Belgium 1.62 -0.63 15.2 Netherlands 1.73 -0.84 28.6 18.5 Luxembourg 1.63 -0.35 28.4 20.6 Ireland 1.97 -1.96 27.8 20.3 27.3 United-Kingdom 1.64 -0.79 29.1 20.9 Australia 1.75 -1.12 26.8 46 New-Zealand 1.9 -1.38 30.1 United-States 2.01 na 24.9 14.6 29.6 Portugal 1.47 -1.36 26.5 9.9 26.9 Italy 1.26 -1.16 27.99 20.1 22.5 Spain 1.25 -1.65 29.1 21.9 28.3 Greece 1.25 -1.14 26.6 26.8 Poland 1.24 -0.96 24.5 23.2 33.1 Czech Republic 1.17 -0.74 24.9 16.8 24.2 Slovakia 1.19 -1.22 24.2 20.4 Hungary 1.3 -0.67 25.1 19.6 19
Sources: 1. OECD Society at glance (2005); 2. Sardon J.P. (2006), « Evolution démographique récente dans les pays développés », Population, vol. 61, pp. 225-300. 3. World fertility survey

Table 10: Gender differences in the labour market Female
employment rates1
% of part-time work for women with children under 61
Difference M-F in employment rates (15-64 years old) 1
Proportion of unemployed couples
Diff M-F duree in weekly hours1
Diff M-F tin part-time rates (15-64 years) 1
Diff M-F taux in employment rates 15-24 ans (2005) 1
Diff H-F in employment rates 25-54 ans1
Diff in employment rates 55-59 ans1
Diff H-F age at retirement2
Denmark 70.5 5 9.1 2.4 -21 3.4 7.7 15.1 1Sweden 71.5 41 2.7 0.1 -23.5 -1.5 5.3 4.2 0.7Finland 65.7 8 4.2 1.6 -9 -0.2 5.4 1.1 -0.6Norway 72.7 6 5.9 -32.7 7.2 6.2 10.5Iceland 79.5 6.8 13.5 -21 -2.4 8.8 10.2France 56.7 23 12.2 6.6 2 -24.4 7.6 14.1 7.7 -1Austria 62.8 40 13 3.5 2.1 -32.2 7.4 13.1 19.6 1.2Germany 58.8 46 10.8 5.9 1.3 -30.7 3.5 12.7 17.7 0.3Belgium 51.8 35 15.5 4.8 2.2 -32.7 4.5 15.7 18.1 -0.5Netherlands 65.8 79 15.1 3.5 0.9 -52 0.6 14.8 23.1 0Luxembourg 51.9 32 21.2 2.4 0.4 -27.8 7.1 24.4 16Ireland 55.8 39 19.2 10.9 3.1 -24.2 5.6 21.1 30.7 1.1United-Kingdom 65.3 58 12.8 7 4 -34.1 2.8 13 18.1 1.5Australia 63.1 67 14.5 10.6 -24.7 1.5 17.4 20.8New-Zealand 66.5 54 14.3 10.8 -24.7 6.8 16.7 18.3United-States 65.4 29 11.2 2.6 4.6 -10.7 3.3 14.5 11.7Portugal 60.6 6 13.5 1.9 -9.7 9.1 11.8 16.6 -1.9Italy 42.7 29 26.9 6.3 3.7 -14.1 9.6 28.7 24.4 -0.1Spain 46 17 27.2 5.8 2 -14.2 10.7 25.4 34.3 -1.4Greece 43.9 16 28.6 3.4 2 -14.1 10.3 31 32.4 1.5Poland 46 10.5 8.2 3.4 -5 5.8 13 15 4.2Czech Republic 56.3 6 16.8 1.6 -6.2 7.9 15.8 27.8 2.4Slovakia 52.2 2 11.1 1.1 -2.5 5 12.2 31.2 3.3Hungary 50.9 8 12.6 1.2 -3.4 5.2 13.1 13.4 -0.4

Diff in
employment rates men with/without children1
Diff in employment rates women with/without children1
Gender wage gap in the private sector2
Gender wage gap in the pubic sector2
Gender wage gap (all sectors) 2
Occupational segregation2
Sectorial segregation
% of women working in the public sector
Diff M-W in long term unemployment1
Diff M-W in domestic work (weekly hours)3
Denmark -8.3 1.6 16 13 15 26.9 18.7 -0.1 Sweden 16 18 18 27.4 21.6 47.7 0.2 -73 Finland -13.1 15.7 16 22 17 28.9 22.2 70.5 0.5 -100 Norway 43 -85 Iceland France -11 10.2 14 26.3 17.6 56.1 -0.9 -128 Austria -5.2 14.4 24 11 20 26 18.3 37.2 -0.2 Germany -9 26.5 25 18 21 26.5 18.2 50.3 -0.7 -110 Belgium -10.7 2.1 14 9 12 26.2 18.1 -1.2 -114 Netherlands -6.6 9.4 24 19 19 26.2 17.5 36.9 0 Luxembourg -11.8 7 16 26.4 17.4 46.8 0 Ireland -6.1 18.2 19 17 17 27.2 22.4 53.5 1.1 United-Kingdom -6 21.2 27 14 21 25.9 18.5 0.6 -117 Australia 51.4 United-States 56.3 Portugal -12 -3.8 30 -11 10 25.9 20.5 59.4 -1 Italy -13.3 6.8 16 1 6 23.9 17.9 50.1 -2.3 Spain -11.6 7.5 25 4 17 26.6 20.4 -2 Greece -13.9 3.5 26 8 18 22.5 15.9 49.8 -6.3 Poland -14.6 11.1 25.5 19 -2.1 Czech Republic -9.1 39.2 19 28.4 19.1 -1.9 Slovakia -6.4 34.5 23 29.5 22.4 -1 -138 Hungary -8.7 35.3 20 28.4 19.8 74.5 0 -138 Sources: 1. OECD Employment data base and Employment outlook 2002 Chapter 4 ; 2. Compendium 2006: Indicators for monitoring the employment guidelines, European Commission ; Eurostat – Time use survey.

Let us now comment the relationships between family policy variables and the set of previously identified ‘outcomes’. In order to do that, Figure 7 shows the correlations between family policy variables and the selected set of variables that have just been identified as mainly correlated to the factors of the data analysis. Thus, we show evidence only on a limited number of associations.
A first evidence is that poverty rates appear mainly to covariate with the cost of childcare, and this appears to be especially the case for sole parents since (Figure 7). By contrast, these rates are highly negatively correlated with the spending on child-related leaves, the equivalent period of fully compensated leave, and with the spending per child under 3 enrolled in childcare services. Thus, both the compensation received during the period of leave and childcare policy seem to to clearly limit the extent of poverty of families, including children poverty. Note that income support to families through the tax and benefit systems is rather weakly correlated with poverty rates.
Figure 7: Poverty and family policy variables
Fertility rates appear to be mainly correlated with the importance of female part-time work and with private transfers in time, including the time received by children from their grand parents. They are also higher in context of high frequentation of childcare services, provided either by the public sector or by firms. Note that such a context seems to correlated to the probability to have a third child, but also with a higher proportion of childless women. By contrast, fertility rates appear to be inversely related to parental leave characteristics. Thus, fertility rates seem to be firstly sensitive to the availaibility of part-time work and possibility to make private arrangement on childcare within the family or within the firm.

Figure 8: Fertility and family policy variables
Turning now to some evidence on labour market situation we observe that female labour market participation is mostly correlated with the coverage of childcare services for children under 3 is higher. Female employment seems also significantly higher where the transfers in time within the family and especially those of adults who care for their grandchildren. However, this high rates are related to the diffusion of part-time work since both the rate of part-time for women living with a child under 6 and the proportion of households with a second earner working part-time are correlated. By contrast, the proportion of couples with two full-time earners is more frequent when the period of uncompensated parental leave is extended. By contrast, an increase in the net childcare cost for parents seems to increase the gender difference in full-time equivalent rates, and to increase the probability of part-time work for women with a young child.

Figure 9: Labour market situation and family policy variables
Occupational segregation covariates with female employment rates in European countries, but the correlation is relatively weak (Figure 9). In particular, segregation is not weaker in Nordic countries, although female employment rates are higher. Moreover, segregation is also higher when women with children have significantly lower employment rate than childless women. Looking at its correlation with family policy variables, we see that the degree of segregation is higher in many contexts where the period of fully compensated leave is larger than the average. This certainly illustrates the relative inefficiency of leave policies to limit the consequences of long leave period on careers development. Note, however, that we have no evidence of a correlation between leave period and the gender wage gaps in private sector. By contrast, segregation does not increase child care costs. Nevertheless, lower childcare cost may influence positively female labour participation, but with a consequence of an increase of gender occupational segregation. Finally, the gender wage gap in the private sector (only) appears to be diametrically opposed to the frequentation of childcare and preschool services. Thus, it suggests that childcare services provide efficient support to female labour market participation and to limit the gender wage gap.

IV. Conclusions
Family policies have to deal with many objectives including support to fertility, the reduction of poverty, income support to families, children well-being and the reduction of gender inequalities in the labour market. All these issues are captured through a large set of indicators figuring the relative position of countries with regards to the development of family policies and their related ‘outcomes’ on these issues. In order to deal with this large set, we have implemented a factorial analysis and a cluster procedure to identify patterns of family policies and their relationships with their different objectives. Such an analysis is aimed to select, among this large set, the variables which at the most discriminate countries situations. It also aims to identify the family policy variables, and potentially cluster of variables, which are most closely related to specific ‘outcomes’ in terms of fertility, poverty and gender inequalities in the labour market.
A first result is that countries are mostly contrasted according to the development childcare provision and child-related leave entitlements. With respect to this, the Nordic European countries with France show a relatively distinct position with the addition of high provision towards child-related leaves and childcare support for children under 6 years of age, as opposed mainly to Anglo-Saxon and Southern European countries. This finding is clearly not new, but as we used the most recent data, it shows that differences are still maintained despite the accelerating development of family-friendly policies in several OECD countries (see especially OECD Babies and Bosses reports).
However, our cluster analysis further establishes that the groups of countries are far from homogeneous. In particular, Finland and France are distinct from other Nordic countries with a much longer total period of available leave for mothers with a child under 3 years of age, related to lower enrolment of these children in childcare services – enrolment which remains higher than in most other continental, southern or eastern European countries. It also shows that Spain differ from other south European countries with higher coverage of childcare services for children under 3 and relatively short equivalent period of fully compensated leave. Belgium and the Netherlands are also found to be closer to Anglo-Saxon countries with a relatively short period of compensated leave and emphasis of childcare policy on preschool children (as regarding to the public spending per child and the frequentation of services).
Concerning the ‘outcomes’ dimensions, we first have found that the family policy variations are mostly related to differences in poverty, fertility rates and gender differences in employment rates, wage gap in the private sector and occupational segregation. Poverty and female employment rates appear clearly associated.
Poverty rates are primarily correlated with the cost of childcare and negatively related to the period of compensated leave and to the spending per child in childcare services. Thus, both the compensation received during parental leave and childcare policy seem to limit the extent of poverty, including children poverty.
Fertility appears to be mainly supported by the development of part-time work and care arrangement provided by grandparents. Female employment rates increases in the same direction than the frequentation of childcare services by children under 3 years of age, and as expected, conversely to childcare costs. Women’s participation in the labour market also benefits from the support in care activities received by grandparents. Nevertheless, the development of female employment rates is also clearly associated with the increase of the proportion of women with young children working part-time. Thus, part-time appears to support favourably the combination of both higher female employment and fertility rates.

However, occupational segregation increases with the extension of part-time work. Only a reduction of childcare cost to enlarge the set of occupation may be able to reduce such a segregation and to reduce the associated wage gap.
References
Attias-Donfut, Ogg J. and Wolf F.-Ch. (2005) “European patterns of intergenerational financial and time transfers”, European Journal of Ageing, 2(3), pp. 161-173. 3.
D’Addio-Dervaux A., Mira d’Ercole M. (2005), « Trends and Determinants of Fertility Rates in OECD Countries : the Role of Policies », Social, Employment and Migration Working Papers, 27, OECD, Paris. De Hénau J., Meulders D., O’Dorchai S. (2006), « The Childcare Triad ? Indicators assessing threeFields of Child Policies for Working Mothers in the EU-15 », Journal of Comparative Policy Analysis, 8(2), pp. 129-148, June.
Engelhardt H., Kögel T., Prskawetz A. (2001), “Fertility and female employment reconsidered: a macro-level time series analysis”, Max Planck Institute for Demographic Research.
Escofier B., Pagès J. (1988), Analyses factorielles simples et multiples : objectifs, méthodes et interprétation, Dunod.
Gauthier A.H. (2002), “Les politiques familiales dans les pays industrialisés: y a-t-il convergence?”, Population, 57(3), pp. 457-484.
Gornick J., Meyers M. (2006), “Welfare Regimes in Relation to Paid Work and Care. A View from the United States on Social Protection in the European Countries”, Revue Française des Affaires Sociales, Paris.
Gornick J., Meyers M., Ross K. (1997), « Supporting the employment of mothers: policy variation across fourteen welfare states », Journal of European Social Policy, 7(1), p. 45-70.
OECD (2002), “Les femmes au travail: qui sont-elles et quelle est leur situation?”, Chapitre 2, Employment Outlook, OCDE, Paris.
Thévenon O. (2006), « Régimes d’Etat Social et convention familiale : une analyse des régulations emploi-famille », Economies et Sociétés, série ‘socio-économie’ du travail, 27, 6, pp.1137-1171.
Thevenon O. (2004), « Les enjeux pour l’emploi féminin de la Stratégie Européenne pour l’Emploi », Revue de l’OFCE, 90, juillet, pp. 379-417.