output cost of gender discrimination in the korean labour
TRANSCRIPT

1
Output Cost of Gender Discrimination in the Korean Labour Market*
Hanol Lee#
Korea University
Latest update: May 2017
Abstract
This study constructs and calibrates a macroeconomic model that explains Korea’s glass ceiling and examines the output cost of gender discrimination. The model is based on the span-of-control framework in Lucas (1978). The model assumes that the source of the glass ceiling is that women are unable to accumulate as much managerial skill as men. According to the simulation results of a one-sector model, without the glass ceiling, the share of female managers increases, aggregate output increases by 7.2%, and the output gain by removing the glass ceiling is monotonic. However, the output gain by removing the glass ceiling in a two-sector model is non-monotonic because wages increase rapidly owing to high labour demand and the number of workers increase beyond at a certain level, as per given parameters. The additional simulation results suggest that the effects of the policies in removing the glass ceiling on output will become monotonic if the government introduces policies to reallocate female employment from the service sector to the manufacturing sector.
Keywords: Gender discrimination; glass ceiling; managerial skill; aggregate output; span of control. JEL classification: E2, J24, J71.
* The author would like to thank Jong-Wha Lee, Jinyoung Kim, Kwanho Shin, Myoung-jae Lee, and Dainn Wie for their helpful comments. This research was supported by the Korea University Graduate School Junior Fellow Research Grant. # Economics Department, Korea University, 145 Anam-ro, Seongbuk-gu, Seoul 02841 Korea. E-mail: [email protected]

2
I. Introduction Over the past few decades, Korea has achieved remarkable economic growth, narrowed the
gender gap in education, and improved gender equality. However, gender equality remains an important issue in Korea. As of 2015, the labour force participation rate for women is 51.8%, which is 22 percentage points lower than that of men and below the OECD average of 60%. According to the economically active population survey by Statistics Korea (2015), the gender wage gap is at 62.8%.
The glass ceiling is an important form of discrimination in the Korean labour market; however, it receives less focus in the literature. The glass ceiling is rampant in the Korean labour market and is a barrier for women in achieving higher positions and career management. The Federal Glass Ceiling Commission (1995) in the United States categorises these barriers as follows: (1) societal barriers that may be outside of the workplace, (2) internal structural barriers within the workplace, and (3) governmental barriers. In the Korean context, the barriers in the first and second category are the priority. Women in their 20s and 30s feel burdened by the work and family balance and find it difficult to manage their careers. Poor career development and competitiveness also become barriers in promotion and maintaining position for women in their 40s and older (Kang 2013).1 Despite the increase in numbers of highly educated women in the labour market, the trend is to exclude women from important positions and place them in specific occupations in lower-level positions (Kim et al. 2013). The glass ceiling lowers the career goals of women and hinders ambitions for promotion above certain levels (Kim 2013). The Federal Glass Ceiling Commission (1995) defines these discriminations as pipeline barriers, which are a series of glass ceilings in each career level. Figure 1 shows the existence of the glass ceiling in Asian countries. As of 2011, Korea has the strongest glass ceiling structure among major Asian economies. In low-level careers, the proportion of women is similar to that of men; however, this decreases sharply in the middle and higher levels. Therefore, an insufficient number of women receive promotions to middle or higher levels in an organisation.
Figure 1 Glass ceilings in Asian countries (share of females in each position, as percentage)
Source: Süssmuth-Dyckerhoff et al. (2012), Women Matter: An Asian Perspective
1 Although it is a contention that women in their 40s are less educated compared to men and few are likely to climb to senior management positions; therefore, the glass ceiling is not a problem. However, this argument does not hold, as the difference in the average years of schooling between men and women aged 40–49, who actively participate in the labour market, is only 0.8 years.
0
10
20
30
40
50
60
Universitygraduates
Entry-levelprofessionals
Mid-to-seniormanagement
Executivecommittee
CEO Board
Korea Japan China Singapore

3
Figure 1 may be the result of women not remaining in the labour market for the long term. However, it can be explained by the gender discrimination in promotion. Table 1 shows the proportion of promotion by position and gender, indicating that pipeline barriers may exist in the Korean labour market. Both women and men have similar probabilities of promotions at lower levels; however, the probability of promotion for women is lower than that of men at higher levels. This may be due to barriers that prevent women from jobs that are on the fast track to the top or have access to critical developmental assignments (Federal Glass Ceiling Commission 1995).
Table 1 Proportion of promotion by position and gender (percent)
Staff→ Assistant manager
Assistant manager →
Manager
Manager→ Deputy general
manager
Deputy general manager→
General manager
General manager → Executive manager
Men 79 74 71 67 71
Women 75 70 65 54 43 Source: Author’s calculation from the Ministry of Gender Equality and Family (2014), 2014 Korean women manager panel survey
Although not an exclusively Korean problem, the glass ceiling is more serious in Korea. Figure
2 shows the results of a glass-ceiling index created by the Economist (2016) in which Korea ranks last among 29 OECD countries. Indicators such as female labour force participation rate and female share of senior managerial positions and company boards are significantly lower than the OECD average. According to ILO (2016), the share of female managers in Korea is 11%, which ranks 97 out of 108 countries and is much lower than that of the United States, at 43.4%.
Figure 2 The glass ceiling index (2015)
Source: The Economist (2016) Note: The maximum score is 100.
Table 2 shows managers’ share of the labour force by gender and sector and share of female managers by industry. According to Statistics Korea’s (2015) economically active population survey, managers’ share of the labour force is 2.2% and the share of female managers in the economy is 9.0%. While the share of male managers in the male labour force is 3.2%, the share of female managers in the female labour force is 0.5%.
0102030405060708090

4
Table 2 Share of managers in the labour force by gender and sector, and share of female managers by sector (2015, percent)
2015
A. Total
Share of managers in the labour force 2.2
Share of female managers in the female labour force 0.5
Share of male managers in the male labour force 3.2 Share of female managers 9.0
B. Manufacturing
Share of managers in the labour force 2.8 Share of female managers in the female labour force 0.1
Share of male managers in the male labour force 3.6
Share of female managers 0.9
C. Service Share of managers in the labour force 1.9
Share of female managers in the female labour force 0.7
Share of male managers in the male labour force 2.9 Share of female managers 15.4 Source: Author’s calculation from Statistics Korea (2015)’s October 2015 economically active population survey Note: The sample consists of regular workers at firms with more than 10 workers.
The glass ceiling is more serious in the manufacturing sector in comparison to the service sector.
The share of female managers in the service sector is 15.4%; however, this is only 0.9% in the manufacturing sector.2 When comparing the share of female employees in both sectors (44% and 24% in services and manufacturing, respectively), the gap between the two sectors is astounding.
The existing literature does not extensively study the effect of the glass ceiling on aggregate output. Most studies focus on the effect of reduction in gender discrimination in the labour market on aggregate output or income per capita (Cavalcanti and Tavares, 2015; Kim et al., 2016; Ngai and Petrongolo; 2015), and the effect of the glass ceiling on labour market outcomes using microdata (Kim, 2013; Kang, 2013). In a recent study, Cuberes and Teignier (2016) focused on the effect of the glass ceiling on aggregate output. They imposed labour market frictions that prevented females from becoming employers.
This study constructs and calibrates a macroeconomic model that explains Korea’s glass ceiling and examines the output cost of gender discrimination. The model is based on the span-of-control framework in Lucas (1978). In this model, individuals with high managerial skill become managers who earn profits, while others become workers who earn the equilibrium wage. I add three primary sources of gender discrimination in the Korean labour market to his model. First, women have lower labour force participation rates than men. Second, unlike men, women experience a glass ceiling of discrimination in promotions. Third, women receive less wages than men, irrespective of the glass
2 The sixth Korean standard classification of occupations defines ‘managers’ by considering the size of the management category, level of functioning, and the type of function.

5
ceiling, occupation, and position. The model assumes that the source of the glass ceiling is that women are unable to accumulate as much managerial skill as men. If women can accumulate as much managerial skill as men, the share and number of female managers will increase.
As in Lucas (1978) and Cuberes and Teignier (2016), the Pareto cumulative distribution gives the distribution of managerial skill. Klumpp and Su (2013) prove that a glass ceiling exists if the variance of skill distribution among men is higher than among women. If women are unable to accumulate as much managerial skill as men, the variance of skill distribution of men becomes higher than that of women. Using the 2014 Korean women manager panel survey, I test for gender difference in the Pareto cumulative distribution of managerial skill. The result shows that the variance of managerial skill distribution of women is lower than that of men.
In a one-sector model, the aggregate output increases by 7.2% when the glass ceiling disappears. The output gain from the removal of the glass ceiling is monotonic because the number of workers continues to decline and the number of managers continues to increase gradually.
An extended two-sector model shows results that are more accurate, as a one-sector model cannot reflect that the productivity of the manufacturing sector is greater than the service sector, but the glass ceiling is more prevalent in the former than in the latter. In a two-sector model, the aggregate output increases by 5.2% when the glass ceiling disappears. Unlike a one-sector model, the output gain from removing the glass ceiling is non-monotonic because wages increase rapidly owing to high labour demand and the number of workers increase beyond at a certain level as per given parameters. The additional simulation results suggest that policy effects in removing the glass ceiling will become monotonic if the government introduces policies to reallocate female employment from the service sector to the manufacturing sector.
This study contributes to the literature as follows: To my knowledge, no other Korean study quantitatively evaluates the output cost of gender discrimination using this model. This model considers that the glass ceiling is more serious in the manufacturing sector than in the service sector. Further, this study provides important policy implications by demonstrating the effect of various gender policies on actual output using macroeconomic models adapted to the Korean context.
The remainder of this paper is as follows. In Section 2, I review the literature linking gender discrimination, aggregate output, and labour market outcomes. Section 3 includes a macroeconomic model that explains Korea’s glass ceiling and the numerical simulation results. Section 4 presents a two-sector economy and the numerical simulation results. Finally, Section 5 concludes the paper.
II. Literature review
Cavalcanti and Tavares (2015) measure the output cost of gender discrimination. Their study
shows that if the gender wage gap increases, it discourages female labour market participation and decreases output. Further, it increases fertility and population in the steady state and decreases the steady-state output. They use a growth model in which saving, fertility, and labour market participation are endogenous and the model imposes two gender discriminations. First, women have higher productivity in child rearing than men, and second, women earn less than men do despite having the same productivity. The model is calibrated to the US economy. According to the results, a 50% increase in the gender wage gap leads to a 35% decrease in per capita income.
Cuberes and Teignier (2016) evaluate the output cost of gender gap in entrepreneurship and labour force participation. They show that the gender gap in entrepreneurship has a negative effect on income and aggregate productivity. The model based on Lucas (1978)’s span-of-control framework, which is a general equilibrium occupational choice model, assumes that occupation is determined by an individual’s entrepreneurial talent. It considers two genders: female and male, and no gender discrimination except two female labour market frictions. First, a certain fraction of women cannot freely choose their occupation, and second, the labour market expels a certain fraction of women. They too calibrate their model to the US economy. The results show that when women

6
cannot be self-employed or employers, the steady-state output decreases by 11%. Furthermore, when no women can enter the labour market, the steady-state output decreases by 50%.
Ngai and Petrongolo (2015) show that the rise of the service sector reduces gender gaps in hours and wages. The reallocation of labour from the manufacturing sector (structural transformation) and the allocation of time from home sector (marketization) drive the service sector. The model has three sectors (goods, market services, and home services) and rationalises the process of structural transformation and marketization. Only goods and services are purchasable from the market. Goods and services are poor substitutes, while market and home services are good substitutes. Women have a comparative advantage in producing services. The authors calibrate their model to the US economy. The results show that the model explains 50% the rise in women’s market hours and a 20% rise in the gender wage ratio in the past 40 years.
To the best of my knowledge, Kim et al. (2016) is the only study that investigates the impact of gender inequality on long-term economic growth. Most studies focus on the effect of the glass ceiling on labour market outcomes using microdata.
Kim et al. (2016) show that gender equality policies that lower gender discrimination in the labour market and the increasing time that fathers’ spend on child rearing can contribute to a rise in female labour force participation rates and per capita income growth. The idea is that gender equality affects time allocation for work, household production, child rearing, and child education. It also stimulates human capital accumulation; therefore, gender equality affects economic growth. The model introduces two major gender discriminations in Korea. First, men spent less time on child rearing and child education than women did. Second, women earn less than their productivity. Once these gender differences disappear, the female labour participation rate increases from 54.4% to 67.5% and the per capita income growth rate increases from 3.6% to 4.1%.
Kim (2013) empirically investigates the determinants of female career goals using the 2008, 2010, and 2012 Korean women manager panel survey. The results show that most female managers downgrade their career goals over time and do not expect promotion to top positions. Further, it shows that women who graduate from university or earn high wages desire promotions. Tenure is not statistically significant; its interpretation is implicitly recognising the position of promotion within a firm, regardless of how long it may be. Marital status is also not statistically significant because the average age of female managers in the sample is 38 and 72% of women were married. The results can also be due to a sample selection of women who cannot overcome the glass ceiling and retire or leave the sample. One limitation of this study is that the data has only female samples and cannot analyse if these determinants only affect women.
Kang (2013) empirically investigates the determinants of female promotion in organisations using the 2007 and 2012 Korean women manager panel survey. The author assumes that the determinants of female promotion can differ with position because women face different life cycle, company requirements, and labour market circumstances than men. This study estimates a logit model with a dependent variable: female managers promoted over five years. The results show that females under the age of 30 or in junior positions have a high probability of promotion. Marital status is not statistically significant. The years of education are significant for promotion in junior positions, but not for middle-to-high positions. Any policies for job and family balance are also not statistically significant. Females in the financial, retail, and business service sectors have a high probability of promotion compared with those in the manufacturing sector. One limitation of this study is that it cannot avoid sample selection bias, as it analyses only those cases in which women have been promoted for five years. III. A one-sector model
I present a macroeconomic model of gender discrimination in the Korean labour market to
explain Korea’s glass ceiling. The model is based on the span-of-control framework in Lucas (1978),

7
which selects occupations based on the size of individual managerial skill. It calculates the ratio of managers and workers in the labour force and measures the size of enterprises. Cuberes and Teignier (2016) used this model to measure the decline in output resulting from the non-promotion of women as managers. Although a simple model has only one economic sector, I extend this model to include two sectors; namely, manufacturing and service, in a later section.
1. Model setting
The economy has a continuum of women and men in a ratio of 1:1. The characteristics of women and men are as follows. First, women and men attain the same level of education and enter the labour market. Second, women have lower labour force participation rates than men. Third, unlike men, women experience a glass ceiling of discrimination in promotions. Fourth, women receive less than equilibrium wages (𝑤𝑤) irrespective of glass ceiling, occupation, and position. While men receive 𝑤𝑤, women receive ∅𝑤𝑤, where ∅ ∈ (0,1). The last three characteristics are the primary source of gender discrimination in the Korean labour market. This implies that capable women are unable to participate in the labour market, receive lower wages, and do not reach higher positions.
Individuals have managerial skill 𝑧𝑧, drawn from a cumulative distribution that takes vales between B and ∞. Individuals with high managerial skill become managers who earn profits, while others become workers who earn the equilibrium wage. As in Lucas (1978) and Cuberes and Teignier (2016), the Pareto cumulative distribution in Equation (1) gives the distribution of managerial skill as follows:
F(z) = 1 − B𝜏𝜏𝑧𝑧−𝜏𝜏,𝑧𝑧 > 0 – (1), where 𝜏𝜏 is the curvature of distribution.
Females (or males) allocate a λ fraction of time to the labour market and a 1− λ fraction of time to household production. λ is given exogenously. 𝜆𝜆𝑓𝑓 and 𝜆𝜆𝑚𝑚 are same as the labour force participation rates of females and males.
The production function is given by Yi = z �𝐿𝐿𝑓𝑓
𝜉𝜉𝐿𝐿𝑚𝑚1−𝜉𝜉�
𝛾𝛾 - (2),
where 𝜉𝜉 ∈ (0,1) and 𝛾𝛾 ∈ (0,1). 𝑧𝑧 is the managerial skill of the firm’s manager. 𝐿𝐿𝑓𝑓 and 𝐿𝐿𝑚𝑚 are female and male labour inputs of the firm. 𝛾𝛾 is the span-of-control parameter.3
2. Glass ceiling and managerial skill
The model assumes that the source of the glass ceiling is that women are unable to accumulate as much managerial skill as men. The gender difference in managerial skill is not the only cause of the glass ceiling; however, several theoretical and empirical studies support this assumption. First, Klumpp and Su (2013) prove that a glass ceiling exists if the variance of skill distribution among men is higher than among women. If women are unable to accumulate as much managerial skill as men, the variance of skill distribution of men becomes higher than that of women. Second, an unfriendly corporate culture for women can prevent them from expressing their entrepreneurial capabilities. Women also have a limited ability to accumulate managerial skill because they prefer part-time jobs or balance work and family (Cuberes and Teignier 2016). In Korean organisational culture, women are excluded from core jobs or core manpower and set low career goals for themselves owing to the glass ceiling (Kim et al., 2013; Kim, 2013). Therefore, despite the same education, there exists a gender gap in managerial skill among males and females.
There are various ways to measure managerial skill; however, this study assumes that managerial skill is proportional to position. Although men and women work in the same place and
3 The economy has only one manager if the span-of-control parameter is 1. More than one manager exists in a production function with diminishing returns to scale.

8
attain the same level of education, a difference exists in the accumulation of managerial skill, even in the same position. Women experience gender discrimination in promotion due to gender differences in managerial skill and there is a smaller pool of women in high-level positions. This leads to a difference in the shape parameter of the Pareto cumulative distribution in the model.
Pareto cumulative distribution of managerial skill = 1 − �1z�𝜏𝜏 – (3)
I test for gender difference in the Pareto cumulative distribution of managerial skill, using the 2014 Korean women manager panel survey. Equation (3) is the Pareto cumulative distribution of managerial skill to be tested. z is position and 𝛾𝛾 is a curvature of distribution. Figure 3 shows a box plot of cumulative distribution of regular employees by position and gender using information from 228 companies. Comparing Figure 3A and Figure 3B, the curvature of men’s distribution is smaller than that of women’s. The results show that the estimated distribution curvature for men is 1.30 (𝑠𝑠. 𝑒𝑒 = 0.04) and for women is 2.34 (𝑠𝑠. 𝑒𝑒 = 0.10) . Figure 4 is the estimated Pareto cumulative distribution of regular employees by position and gender. It shows that women may have lower managerial skill because many are in lower positions. It also shows that the variance of managerial skill distribution of women is lower than that of men.
Figure 3 Box plot of cumulative distribution of regular employees by position and gender (percent)
A. Men
A. Women
Source: Author’s calculation from the Ministry of Gender Equality and Family (2014), 2014 Korean women manager panel survey
Figure 4 Estimated cumulative distribution of regular employees by position and gender
00.10.20.30.40.50.60.70.80.9
1
Staff Assistant Manager Deputygeneralmanager
Generalmanager
Executivemanager
Men Women

9
For easier calculation, the model fixes the curvature of distribution (𝛾𝛾) and assumes that the minimum value of support for female distribution (𝐵𝐵f) is smaller than that of male distribution (𝐵𝐵𝑚𝑚). Although, managerial skill can dynamically accumulate over time, the model assumes that it is randomly given owing to the limitations of the static model.
3. Individual’s optimization A. Manager
Managers hire both female and male labour inputs to maximise profits. The optimal numbers of female and male labour inputs are increasing functions of the managerial skill z, as equations (4) and (5) show:
Lf(z) = 𝜉𝜉𝛾𝛾𝑤𝑤�Az � 𝜉𝜉𝛾𝛾
𝜙𝜙𝑤𝑤�𝜉𝜉𝛾𝛾�(1−𝜉𝜉)𝛾𝛾
𝑤𝑤�
(1−𝜉𝜉)𝛾𝛾�
11−𝛾𝛾
- (4)
Lm(z) = (1−𝜉𝜉)𝛾𝛾𝑤𝑤
�Az� 𝜉𝜉𝛾𝛾𝜙𝜙𝑤𝑤�𝜉𝜉𝛾𝛾�(1−𝜉𝜉)𝛾𝛾
𝑤𝑤�
(1−𝜉𝜉)𝛾𝛾�
11−𝛾𝛾
- (5)
B. Worker Figure 5 Occupational choice
Figure 5 shows an individual’s occupational choice under managerial skill z. The profit Π(z) is an increasing function of z. �̂�𝑧 is the managerial skill cutoff for the occupational choice. If an individual’s managerial skill is less than the cutoff, the individual chooses to become a worker, if it is more the individual chooses to become a manager. 𝑧𝑧𝑓𝑓� and 𝑧𝑧𝑚𝑚� are cutoffs for female and male managerial skill. All other things being equal, the male managerial cutoff is larger than the female cutoff owing to the gender wage gap ∅.
If women can accumulate as much managerial skill as men, it does not change the managerial skill cutoff z�; however, Γ(z�) decreases. Therefore, the share and number of female managers increase. 4. Competitive equilibrium
In equilibrium, the labour market must be clear. The equilibrium wage 𝑤𝑤∗ is the market-clearing wage and Equation (8) is the labour market clearing condition. The left-hand side of Equation (8) is the labour supply, while the right-hand side is the labour demand. The first term on the left-hand side is the labour supply of females and the second term is the labour supply of males. The first brace on the right-hand side is the labour demand of female managers and second brace is that of male managers.

10
𝜆𝜆𝑓𝑓F�𝑧𝑧𝑓𝑓1∗� �+ 𝜆𝜆𝑚𝑚F�𝑧𝑧𝑚𝑚1∗� � = �𝜆𝜆𝑓𝑓 ∫ 𝐿𝐿𝑓𝑓(𝑧𝑧,𝑤𝑤∗)f(𝑧𝑧)𝑑𝑑z∞
𝑧𝑧𝑓𝑓∗� + λ𝑚𝑚 ∫ 𝐿𝐿𝑓𝑓(𝑧𝑧,𝑤𝑤∗)f(𝑧𝑧)𝑑𝑑z∞
𝑧𝑧𝑓𝑓∗� �+
�𝜆𝜆𝑓𝑓 ∫ 𝐿𝐿𝑓𝑓(𝑧𝑧,𝑤𝑤∗)f(𝑧𝑧)𝑑𝑑z∞𝑧𝑧𝑚𝑚∗�
+ λ𝑚𝑚 ∫ 𝐿𝐿𝑓𝑓(𝑧𝑧,𝑤𝑤∗)f(𝑧𝑧)𝑑𝑑z∞𝑧𝑧𝑚𝑚∗�
� - (8) A competitive equilibrium is {Lf(z), Lm(z), 𝑧𝑧𝑓𝑓� , 𝑧𝑧𝑚𝑚� , w∗} such that the individual’s occupational
choice is resolved and the labour market is clear. 5. Numerical results of the one-sector model
A. Calibration and results Table 3 shows the parameter values used in the benchmark model simulation. Most parameters
are from the economically active population survey of Statistics Korea (2015). Span-of-control parameter (𝛾𝛾) and the parameters of Pareto cumulative distribution are matched to managers share of the labour force by gender and share of female managers in 2015. 𝜉𝜉 is the female income share in 2015. λf and λm are female and male labour force participation rates in 2015. The gender wage gap (𝜙𝜙) is the value controlling for occupation and position, using the results of Statistics Korea (2015) and Kim (2009).
Table 3 Parameter values
Parameter Value Data or Targets
Span-of-control parameter (𝜸𝜸) 0.83 Match to Statistics Korea (2015)
Female income share (𝝃𝝃) 0.39 Statistics Korea (2015)
Gender wage gap (𝝓𝝓) 0.88 Statistics Korea (2015) and Kim (2009)
Female and male labour force participation rates (𝛌𝛌𝐟𝐟, 𝛌𝛌𝐦𝐦) 0.52, 0.74 Statistics Korea (2015)
Curvature of Pareto cumulative distribution (𝝉𝝉) 6.9 Match to Statistics Korea (2015)
Minimum value of support of Pareto cumulative distribution (𝐁𝐁𝐟𝐟,𝐁𝐁𝐦𝐦) 1, 1.36 Match to Statistics Korea
(2015)
Table 4 Calibration results (percent)
Target (2015) Benchmark estimates
Managers share in the labour force 2.2 2.4
Share of female managers in the female labour force 0.5 0.5 Share of male managers in the male labour force 3.2 3.7
Share of female managers 9.0 8.8 Source: Author’s calculation from Statistics Korea’s (2015) October 2015 economically active population survey; author’s calculation from the model
Table 4 shows benchmark estimates and target values in 2015. The target values are from the
economically active population survey by Statistics Korea (2015). Benchmark estimates are similar to the target. The model implies that the share of managers in the labour market is 2.4% and the share of female managers is 8.8%. While the share of male managers in the male labour force is 3.7%, the share of female managers in the female labour force is 0.5%.
B. Simulation results

11
Table 5 Simulation results (percent)
(1) Benchmark estimates
(2) No glass ceiling
(𝑩𝑩𝒇𝒇→ 𝑩𝑩𝒎𝒎)
(3) No labour
force participation
rate gap (𝛌𝛌𝐟𝐟 → 𝛌𝛌𝐦𝐦)
(4) No labour
force participation rate gap and glass ceiling (𝛌𝛌𝐟𝐟 → 𝛌𝛌𝐦𝐦, 𝑩𝑩𝒇𝒇 → 𝑩𝑩𝒎𝒎)
Managers share in the labour force 2.4 2.5 2.7 2.9
Share of female managers in the female labour force 0.5 2.7 0.6 2.6
Share of male managers in the male labour force 3.7 2.3 4.1 2.3
Share of female managers 8.8 44.9 12.1 53.7
Aggregate output 100.0 107.2 113.1 123.2 Notes: The figures in red (blue) letters indicate that the values of the variables increase (decrease) with the shocks.
Table 5 reports the simulation results if gender discrimination disappears.4 Column (1) shows
the benchmark estimates. The simulated aggregate output estimates may be underestimated because some parameters including labour force participation rates are exogenous in the model, which excludes the household production and childbearing decisions of women. A disappearance in gender discrimination can affect these parameters.
The aggregate output increases by 7.2% when the glass ceiling disappears in Column (2). As women can accumulate similar managerial skill as men, the number of female managers, and their share in the female labour force increases. Once the labour supply of females reduces due to the increase in female managers, the equilibrium wage, and managerial cutoff for males increase. Subsequently, the number of male managers and their share in the male labour force decreases. Therefore, able women who cannot become managers become managers, while men with less ability who are managers become workers. The increase in female managers offsets the decline in male managers; therefore, the total number of managers and their share in the labour force increases. The share of female managers in all sectors is 44.9%, which is close to 50%.
When the labour force participation rates of women reach that of men (Column (3)), aggregate output increases by 13.1%. As the female labour supply increases due to the increase in female labour force participation rates, the equilibrium wage and managerial cutoff for both genders decrease. The number of female and male managers and workers increase; consequently, all figures in Table 5 increase. Thus, the aggregate output in Column (3) is larger than that in Column (2).
The aggregate output increases by 23.2% when gender wage gaps disappear and labour force participation rates of women reach that of men (Column (4)). The change in figures is similar to that in Column (2) and Column (3).
Figure 6 shows the aggregate output corresponding to the changes in female labour force participation rates (λf) and the minimum value of support of female managerial skill distribution (Bf).
4 I also calculate the simulation result when the gender wage gap disappears. The aggregate output decreases by 0.8%, as female managerial skill cutoff increases and the number of managers decrease. This is possibly an underestimation, as the female labour participation rate must increase when the gender wage gap disappears.

12
In this simulation, I reduce the gender gap in managerial skill and labour force participation rate by 20% until the gender gap disappears. The narrowing gender gap in the labour force participation rate is more effective in increasing aggregate output. The output gain from the removal of the glass ceiling is monotonic because the number of workers continues to decline. In addition, the number of female managers increases dramatically as managerial skill increases. The output of female managers surpasses that of male managers, and output gain grows larger. Figure 6 implies that the more the glass ceiling disappears, the more effective the policy will be.
Figure 6 Effects of narrowing gender gap in managerial skill and labour force participation rate on
aggregate output
Note: The intersection point of the grey dotted line and the x-axis is the benchmark estimate of the aggregate output.
IV. A two-sector model
I extend this model to include two sectors: manufacturing and service. Females in the service
sector have a higher probability of promotion than those in manufacturing (Kang 2013). While the share of female managers in the service sector is 15.4%, it is 0.9% in the manufacturing sector, as seen in Table 2. Although some parameters for a two-sector model are exogenous, it can help in policy-making on gender equality. An empirical study by Lim (2008) shows that companies with a male-centred organisational culture have less participation of women in their management; however, women actively participate in the management of companies with a democratic organisational culture. In the Korean context, male-centric companies are in the manufacturing sector, while democratic companies are in the service sector. Therefore, the effect of policies directed at removing the glass ceiling may differ across sectors. Both industries have glass ceilings in the model.
1. Model setting
In a two-sector model, the fact that women contribute more in producing services than goods is added to the list of characteristics of women and men.
An α fraction of women (or men) become managers in the service sector or workers in both sectors. On the contrary, 1− α fraction of women (or men) become managers in the manufacturing
100
105
110
115
120
125
0.52 0.56 0.61 0.65 0.69 0.74
Agg
rega
te o
utpu
t (10
0=be
nchm
ark)
Female labour force participation rate
Gap=100% Gap=80% Gap=60%
Gap=40% Gap=20% Gap=0%
Remaining gender gap in managerial skill

13
sector or workers in both sectors. αf is larger than αm to take into account the characteristics of the Korean labour market.
A two-sector model assumes that the minimum value of support of distribution for those in the service sector (𝐵𝐵f1) is higher than for those in the manufacturing sector (𝐵𝐵f2) to assess why females in the manufacturing sector have lower probability of promotion than those in the service sector. Similar to a one-sector model, both values are less than the minimum value of support of male’s distribution (𝐵𝐵m).
Equation (9) is the production function for industry i. Industry 1 produces services while Industry 2 produces goods. 𝐴𝐴𝑖𝑖 is the technology of industry i. 𝑧𝑧𝑖𝑖 is the managerial skill of industry i‘s manager. 𝐿𝐿𝑓𝑓𝑖𝑖 and 𝐿𝐿𝑚𝑚𝑖𝑖 are female and male labour inputs of industry i. 𝜉𝜉1 > 𝜉𝜉2 is imposed considering that women produce more services than goods. 𝑝𝑝𝑖𝑖 is the price of outcome of industry i. The price of goods 𝑝𝑝2 is normalized to 1. 𝛾𝛾 is the span-of-control parameter where 𝛾𝛾 ∈ (0,1).
Yi = 𝑝𝑝𝑖𝑖𝐴𝐴𝑖𝑖𝑧𝑧𝑖𝑖 �𝐿𝐿𝑓𝑓𝑖𝑖𝜉𝜉𝑖𝑖 𝐿𝐿𝑚𝑚𝑖𝑖
1−𝜉𝜉𝑖𝑖�𝛾𝛾
, 𝑖𝑖 = 1(service), 2(manufacturing) - (9) A representative household consists of all females and males and consumes their wages and
profits. Equation (10) is the utility function of a representative household. 𝐶𝐶1 and 𝐶𝐶2 are services and goods. 𝜌𝜌 is the services share of total consumption.
𝑈𝑈(𝐶𝐶1,𝐶𝐶2) = ln (C1𝜌𝜌𝐶𝐶2
1−𝜌𝜌) - (10) Equation (11) is the budget constraint of a household. The consumption of services and goods
must be equal to the sum of wages and profits. 𝑝𝑝1 is the price of services. 𝜆𝜆𝑓𝑓 and 𝜆𝜆𝑚𝑚 are a fraction of time to labour market of both females and males. 𝑤𝑤 is the wage and 𝜙𝜙 is the gender wage gap. 𝑧𝑧𝑓𝑓1� , 𝑧𝑧𝑓𝑓2� ,𝑧𝑧𝑚𝑚1� and 𝑧𝑧𝑚𝑚2� are the cutoff values for becoming managers in each sector and for each gender. The left-hand side of Equation (11) is the consumption of services and goods and the right-hand side is the sum of wages and profits. 𝑝𝑝1𝐶𝐶1 + 𝐶𝐶2 = 𝜆𝜆𝑓𝑓𝑤𝑤𝜙𝜙�𝛼𝛼𝑓𝑓𝐹𝐹1�𝑧𝑧𝑓𝑓1� �+ �1 − 𝛼𝛼𝑓𝑓�𝐹𝐹2�𝑧𝑧𝑓𝑓2� ��+ 𝜆𝜆𝑚𝑚𝑤𝑤[𝛼𝛼𝑚𝑚𝐹𝐹1(𝑧𝑧𝑚𝑚1� ) + (1 − 𝛼𝛼𝑚𝑚)𝐹𝐹2(𝑧𝑧𝑚𝑚2� )] +
𝜆𝜆𝑓𝑓𝛼𝛼𝑓𝑓 ∫ 𝜋𝜋1(𝑧𝑧,𝑤𝑤, 𝑝𝑝1)𝑓𝑓1(𝑧𝑧)𝑑𝑑𝑧𝑧∞𝑧𝑧𝑓𝑓1�
+ 𝜆𝜆𝑓𝑓�1− 𝛼𝛼𝑓𝑓� ∫ 𝜋𝜋2(𝑧𝑧,𝑤𝑤)𝑓𝑓2(𝑧𝑧)𝑑𝑑𝑧𝑧∞𝑧𝑧𝑓𝑓2�
+
𝜆𝜆𝑚𝑚𝛼𝛼𝑚𝑚 ∫ 𝜋𝜋1(𝑧𝑧,𝑤𝑤, 𝑝𝑝1)𝑓𝑓1(𝑧𝑧)𝑑𝑑𝑧𝑧∞𝑧𝑧𝑚𝑚1� + 𝜆𝜆𝑚𝑚(1− 𝛼𝛼𝑚𝑚)∫ 𝜋𝜋2(𝑧𝑧,𝑤𝑤)𝑓𝑓2(𝑧𝑧)𝑑𝑑𝑧𝑧∞
𝑧𝑧𝑚𝑚2� - (11) 2. Competitive equilibrium
In equilibrium, the labour market and markets for both goods must clear. The equilibrium wage 𝑤𝑤∗ is the market-clearing wage. Equation (12) is the labour market clearing condition. The left-hand side of Equation (12) is the labour supply and the right-hand side is labour demand. The first brace in left-hand side is female labour supply and the second brace is male labour supply. The first and third braces on the right-hand side are the female managers’ labour demand and second and fourth braces are the male managers’ labour demand.
�𝜆𝜆𝑓𝑓αfF1�𝑧𝑧𝑓𝑓1∗� � + 𝜆𝜆𝑓𝑓�1− 𝛼𝛼𝑓𝑓�𝐹𝐹2�𝑧𝑧𝑓𝑓2∗� ��+ �𝜆𝜆𝑚𝑚αmF1�𝑧𝑧𝑚𝑚1∗� �+ 𝜆𝜆𝑚𝑚(1 − 𝛼𝛼𝑚𝑚)𝐹𝐹2�𝑧𝑧𝑚𝑚2
∗� �� =
�𝜆𝜆𝑓𝑓𝛼𝛼𝑓𝑓 ∫ 𝐿𝐿𝑓𝑓1(𝑧𝑧,𝑤𝑤∗, 𝑝𝑝1∗)𝑓𝑓1(𝑧𝑧)𝑑𝑑𝑧𝑧1∞𝑧𝑧𝑓𝑓1∗� + 𝜆𝜆𝑓𝑓�1− 𝛼𝛼𝑓𝑓� ∫ 𝐿𝐿𝑓𝑓2(𝑧𝑧,𝑤𝑤∗)𝑓𝑓2(𝑧𝑧)𝑑𝑑𝑧𝑧2
∞𝑧𝑧𝑓𝑓2∗� �+
�λ𝑚𝑚𝛼𝛼𝑚𝑚 ∫ 𝐿𝐿𝑓𝑓1(𝑧𝑧,𝑤𝑤∗, 𝑝𝑝1∗)𝑓𝑓1(𝑧𝑧)𝑑𝑑𝑧𝑧1∞𝑧𝑧𝑚𝑚1∗� + 𝜆𝜆𝑚𝑚(1− 𝛼𝛼𝑚𝑚)∫ 𝐿𝐿𝑓𝑓2(𝑧𝑧,𝑤𝑤∗)𝑓𝑓2(𝑧𝑧)𝑑𝑑𝑧𝑧2
∞𝑧𝑧𝑚𝑚2∗� �+
�𝜆𝜆𝑓𝑓𝛼𝛼𝑓𝑓 ∫ 𝐿𝐿𝑚𝑚1(𝑧𝑧,𝑤𝑤∗, 𝑝𝑝1∗)𝑓𝑓1(𝑧𝑧)𝑑𝑑𝑧𝑧1∞𝑧𝑧𝑓𝑓1∗� + 𝜆𝜆𝑓𝑓�1− 𝛼𝛼𝑓𝑓� ∫ 𝐿𝐿𝑚𝑚2(𝑧𝑧,𝑤𝑤∗)𝑓𝑓2(𝑧𝑧)𝑑𝑑𝑧𝑧2
∞𝑧𝑧𝑓𝑓2∗� � +
[𝜆𝜆𝑚𝑚𝛼𝛼𝑚𝑚 ∫ 𝐿𝐿𝑚𝑚1(𝑧𝑧,𝑤𝑤∗,𝑝𝑝1∗)𝑓𝑓1(𝑧𝑧)𝑑𝑑𝑧𝑧1∞𝑧𝑧𝑚𝑚1∗� + 𝜆𝜆𝑚𝑚(1 − 𝛼𝛼𝑚𝑚)∫ 𝐿𝐿𝑚𝑚2(𝑧𝑧,𝑤𝑤∗)𝑓𝑓2(𝑧𝑧)𝑑𝑑𝑧𝑧2
∞𝑧𝑧𝑚𝑚2∗� ] - (12)
The equilibrium price of services 𝑝𝑝1∗ is calculated from the first order condition of household (Equation (13)) and market-clearing condition for goods and services (Equations (14) and (15)).
𝐶𝐶1∗ = 𝑝𝑝∗ � 𝜌𝜌1−𝜌𝜌
�𝐶𝐶2∗ - (13)
𝐶𝐶1∗ = 𝜆𝜆𝑓𝑓𝛼𝛼𝑓𝑓 ∫ 𝑦𝑦𝑓𝑓1(𝑧𝑧1,𝑤𝑤∗,𝑝𝑝1∗)𝑓𝑓1(𝑧𝑧1)𝑑𝑑𝑧𝑧1∞𝑧𝑧𝑓𝑓1∗� + 𝜆𝜆𝑚𝑚𝛼𝛼𝑚𝑚 ∫ 𝑦𝑦𝑚𝑚1(𝑧𝑧1 ,𝑤𝑤∗, 𝑝𝑝1∗)𝑓𝑓1(𝑧𝑧1)𝑑𝑑𝑧𝑧1
∞𝑧𝑧𝑚𝑚1∗� – (14)

14
𝐶𝐶2∗ = 𝜆𝜆𝑓𝑓(1− 𝛼𝛼𝑓𝑓)∫ 𝑦𝑦𝑓𝑓2(𝑧𝑧2,𝑤𝑤∗)𝑓𝑓2(𝑧𝑧2)𝑑𝑑𝑧𝑧2∞𝑧𝑧𝑓𝑓2∗� + 𝜆𝜆𝑚𝑚(1 − 𝛼𝛼𝑚𝑚)∫ 𝑦𝑦𝑚𝑚2(𝑧𝑧2,𝑤𝑤∗)𝑓𝑓2(𝑧𝑧2)𝑑𝑑𝑧𝑧2
∞𝑧𝑧𝑚𝑚2∗� – (15)
A competitive equilibrium is {𝐶𝐶1∗ ,𝐶𝐶2,∗ , Lf1(z), Lm1(z), Lf2(z), Lm2(z),𝑧𝑧𝑓𝑓1� , 𝑧𝑧𝑓𝑓2� ,𝑧𝑧𝑚𝑚1� , 𝑧𝑧𝑚𝑚2� , w∗, p1∗}
such that the individuals’ occupational choice is resolved and the labour market and markets for goods and services is clear. 3. Calibration and results
Table 6 shows the parameter values used in a two-sector model simulation. I use the same values for span-of-control parameter (𝛾𝛾), the gender wage gap (𝜙𝜙), labour force participation rates by gender (λf and λm), the curvature of Pareto cumulative distribution (𝜏𝜏), and the parameters of the male Pareto cumulative distribution ( Bm ). The parameters of the female Pareto cumulative distribution (Bf
1, Bf2) are matched to the managers share in the labour force by gender and sector, and
the share of female managers by industry in 2015. The weighted average of Bf1 and Bf
2 is the same as Bf in a one-sector model. αf is the service sector share of female labour force and αmis the service sector share of male labour force in 2015. 𝜉𝜉1 is the share of female income in the service sector in 2015. 𝜉𝜉2 is the share of female income in the manufacturing sector and adjusted to satisfy the labour market equilibrium condition. The original number of 𝜉𝜉2 is 0.16. 𝜌𝜌 is the share of the service sector in the GDP in 2015. The productivity gap between the service and the manufacturing sectors 𝐴𝐴1/𝐴𝐴2 is from Lee and Song (2014).
Table 6 Parameter values for a two-sector model Parameter Value Data or Targets
Span-of-control parameter (𝜸𝜸) 0.83 Match to Statistics Korea (2015)
Service sector share of female labour force (𝛂𝛂𝐟𝐟) 0.78 Statistics Korea (2015)
Service sector share of male labour force (𝛂𝛂𝐦𝐦) 0.58 Statistics Korea (2015)
Share of female income in the service sector (𝝃𝝃𝟏𝟏) 0.35 Statistics Korea (2015)
Share of female income in the manufacturing sector (𝝃𝝃𝟐𝟐) 0.26
Adjust to satisfy the labour market equilibrium condition
Productivity gap between the service and manufacturing sectors (𝑨𝑨𝟏𝟏/𝑨𝑨𝟐𝟐) 0.56 Lee and Song (2014)
Gender wage gap (𝝓𝝓) 0.87 Statistics Korea (2015) and Kim (2009)
Female and male labour force participation rates (𝛌𝛌𝐟𝐟, 𝛌𝛌𝐦𝐦) 0.52, 0.74 Statistics Korea (2015)
Service sector share of GDP (𝝆𝝆) 0.61 Statistics Korea (2015)
Curvature of Pareto cumulative distribution (𝝉𝝉) 6.9 Match to Statistics Korea (2015)
Minimum value of support of Pareto cumulative distribution (𝐁𝐁𝐟𝐟𝟏𝟏,𝐁𝐁𝐟𝐟𝟐𝟐,𝐁𝐁𝐦𝐦)
1.05 0.78, 1.36
Match to Statistics Korea (2015)
Table 7 shows estimates of a two-sector model and target values in 2015. Benchmark estimates
are similar to the target.

15
Table 7 Two-sector model calibration results (percent) Target (2015) Benchmark
Estimates A. Total Share of managers in the labour force 2.2 2.6 Share of female managers in the female labour force 0.5 0.6 Share of male managers in the male labour force 3.2 4.0 Share of female managers 9.0 9.8 B. Manufacturing Share of managers in the labour force 2.8 2.9 Share of female managers in the female labour force 0.1 0.1 Share of male managers in the male labour force 3.6 4.0 Share of female managers 0.9 0.9 C. Service Share of managers in the labour force 1.9 2.4 Share of female managers in the female labour force 0.7 0.8 Share of male managers in the male labour force 2.9 4.0 Share of female managers 15.4 15.3 Source: Author’s calculation from Statistics Korea’s (2015) October 2015 economically active population survey; author’s calculation from the model 4. Simulation results
Table 8 reports the simulation results in a two-sector model without gender discrimination.5 Column (1) shows the estimates of a two-sector model.
The aggregate output increases by 5.2% when the glass ceiling disappears (Column (2)). It is lower than that in Table 5. This is due to higher managerial skill of females in the service sector (Bf
1) and high service sector share of female labour force (αf). Figure 7 shows cumulative distributions of managerial skill in both models. It shows that female managerial skill in the service sector is higher than that in the manufacturing sector. The service sector share of female employment determines the number of female managers in the service sector. Due to its high percentage, the increase in the number of female managers in the service sector is higher than that in the manufacturing sector. A large number of new women managers with high managerial skills in the service sector create a large demand for labour. Therefore, the cutoffs for equilibrium wage and managerial skill incline rapidly and the number of managers cannot increase as much as in a one-sector model. Although women can accumulate as much managerial skill as men, the aggregate output in a two-sector model cannot reach that of a one-sector model. In other words, the increase in aggregate output in a one-sector model may be overestimated.
When the labour force participation rates of women equal that of men (Column (3)), the aggregate output increases by 13.2%. The aggregate output increases by 18.9% when the gender wage gaps disappear and labour force participation rates of women equal that of men (Column (4)).
Table 8 Two-sector model simulation results (percent)
5 I also calculate the simulation result when the gender wage gap disappears. The aggregate output decreases by 0.3%, as female managerial skill cutoff increases and the number of managers decrease. The explanation is the same as in footnote 4.

16
(1) Benchmark estimates
(2) No glass ceiling
(𝑩𝑩𝒇𝒇𝟏𝟏 ,𝑩𝑩𝒇𝒇
𝟐𝟐 → 𝐁𝐁𝐦𝐦)
(3) No labour
force participation
rate gap (𝛌𝛌𝐟𝐟 → 𝛌𝛌𝐦𝐦)
(4) No labour
force participation rate gap and glass ceiling (𝛌𝛌𝐟𝐟 → 𝛌𝛌𝐦𝐦, 𝑩𝑩𝒇𝒇𝟏𝟏 ,𝑩𝑩𝒇𝒇
𝟐𝟐→ 𝐁𝐁𝐦𝐦) A. Total Share of managers in the labour force 2.59 2.62 3.0 3.0
Share of female managers in the female labour force 0.6 2.8 0.7 2.6
Share of male managers in the male labour force 4.0 2.5 4.4 2.4
Share of female managers 9.8 43.8 13.1 52.1 B. Manufacturing Share of managers in the labour force 2.9 3.0 3.0 3.0
Share of female managers in the female labour force 0.10 3.3 0.11 3.3
Share of male managers in the male labour force 4.0 2.8 4.5 2.8
Share of female managers 0.9 30.0 1.3 37.9 C. Service Share of managers in the labour force 2.41 2.44 2.3 2.3
Share of female managers in the female labour force 0.76 2.6 0.82 2.4
Share of male managers in the male labour force 4.0 2.3 4.3 2.1
Share of female managers 15.3 52.3 20.5 60.9
Aggregate output 100.0 105.2 113.2 118.9 Notes: The figures in red (blue) letters indicate that the values of the variables increase (decrease) with the shocks.

17
Figure 7 Cumulative distributions of managerial skill in both models
A. A one-sector model
A. A two-sector model
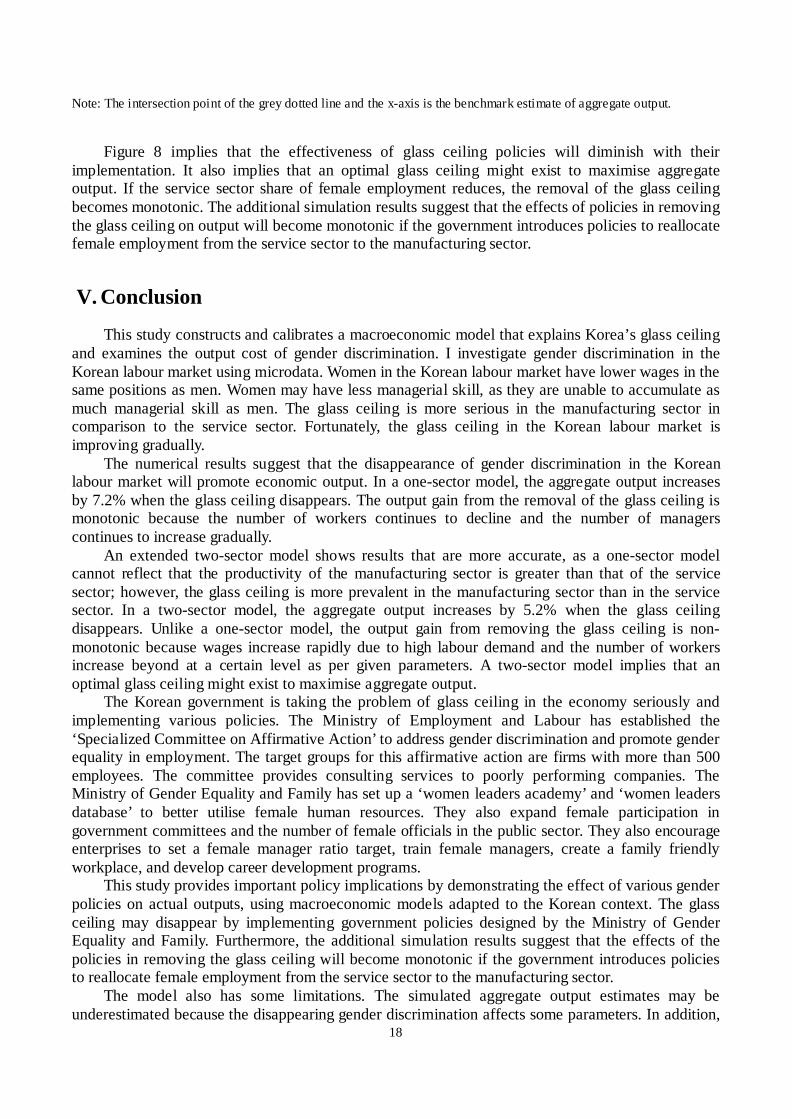
Figure 8 is calculated as shown in Figure 6. The narrowing gender gap in the labour force
participation rate is more effective in increasing aggregate output. Unlike the results of a one-sector model, the output gain from the removal of the glass ceiling is non-monotonic as per given parameters. The aggregate output decreases when the gender gap in managerial skill remains below 20%. This explanation aligns with that of the figures in Column (2) of Table 8. The equilibrium wage and managerial skill cutoffs incline rapidly due to large labour demand created by new women managers with high managerial skills in the service sector. Therefore, the number of workers decreases until the gender gap in managerial skill remains at 20%, only then do the number of workers increase. This increase is greater in the service sector than in the manufacturing sector, as the former has a smaller gender difference in managerial skill. It holds in cases of no gender wage gap or productivity gap between the service and manufacturing sectors.
Figure 8 Effects of narrowing gender gap in managerial skill and labour force participation rate on
aggregate output
100
110
120
0.52 0.56 0.61 0.65 0.69 0.74
Agg
rega
te o
utpu
t (10
0=be
nchm
ark)
Female labour force participation rate
Gap=100% Gap=80% Gap=60%
Gap=40% Gap=20% Gap=0%
Remaining gender gap in managerial skill
18
Note: The intersection point of the grey dotted line and the x-axis is the benchmark estimate of aggregate output.
Figure 8 implies that the effectiveness of glass ceiling policies will diminish with their implementation. It also implies that an optimal glass ceiling might exist to maximise aggregate output. If the service sector share of female employment reduces, the removal of the glass ceiling becomes monotonic. The additional simulation results suggest that the effects of policies in removing the glass ceiling on output will become monotonic if the government introduces policies to reallocate female employment from the service sector to the manufacturing sector.
V. Conclusion
This study constructs and calibrates a macroeconomic model that explains Korea’s glass ceiling and examines the output cost of gender discrimination. I investigate gender discrimination in the Korean labour market using microdata. Women in the Korean labour market have lower wages in the same positions as men. Women may have less managerial skill, as they are unable to accumulate as much managerial skill as men. The glass ceiling is more serious in the manufacturing sector in comparison to the service sector. Fortunately, the glass ceiling in the Korean labour market is improving gradually.
The numerical results suggest that the disappearance of gender discrimination in the Korean labour market will promote economic output. In a one-sector model, the aggregate output increases by 7.2% when the glass ceiling disappears. The output gain from the removal of the glass ceiling is monotonic because the number of workers continues to decline and the number of managers continues to increase gradually.
An extended two-sector model shows results that are more accurate, as a one-sector model cannot reflect that the productivity of the manufacturing sector is greater than that of the service sector; however, the glass ceiling is more prevalent in the manufacturing sector than in the service sector. In a two-sector model, the aggregate output increases by 5.2% when the glass ceiling disappears. Unlike a one-sector model, the output gain from removing the glass ceiling is non-monotonic because wages increase rapidly due to high labour demand and the number of workers increase beyond at a certain level as per given parameters. A two-sector model implies that an optimal glass ceiling might exist to maximise aggregate output.
The Korean government is taking the problem of glass ceiling in the economy seriously and implementing various policies. The Ministry of Employment and Labour has established the ‘Specialized Committee on Affirmative Action’ to address gender discrimination and promote gender equality in employment. The target groups for this affirmative action are firms with more than 500 employees. The committee provides consulting services to poorly performing companies. The Ministry of Gender Equality and Family has set up a ‘women leaders academy’ and ‘women leaders database’ to better utilise female human resources. They also expand female participation in government committees and the number of female officials in the public sector. They also encourage enterprises to set a female manager ratio target, train female managers, create a family friendly workplace, and develop career development programs.
This study provides important policy implications by demonstrating the effect of various gender policies on actual outputs, using macroeconomic models adapted to the Korean context. The glass ceiling may disappear by implementing government policies designed by the Ministry of Gender Equality and Family. Furthermore, the additional simulation results suggest that the effects of the policies in removing the glass ceiling will become monotonic if the government introduces policies to reallocate female employment from the service sector to the manufacturing sector.
The model also has some limitations. The simulated aggregate output estimates may be underestimated because the disappearing gender discrimination affects some parameters. In addition,
19
I did not analyse the transition dynamics of output when gender discrimination disappears. Furthermore, the model excludes household production and childbearing decisions of women. I plan to pursue further research, which includes these limitations.

20
References Cavalcanti, T., & Tavares, J. (2015). The Output Cost of Gender Discrimination: A Model-Based
Macroeconomic Estimate. The Economic Journal, 126, 109-134. Cuberes, D., & Teignier, M. (2016). Aggregate Effects of Gender Gaps in the Labor Market: A
Quantitative Estimate. Journal of Human Capital, 10(1), 1-32. Federal Glass Ceiling Commission. (1995). Solid Investments: Making Full Use of the Nation's
Human Capital. Washington, D.C.: U.S. Department of Labor. ILO (2016). ILO Database of Labour Statistics (available at http://www.ilo.org/ilostat/faces/home/
statisticaldata) Kang, M. (2013). Analysis of the determinants of female manager’s promotion (in Korean). In the
symposium on 2013 Korean women manager panel survey, 23-54. Kim, J., Lee, J. W., & Shin, K. (2016). Gender Inequality and Economic Growth in Korea.
forthcoming, Pacific Economic Review, 2016 Kim, K. (2013). The relationship between career development and personal and organizational
characteristics of female workers: focusing on career goals of female managers (in Korean). In the symposium on 2013 Korean women manager panel survey, 1-20.
Kim, K., Lim, H., & Kang, O. (2013). A case study on support for female career interruption prevention the case of enterprise management (in Korean). Seoul: Korea Employment Information Service.
Kim. J. (2009). Three different analysis of gender wage gap (in Korean). In the 10th KLIPS (Korean Labor & Income Panel Study) Conference, 673-734.
Klumpp, T., & Su, X. (2013). Second-order statistical discrimination. Journal of Public Economics, 97, 108-116.
Lee, J.W. & Song, C. (2014). Service Sector Productivity in Korea (in Korean). Journal of Korean Economic Analysis, 20(3), 1-55.
Lim, H. (2008). The Empirical Study on Corporate Characteristics and Women in Top Management (in Korean), The Women’s Studies, 74(1), 45-77.
Lucas Jr, R. E. (1978). On the Size Distribution of Business Firms. The Bell Journal of Economics, 9(2), 508-523.
Ministry of Gender Equality and Family (2014), 2014 Korean women manager panel survey, Retrieved from http://kwmp.kwdi.re.kr/
Ngai, L. R., & Petrongolo, B. (2015). Gender Gaps and the Rise of the Service Economy. Working paper.
Statistics Korea. (2015). Economically Active Population Survey in October 2015. Retrieved from https://mdis.kostat.go.kr/.
Süssmuth-Dyckerhoff, C., Wang, J., & Chen, J. (2012). Women Matter: An Asian Perspective. McKinsey and Company.
The Economist (2016). The Glass-ceiling Index (available at http://www.economist.com/blogs/ graphicdetail/ 2016/03/daily-chart-0)