discrimination of the commercial korean native chicken
TRANSCRIPT
Choi et al. Journal of Animal Science and Technology (2015) 57:5 DOI 10.1186/s40781-015-0044-6
RESEARCH Open Access
Discrimination of the commercial Korean nativechicken population using microsatellite markersNu Ri Choi1, Dong Won Seo1, Slim Ben Jemaa1,2, Hasina Sultana1, Kang Nyeong Heo3, Cheorun Jo4 and Jun Heon Lee1*
Abstract
Background: Korean native chicken (KNC) is a well-known breed due to its superior meat taste. This breed, however,owing to a low growth rate, has a high market price. In order to overcome this disadvantage, the National Instituteof Animal Science (NIAS) in Korea developed a commercial KNC breed, named Woorimatdag version 2 (WM2), anupgraded version of the Woorimatdag (WM1) breed and the WM2 was created by crossing the KNC with meat typebreeds. This study aims to discriminate between WM2 and other chicken breeds using microsatellite (MS) markers.
Methods: A total of 302 individuals from eight Korean chicken populations were examined. The genetic diversity andpopulation structure analysis were investigated using Cervus, API-CALC, STRUCTURE, PowerMarker programs.
Results: Based on heterozygosity and polymorphic information content (PIC) values, 30 MS markers were initiallyselected from 150 markers. The identified average number of alleles (Na), expected heterozygosity, and PIC values forthe WM2 samples were 7.17, 0.741, and 0.682, respectively. Additionally, the paternity of individuals was assigned witha success rate of greater than 99% using 12 markers, the best minimum number of markers. The 12 selected markerscontained heterozygosity and PIC values above 0.7 and probability of identity values around zero. Using these markers,the determined probability of identity (PI), PIhalf-sibs, and PIsibs values were 3.23E-33, 5.03E-22, and 8.61E-08, respectively.
Conclusions: WM2 is well differentiated with respect to other chicken breeds based on estimated genetic distances.The results presented here will contribute to the identification of commercial WM2 chicken in the market.
Keywords: Discrimination, Diversity, Microsatellite, Korean native chicken, Woorimatdag
BackgroundRecently, chicken meat consumption in Korea has rapidlyincreased to 12 kg per capita due to consumer preferencesfor healthy white muscle meat [1]. In comparison to redmeat, chicken meat is considered a healthier option becauseof lower fat, cholesterol, and iron levels [2]. Presently,approximately 90% of the Korean poultry industry containsimported chicken breeding stocks. The breeds that existedbefore the Korean War (1950–1953), unfortunately, arealmost all extinct. Since 1992, a Korean native chicken(KNC) conservation project was launched by the NationalInstitute of Animal Science (NIAS) in an attempt to restorelocal chicken breeds. Recently, five KNC lines and sevenothers originally imported in the 1960s have been restored[3]. Consumers tend to pay more for the KNCs because of
* Correspondence: [email protected] of Animal Science and Biotechnology, College of Agricultureand Life Sciences, Chungnam National University, Daejeon 305-764, Republicof KoreaFull list of author information is available at the end of the article
© 2015 Choi et al.; licensee BioMed Central. ThCommons Attribution License (http://creativecreproduction in any medium, provided the orDedication waiver (http://creativecommons.orunless otherwise stated.
their good taste. The low productivity of the native breeds,however, was disadvantageous for farmers trying to meetfeeding and consumption rates. In order to overcome thesedisadvantages, NIAS developed the Woorimatdag version 1(WM1) chicken population. WM1 was a commercial, KNCpopulation generated from crossbreeding fast growingnative male chickens and good tasting female chickens withincreased egg production. WM1 chicken grows faster,reaching the marker weight of 1.8 kg, than the purebredKNC [4]. Moreover, WM1 chickens produce good qualitymeat with a high oleic acid content, which improves bothtaste and water holding capacity [4]. Jung et al. [5] reportedthat WM1 chickens have a significantly higher content ofarachidonic acid and meat flavor than commercial broilers(Br). NIAS recently developed Woorimatdag version 2(WM2) chickens, a modified version of WM1 chickenswith increased growth rates.Traditional methods to identify chicken breeds focused
on general appearances such as feather color, shank color,
is is an Open Access article distributed under the terms of the Creativeommons.org/licenses/by/4.0), which permits unrestricted use, distribution, andiginal work is properly credited. The Creative Commons Public Domaing/publicdomain/zero/1.0/) applies to the data made available in this article,

Choi et al. Journal of Animal Science and Technology (2015) 57:5 Page 2 of 8
and body type [6]. Because of the process of distributionand market, chicken breeds cannot be effectively classifiedbased on the appearance of meat. Recent advances inmolecular biology techniques, however, have providednew opportunities to assess genetic variability at the DNAlevel [7]. Therefore, many groups have attempted to dis-criminate breeds using molecular genetic markers. Forexample, Korean cattle and pork industries developed dis-crimination and traceability systems using microsatellite(MS) markers [8,9].MS markers or simple-sequence repeat (SSR) markers,
are highly polymorphic, one to six base pair repeats, widelyused since they are numerous, randomly distributed in thegenome, and show co-dominant inheritance [10,11]. Inaddition, MS markers were used in the construction oflinkage map of quantitative trait locus (QTL) studies [12].MS markers may be useful in discriminating individuals.The International Society for Animal Genetics (ISAG) hasrecommended 30 MS markers for breed identification [13].In a previous study, 97 MS marker variations, including
the 30 MS ISAG recommended markers were investigatedin 12 chicken populations. While the majority of the 12population studies were purebred, the commercial chick-ens were different, products of three- and four-way crosses.Therefore, in this study, the commercial KNC population,WM2 was investigated to discriminate it from the otherchicken populations in the market.
MethodsSample collection and DNA extractionA total of 302 individuals from eight Korean chickenpopulation (187 WM2, 17 WM1, 13 Hanhyup-3 (Hh),14 Hyunin (Hn), 14 Rhode Island Red (RIR), 15 CornishBlack (CoL), 15 Cornish Red (CoR), 17 Ogye (O) and 10Br) were examined. Chicken populations care facilities andprocedures met or exceeded the standards established bythe Committee for Accreditation of Laboratory AnimalCare at National Institute of Animal Science (NIAS) inKorea. The study also was conducted in accordance withrecommendations described in “The Guide for the Careand Use of Laboratory Animals” published by the institu-tional Animal Care and Use Committee (IACUC) of NIAS(2012-C-037) in Korea. Genomic DNA was extracted fromembryo tissues of WM2 using the PrimePrep™ GenomicDNA isolation kit for tissue (GeNetBio, Korea) and bloodsamples of other population using the PrimePrem™ GenomicDNA isolation kit for blood. The concentration of DNAsamples was measured using NanoDrop 2000C spectropho-tometer (Thermo Scientific, USA) and stored at −20°C.
Microsatellite (MS) marker genotypingPreviously, 150 MS markers were investigated for thediscrimination of five purebred KNC lines [14]. Fromthese results, a total of 30 MS markers were initially
selected, which have high expected heterozygosity (Hexp)and polymorphic information content (PIC) values forclassification of the WM2 and other commercial popula-tions (Table 1). Selected 30 MS markers were distributedon 15 autosomes.The Polymerase Chain Reaction (PCR) was performed
in total volume of 20 μL, 50 ng of genomic DNA, 10pmol of fluorescent dye (FAM, VIC, NED, PET) labeledmodified forward primer and normal reverse primer(Applied Biosystems, USA), 2.5 mM of each dNTPs(GeNet Bio, Korea), 10 X reaction buffer (GeNet Bio,Korea), 2.5 unit of prime Taq DNA polymerase (GeNetBio, Korea). The PCR was performed in an initial de-naturation at 95°C for 10 min followed by 35 cycles of30 sec of denaturation at 95°C, 30 sec of annealing at60°C, 30 sec of extension at 72°C and final extension at72°C for 10 min using My-Genie 96 Thermal Cycler(Bioneer, Korea). The PCR products were initially elec-trophoresis on 3% agarose gel with ethidium bromide(EtBr) and confirmed whether they gave single PCRDNA band under the UV light. When the bands wereclearly appeared, further genotyping was performed. Forthe microsatellite genotyping, more than 20 times di-luted PCR products were used. The genotyping reactioncontained 1 μL of diluted PCR products, 10 μL of Hi-Di™Formamide (Applied Biosystems, USA) and 0.1 μL ofGeneScan™-500 LIZ™ size standard marker (AppliedBiosystems, USA). After dilution, genotyping reactionmixture was denatured for 2 min at 95°C and fragmentanalysis was performed using capillary array in Geneticanalyzer 3130xl (Applied Biosystems, USA). The MS geno-types were identified using GeneMapper ver.3.7 (AppliedBiosystems, USA).
Genetic diversity and population structure analysisThe genotyping data were used to estimate mean num-ber of allele (Na), Hexp, observed heterozygosity (Hobs)and PIC using Cervus 3.0 program [15]. The expectedprobability of identity values among genotypes of randomindividuals (PI), random half sibs (PIhalf-sibs) and randomsibs (PIsibs) were calculated using API-CALC (AverageProbability of Identity-Calculate) ver 1.0 [16]. Moreover,we used both model-based and non model-based methodsto describe the diversity between pre-defined geneticclusters. We used STRUCTURE software v. 2.3 [17] formodel-based and DAPC (Discriminant Analysis of Prin-cipal Components) program implemented in adegenetR-package [18-20] for non model-based method. STRUC-TURE results were also used to assess population struc-ture of Korean breeds.DAPC analysis was preceded by the execution of the
K-means clustering algorithm implemented in adegenetto identify an optimal number of genetic clusters todescribe the data. For this purpose, we ran K-means
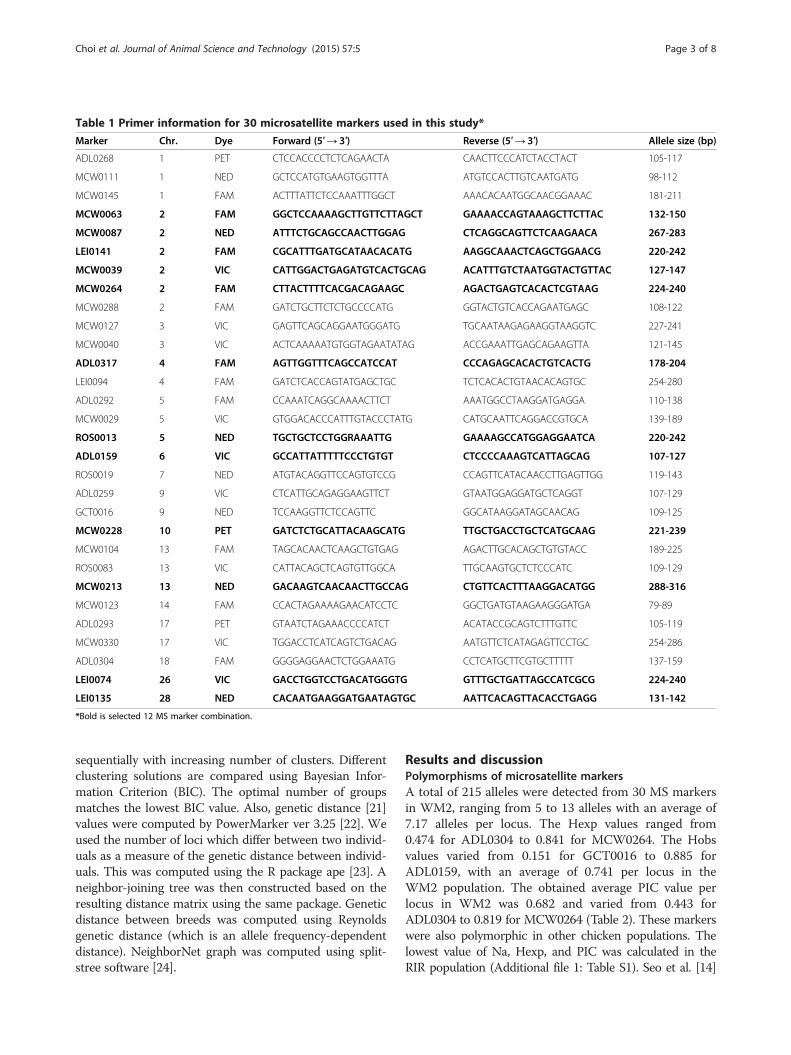
Table 1 Primer information for 30 microsatellite markers used in this study*
Marker Chr. Dye Forward (5′→ 3′) Reverse (5′→ 3′) Allele size (bp)
ADL0268 1 PET CTCCACCCCTCTCAGAACTA CAACTTCCCATCTACCTACT 105-117
MCW0111 1 NED GCTCCATGTGAAGTGGTTTA ATGTCCACTTGTCAATGATG 98-112
MCW0145 1 FAM ACTTTATTCTCCAAATTTGGCT AAACACAATGGCAACGGAAAC 181-211
MCW0063 2 FAM GGCTCCAAAAGCTTGTTCTTAGCT GAAAACCAGTAAAGCTTCTTAC 132-150
MCW0087 2 NED ATTTCTGCAGCCAACTTGGAG CTCAGGCAGTTCTCAAGAACA 267-283
LEI0141 2 FAM CGCATTTGATGCATAACACATG AAGGCAAACTCAGCTGGAACG 220-242
MCW0039 2 VIC CATTGGACTGAGATGTCACTGCAG ACATTTGTCTAATGGTACTGTTAC 127-147
MCW0264 2 FAM CTTACTTTTCACGACAGAAGC AGACTGAGTCACACTCGTAAG 224-240
MCW0288 2 FAM GATCTGCTTCTCTGCCCCATG GGTACTGTCACCAGAATGAGC 108-122
MCW0127 3 VIC GAGTTCAGCAGGAATGGGATG TGCAATAAGAGAAGGTAAGGTC 227-241
MCW0040 3 VIC ACTCAAAAATGTGGTAGAATATAG ACCGAAATTGAGCAGAAGTTA 121-145
ADL0317 4 FAM AGTTGGTTTCAGCCATCCAT CCCAGAGCACACTGTCACTG 178-204
LEI0094 4 FAM GATCTCACCAGTATGAGCTGC TCTCACACTGTAACACAGTGC 254-280
ADL0292 5 FAM CCAAATCAGGCAAAACTTCT AAATGGCCTAAGGATGAGGA 110-138
MCW0029 5 VIC GTGGACACCCATTTGTACCCTATG CATGCAATTCAGGACCGTGCA 139-189
ROS0013 5 NED TGCTGCTCCTGGRAAATTG GAAAAGCCATGGAGGAATCA 220-242
ADL0159 6 VIC GCCATTATTTTTCCCTGTGT CTCCCCAAAGTCATTAGCAG 107-127
ROS0019 7 NED ATGTACAGGTTCCAGTGTCCG CCAGTTCATACAACCTTGAGTTGG 119-143
ADL0259 9 VIC CTCATTGCAGAGGAAGTTCT GTAATGGAGGATGCTCAGGT 107-129
GCT0016 9 NED TCCAAGGTTCTCCAGTTC GGCATAAGGATAGCAACAG 109-125
MCW0228 10 PET GATCTCTGCATTACAAGCATG TTGCTGACCTGCTCATGCAAG 221-239
MCW0104 13 FAM TAGCACAACTCAAGCTGTGAG AGACTTGCACAGCTGTGTACC 189-225
ROS0083 13 VIC CATTACAGCTCAGTGTTGGCA TTGCAAGTGCTCTCCCATC 109-129
MCW0213 13 NED GACAAGTCAACAACTTGCCAG CTGTTCACTTTAAGGACATGG 288-316
MCW0123 14 FAM CCACTAGAAAAGAACATCCTC GGCTGATGTAAGAAGGGATGA 79-89
ADL0293 17 PET GTAATCTAGAAACCCCATCT ACATACCGCAGTCTTTGTTC 105-119
MCW0330 17 VIC TGGACCTCATCAGTCTGACAG AATGTTCTCATAGAGTTCCTGC 254-286
ADL0304 18 FAM GGGGAGGAACTCTGGAAATG CCTCATGCTTCGTGCTTTTT 137-159
LEI0074 26 VIC GACCTGGTCCTGACATGGGTG GTTTGCTGATTAGCCATCGCG 224-240
LEI0135 28 NED CACAATGAAGGATGAATAGTGC AATTCACAGTTACACCTGAGG 131-142
*Bold is selected 12 MS marker combination.
Choi et al. Journal of Animal Science and Technology (2015) 57:5 Page 3 of 8
sequentially with increasing number of clusters. Differentclustering solutions are compared using Bayesian Infor-mation Criterion (BIC). The optimal number of groupsmatches the lowest BIC value. Also, genetic distance [21]values were computed by PowerMarker ver 3.25 [22]. Weused the number of loci which differ between two individ-uals as a measure of the genetic distance between individ-uals. This was computed using the R package ape [23]. Aneighbor-joining tree was then constructed based on theresulting distance matrix using the same package. Geneticdistance between breeds was computed using Reynoldsgenetic distance (which is an allele frequency-dependentdistance). NeighborNet graph was computed using split-stree software [24].
Results and discussionPolymorphisms of microsatellite markersA total of 215 alleles were detected from 30 MS markersin WM2, ranging from 5 to 13 alleles with an average of7.17 alleles per locus. The Hexp values ranged from0.474 for ADL0304 to 0.841 for MCW0264. The Hobsvalues varied from 0.151 for GCT0016 to 0.885 forADL0159, with an average of 0.741 per locus in theWM2 population. The obtained average PIC value perlocus in WM2 was 0.682 and varied from 0.443 forADL0304 to 0.819 for MCW0264 (Table 2). These markerswere also polymorphic in other chicken populations. Thelowest value of Na, Hexp, and PIC was calculated in theRIR population (Additional file 1: Table S1). Seo et al. [14]

Table 2 The heterozygosity (Hobs and Hexp) andpolymorphism information content (PIC) values using 30MS markers in Woorimatdag version 2 (WM2) chickenpopulation*
Locus No. of allele HObs HExp PIC
ADL0268 5 0.783 0.742 0.703
MCW0111 5 0.789 0.695 0.654
MCW0145 7 0.754 0.692 0.655
MCW0063 7 0.775 0.783 0.746
MCW0087 9 0.833 0.785 0.751
LEI0141 7 0.832 0.797 0.767
MCW0039 7 0.738 0.765 0.726
MCW0264 8 0.877 0.841 0.819
MCW0288 6 0.608 0.631 0.578
MCW0127 6 0.742 0.679 0.627
MCW0040 6 0.813 0.695 0.656
ADL0317 7 0.819 0.775 0.739
LEI0094 7 0.845 0.716 0.665
ADL0292 7 0.774 0.733 0.684
MCW0029 13 0.805 0.815 0.790
ROS0013 8 0.871 0.771 0.734
ADL0159 7 0.885 0.789 0.757
ROS0019 8 0.766 0.643 0.581
ADL0259 6 0.674 0.657 0.620
GCT0016 9 0.151 0.804 0.773
MCW0228 6 0.821 0.773 0.740
MCW0104 11 0.743 0.813 0.786
ROS0083 8 0.818 0.749 0.707
MCW0213 11 0.807 0.798 0.771
MCW0123 5 0.707 0.687 0.627
ADL0293 7 0.701 0.554 0.522
MCW0330 6 0.484 0.643 0.592
ADL0304 5 0.513 0.474 0.443
LEI0074 6 0.85 0.745 0.704
LEI0135 5 0.659 0.596 0.544
Mean 7.17 0.741 0.721 0.682
*Bold is selected 12 MS marker combination.
Choi et al. Journal of Animal Science and Technology (2015) 57:5 Page 4 of 8
reported the classification of five different lines of KNCusing 15 MS markers and determined the mean Na,Hexp, Hobs, and PIC values of 8.4, 0.802, 0.709, and0.771, respectively. With the exception of the Hobsvalues, the values in the current study were lower thanthose reported by Seo et al. [14]. Of the 30 selectedmarkers, six (GCT0016, MCW0029, MCW0063, MCW0087, MCW0264, and MCW0104) were used in thestudy by Seo et al. [14]. Furthermore, four markers(LEI0135, MCW0111, MCW0145, and MCW0330) wereinvestigated by Suh et al. [25] for the discrimination of
four different breeds, including the WM1 population. Ourmarker combination is more polymorphic than that in thestudy by Suh et al. [25]. In addition, of the 30 markers inthis study, six were among the ISAG recommendedmarkers (ADL0268, LEI0094, MCW0104, MCW0111,MCW0123, and MCW0330). These results indicated thathighly polymorphic MS markers were commonly used indiverse populations.Bostein et al. [26] reported that markers with PIC
values >0.5 and Hexp values >0.6 have a high polymorphicinformation content and are sufficient for breed discrim-ination. Thus, our results confirmed that all markers, withthe exception of ADL0304, have high polymorphic infor-mation and suitable allele frequencies and polymorphisms,and can be used to discriminate the WM2 population.
Discrimination of WM2 populationWhile all 30 selected markers had the ability to discrim-inate the WM2 population from other populations, thebest minimum number of markers was required from aneconomic point of view. For this reason, 12 MS markerswere selected for the best minimum MS marker combin-ation based on the highest Hexp and PIC values. Usingthis combination of 12 MS markers, the calculated PI,PIhalf-sibs, and PIsibs values were 3.23E-33, 5.03E-22, and8.61E-08, respectively. A previous study, using 12 markers,reported PI, PIhalf-sibs, and PIsibs values of 7.98E-29, 2.28E-20, and 1.25E-8, respectively, for the discrimination of 5lines of purebred KNCs [14]. These results suggest thatthe selected 12 markers have high polymorphism and areeffective in discriminating the WM2 population fromother populations (Figure 1).
Genetic distance among WM2 and other populationsTo establish genetic relationships among WM2 and theother populations, genetic distances were calculatedusing the alleles from the 12 selected MS markers. Neiet al. [21]’s genetic distance was calculated betweenWM2 and the other populations using a pairwise co-ancestry matrix according to the allele frequencies(Table 3). The lowest genetic distance (0.1375) was ob-served between the WM1 and CoL populations. The gen-etic distance between O chicken population and WM2was the highest (0.791), followed by RIR and WM2(0.788) (Table 3). Similarly, Suh et al. [25] reported thelowest genetic distance (0.092) between the WM1 and Hhpopulations and the highest genetic distance (0.690) be-tween the RIR and White Leghorn breeds. This indicatedthat the WM1 and Hh populations originated from thesame breed/ancestor for constructing the populations.Furthermore, according to the genetic distance values, ourmarker combination has a stronger discriminating powerthan that in the findings by Suh et al. [25]. On the otherhand, close genetic distances of the WM1 population with

Figure 1 The expected probability of identity values among genotypes of random individuals (PI), random half-sib (PIhalf-sibs) and randomsibs (PIsibs) were suggested markers for discrimination of chicken lines.
Choi et al. Journal of Animal Science and Technology (2015) 57:5 Page 5 of 8
the CoL, Hh, and RIR populations (0.1375, 0.2453, and0.2478, respectively) were observed. These results supportthe findings by Suh et al. [25] that the WM1 and Hhpopulations have the same founder breeds as their geneticdistances are close (Table 3). The WM2 population, how-ever, has a genetic distance >0.690 indicating that differentcrossing combinations were applied between the WM2and WM1 populations.
Phylogenetic and structure analysis of nine populationsBased on Nei’s equations [21], an unrooted neighbor-joining (NJ) phylogenetic tree was constructed for 263animals from nine chicken populations using 12 MSmarker variations (Figure 2). In our individual phylogen-etic analysis, the WM2 population was identified as adistinct population from other populations. O chickenpopulation was also well separated from other popula-tions and a mixture clade contained the WM1, Hh, CoL,and Br populations.The genetic structure of nine native chicken populations
using microsatellite marker genotypes was investigatedbased on population clustering (Figure 3). The purpose ofstructure analysis, performed using a Bayesian approachbased on the marker genotypes, was to delineate clustersof individuals [27]. Using 12 MS markers and a K value of2, WM2 was fully separated from the other populations.
Table 3 Matrix of genetic distances among nine populations*
Bb CoL CoR Hh
Bb -
CoL 0.3267 -
CoR 0.3251 0.3906 -
Hh 0.2715 0.3114 0.3805 -
Hn 0.4189 0.4090 0.4738 0.4460
O 0.4587 0.4027 0.4543 0.4972
RIR 0.4371 0.4702 0.5382 0.3494
Wm1 0.2791 0.1375 0.3365 0.2453
Wm2 0.7102 0.7225 0.7095 0.7121
*WM1 (Woorimatdag version 1), WM2 (Woorimatdag version 2), Hh (Hanhyup-3), HnO (Ogye) and Br (Broiler).
This result was also observed in the individual phylogen-etic and discriminant analyses. Based on these results, thecombination of 12 MS markers could discriminate WM2from the other populations. Furthermore, with a K valueof 9, most populations classified well with differentgroups. WM1, however, was found to be a mixture popu-lation, a finding consistent with the results obtained fromthe phylogenetic and DAPC analyses. The discriminantanalysis confirmed the WM2 populations were distinctfrom the other populations.The assignment of the individuals from the 9 popula-
tions was 9 clusters (group), represent genetic groupsand they were inferred using K-means algorithm imple-mented in the R package adegenet (Figure 4). Further-more, individuals (represented by dots) were plottedaccording to their coordinates on the first two principalcomponents. The populations were represented as iner-tia ellipses, which characterize the dispersion of eachpopulation around its center of gravity. Bar graph insetsindicate the amount of variance determined by the twodiscriminant values used for plotting. WM2 is clearlyseparated from the other populations, a result sup-ported by the phylogenetic analysis using 12 selectedMS markers. The 12 selected MS markers were alsoused for the separation of the O chicken and RIRgroups.
Hn O RIR Wm1 Wm2
-
0.5287 -
0.5492 0.6302 -
0.3667 0.4341 0.2478 -
0.7618 0.7914 0.7878 0.6904 -
(Hyunin), RIR (Rhode Island Red), CoL (Cornish black), CoR (Cornish red),

Figure 2 Phylogenetic analysis for each individual from nine populations using Reynolds genetic distance. The color codes are indicateddifferent populations. The population acronyms are as follows: WM1 (Woorimatdag version 1), WM2 (Woorimatdag version 2), Hh (Hanhyup-3), Hn(Hyunin), RIR (Rhode Island Red), CoL (Cornish black), CoR (Cornish red), O (Ogye) and Br (Broiler).
Figure 3 Structure analysis using twelve MS markers from nine populations. The population acronyms are as follows: WM1 (Woorimatdagversion 1), WM2 (Woorimatdag version 2), Hh (Hanhyup-3), Hn (Hyunin), RIR (Rhode Island Red), CoL (Cornish black), CoR (Cornish red), O (Ogye)and Br (Broiler).
Choi et al. Journal of Animal Science and Technology (2015) 57:5 Page 6 of 8

Figure 4 Scatter plot of DAPC analysis of the nine populations using adegent R package. The population acronyms are as follows: WM1(Woorimatdag version 1), WM2 (Woorimatdag version 2), Hh (Hanhyup-3), Hn (Hyunin), RIR (Rhode Island Red), CoL (Cornish black), CoR (Cornishred), O (Ogye) and Br (Broiler).
Choi et al. Journal of Animal Science and Technology (2015) 57:5 Page 7 of 8
ConclusionsSince our 12 MS marker combination can effectively dis-criminate WM2, they can be used for breed identifica-tion. Moreover, to the best of our knowledge, this is thefirst study demonstrating the discrimination of the com-mercial KNC population, and the results presented heremay be applied in the commercial market.
Additional file
Additional file 1: Table S1. The calculated number of alleles (k),observed heterozygosity (HObs), expected heterozygosity (HExp), andpolymorphic information content (PIC) values in eight chickenpopulations.
AbbreviationsBIC: Bayesian Information Criterion; Br: Broiler; CoL: Cornish Black;CoR: Cornish Red; DAPC: Discriminant Analysis of Principal Components;EtBr: Ethidium Bromide; Hexp: Expected heterozygosity; Hh: Hanhyup-3;Hobs: Observed heterozygosity; Hn: Hyunin; ISAG: International Society forAnimal Genetics; KNC: Korean native chicken; MS: Microsatellite; Na: Numberof allele; NIAS: National Institute of Animal Science; NJ: Neighbor-joining;O: Korean Ogye; PCR: Polymerase Chain Reaction; PI: Probability of identity;
PIC: Polymorphic Information content; QTL: Quantitative Trait Locus;RIR: Rhode Island Red; SSR: Simple-Sequence Repeat; WM1: Woorimatdagversion 1; WM2: Woorimatdag verson 2.
Competing interestsThe author declares that they have no competing interests.
Authors’ contributionsNRC, DWS, KNH, CJ and JHL designed experiment, NRC, DWS and HS Carriedout lab works, NRC, DWS, SBJ, HS, KNH analyzed data, NRC, DWS, SBJ, CJ, JHLwritten manuscript. All authors read and approved the final manuscript.
AcknowledgementsThis study was supported by a grant from the Golden Seed Project (No.2013005042SB730), Korea Institute of Planning & Evaluation for Technologyin Food, Agriculture Forestry & Fisheries (IPET), Republic of Korea.
Author details1Department of Animal Science and Biotechnology, College of Agricultureand Life Sciences, Chungnam National University, Daejeon 305-764, Republicof Korea. 2INRA-Tunisie, Laboratoire des Productions Animales et Fourragères,Rue Hédi Karray 2049Ariana, Tunisia. 3Poultry Science Division, NationalInstitute of Animal Science, RDA, Cheonan 331-801, Republic of Korea.4Department of Agricultural Biotechnology, Center for Food andBioconvergence, and Research Institute for Agriculture and Life Science,Seoul National University, Seoul 151-921, Republic of Korea.

Choi et al. Journal of Animal Science and Technology (2015) 57:5 Page 8 of 8
Received: 23 December 2014 Accepted: 20 January 2015
References1. Ministry of Agriculture, Food and Rural Affairs. Primary statistics of Ministry
of Agriculture, Food and Rural Affairs. 2014, Korea2. Jaturasitha S, Srikanchai T, Kreuzer M, Wicke M. Differences in carcass and
meat characteristics between chicken indigenous to northern Thailand(Black-boned and Thai native) and imported extensive breeds (Bresse andRhode Island Red). Poult Sci. 2008;87:160–9.
3. Heo KN, Choo HJ, Seo BY, Park MN, Jung KC, Hwangbo J, et al. Investigationof TYR and MC1R polymorphisms in Korean native chickens and thecommercial chickens. CNU J Agric Sci. 2011;38:465–71.
4. Park MN, Hong EC, Kang BS, Kim HK, Kim JH, Na SH, et al. Chemicalcomposition and meat quality of crossbred Korean native chickens (KNC).Korean J Poult Sci. 2010;37:415–21.
5. Jung YK, Jeon HJ, Jung S, Choe JH, Lee HJ, Heo KN, et al. Comparison ofquality traits of thigh meat from Korean native chickens and broilers. KoreanJ Food Sci Ani resour. 2011;31:684–92.
6. Park MN, Kim TH, Lee HJ, Choi JA, Heo KN, Kim CD, et al. Genetic variatiionof chicken MC1R gene and associations with feather color of Korean nativechicken (KNC) ‘Woorimatdag’. Korean J Poult Sci. 2013;40:139–45.
7. Hillel J, Groenen MA, Tixier-Boichard M, Korol AB, David L, Kirzhner VM, et al.Biodiversity of 52 chicken populations assessed by microsatellite typing ofDNA pools. Genet Sel Evo. 2003;35:533–58.
8. Lim HT, Seo BY, Jung EJ, Yoo CK, Yoon DH, Jeon JT. A comparison ofdiscriminating powers between 14 microsatellite markers and 60 SNPmarkers applicable to the cattle identification test. J Anim Sci Technol.2009;51:353–60.
9. Lim HT, Seo BY, Jung EJ, Yoo CK, Zhong T, Cho IC, et al. Estabilishment of amicrosatellite marker set for individual, pork brand and product originidentification in pigs. J Anim Sci Technol. 2009;51:201–6.
10. Cheng HH, Crittenden LB. Microsatellite markers for genetic mapping in thechicken. Poult Sci. 1994;73:539–46.
11. Crooijmans RP, Groen AF, Van Kampen AJ, Van der Beek S, Van der Poel JJ,Groenen MA. Microsatellite polymorphism in commercial broiler and layerlines estimated using pooled blood samples. Poult Sci. 1996;75:904–9.
12. Abasht B, Dekkers JCM, Lamont SJ. Review of quantitative trait lociidentified in the chicken. Poult Sci. 2006;85:2079–96.
13. Food and Agriculture Organization of the United Nations. Molecular geneticcharacterization of animal genetic resources. Rome: FAO Animal productionand Health Guidelines; 2011. No. 9: 84–85.
14. Seo DW, Hoque MR, Choi NR, Sultana H, Park HB, Heo KN, et al.Discrimination of Korean native chicken lines using fifteen selectedMicrosatellite markers. Asian-Aust J Anim Sci. 2013;26:316–22.
15. Marshall T, Slate J, Kruuk L, Pemberton J. Statistical confidence forlikelihood‐based paternity inference in natural populations. Mol Ecol.1998;7:639–55.
16. Ayres KL, Overall AD. api‐calc 1.0: a computer program for calculating theaverage probability of identity allowing for substructure, inbreeding and thepresence of close relatives. Mol Ecol Notes. 2004;4:315–8.
17. Pritchard JK, Stephens M, Donnelly P. Inference of population structureusing multilocus genotype data. Genetics. 2000;155:945–59.
18. Jombart T. adegenet: a R package for the multivariate analysis of geneticmarkers. Bioinformatics. 2008;24:1403–5.
19. Jombart T, Devillard S, Balloux F. Discriminant analysis of principalcomponents: a new method for the analysis of genetically structuredpopulations. BMC Genetics. 2010;11:94.
20. Jombart T, Collins C, Solymos P, Ahmed I, Calboli F, Cori A. Package‘adegenet’. ftp://mint.c3sl.ufpr.br/CRAN/web/packages/adegenet/adegenet.pdf. Accessed June 7, 2014.
21. Nei M, Tajima F, Tateno Y. Accuracy of estimated phylogenetic trees frommolecular data. J Mol Evol. 1983;19:153–70.
22. Liu K, Muse SV. PowerMarker: an integrated analysis environment forgenetic marker analysis. Bioinformatics. 2005;21:2128–9.
23. Paradis E, Claude J, Strimmer K. APE: analyses of phylogenetics andevolution in R language. Bioinformatics. 2004;20:289–90.
24. Huson DH, Bryant D. Application of phylogenetic networks in evolutionarystudies. Mol Biol Evol. 2006;23:254–67.
25. Suh S, Cho CY, Kim JH, Choi SB, Kim YS, Kim H, et al. Analysis of geneticcharacteristics and probability of individual discrimination in Korean
indigenous chicken brands by microsatellite marker. J Anim Sci Technol.2013;55:185–94.
26. Botstein D, White RL, Skolnik M, Davis RW. Construction of a genetic linkagemap in man using restriction fragment length polymorphisms. Am J HumGenet. 1980;32:314–31.
27. Evanno G, Regnaut S, Goudet J. Detecting the number of clusters ofindividuals using the software STRUCTURE: a simulation study. Mol Ecol.2005;14:2611–20.
Submit your next manuscript to BioMed Centraland take full advantage of:
• Convenient online submission
• Thorough peer review
• No space constraints or color figure charges
• Immediate publication on acceptance
• Inclusion in PubMed, CAS, Scopus and Google Scholar
• Research which is freely available for redistribution
Submit your manuscript at www.biomedcentral.com/submit