impact of land cover change to water … of land cover change to water quality and aquaculture...
TRANSCRIPT

IMPACT OF LAND COVER CHANGE TO WATER QUALITY AND AQUACULTURE ACTIVITY IN
TONDANO LAKE
United Nations/Pakistan International Workshop on Integrated use of Space Technologies or Food and Water Security
Islamabad, 11-15 March 2013
Bambang Trisakti and Tatik KartikaRemote Sensing Application Center
Indonesia National Institute of Aeronautics and Space

INTRODUCTION
Indonesia has around 840 big lakes and 735 small lake which supply 72% of total water surface in the country. The lakes has functions for providing drinking water, irrigation, power generation, aquaculture, and tourism (MOE)
Indonesia government has established a National Program for Lake Rescue 2010-2014 :
First Lake Conference in Bali, 13 August 2009
Second Lake Conference in Semarang, 13-14 October 2011
15 lakes are the priority of environmental crisis to resolve. Signed by 9 ministers
to confirm the 15 lakes becoming the priority lakes of 2010-2014 periods.
Severe ecosystem degradation happened in many lakes high sedimentation, land conversion in watershed, water pollution etc., that disturbed the functions of the lake.

INTRODUCTION
Assessment criteria of designated priority lakes are :
1. Lake damage: the level of sedimentation, pollution, eutrophication, highly reducing quality and quantity of water.
2. Lake utilization : hydropower plant (PLTA), agriculture, fisheries (aquaculture/floating cage), usable water, religious and culture values, tourism (including lake uniqueness, accessibility, amenity (infrastructure and society condition)
3. Local government’s and the society’s commitment to wisely manage the lakes (master plan, local regulation (perda), managing committee).
4. Strategic lake : lakes featuring strategic functions of national interest
5. Biodiversity (including: endemic fish species, aves and vegetation).
6. C carbon urgency (the challenge against global climate change)
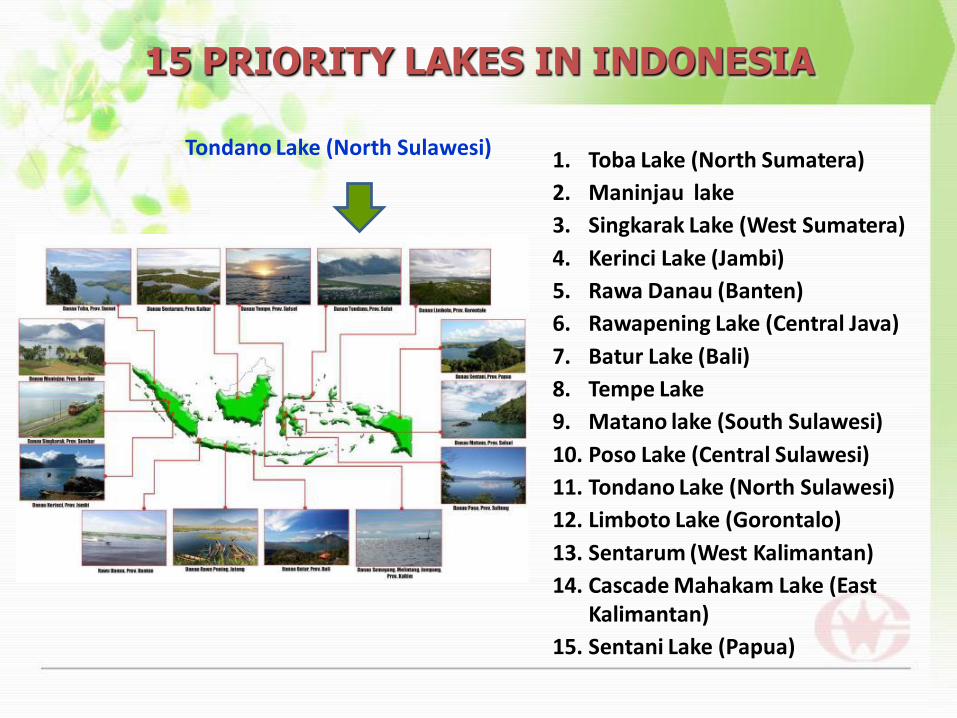
15 PRIORITY LAKES IN INDONESIA
1. Toba Lake (North Sumatera)
2. Maninjau lake
3. Singkarak Lake (West Sumatera)
4. Kerinci Lake (Jambi)
5. Rawa Danau (Banten)
6. Rawapening Lake (Central Java)
7. Batur Lake (Bali)
8. Tempe Lake
9. Matano lake (South Sulawesi)
10. Poso Lake (Central Sulawesi)
11. Tondano Lake (North Sulawesi)
12. Limboto Lake (Gorontalo)
13. Sentarum (West Kalimantan)
14. Cascade Mahakam Lake (East Kalimantan)
15. Sentani Lake (Papua)
Tondano Lake (North Sulawesi)

STUDY AREA (TONDANO LAKE)
It is located in north Sulawesi province, and it is one of the priority lakes
Danau Tondano
The lake has environmental problems related to land conversion, high sedimentation, water quality and fast growing of aquatic plant
87 percent of fish production in freshwater of this province were fulfilled from Tondano lake
The lake have been utilized for hydroelectric power plant, freshwater fish, drinking water, irrigation, eco tourism and flood control

PURPOSES
1. To utilize remote sensing satellite data for supporting Indonesia government program for lake rescue
2. To monitor the land cover change in watershed and lake quality change including lake area, aquatic plant distribution, water quality (Total Suspended Solid and water transparency) using multi temporal data.

DATA USED
Satellite Data Landsat TM/ETM+ (Spatial 30 m) and SPOT-4 (spatial 20 m) for period
1990-2011 SRTM DEMver. 4.1 (Spatial resolution 90 m) High resolution IKONOS (Spatial 1 m) in 2003 and 2011.
Others data Topography map 1: 50.000 scale Field survey (land cover and water quality)
Landsat: 30 m SPOT: 20 m IKONOS: 1 m SRTM: 90 m

METODOLOGY
Landsat and SPOT data
Orthorectification and
radiometric
Data Normalization
Map, SRTM
Land cover RGB
composite
Lake area Aquatic veg.
distribution
Field
measurement
AlgorithmWater quality
TSS and water
transparency
Multi temporal analysis
Result
• Sun correction
• atmospheric correction
Spectrometer
measurement

NORMALIZATION FOR LANDSAT – SPOT 4 DATA
Normalization were conducted for each band to standardize different satellite
sensor/different spectral range (Landsat and SPOT)

RESULT OF DATA NORMALIZATION
Data relatively has same value for the same object

TOPOGRAFY AND WATERSHED BOUNDARY
-27 m
0 m
Kontur Interval 2 m
DanauTondano
Sumber: peta RBI dan Peta bathimetri tondano
Sumber: DEM dan Peta RBI
SRTM DEM was fused with topography map
using DEM integration method
3D of Tondano lake`s watershed
Watershed boundary generation

LAND COVER OF TONDANO LAKE IN 1990
Water body
Forest
Plantation
Mixied Plantation
Dry agriculture
Open land
Urban
Swamp
Paddy field
Administration boundary
Legend
Shrubs/bushes
Classification by visual interpretation, and verified using high resolution
data and field measurement

Water body
Forest
Plantation
Mixed Plantation
Dry agriculture
Open land
Urban
Swamp
Paddy field
Shrubs/bushes
Administration boundary
Legend
Land cover of Tondano Lake in 2003
LAND COVER OF TONDANO LAKE IN 2003

Water body
Forest
Plantation
Mixed Plantation
Dry agriculture
Open land
Urban
Swamp
Paddy field
Administration boundary
Legend
Land cover of Tondano Lake in 2011
LAND COVER OF TONDANO LAKE IN 2011
Shrubs/bushes

LAND COVER CHANGE IN PERIODE 1990-2011
Signification change of land cover in Tondano Lake`s
watershed in period 1990-2011

LAKE AREA AND AQUATIC PLANTS DISTRIBUTION
Aquatic plants
Delineation lake
area including
aquatic plant
Previous research:
RED : NIR + SWIR
GREEN : NIR
BLUE : NIR - RED
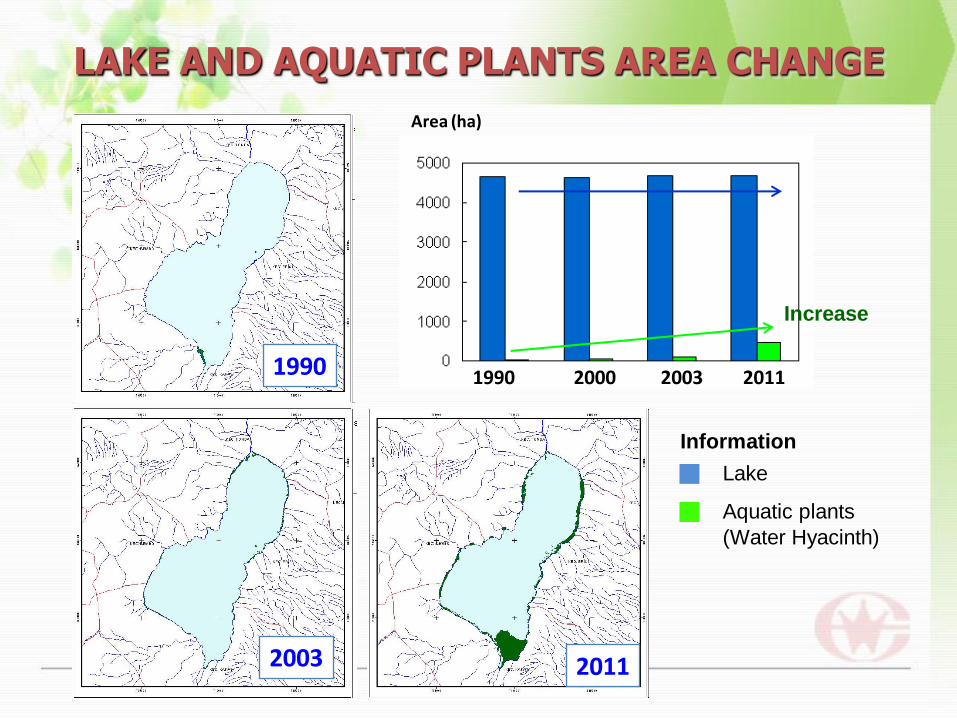
LAKE AND AQUATIC PLANTS AREA CHANGE
1990 2000 2003 2011
Area (ha)
Aquatic plants
(Water Hyacinth)
Lake
Information
2003
1990
2011
Increase

LAKE AND AQUATIC PLANTS AREA CHANGE
1990 2000 2003 2011
Area (ha)
Increase
Area in 2011
(ha)

AQUACULTURE IN TONDANO LAKE
Citra IKONOS 2003 (1 m) Citra Landsat 2003 (30 m)
Possible for wide cages, but difficult for small cages
Can be easily indentified
Aquaculture in Tondano lake
Used IKONOS data to identify and map Aquaculture area in Tondano lake
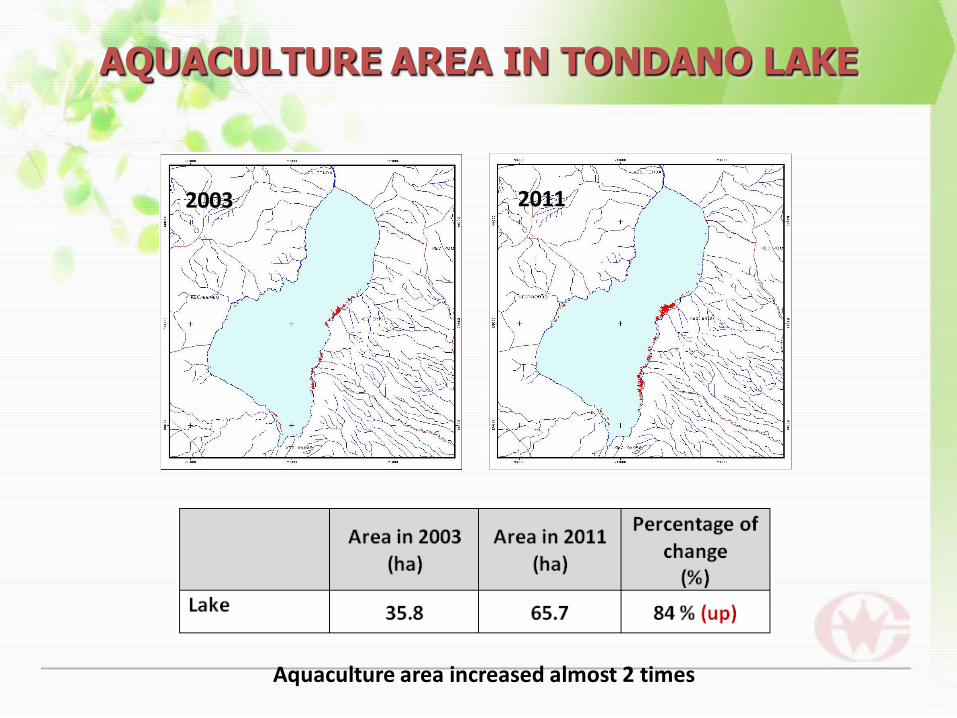
AQUACULTURE AREA IN TONDANO LAKE
2003 2011
Aquaculture area increased almost 2 times

AQUA CULTURE AREA IN TONDANO LAKE
2003
2011
Aqua culture areaAquatic plants area
2003
2011
Aquatic plants covered cages, and disturb the aquaculture activity

FIELD MEASUREMENT FOR WATER QUALITY
Spectrometer measurement
Sampling for TSS Water transparency measurement
Other water quality parameters measurement
Develop water quality algorithm using bio-optical model

SPECTROMETER MEASUREMENT RESULTS
0
5
10
15
20
25
30
35
40
45
50
400 500 600 700 800 900
S1
S2
S3
S4
S5
S6
S7
S8
S9
S10
S11
S12
S13
S14
S15
Wavelength( m)
Reflecta
nce (%
)
0
5
10
15
20
25
30
35
40
45
480 560 660 840
S1
S2
S3
S4
S5
S6
S7
S8
S9
S10
S11
S12
S13
S14
S15
Wavelength( m)
Refl
ecta
nce
Spectral reflectance of water in different TSS concentration (less than 20 mg/l)
Spectral respond of Landsat sensor b1-4
Calibrated spectral reflectance in Landsat band 1 - 4
Band 1 – 3 has capability to differ TSS concentration (low concentration)
Band 4 is almost absorbed by water
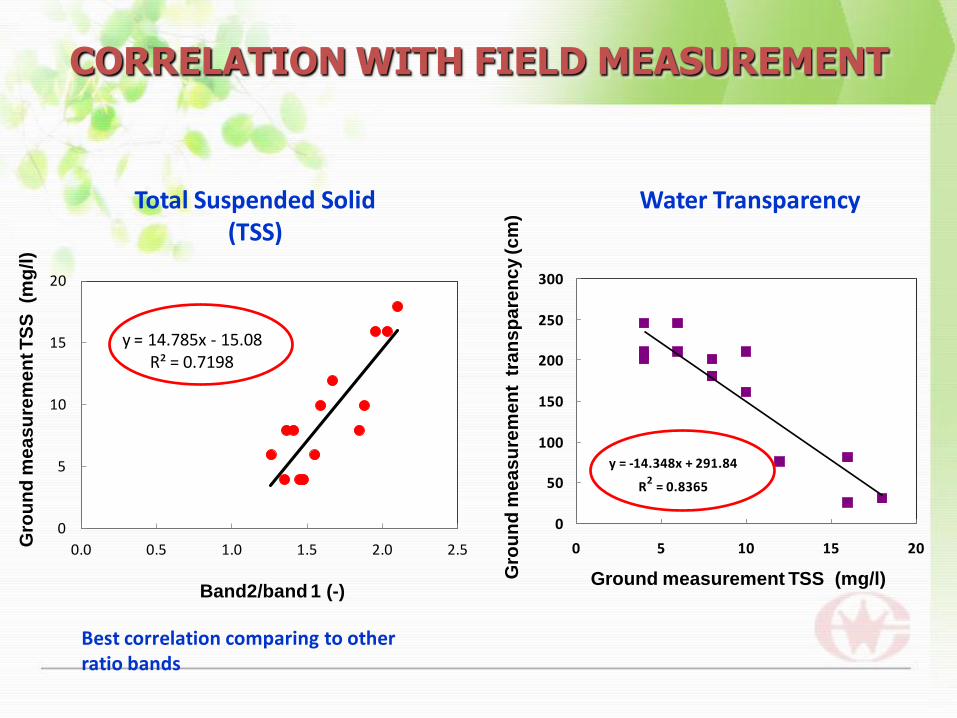
CORRELATION WITH FIELD MEASUREMENT
Band2/band 1 (-)
Gro
un
d m
ea
su
rem
en
t T
SS
(m
g/l
)
y = 14.785x - 15.08R² = 0.7198
0
5
10
15
20
0.0 0.5 1.0 1.5 2.0 2.5
y = 1.8317e0.162x
R2 = 0.8367
0
10
20
30
40
50
60
0 5 10 15 20
y = -14.348x + 291.84
R2 = 0.8365
0
50
100
150
200
250
300
0 5 10 15 20
TSM (mg/l)
Tu
rbid
ity (N
TU
)
TSM (mg/l)
Ke
ce
rah
an
(cm
)
Ground measurement TSS (mg/l)Gro
un
d m
ea
su
rem
en
t t
ran
sp
are
nc
y (c
m)
Total Suspended Solid (TSS)
Water Transparency
Best correlation comparing to other ratio bands

TSS IN PERIOD 1990-2011
1990 2001 2003 2011
High TSS concentrated along shoreline of the lake,
and the value of TSS ranged from 0 – 40 mg/l
They were lower comparing to Criteria of water quality
standard (Government regulation. No.82, 2001) water
drinking, aquaculture and tourism activities

WATER TRANSPARENCY IN PERIODE 1990-2011
1990 2001 2003 2011
Water transparency for aquaculture ranges 1-2 m
(Mantau et al., 2004)
The results were almost better comparing to the range,
except along shoreline in the western part of the lake
which has low transparency.

CONCLUSION
1. Remote sensing data can be utilized to monitor the change in watershed and lake quality
2. It is found that land conversion happened in watershed of the lake (forest decreased, urban and agricultural area increased). The forest area in 2011 was remained 6.5 % from the total watershed area.
3. Lake area was relatively same, but aquatic plant significantly increased, which disrupted the aquaculture activity
4. Water quality slightly decreased along period 1990-2011, but it was still fulfilled the standard for aquaculture.

THANK YOU FOR YOUR ATTENTION