hw brochure 2006 final - icsc | holiday watch 2013holiday.icsc.org/2006/hw06_fullguide.pdf · 9...
TRANSCRIPT


HOLIDAY WATCHMEDIA GUIDE: 2006 HOLIDAY FACTS & FIGURES
TABLE OF CONTENTS
1 Welcome Letter
2 Media Alert
3 What’s Hot This Season?
4 Holiday Fun Facts
6 Top Ten Holiday Shopping Days
How Many Shopping Days Between Thanksgiving & Christmas
7 Weekly Distribution of Holiday Sales
8 Tracking Traditional Holiday Season Sales
Tracking New Holiday Season Sales
9 Shifting Importance of November GAFO Store Sales
Shifting Importance of December GAFO Store Sales
10 Shifting Importance of January GAFO Store Sales
11 Regional Non-Anchor Mall Holiday Sales – Traditional Season
Regional Non-Anchor Mall Holiday Sales – New Season
12 Traditional Holiday Season Spending
13 New Holiday Season Spending
14 Michael P. Niemira Biography
2006 MEDIA GUIDE HOLIDAY WATCH 1
s the 2006 holiday season approaches, the International Council of Shopping Centers, Inc.
(ICSC) is pleased to provide you with its annual Holiday Media Guide.
ICSC will be releasing weekly holiday sales figures throughout the holiday season, beginning
Tuesday, November 28. The sales figures, which provide a week-over-week and year-over-year
comparison, will be available on ICSC’s Holiday Watch website http://holiday.icsc.org at
7:45 a.m.
Once again, our Holiday Media Guide contains the Hot Gifts list, information on overall holiday
GAFO sales, the weekly distribution of holiday sales, the percentage of sales during Thanksgiving
weekend, and the top ten holiday shopping days. In addition, we have added some new charts
and sales measures to assist you in understanding the holiday selling season. For your reference,
in this document these measures are referred to as:
NRSE (National Retail Sales Estimate) is a weekly and daily estimate of U.S. nationwide and
regional GAFO store-type sales compiled by ShopperTrak.
GAFO Store Sales are sales generated at stores that specialize in department-store type merchan-
dise (General merchandise, Apparel and Accessory, Furniture, and Other which includes electronics,
computer, sporting goods, music, books, hobby, office supplies, stationery and gift stores). These
data are compiled by the U.S. Department of Commerce.
Non-Anchor Mall Sales are those receipts generated by non-anchor tenants at regional and super-
regional malls in the United States. These data are compiled by ICSC from a representative sample
of 520 malls (currently) and cover stores selling apparel, furnishings, stationery/cards/gifts/novelty,
books, sporting goods/bicycles, toys/educational/hobby, personal care, jewelry, other GAFO-type
merchandise, food service and other non-GAFO merchandise and services.
Shopping-Center-Inclined Retail Sales are compiled from U.S. Census Bureau retail sales data.
This series includes general merchandise, apparel, furniture, electronic and “other” store sales
(GAFO) plus health and personal care store sales, food and beverage sales and building materials.
In addition, ICSC will be releasing the results of a number of consumer surveys. Results will be
posted on ICSC’s Holiday Watch website at http://holiday.icsc.org throughout the holiday season.
So, as you begin to make our holiday season plans, remember to look to ICSC as your source for
holiday-related information.
Happy Holidays from ICSC !
A

HOLIDAY WATCH 2006 MEDIA GUIDE2
MEDIA ALERT
CONTACTS:
WHAT:
WHEN:
International Council of Shopping Centers, Inc. (ICSC)
Malachy Kavanagh, Patrice Duker, Erin Hershkowitz
+1 646 728-3495/3496/3497
The International Council of Shopping Centers, Inc. (ICSC) will release its Weekly Chain Store
Sales Snapshot, a weekly report that measures nominal same-store or comparable-store sales
excluding restaurant and vehicle demand, throughout the holiday season beginning Tuesday,
November 28, 2006.
The weekly index is constructed using sales-weighted geometric average growth rates to
preserve long-term consistency and is statistically benchmarked to a broad-based monthly
retail industry sales aggregate that represents approximately 76 retail chain stores, which
is compiled by ICSC.
Retail sales reports will be released at 7:45 a.m. Eastern Standard Time on:
DATE OF RELEASE DATA PERIOD
Tuesday, November 28, 2006 November 19 – November 25, 2006
Tuesday, December 5, 2006 November 26 – December 2, 2006
Tuesday, December 12, 2006 December 3 – December 9, 2006
Tuesday, December 19, 2006 December 10 – December 16, 2006
Wednesday, December 27, 2006 December 17 – December 23, 2006
Wednesday, January 3, 2007 December 24 – December 30, 2006
Tuesday, January 9, 2007 December 31 – January 6, 2007
Wednesday, January 17, 2007 January 7 – January 13, 2007
Tuesday, January 23, 2007 January 14 – January 20, 2007
INTERVIEW OPPORTUNITY: ICSC’s Chief Economist and Director of
Research, Michael P. Niemira, is available to provide in-depth analysis,
including consumer perceptions, purchasing patterns, and trends. Telephone
and in-person interviews can be arranged. Please call ICSC’s Media Relations
Department at +1 646-728-3497/3496 to arrange an interview.
Founded in 1957, ICSC is the premier global trade association of the
shopping center industry and services its over 63,000 members in 100
countries by assisting in the development of their businesses through
professional education, conferences and conventions, publications,
research and legislative action.

2006 MEDIA GUIDE HOLIDAY WATCH 3
WHAT’S HOT THIS SEASON?TOYS*
�Princess Genevieve Barbie
�T.M.X Elmo
�Bratz Forever Diamondz
�Butterscotch My Furreal Friends Pony
�Digi Makeover
�Fly Wheels XPV
�Kid Tough Digital Camera
�LEGO Mindstorms NXT
�Magtastik
�Monopoly Here & Now
�Speed Stacks Stackpack
�Nintendo’s WII
JEWELRY
�Long necklaces
�Sterling silver
CARDS/GIFTS/BOOKS
�Gift cards
�Blankets for lounging; throws
�Hotel-collection luxury items
APPAREL & ACCESSORIES
�Black
�Skinny Jeans
�Tunic shirts; tunic sweaters
�Wrap-style dresses
�Belts
�Cashmere
�Sweaters over shirts or camis
�Cardigans and vests
�Belted sweater coats
�Round-toe shoes; ballet shoes
�Wedge heel
MUSIC/ENTERTAINMENT/
SOFTWARE
� iPod accessories – docking station; cases;
wireless remote controls, etc.
�Cell phones with built-in MP3 capabilities
�Downloadable ring tones and ring backs
�Wireless accessories; Bluetooth
*Source: Toy Wishes magazine

HOLIDAY WATCH 2006 MEDIA GUIDE4
HOLIDAY FUN FACTS
HOLIDAY FACTS
This year, most malls will begin decorating for
the holidays on…November 1
The percentage of malls that include décor for
Christmas…95 percent
The percentage of malls that include décor for
Hanukkah…7.2 percent
The percentage of malls that include décor for
Kwanza…1.2 percent
The holiday song played most frequently last year
was…Jingle Bells
The second-most frequently played song was…
White Christmas
The percentage of malls that observed an increase in gift
certificate sales (year over year)…49 percent
The percentage of mall-based gift certificates
redeemed the first week after Christmas…30 percent
(ranged from 0 - 85 percent)
The percentage of mall-based gift certificates
redeemed in January…30 percent
(ranged from 0 - 80 percent)
The percentage of mall-based gift certificates
redeemed in February…10 percent
(ranged from 0 - 30 percent)
The average number of temporary kiosks malls will
add during the 2006 holiday season…12
The average number of temporary in-line tenants a
mall will add during the 2006 holiday season…4
100 percent of malls have extended holiday hours,
on average, they begin on…November 24,
Day after Thanksgiving
61 percent of malls offer special amenities for holiday
shoppers, they typically include… Gift wrapping
The average number of gifts wrapped per mall for the
2005 holiday season…2,324
The most common mode of advertising for the
2006 holiday season…Internet

2006 MEDIA GUIDE HOLIDAY WATCH 5
SANTA CLAUS AT THE MALL
The average number of children visited by Santa during
the holiday season…7,829
The average number of full-time Santa’s employed per
mall in 2005…2
The average number of Santa’s per mall that will be
employed in 2006…2
Santa Claus will arrive at most malls on…
November 18
The average number of children Santa sees per day is
greater than…80
The percentage of malls that will mark Santa’s arrival
with a special event…87 percent
The most common method of arrival will be…
A parade
(Other methods include on a fire engine, by horse-drawn
sleigh or during a children’s breakfast.)
The number of pictures that were taken with
Santa Claus per mall in 2005…4,633
The percentage of malls that offer pet photos with
Santa…80 percent
What does Santa give to those who visit him?
Coloring books, activity books
HOLIDAY SPIRIT
The percentage of malls that plan to organize an
activity to raise money or merchandise for a charity
this year…88 percent
The most popular activities for malls to raise money
or merchandise for a charity are…Toy drives, Festival
of Giving, Giving Tree
The hottest gifts of the season are expected to be…
iPods, TMX Tickle Me Elmo
Source: International Council of Shopping Centers, Inc. (ICSC)
Based on a survey of nearly 100 enclosed malls.
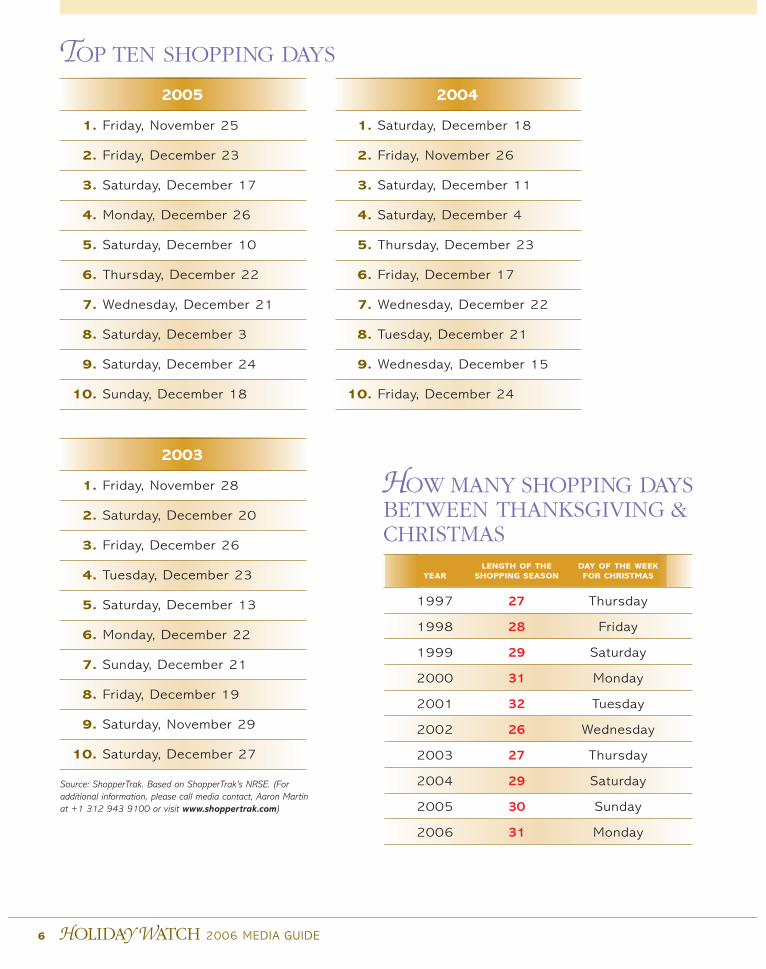
HOW MANY SHOPPING DAYSBETWEEN THANKSGIVING &CHRISTMAS
LENGTH OF THE DAY OF THE WEEKYEAR SHOPPING SEASON FOR CHRISTMAS
1997 27 Thursday
1998 28 Friday
1999 29 Saturday
2000 31 Monday
2001 32 Tuesday
2002 26 Wednesday
2003 27 Thursday
2004 29 Saturday
2005 30 Sunday
2006 31 Monday
HOLIDAY WATCH 2006 MEDIA GUIDE6
TOP TEN SHOPPING DAYS
2005
1. Friday, November 25
2. Friday, December 23
3. Saturday, December 17
4. Monday, December 26
5. Saturday, December 10
6. Thursday, December 22
7. Wednesday, December 21
8. Saturday, December 3
9. Saturday, December 24
10. Sunday, December 18
Source: ShopperTrak. Based on ShopperTrak’s NRSE. (For
additional information, please call media contact, Aaron Martin
at +1 312 943 9100 or visit www.shoppertrak.com)
2003
1. Friday, November 28
2. Saturday, December 20
3. Friday, December 26
4. Tuesday, December 23
5. Saturday, December 13
6. Monday, December 22
7. Sunday, December 21
8. Friday, December 19
9. Saturday, November 29
10. Saturday, December 27
2004
1. Saturday, December 18
2. Friday, November 26
3. Saturday, December 11
4. Saturday, December 4
5. Thursday, December 23
6. Friday, December 17
7. Wednesday, December 22
8. Tuesday, December 21
9. Wednesday, December 15
10. Friday, December 24

2006 MEDIA GUIDE HOLIDAY WATCH 7
WEEKLY DISTRIBUTION OF HOLIDAYSALES1
*THE THANKSGIVING WEEKEND RUSH
Source: ShopperTrak. Based on ShopperTrak’s NRSE. (For additional information, please call media contact,
Aaron Martin at +1 312 943 9100 or visit www.shoppertrak.com)
1The Season is defined as November 20, 2005 through December 31, 2005
Weekly Distribution of 2005 Holiday Sales
Sunday, November 20 – Saturday, November 26 . . . . . . . . . . . . . . 14.9%*Sunday, November 27 – Saturday, December 3 . . . . . . . . . . . . . . . 13.7%
Sunday, December 4 – Saturday, December 10 . . . . . . . . . . . . . . . 15.1%
Sunday, December 11 – Saturday, December 17 . . . . . . . . . . . . . . 17.7%
Sunday, December 18 – Saturday, December 24 . . . . . . . . . . . . . . 23.0%
Sunday, December 25 – Saturday, December 31 . . . . . . . . . . . . . . 15.6%
Percentage of Holiday Season Sales occurring on Thanksgiving Weekend 2005
November 25 – 27, 2005 (Thanksgiving Weekend) . . . . . . . . . . . . . 9.6%
Percentage of Holiday Season Sales occurring on Thanksgiving Weekend 2004
November 26 – 28, 2004 (Thanksgiving Weekend) . . . . . . . . . . . . . 9.2%
Weekly Distribution of 2004 Holiday Sales
Sunday, November 21 – Saturday, November 27 . . . . . . . . . . . . . . 13.3%*Sunday, November 28 – Saturday, December 4 . . . . . . . . . . . . . . . 16.7%
Sunday, December 5 – Saturday, December 11 . . . . . . . . . . . . . . . 18.2%
Sunday, December 12 – Saturday, December 18 . . . . . . . . . . . . . . 22.5%
Sunday, December 19 – Saturday, December 25 . . . . . . . . . . . . . . 19.1%
Sunday, December 26 – Saturday, January 1, 2005 . . . . . . . . . . . . 10.3%

HOLIDAY WATCH 2006 MEDIA GUIDE8
TRACKING TRADITIONAL HOLIDAY SEASON SALES(November-December Period)Based on GAFO Store Sales, Not Seasonally Adusted, Year-over Year Percentage
Sources: U.S Department of Commerce; International Council of Shopping Centers, Inc. (ICSC)
YEAR NOVEMBER DECEMBERNOV/DEC SHARE OF
COMBINED CALENDAR-YEAR SALES
1985 6.9 5.9 6.3 24.81986 5.0 9.4 7.6 24.71987 4.8 7.7 6.6 24.61988 11.3 10.2 10.6 25.31989 8.3 3.8 5.5 24.81990 1.0 -0.7 -0.0 24.01991 3.6 2.5 2.9 24.01992 4.9 9.4 7.6 24.31993 7.9 5.8 6.6 24.31994 8.8 8.2 8.4 24.41995 5.7 2.3 3.7 24.01996 3.1 2.6 2.8 23.51997 3.7 3.9 3.9 23.31998 5.4 6.1 5.8 23.21999 6.6 9.2 8.1 23.32000 6.7 1.8 3.7 22.92001 3.7 3.2 3.4 23.12002 1.5 0.6 1.0 22.62003 3.9 5.3 4.7 22.82004 4.3 5.7 5.2 22.52005 6.5 4.6 5.4 22.5
TRACKING NEW HOLIDAY SEASON SALES(November-January Period)Based on GAFO Store Sales, Not Seasonally Adjusted, Fiscal Year (February-January)
Sources: U.S Department of Commerce; International Council of Shopping Centers, Inc. (ICSC)
YEAR NOV-DEC JAN NOV-JANSHARE OF
FISCAL-YEAR SALES
1985 6.3 7.6 6.6 31.31986 7.6 7.3 7.5 31.21987 6.6 5.2 6.3 31.11988 10.6 11.4 10.8 31.91989 5.5 5.9 5.6 31.41990 -0.0 -0.7 -0.2 30.41991 2.9 8.5 4.1 30.51992 7.6 8.2 7.7 31.11993 6.6 4.0 6.1 30.91994 8.4 10.3 8.8 31.01995 3.7 3.5 3.6 30.61996 2.8 8.9 4.1 30.21997 3.9 7.1 4.6 30.31998 5.8 6.6 6.0 30.21999 8.1 5.6 7.5 30.22000 3.7 6.4 4.4 29.82001 3.4 3.9 3.5 30.22002 1.0 3.1 1.5 29.62003 4.7 8.4 5.6 30.12004 5.2 3.4 4.7 29.72005 5.4 8.1 6.0 29.8

2006 MEDIA GUIDE HOLIDAY WATCH 9
SHIFTING IMPORTANCE OF NOVEMBER GAFO STORE SALESNovember Percentage of Annual Sales
10.0%
9.5%
9.0%
8.5%
8.0%
85 86 87 88 89 90 91 92 93 94 95 96 97 98 99 00 01 02 03 04 05
10.0%
9.7%
9.5%
9.8%
9.9%
9.6%
9.7%
9.6%
9.7%
9.8% 9.8%
9.6%
9.5%
9.4% 9.4% 9.4%
9.6%
9.4% 9.4%
9.2%
9.3%
Sources: U.S Department of Commerce; International Council of Shopping Centers, Inc. (ICSC)
SHIFTING IMPORTANCE OF DECEMBER GAFO STORE SALESDecember Percentage of Annual Sales
16.0%
15.5%
15.0%
14.5%
13.5%
14.0%
12.0%
85 86 87 88 89 90 91 92 93 94 95 96 97 98 99 00 01 02 03 04 05
14.8%
15.0%15.1%
15.5%
14.9%
14.3%14.3%
14.7%14.6%14.6%
14.2%
13.9%13.8%13.8%
14.0%
13.4%
13.6%
13.2%
13.4%13.3%
13.2%
Sources: U.S Department of Commerce; International Council of Shopping Centers, Inc. (ICSC)
PERCEN
TAG
E S
HARE O
F A
NN
UAL S
ALES
PERCEN
TAG
E S
HARE O
F A
NN
UAL S
ALES

HOLIDAY WATCH 2006 MEDIA GUIDE10
SHIFTING IMPORTANCE OF JANUARY GAFO STORE SALESJanuary Percentage of Annual Sales
PERCENTAGE SHARE OF ANNUAL SALES
7.5%
7.0%
6.5%
6.0%
5.5%
85 86 87 88 89 90 91 92 93 94 95 96 97 98 99 00 01 02 03 04 05
6.7%
6.6%
6.5%
6.7%
6.6%
6.4%
6.7%
6.8%
6.7%
6.8%
6.7%
6.9%
7.1% 7.1%
7.0% 7.0%
7.1% 7.1%
7.4%
7.2%
7.4%
Sources: U.S Department of Commerce; International Council of Shopping Centers, Inc. (ICSC)
PERCEN
TAG
E S
HARE O
F A
NN
UAL S
ALES
2006 MEDIA GUIDE HOLIDAY WATCH 11
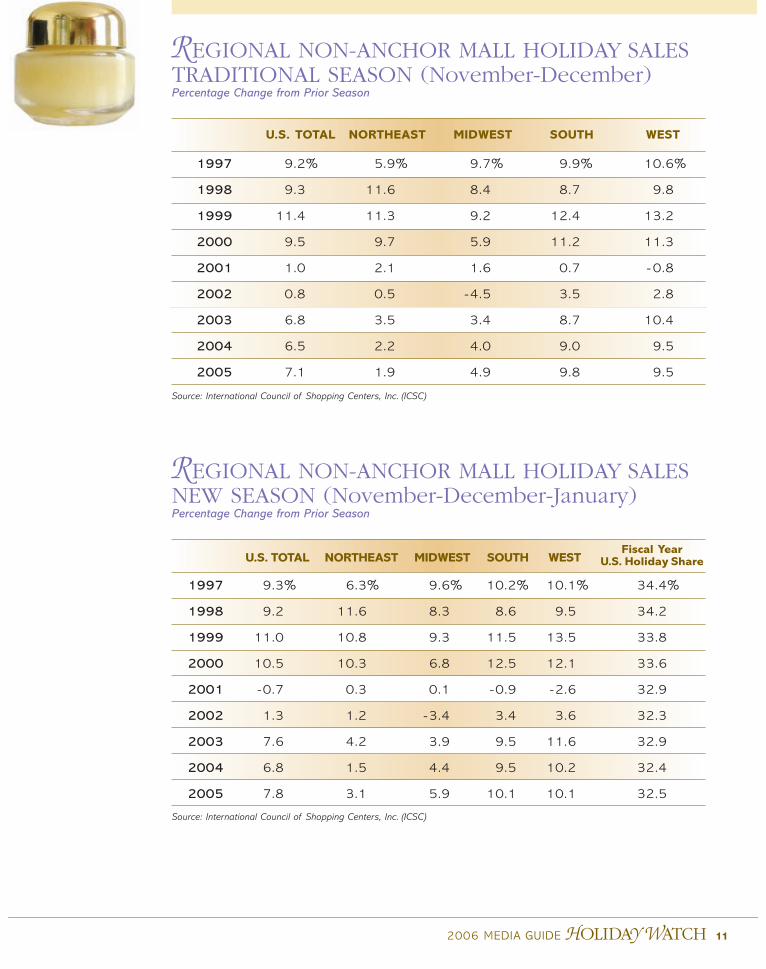
Source: International Council of Shopping Centers, Inc. (ICSC)
REGIONAL NON-ANCHOR MALL HOLIDAY SALESTRADITIONAL SEASON (November-December)Percentage Change from Prior Season
U.S. TOTAL NORTHEAST MIDWEST SOUTH WEST
1997 9.2% 5.9% 9.7% 9.9% 10.6%
1998 9.3 11.6 8.4 8.7 9.8
1999 11.4 11.3 9.2 12.4 13.2
2000 9.5 9.7 5.9 11.2 11.3
2001 1.0 2.1 1.6 0.7 -0.8
2002 0.8 0.5 -4.5 3.5 2.8
2003 6.8 3.5 3.4 8.7 10.4
2004 6.5 2.2 4.0 9.0 9.5
2005 7.1 1.9 4.9 9.8 9.5
Source: International Council of Shopping Centers, Inc. (ICSC)
REGIONAL NON-ANCHOR MALL HOLIDAY SALESNEW SEASON (November-December-January)Percentage Change from Prior Season
Fiscal YearU.S. TOTAL NORTHEAST MIDWEST SOUTH WEST U.S. Holiday Share
1997 9.3% 6.3% 9.6% 10.2% 10.1% 34.4%
1998 9.2 11.6 8.3 8.6 9.5 34.2
1999 11.0 10.8 9.3 11.5 13.5 33.8
2000 10.5 10.3 6.8 12.5 12.1 33.6
2001 -0.7 0.3 0.1 -0.9 -2.6 32.9
2002 1.3 1.2 -3.4 3.4 3.6 32.3
2003 7.6 4.2 3.9 9.5 11.6 32.9
2004 6.8 1.5 4.4 9.5 10.2 32.4
2005 7.8 3.1 5.9 10.1 10.1 32.5
HOLIDAY WATCH 2006 MEDIA GUIDE12
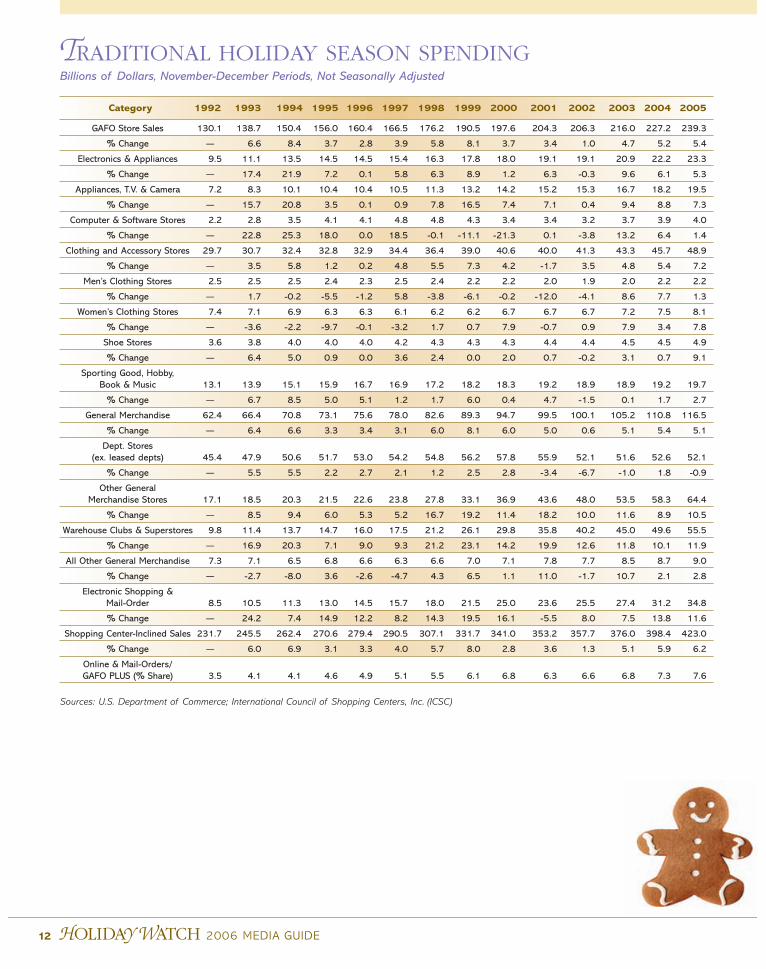
TRADITIONAL HOLIDAY SEASON SPENDINGBillions of Dollars, November-December Periods, Not Seasonally Adjusted
Sources: U.S. Department of Commerce; International Council of Shopping Centers, Inc. (ICSC)
Category 1992 1993 1994 1995 1996 1997 1998 1999 2000 2001 2002 2003 2004 2005
GAFO Store Sales 130.1 138.7 150.4 156.0 160.4 166.5 176.2 190.5 197.6 204.3 206.3 216.0 227.2 239.3
% Change – 6.6 8.4 3.7 2.8 3.9 5.8 8.1 3.7 3.4 1.0 4.7 5.2 5.4
Electronics & Appliances 9.5 11.1 13.5 14.5 14.5 15.4 16.3 17.8 18.0 19.1 19.1 20.9 22.2 23.3
% Change – 17.4 21.9 7.2 0.1 5.8 6.3 8.9 1.2 6.3 -0.3 9.6 6.1 5.3
Appliances, T.V. & Camera 7.2 8.3 10.1 10.4 10.4 10.5 11.3 13.2 14.2 15.2 15.3 16.7 18.2 19.5
% Change – 15.7 20.8 3.5 0.1 0.9 7.8 16.5 7.4 7.1 0.4 9.4 8.8 7.3
Computer & Software Stores 2.2 2.8 3.5 4.1 4.1 4.8 4.8 4.3 3.4 3.4 3.2 3.7 3.9 4.0
% Change – 22.8 25.3 18.0 0.0 18.5 -0.1 -11.1 -21.3 0.1 -3.8 13.2 6.4 1.4
Clothing and Accessory Stores 29.7 30.7 32.4 32.8 32.9 34.4 36.4 39.0 40.6 40.0 41.3 43.3 45.7 48.9
% Change – 3.5 5.8 1.2 0.2 4.8 5.5 7.3 4.2 -1.7 3.5 4.8 5.4 7.2
Men’s Clothing Stores 2.5 2.5 2.5 2.4 2.3 2.5 2.4 2.2 2.2 2.0 1.9 2.0 2.2 2.2
% Change – 1.7 -0.2 -5.5 -1.2 5.8 -3.8 -6.1 -0.2 -12.0 -4.1 8.6 7.7 1.3
Women’s Clothing Stores 7.4 7.1 6.9 6.3 6.3 6.1 6.2 6.2 6.7 6.7 6.7 7.2 7.5 8.1
% Change – -3.6 -2.2 -9.7 -0.1 -3.2 1.7 0.7 7.9 -0.7 0.9 7.9 3.4 7.8
Shoe Stores 3.6 3.8 4.0 4.0 4.0 4.2 4.3 4.3 4.3 4.4 4.4 4.5 4.5 4.9
% Change – 6.4 5.0 0.9 0.0 3.6 2.4 0.0 2.0 0.7 -0.2 3.1 0.7 9.1
Sporting Good, Hobby, Book & Music 13.1 13.9 15.1 15.9 16.7 16.9 17.2 18.2 18.3 19.2 18.9 18.9 19.2 19.7
% Change – 6.7 8.5 5.0 5.1 1.2 1.7 6.0 0.4 4.7 -1.5 0.1 1.7 2.7
General Merchandise 62.4 66.4 70.8 73.1 75.6 78.0 82.6 89.3 94.7 99.5 100.1 105.2 110.8 116.5
% Change – 6.4 6.6 3.3 3.4 3.1 6.0 8.1 6.0 5.0 0.6 5.1 5.4 5.1
Dept. Stores (ex. leased depts) 45.4 47.9 50.6 51.7 53.0 54.2 54.8 56.2 57.8 55.9 52.1 51.6 52.6 52.1
% Change – 5.5 5.5 2.2 2.7 2.1 1.2 2.5 2.8 -3.4 -6.7 -1.0 1.8 -0.9
Other General Merchandise Stores 17.1 18.5 20.3 21.5 22.6 23.8 27.8 33.1 36.9 43.6 48.0 53.5 58.3 64.4
% Change – 8.5 9.4 6.0 5.3 5.2 16.7 19.2 11.4 18.2 10.0 11.6 8.9 10.5
Warehouse Clubs & Superstores 9.8 11.4 13.7 14.7 16.0 17.5 21.2 26.1 29.8 35.8 40.2 45.0 49.6 55.5
% Change – 16.9 20.3 7.1 9.0 9.3 21.2 23.1 14.2 19.9 12.6 11.8 10.1 11.9
All Other General Merchandise 7.3 7.1 6.5 6.8 6.6 6.3 6.6 7.0 7.1 7.8 7.7 8.5 8.7 9.0
% Change – -2.7 -8.0 3.6 -2.6 -4.7 4.3 6.5 1.1 11.0 -1.7 10.7 2.1 2.8
Electronic Shopping & Mail-Order 8.5 10.5 11.3 13.0 14.5 15.7 18.0 21.5 25.0 23.6 25.5 27.4 31.2 34.8
% Change – 24.2 7.4 14.9 12.2 8.2 14.3 19.5 16.1 -5.5 8.0 7.5 13.8 11.6
Shopping Center-Inclined Sales 231.7 245.5 262.4 270.6 279.4 290.5 307.1 331.7 341.0 353.2 357.7 376.0 398.4 423.0
% Change – 6.0 6.9 3.1 3.3 4.0 5.7 8.0 2.8 3.6 1.3 5.1 5.9 6.2
Online & Mail-Orders/GAFO PLUS (% Share) 3.5 4.1 4.1 4.6 4.9 5.1 5.5 6.1 6.8 6.3 6.6 6.8 7.3 7.6

2006 MEDIA GUIDE HOLIDAY WATCH 13
NEW HOLIDAY SEASON SPENDINGBillions of Dollars, November-January Periods, Not Seasonally Adjusted
Sources: U.S. Department of Commerce; International Council of Shopping Centers, Inc. (ICSC)
Category 1992 1993 1994 1995 1996 1997 1998 1999 2000 2001 2002 2003 2004 2005
GAFO Store Sales 166.8 176.9 192.5 199.5 207.8 217.4 230.4 247.8 258.6 267.6 271.5 286.8 300.3 318.3
% Change – 6.1 8.8 3.6 4.1 4.6 6.0 7.5 4.4 3.5 1.5 5.6 4.7 6.0
Electronics & Appliances 13.0 15.2 18.5 19.8 19.8 21.3 22.4 24.4 24.4 25.7 25.6 28.1 29.7 31.7
% Change – 16.6 21.7 7.3 0.0 7.2 5.4 8.9 -0.1 5.5 -0.5 9.9 5.8 6.7
Appliances, T.V. & Camera 9.7 11.1 13.4 13.9 13.9 14.3 15.3 17.8 18.9 20.1 20.3 22.2 24.3 26.4
% Change – 14.3 20.8 3.6 -0.4 2.8 7.0 16.5 6.6 6.4 0.7 9.7 9.2 8.5
Computer & Software Stores 3.3 4.0 5.0 5.9 6.0 7.0 6.9 6.2 4.9 4.8 4.6 5.2 5.4 5.5
% Change – 23.3 24.1 17.2 1.1 17.4 -0.8 -10.1 -22.0 -0.5 -5.0 13.1 4.2 1.9
Clothing and Accessory Stores 37.2 38.0 40.0 40.5 41.1 43.3 45.6 48.5 50.7 50.3 52.2 55.1 57.7 61.9
% Change – 2.2 5.3 1.4 1.4 5.3 5.4 6.3 4.6 -0.8 3.7 5.6 4.7 7.2
Men’s Clothing Stores 3.2 3.2 3.2 3.0 3.0 3.2 3.1 2.9 2.9 2.5 2.4 2.6 2.8 2.9
% Change – 1.0 -0.9 -5.1 0.9 5.2 -4.0 -6.4 -0.7 -12.3 -2.8 8.8 6.6 1.1
Women’s Clothing Stores 14.1 14.8 16.7 17.3 18.5 20.2 21.2 23.6 24.1 25.2 25.6 27.2 28.8 31.0
% Change – 5.2 12.7 3.6 6.9 9.0 5.3 10.9 2.1 4.5 1.9 5.9 6.2 7.6
Shoe Stores 13.0 15.2 18.5 19.8 19.8 21.3 22.4 24.4 24.4 25.7 25.6 28.1 29.7 31.7
% Change – 16.6 21.7 7.3 0.0 7.2 5.4 8.9 -0.1 5.5 -0.5 9.9 5.8 6.7
Sporting Good, Hobby, Book & Music 16.9 17.9 19.6 20.6 21.5 21.9 22.4 23.5 23.9 25.2 24.9 25.3 25.5 26.6
% Change – 6.0 9.5 5.0 4.7 1.7 2.4 4.9 1.6 5.2 -1.0 1.5 0.9 4.3
General Merchandise 78.5 83.5 89.3 92.1 96.8 100.5 107.2 115.3 123.3 129.5 131.6 139.5 147.0 155.0
% Change – 6.3 7.0 3.1 5.1 3.8 6.7 7.5 7.0 5.0 1.6 6.0 5.3 5.5
Dept. Stores (ex. leased depts) 56.5 59.5 62.8 63.9 66.5 68.0 69.3 70.9 72.9 70.4 66.1 65.7 66.7 66.1
% Change – 5.3 5.5 1.8 4.0 2.4 1.8 2.4 2.8 -3.5 -6.1 -0.7 1.6 -1.0
Other General Merchandise Stores 22.0 23.9 26.5 28.1 30.3 32.4 37.9 44.3 50.4 59.1 65.5 73.9 80.2 89.0
% Change – 8.8 10.9 6.0 7.7 6.9 16.9 17.0 13.6 17.4 10.8 12.7 8.6 10.9
Warehouse Clubs & Superstores 12.6 15.0 18.0 19.4 21.7 24.2 29.3 35.3 41.0 48.9 55.4 62.7 68.9 77.1
% Change – 18.5 20.5 7.9 11.6 11.4 21.2 20.4 16.2 19.2 13.3 13.1 9.9 12.0
All Other General Merchandise 9.4 9.0 8.5 8.7 8.6 8.2 8.6 9.1 9.4 10.2 10.1 11.2 11.3 11.8
% Change – -4.2 -5.2 2.2 -0.9 -4.4 4.3 5.3 3.3 9.3 -0.9 10.4 1.1 4.4
Electronic Shopping & Mail-Order 11.5 14.0 15.2 17.5 19.6 21.5 24.5 29.6 34.3 33.5 35.9 39.0 43.5 49.1
% Change – 21.9 8.4 15.1 11.8 9.9 13.7 20.8 15.9 -2.2 7.1 8.4 11.7 12.9
Shopping Center-Inclined Sales 314.6 331.3 354.8 366.0 381.9 398.4 420.7 450.6 467.4 485.3 494.6 521.6 549.6 586.6
% Change – 5.3 7.1 3.2 4.3 4.3 5.6 7.1 3.7 3.8 1.9 5.5 5.4 6.7
Online & Mail-Orders/GAFO PLUS (% Share) 3.5 4.1 4.1 4.6 4.9 5.1 5.5 6.2 6.8 6.5 6.8 6.9 7.3 7.7

HOLIDAY WATCH 2006 MEDIA GUIDE14
BIOGRAPHICAL INFORMATIONMICHAEL P. NIEMIRAStaff Vice President, Chief Economist & Director of Research
International Council of Shopping Centers, Inc.
Michael P. Niemira is the staff vice president, chief economist and director
of research for the International Council of Shopping Centers, Inc. (ICSC).
As the Director of Research, he is responsible for the overall selection,
design, implementation, and dissemination of all research projects under-
taken worldwide by the ICSC. These projects are considered to be at the
forefront of the recognized research in the field. He also oversees the
collection and maintenance of the ICSC Albert Sussman Library, the main
statistical database for the industry, and the largest collection of shopping center related materials
in the world. Mr. Niemira produces the ICSC-UBS Weekly Chain Store Sales Snapshot – a retail sales
monitor – as well as the monthly report, Chain Store Sales Trends.
Before joining ICSC, Mr. Niemira held the position of vice president and senior economist for the
Bank of Tokyo-Mitsubishi, Ltd. (BTM) in New York. Previously, he worked for PaineWebber, Chemical
Bank and Merrill Lynch. Over the years, he has been an adjunct instructor at New York University’s
Stern Graduate School of Business and at the New York Institute of Finance.
Mr. Niemira is on advisory panels for the Conference Board and the Institute for Supply
Management. He has co-authored two books: Forecasting Financial and Economic Cycles, John
Wiley & Sons, 1994, and Trading the Fundamentals, Revised Edition, McGraw Hill, 1998 and
contributes numerous articles to books, journals and magazines.
INTERVIEW OPPORTUNITY: Michael P. Niemira, ICSC’s chief economist and director of research, is
available to provide in-depth analysis, including consumer perceptions, purchasing patterns, and trends.
Telephone and in-person interviews can be arranged. Please call ICSC’s Media Relations Department
at +1 646 728 3497/3496 to arrange an interview.