dear santa, i really tried to be a good retailer this year/media/files/us-files/insights/... ·...
TRANSCRIPT
Toy Store
Snacks
CellularDepartmentstore
Happy holidays
Dear Santa, I Really Tried To Be a Good Retailer This Year...
2017U.S. Holiday Retail Forecast
FTI Consulting, Inc. • 2
Dear Santa,I Really Tried To Be a Good Retailer This Year…by Christa Hart, Khaled Haram and John Yozzo
EXHIBIT 1
Holiday Sales Growth Since 1993(% Change, Year-Over-Year)
10%
8%
Nov-Dec Average
6%
4%
2%
Note: Holiday sales consist of GAFO category sales plus online and other non-store sales on a nominal basis.
Source: U.S. Census Bureau
0%
-2%
-4%
-6% 199
3
199
4
199
5
199
6
1997
199
8
199
9
200
0
200
1
200
2
200
3
200
4
200
5
200
6
200
7
200
8
200
9
2010
2011
2012
2013
2014
2015
2016
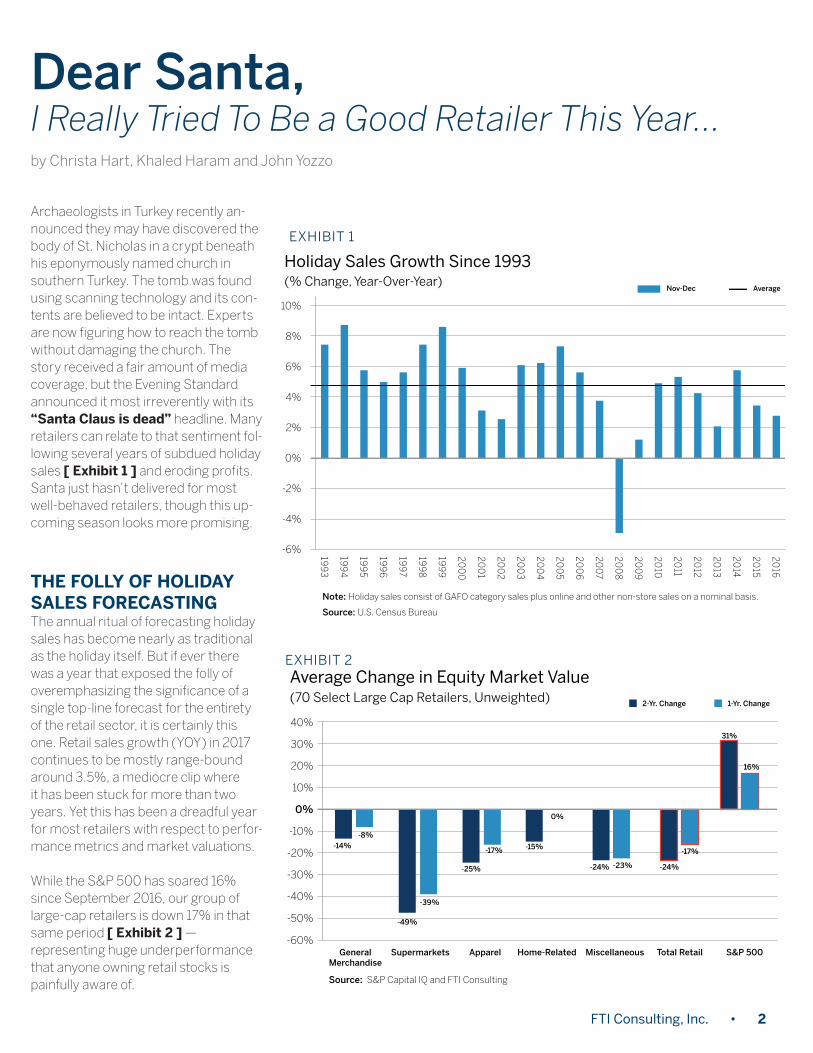
Archaeologists in Turkey recently an-nounced they may have discovered the body of St. Nicholas in a crypt beneath his eponymously named church in southern Turkey. The tomb was found using scanning technology and its con-tents are believed to be intact. Experts are now figuring how to reach the tomb without damaging the church. The story received a fair amount of media coverage, but the Evening Standard announced it most irreverently with its “Santa Claus is dead” headline. Many retailers can relate to that sentiment fol-lowing several years of subdued holiday sales [ Exhibit 1 ] and eroding profits. Santa just hasn’t delivered for most well-behaved retailers, though this up-coming season looks more promising.
THE FOLLY OF HOLIDAY SALES FORECASTINGThe annual ritual of forecasting holiday sales has become nearly as traditional as the holiday itself. But if ever there was a year that exposed the folly of overemphasizing the significance of a single top-line forecast for the entirety of the retail sector, it is certainly this one. Retail sales growth (YOY) in 2017 continues to be mostly range-bound around 3.5%, a mediocre clip where it has been stuck for more than two years. Yet this has been a dreadful year for most retailers with respect to perfor-mance metrics and market valuations.
While the S&P 500 has soared 16% since September 2016, our group of large-cap retailers is down 17% in that same period [ Exhibit 2 ] — representing huge underperformance that anyone owning retail stocks is painfully aware of.
Average Change in Equity Market Value(70 Select Large Cap Retailers, Unweighted)
-60%
-50%
-40%
-30%
-20%
-10%
0%
10%
20%
30%
40%
Source: S&P Capital IQ and FTI Consulting
GeneralMerchandise
-14%
2-Yr. Change 1-Yr. Change
-49%
-25%
-17% -15%
0%
-24% -24%
-17%
31%
16%
-23%
-39%
-8%
Supermarkets Apparel Home-Related Miscellaneous Total Retail S&P 500
EXHIBIT 2
U.S. Holiday Retail Forecast
FTI Consulting, Inc. • 3
Holiday sales will surely exhibit at least moderate growth this season, and the backdrop for a better-than-average season is in place. But whether total holiday sales increase by 3% or 4% or 5% this season hardly seems consequential in the larger context of the upheaval afflicting most store-based retail chains.
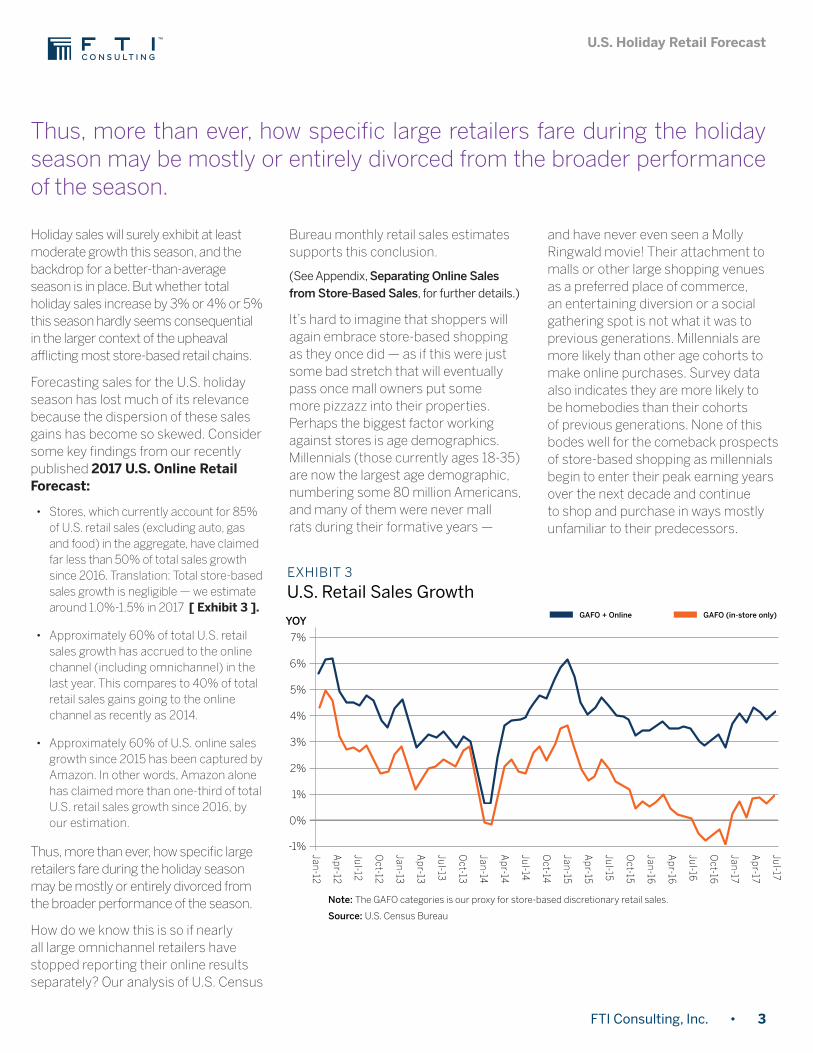
Forecasting sales for the U.S. holiday season has lost much of its relevance because the dispersion of these sales gains has become so skewed. Consider some key findings from our recently published 2017 U.S. Online Retail Forecast:
• Stores, which currently account for 85% of U.S. retail sales (excluding auto, gas and food) in the aggregate, have claimed far less than 50% of total sales growth since 2016. Translation: Total store-based sales growth is negligible — we estimate around 1.0%-1.5% in 2017 [ Exhibit 3 ].
• Approximately 60% of total U.S. retail sales growth has accrued to the online channel (including omnichannel) in the last year. This compares to 40% of total retail sales gains going to the online channel as recently as 2014.
• Approximately 60% of U.S. online sales growth since 2015 has been captured by Amazon. In other words, Amazon alone has claimed more than one-third of total U.S. retail sales growth since 2016, by our estimation.
Thus, more than ever, how specific large retailers fare during the holiday season may be mostly or entirely divorced from the broader performance of the season.
How do we know this is so if nearly all large omnichannel retailers have stopped reporting their online results separately? Our analysis of U.S. Census
Bureau monthly retail sales estimates supports this conclusion.
(See Appendix, Separating Online Sales from Store-Based Sales, for further details.)
It’s hard to imagine that shoppers will again embrace store-based shopping as they once did — as if this were just some bad stretch that will eventually pass once mall owners put some more pizzazz into their properties. Perhaps the biggest factor working against stores is age demographics. Millennials (those currently ages 18-35) are now the largest age demographic, numbering some 80 million Americans, and many of them were never mall rats during their formative years —
and have never even seen a Molly Ringwald movie! Their attachment to malls or other large shopping venues as a preferred place of commerce, an entertaining diversion or a social gathering spot is not what it was to previous generations. Millennials are more likely than other age cohorts to make online purchases. Survey data also indicates they are more likely to be homebodies than their cohorts of previous generations. None of this bodes well for the comeback prospects of store-based shopping as millennials begin to enter their peak earning years over the next decade and continue to shop and purchase in ways mostly unfamiliar to their predecessors.
Jan-12
Ap
r-12
Jul-12
Oct-12
Jan-13
Ap
r-13
Jul-13
Oct-13
Jan-14
Ap
r-14
Jul-14
Oct-14
Jan-15
Ap
r-15
Jul-15
Oct-15
Jan-16
Ap
r-16
Jul-16
Oct-16
Jan-17
Ap
r-17
Jul-17
U.S. Retail Sales Growth
-1%
0%
1%
2%
3%
4%
5%
6%
7%
YOYGAFO + Online GAFO (in-store only)
Note: The GAFO categories is our proxy for store-based discretionary retail sales.
Source: U.S. Census Bureau
EXHIBIT 3
Thus, more than ever, how specific large retailers fare during the holiday season may be mostly or entirely divorced from the broader performance of the season.
U.S. Holiday Retail Forecast
FTI Consulting, Inc. • 4
2Q14 3Q14 4Q14 1Q15 2Q15 3Q15 4Q15 1Q16 2Q16 3Q16 4Q16 1Q17 2Q17
Return on Invested Capital
6%
8%
10%
12%
14%
16%
18%
20%
24%
22%
General Merchandise
Home-Related
Supermarkets
Miscellaneous
Apparel
Total
Note: The GAFO categories is our proxy for store-based discretionary retail sales.
Source: S&P Capital IQ and FTI Consulting
EXHIBIT 4
ROIC MATTERS MOST
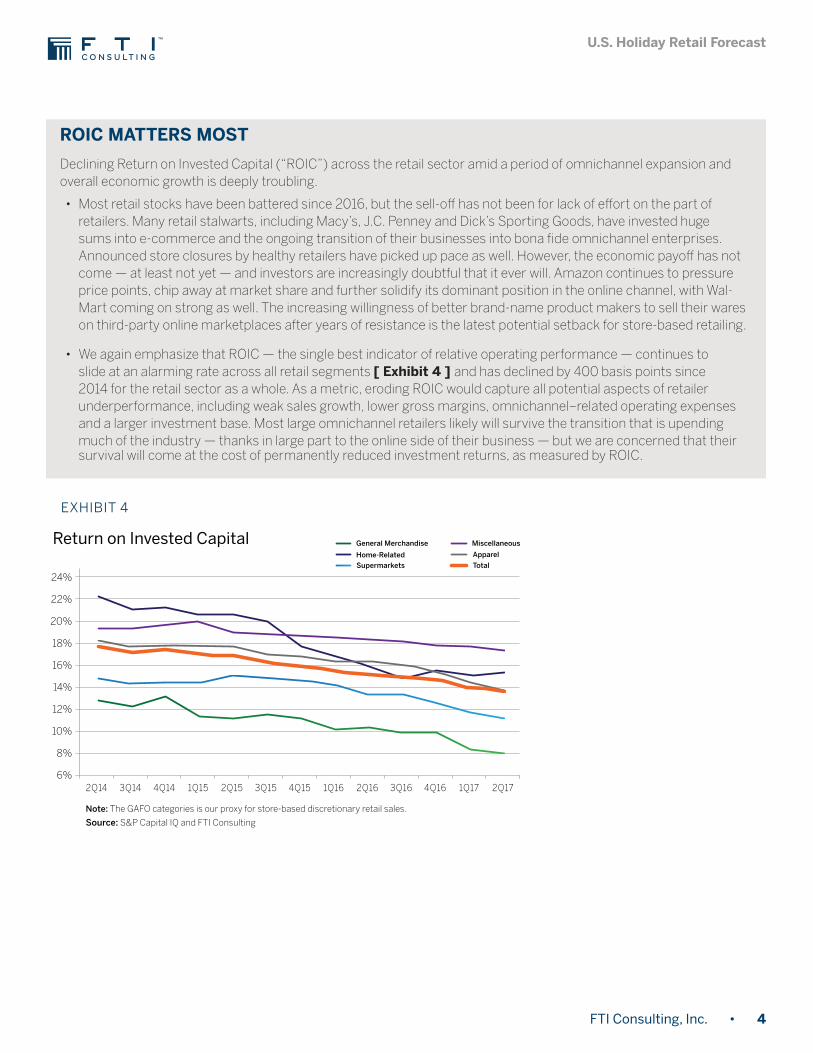
Declining Return on Invested Capital (“ROIC”) across the retail sector amid a period of omnichannel expansion and overall economic growth is deeply troubling.
• Most retail stocks have been battered since 2016, but the sell-off has not been for lack of effort on the part of retailers. Many retail stalwarts, including Macy’s, J.C. Penney and Dick’s Sporting Goods, have invested huge sums into e-commerce and the ongoing transition of their businesses into bona fide omnichannel enterprises. Announced store closures by healthy retailers have picked up pace as well. However, the economic payoff has not come — at least not yet — and investors are increasingly doubtful that it ever will. Amazon continues to pressure price points, chip away at market share and further solidify its dominant position in the online channel, with Wal-Mart coming on strong as well. The increasing willingness of better brand-name product makers to sell their wares on third-party online marketplaces after years of resistance is the latest potential setback for store-based retailing.
• We again emphasize that ROIC — the single best indicator of relative operating performance — continues to slide at an alarming rate across all retail segments [ Exhibit 4 ] and has declined by 400 basis points since 2014 for the retail sector as a whole. As a metric, eroding ROIC would capture all potential aspects of retailer underperformance, including weak sales growth, lower gross margins, omnichannel–related operating expenses and a larger investment base. Most large omnichannel retailers likely will survive the transition that is upending much of the industry — thanks in large part to the online side of their business — but we are concerned that their survival will come at the cost of permanently reduced investment returns, as measured by ROIC.
U.S. Holiday Retail Forecast
FTI Consulting, Inc. • 5
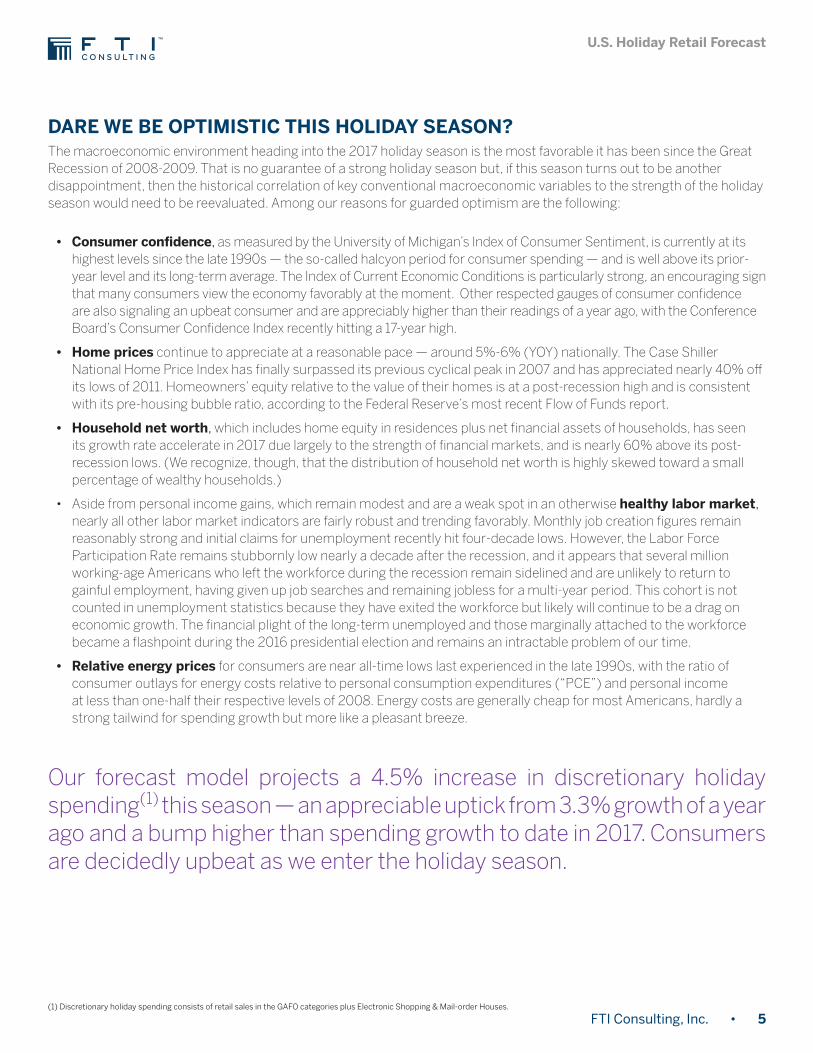
• Consumer confidence, as measured by the University of Michigan’s Index of Consumer Sentiment, is currently at its highest levels since the late 1990s — the so-called halcyon period for consumer spending — and is well above its prior-year level and its long-term average. The Index of Current Economic Conditions is particularly strong, an encouraging sign that many consumers view the economy favorably at the moment. Other respected gauges of consumer confidence are also signaling an upbeat consumer and are appreciably higher than their readings of a year ago, with the Conference Board’s Consumer Confidence Index recently hitting a 17-year high.
• Home prices continue to appreciate at a reasonable pace — around 5%-6% (YOY) nationally. The Case Shiller National Home Price Index has finally surpassed its previous cyclical peak in 2007 and has appreciated nearly 40% off its lows of 2011. Homeowners’ equity relative to the value of their homes is at a post-recession high and is consistent with its pre-housing bubble ratio, according to the Federal Reserve’s most recent Flow of Funds report.
• Household net worth, which includes home equity in residences plus net financial assets of households, has seen its growth rate accelerate in 2017 due largely to the strength of financial markets, and is nearly 60% above its post-recession lows. (We recognize, though, that the distribution of household net worth is highly skewed toward a small percentage of wealthy households.)
• Aside from personal income gains, which remain modest and are a weak spot in an otherwise healthy labor market, nearly all other labor market indicators are fairly robust and trending favorably. Monthly job creation figures remain reasonably strong and initial claims for unemployment recently hit four-decade lows. However, the Labor Force Participation Rate remains stubbornly low nearly a decade after the recession, and it appears that several million working-age Americans who left the workforce during the recession remain sidelined and are unlikely to return to gainful employment, having given up job searches and remaining jobless for a multi-year period. This cohort is not counted in unemployment statistics because they have exited the workforce but likely will continue to be a drag on economic growth. The financial plight of the long-term unemployed and those marginally attached to the workforce became a flashpoint during the 2016 presidential election and remains an intractable problem of our time.
• Relative energy prices for consumers are near all-time lows last experienced in the late 1990s, with the ratio of consumer outlays for energy costs relative to personal consumption expenditures (“PCE”) and personal income at less than one-half their respective levels of 2008. Energy costs are generally cheap for most Americans, hardly a strong tailwind for spending growth but more like a pleasant breeze.
DARE WE BE OPTIMISTIC THIS HOLIDAY SEASON?The macroeconomic environment heading into the 2017 holiday season is the most favorable it has been since the Great Recession of 2008-2009. That is no guarantee of a strong holiday season but, if this season turns out to be another disappointment, then the historical correlation of key conventional macroeconomic variables to the strength of the holiday season would need to be reevaluated. Among our reasons for guarded optimism are the following:
Our forecast model projects a 4.5% increase in discretionary holiday spending(1) this season — an appreciable uptick from 3.3% growth of a year ago and a bump higher than spending growth to date in 2017. Consumers are decidedly upbeat as we enter the holiday season.
(1) Discretionary holiday spending consists of retail sales in the GAFO categories plus Electronic Shopping & Mail-order Houses.
U.S. Holiday Retail Forecast
FTI Consulting, Inc. • 6
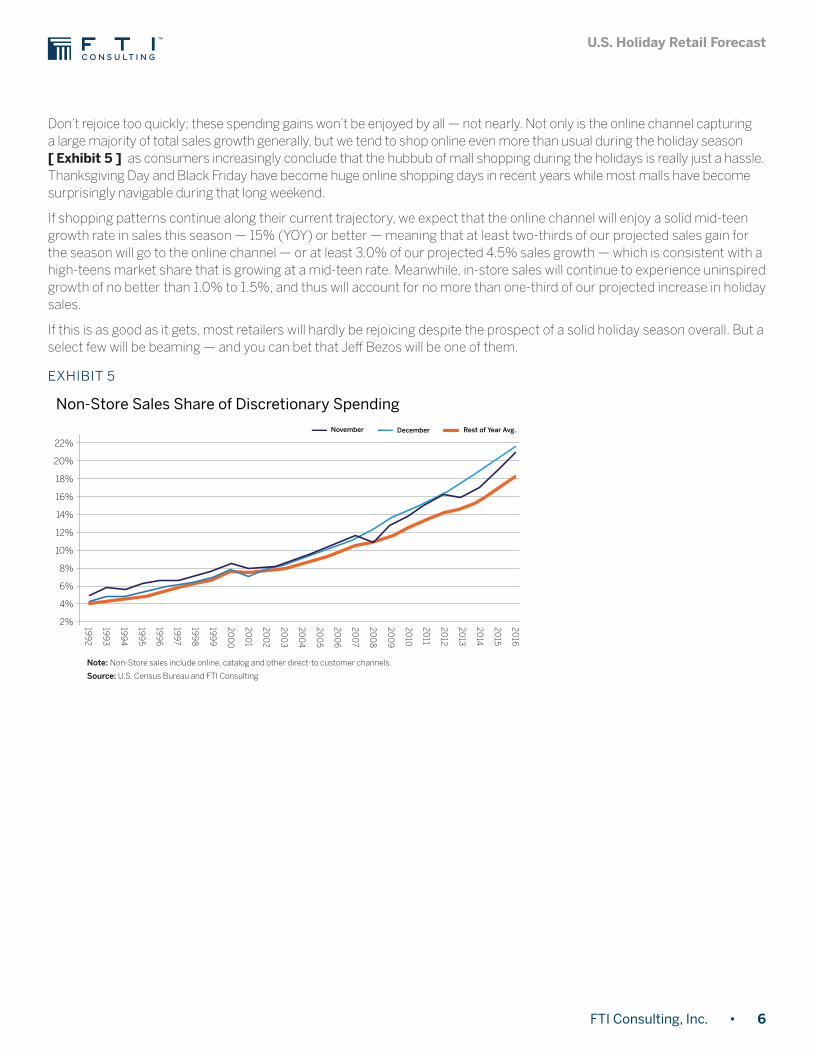
Don’t rejoice too quickly; these spending gains won’t be enjoyed by all — not nearly. Not only is the online channel capturing a large majority of total sales growth generally, but we tend to shop online even more than usual during the holiday season [ Exhibit 5 ] as consumers increasingly conclude that the hubbub of mall shopping during the holidays is really just a hassle. Thanksgiving Day and Black Friday have become huge online shopping days in recent years while most malls have become surprisingly navigable during that long weekend.
If shopping patterns continue along their current trajectory, we expect that the online channel will enjoy a solid mid-teen growth rate in sales this season — 15% (YOY) or better — meaning that at least two-thirds of our projected sales gain for the season will go to the online channel — or at least 3.0% of our projected 4.5% sales growth — which is consistent with a high-teens market share that is growing at a mid-teen rate. Meanwhile, in-store sales will continue to experience uninspired growth of no better than 1.0% to 1.5%, and thus will account for no more than one-third of our projected increase in holiday sales.
If this is as good as it gets, most retailers will hardly be rejoicing despite the prospect of a solid holiday season overall. But a select few will be beaming — and you can bet that Jeff Bezos will be one of them.
199
3
199
2
199
4
199
5
199
6
1997
199
8
199
9
200
0
200
1
200
2
200
3
200
4
200
5
200
6
200
7
200
8
200
9
2010
2011
2012
2013
2014
2015
2016
Non-Store Sales Share of Discretionary Spending
4%
2%
6%
8%
10%
12%
14%
16%
18%
22%
20%
November December Rest of Year Avg.
Note: Non-Store sales include online, catalog and other direct-to customer channels.
Source: U.S. Census Bureau and FTI Consulting
EXHIBIT 5
U.S. Holiday Retail Forecast
FTI Consulting, Inc. • 7
(2) GAFO categories consist of General Merchandisers, Apparel & Accessories, Home Furnishings & Furniture, Consumer Electronics and other miscellaneous sales. Adjusted GAFO consists of GAFO sales plus Electronic Shopping & Mail-order Houses.
APPENDIX: SEPARATING ONLINE SALES FROM STORE-BASED SALESMost large omnichannel retailers today no longer break out online sales from store-based sales for public reporting purposes, as they consider these two sides of the house to be a single integrated business. Thankfully, monthly estimates of U.S. retail sales compiled by the Census Bureau using survey results from several thousand retailers, including 1,250 large retailers, allow us to make this distinction.
Monthly retail sales are categorized by kind of business, such as general merchandisers, supermarkets, etc. Each retail establishment included in the survey is classified into just one of these categories so, for instance, all of Target’s sales would be included in the general merchandise category even though a substantial percentage of its sales are food and consumables. But one adjustment made by the Census Bureau in its monthly survey helps to isolate the impact of online sales on U.S. retailing: it requires that survey respondents segregate their store-based sales and online sales, the latter of which Census Bureau reports separately in another category, Electronic Shopping and Mail Order Houses, irrespective of product type. This adjustment has a distorting effect on kind-of-business retail sales as reported by the Census Bureau — namely that as a growing percentage of retailers’ sales are made online, these sales are excluded from their respective kind-of-business category and are instead classified to the Electronic Shopping category. Consequently, retail sales by kind-of-business categories effectively represent only in-store sales. None of this mattered much a decade ago when non-store sales were an insignificant percentage of retail sales, but it makes a manifest difference today as online retail sales approach $445 billion and a 12.5% market share of total sales in relevant categories.
Let’s consider discretionary consumer spending on retail goods, the best proxy for which is the Census Bureau’s GAFO(2) category aggregate, which excludes sales of staples such as food and gas. The GAFO aggregate is a $1.2 trillion category accounting for nearly 40% of retail sales (excluding automobiles). It includes a wide range of kind-of-business categories, such as department stores, consumer electronics, home furnishings and apparel, among others. We charted nominal monthly sales growth (YOY) for GAFO category sales in two ways: GAFO, which essentially represents in-store sales of GAFO category merchandise, and Adjusted GAFO, which includes GAFO plus the Electronic Shopping category (see Exhibit 3). The difference between the two series has become startling in recent years.
After moving in near lockstep until 2014, GAFO sales growth has been trending unfavorably since early 2015 and is barely positive, while Adjusted GAFO sales growth has been consistently in the 3%-4% range during that time. This difference represents $125 billion of GAFO category sales that have moved to the online channel from stores since mid-2014.
Census Bureau data tell us that total in-store retail sales growth has been practically nil in most months since early 2016. These data support the prevailing narrative that overall discretionary consumer spending (i.e., Adjusted GAFO) is merely tepid while store-based sales growth is nearly non-existent amid a period of U.S. economic expansion. With online retail sales consistently growing at a low to mid-teen rate (YOY), this divergence, as seen in Exhibit 3, is likely to widen further.
The views expressed herein are those of the authors and not necessarily the views of FTI Consulting, Inc., its management, its subsidiaries, its affiliates, or its other professionals.

About FTI Consulting
FTI Consulting, Inc. is a global business advisory firm dedicated to helping organizations protect and enhance enterprise value in an increasingly complex legal, regulatory and economic environment. FTI Consulting professionals, who are located in all major business centres throughout the world, work closely with clients to anticipate, illumi nate and overcome complex business challenges in areas such as investigations, litigation, mergers and acquisitions, regulatory issues, reputation management and restructuring.
www,fticonsulting.com ©2017 FTI Consulting, Inc. All rights reserved.
Contacts:
J.D. WichserLeader, Retail & Consumer Products PracticeSenior Managing [email protected]
Christa HartSenior Managing DirectorRetail & Consumer Products [email protected]
Khaled HaramSenior Managing DirectorRetail & Consumer Products [email protected]
John YozzoManaging DirectorCorporate Finance & [email protected]
www.fticonsulting.com/retail