homelessness services update -...
TRANSCRIPT

HOMELESSNESS SERVICES
Homelessness Services Update Presentation to Council October 4, 2017
Photo: Derek O’Keefe, The Source April 29, 2014

HOMELESSNESS SERVICES
AGENDA Homeless Count 2017
Vancouver Results of the 2017 Homeless Count in Metro Vancouver
Shelter Strategy
Temporary Shelters Warming Centres Housing First – Temporary Modular Homes
2

HOMELESSNESS SERVICES
Vancouver Results of 2017 Homeless Count in Metro Vancouver
Key Demographics
Indigenous Profile
Comparison: Youth, Adults and Seniors
Implications
Oppenheimer Park, 2014 Photo credit: http://www.genuinewitty.com/2014/08/01
3

HOMELESSNESS SERVICES
KEY DEMOGRAPHICS: METRO VANCOUVER AND VANCOUVER
• Indigenous individuals overrepresented
• Increase in seniors 55+
• Decrease in youth 24 and under
• Majority are men
4

HOMELESSNESS SERVICES
Sub-Region 2014 2017 2014-2017 Change # %
Delta/White Rock 19 46 27 142%
Langley 92 206 114 124%
Tri-Cities 55 107 52 95%
Richmond 38 70 32 84%
Ridge Meadows 84 134 50 60%
Surrey 403 602 199 49%
New Westminster 106 133 27 25%
Burnaby 58 69 11 19% Vancouver 1,803 2,138 335 19% North Shore 119 100 -19 -16% Total 2,777 3,605 828 30%
2017 HOMELESS COUNT IN METRO VANCOUVER Changes by Sub-Region
5

HOMELESSNESS SERVICES
2,138 PEOPLE IDENTIFIED AS HOMELESS IN
VANCOUVER ON MARCH 8, 2017
537 UNSHELTERED
1,601 SHELTERED
FINDINGS IN VANCOUVER OF THE 2017 HOMELESS COUNT
6

HOMELESSNESS SERVICES
773 765
1,294 1,427 1,296 1,327 1,267 1,258 1,308 1,601
591 811
421 154 306 273 536 488 539
537
1,364 1,576
1,715 1,581 1,602 1,600
1,803 1,746 1,847
2,138
0
500
1000
1500
2000
2500
2005 2006 2007 2008 2009 2010 2011 2012 2013 2014 2015 2016 2017
Sheltered Unsheltered Total
VANCOUVER: 2005 - 2017 TREND
7

HOMELESSNESS SERVICES
76% Men (902)
22% Women (263) 2% Another
gender identity
(19)
HOMELESS POPULATION BY GENDER
8

HOMELESSNESS SERVICES 9
0%
5%
10%
15%
20%
25%
30%
Under 19 19-24 25-34 35-44 45-54 55-64 65+
201520162017
HOMELESS POPULATION BY AGE
25-54 year olds

HOMELESSNESS SERVICES
59%
48%
44%
36%
Addiction
Medical condition/illness
Mental health issue
Physical disability
HEALTH CONDITIONS
79% (737)
Have one or more health conditions
(636)
(492)
(455)
(365)
10

HOMELESSNESS SERVICES
MOST FREQUENTLY USED SERVICES
1. Emergency room 51% 2. Meal programs 49% 3. Hospital (non-emerg) 43% 4. Drop-in services 43% 5. Health clinic 41% 6. Ambulance 40%
11

HOMELESSNESS SERVICES 12
0%
5%
10%
15%
20%
25%
30%
35%
40%
45%
201520162017
SOURCES OF INCOME – TRENDS

HOMELESSNESS SERVICES 13
FIRST TIME HOMELESS
LENGTH OF TIME HOMELESS 1ST PERIOD OF HOMELESSNESS
< 6 months 40%
6 months to 1 year 44%
1 year or more 43%

HOMELESSNESS SERVICES
68% Lived in
Vancouver before
becoming homeless
(739)
4% from other parts of Metro
Vancouver (47)
10% from other parts of BC
(105)
18% from outside BC
(193)
HOMELESS IN VANCOUVER
14

HOMELESSNESS SERVICES
Indigenous Profile
15

HOMELESSNESS SERVICES
% Indigenous in Homeless Population
39% (448)
~2%
% Indigenous in General Population
INDIGENOUS HOMELESSNESS
Indigenous Non-Indigenous
16

HOMELESSNESS SERVICES
33% (220)
Sheltered (n=665)
47% (227)
Unsheltered (n=485)
INDIGENOUS IDENTITY AND LOCATION
Indigenous Non-Indigenous
17

HOMELESSNESS SERVICES
INDIGENOUS IDENTITY, GENDER AND LOCATION
28% (140) 42%
(160)
Sheltered Unsheltered
Men
49% (76) 66%
(63)
Women
Indigenous Non-Indigenous
18

HOMELESSNESS SERVICES
INDIGENOUS IDENTITY: YOUTH, ADULTS AND SENIORS
36% (43)
Youth (Under 25) n=119
42% (325)
Adults (25-54) n=769
29% (69)
Seniors (55+) n=240
Indigenous Non-Indigenous
19

HOMELESSNESS SERVICES
SUMMARY: INDIGENOUS PROFILE
• Indigenous people overrepresented and growing in homelessness
• Indigenous people more likely to be on the street than in shelters
• Indigenous women particularly overrepresented and growing on the street
• Fewer Indigenous respondents in the senior population
20

HOMELESSNESS SERVICES
Comparison: Youth, Adults and Seniors
21
HOMELESSNESS SERVICES 22
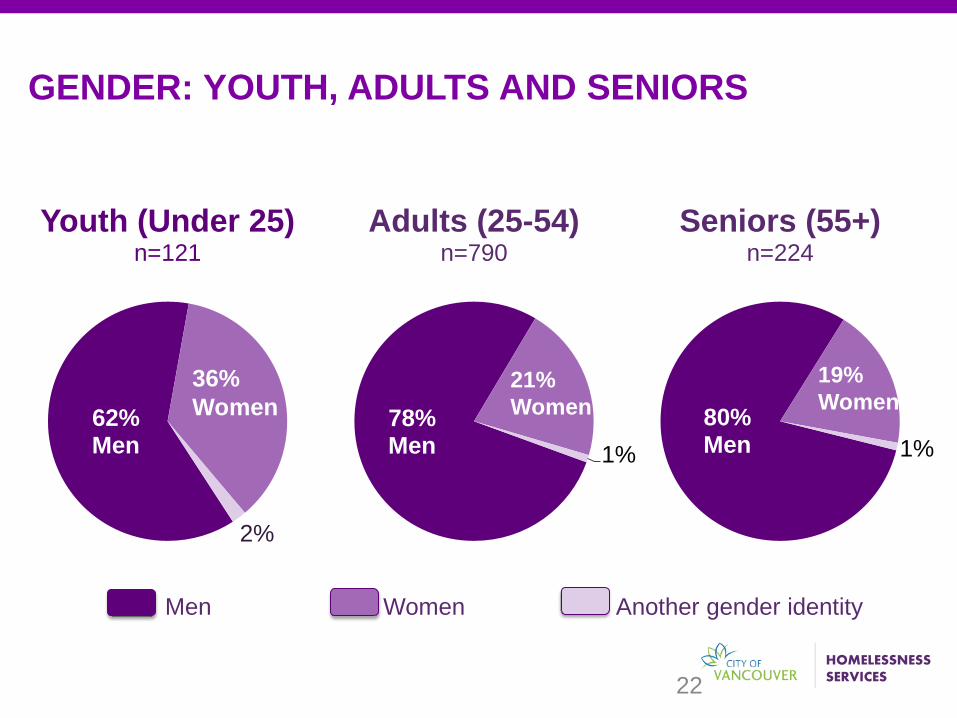
GENDER: YOUTH, ADULTS AND SENIORS
62% Men
2%
Youth (Under 25) n=121
78% Men 1%
Adults (25-54) n=790
80% Men 1%
Seniors (55+) n=224
21% Women
Men Women Another gender identity
36% Women
19% Women

HOMELESSNESS SERVICES
LGBTQ2+: YOUTH, ADULTS AND SENIORS
23%
Youth (Under 25) n=114
11%
Adults (25-54) n=751
5%
Seniors (55+) n=228
23

HOMELESSNESS SERVICES 24
0%
5%
10%
15%
20%
25%
30%
35%
40%
45%
50%
0-24 25-54 55+
No incomeEmploymentIncome AssistanceDisability (PWD)Federal Benefits
INCOME: YOUTH, ADULTS AND SENIORS
Youth n=120
Adults n=771
Seniors n=237

HOMELESSNESS SERVICES 25
ADDICTION: YOUTH, ADULTS AND SENIORS
56%
Youth (Under 25) n=119
67%
Adults (25-54) n=720
36%
Seniors (55+) n=221

HOMELESSNESS SERVICES 26
MENTAL HEALTH: YOUTH, ADULT AND SENIORS
57%
Youth (Under 25) n=110
46%
Adults (25-54) n=687
31%
Seniors (55+) n=218

HOMELESSNESS SERVICES 27
MEDICAL CONDITION: YOUTH, ADULT AND SENIORS
30%
Youth (Under 25) n=111
47%
Adults (25-54) n=677
59%
Seniors (55+) n=219

HOMELESSNESS SERVICES 28
PHYSICAL DISABILITY: YOUTH, ADULT AND SENIORS
13%
Youth (Under 25) n=112
34%
Adults (25-54) n=657
52%
Seniors (55+) n=223

HOMELESSNESS SERVICES 29
AGE CATEGORY
IN CARE OF MCFD %
Youth 0-18 (*Small sample)
Currently in care 17%
Previously in care 42%
Youth 19-24 (n=101)
Previously in care 39%
Adults 25+ (n=939)
Previously in care 19%
IN CARE OF MINISTRY (MCFD): YOUTH AND ADULTS

HOMELESSNESS SERVICES
SUMMARY: YOUTH, ADULTS, SENIORS
• Youth more likely than adults and seniors to be women
• Youth more likely to identify as LGBTQ2+
• Youth more likely to have no income
• Youth more likely to report a mental illness
• Adults more likely to report an addiction
• Seniors more likely than adults and youth to report a medical condition or physical disability
• Youth under 25 are more likely than adults to have been in the care of the ministry
30

HOMELESSNESS SERVICES
IMPLICATIONS
• Reinforces the importance of a deeper dive into data, particularly Indigenous data, to enhance our ability to provide meaningful, integrated services for people who are homeless
• Must acknowledge the colonial history
and intergenerational trauma experienced by many Indigenous people and the ways these contribute to homelessness as outlined in the report on Aboriginal Homelessness for the 2017 Homeless Count in Metro Vancouver
31

HOMELESSNESS SERVICES
Shelter Strategy Temporary Shelters
Warming Centres
Housing First – Temporary Modular Homes
32

HOMELESSNESS SERVICES
PROJECTED NEED THIS WINTER
• 2200: projected # homeless in 2018 - 963 projected to use existing year-round shelters - 337 (approx.) projected to be in other facilities - 900 projected to be unsheltered if no actions taken
• Point-in-time count does not reflect the fluidity of homelessness
• Emergency shelter requests remain high, even in summer months
33

HOMELESSNESS SERVICES
Temporary Shelters 300 temporary shelter beds to address the immediate needs of street homeless
34

HOMELESSNESS SERVICES
TEMPORARY SHELTERS 2017/2018
Rationale
• Address the needs of people who are homeless while Transitional and Permanent Social Housing is made available
• Mitigate cold weather health risks
35

HOMELESSNESS SERVICES
TEMPORARY SHELTERS 2017/2018
Model
• Utilize pre-existing commercial and industrial spaces
• Serve people whose needs are not met by traditional year-round shelters = Low-barrier
• Extend existing shelter capacity
• Create flow through, producing further shelter vacancies
• Cost share with BC Housing
36

HOMELESSNESS SERVICES
TEMPORARY SHELTERS 2017/2018
Next Steps
• Partnership with BC Housing will provide 300 temporary shelter beds in 11 shelters across the city
• Temporary shelters will open November 1st instead of in December to give relief from the November rains
• Community engagement will begin in late October in the neighbourhoods where shelters will be located
• COV provides facilities and BCH funds operations
37
HOMELESSNESS SERVICES
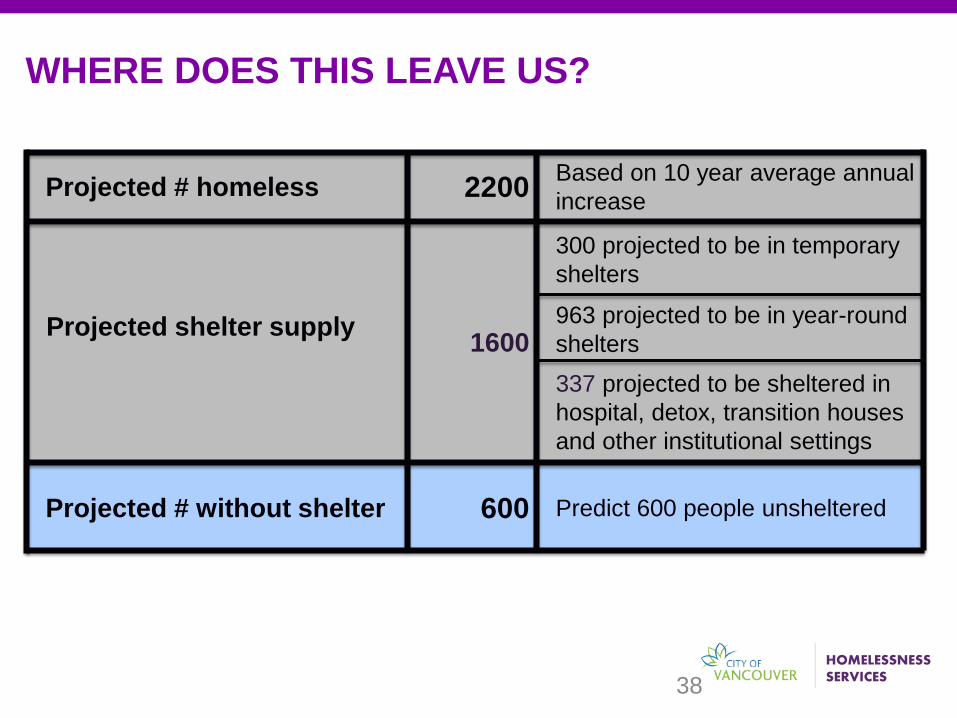
WHERE DOES THIS LEAVE US?
Projected # homeless 2200 Based on 10 year average annual increase
Projected shelter supply 1600
300 projected to be in temporary shelters
963 projected to be in year-round shelters
337 projected to be sheltered in hospital, detox, transition houses and other institutional settings
Projected # without shelter 600 Predict 600 people unsheltered
38

HOMELESSNESS SERVICES
Warming Centres City of Vancouver response to extreme weather
Photo: Rafal Gerszak, Globe & Mail, January 12, 2017 39

HOMELESSNESS SERVICES
LAST YEAR: THE 2016/2017 SEASON
Last Year’s Need • Coldest winter in 10 years
• Not enough shelter beds for all street homeless
Last Year’s Response • Opened Warming Centres mid-Dec 2016
• Partnership between COV and Park Board
• Activation temp. aligned with EWR (0°C)
• Open 45 nights between Dec and March
Last Year’s Cost • 2016/2017 cost to operate: over $300,000
Photo: CBC News David Horemans Dec 13, 2016
40

HOMELESSNESS SERVICES
LAST YEAR: THE 2016/2017 SEASON
Last Year’s Challenges
• Open many more nights than expected because of continued cold weather at 0°C and below
• Open for many nights in a row; contributed to burnout
• Short notice and lack of staff - difficult to fill staffing quotas
• Lack of staff training on supporting vulnerable populations
• Programme scheduling conflicts
41

HOMELESSNESS SERVICES
WARMING CENTRES 2017/2018
Addressing last year’s challenges
• Activate at -5°C or below - Based on Environment and Climate Change Canada’s parameters for
all individuals, including young children and the elderly, who may be outside in cold temperatures
• Operate for no more than 5 days in a row at any one site
• Alternate operations with other sites where possible
• Improve communication and notification processes - 24-hour advance notice - Schedule displayed at all Warming and Community Centres - Notification and schedule provided to CoV Communications
• Provide relevant staff training on supporting vulnerable populations
42

HOMELESSNESS SERVICES
WARMING CENTRES 2017/2018
Next Steps • Open in priority neighbourhoods
- West End - DTES - Commercial Drive - South Vancouver
• Low-barrier model – welcome to all • Operations the responsibility of each
partner • Costs covered by CS Warming Centre
Budget
Photo: Phil Carpenter, Montreal Gazette, January 2, 2013
43

HOMELESSNESS SERVICES
WARMING CENTRES 2017/2018
PROPOSED BUDGET
Description Cost
Cost per night per facility $2,300
Cost per night for 4 facilities $9,200
Estimated season cost (24 nights*) $220,000
* Based on 5-year average # of days that felt like -5°C or below
44
HOMELESSNESS SERVICES
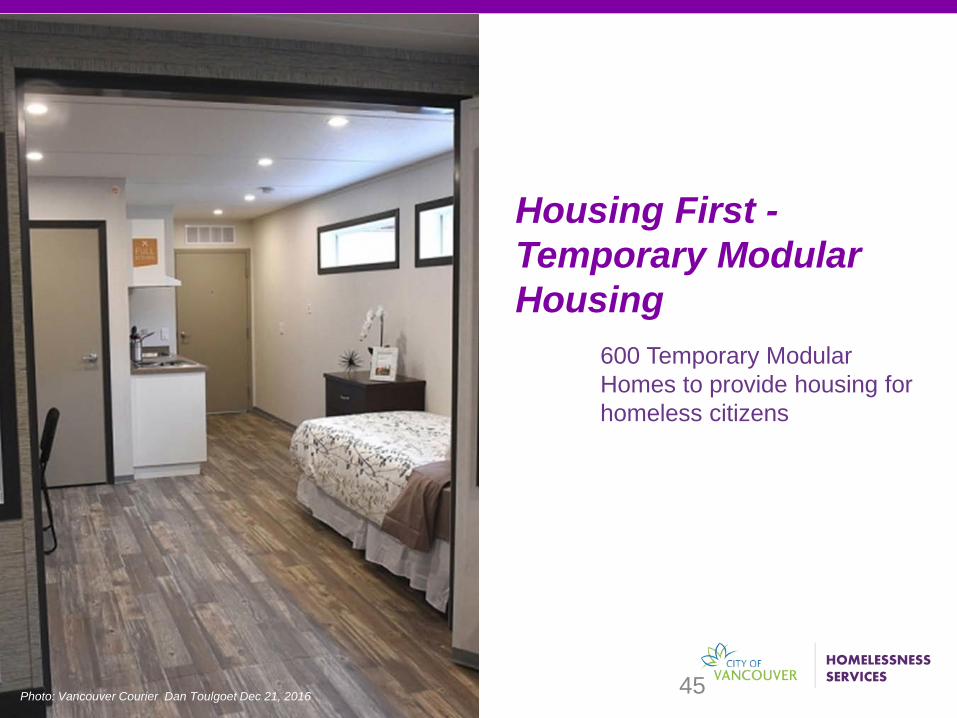
Housing First - Temporary Modular Housing
600 Temporary Modular Homes to provide housing for homeless citizens
Photo: Rafal Gerszak, Globe & Mail, January 12, 2017 Photo: Vancouver Courier Dan Toulgoet Dec 21, 2016 45

HOMELESSNESS SERVICES
WHY HOUSING FIRST?
Housing First is an opportunity to offer housing with wrap around support services to homeless citizens without prior interventions or criteria. The first thing that people need in order to find balance and heal is a home. • 600 temporary modular homes to respond to the immediate
need of homeless people
46

HOMELESSNESS SERVICES
WHY TEMPORARY MODULAR HOUSING?
• Provides much-needed housing for up to 10 years while more permanent housing is built
• Expedient on-site construction and installation (~2 - 4 months)
• Designed to meet City’s building codes
• Reduces waste during manufacturing and installation
• Can be reconfigured and relocated to fit different sites depending on local needs
47

HOMELESSNESS SERVICES
TENANTS
• People who are unsheltered or living in shelters.
• Tenants apply through BC Housing with support from COV outreach
48

HOMELESSNESS SERVICES
OPERATIONS
• Experienced non-profit supportive housing provider will operate each site
• BC Housing to fund 24/7 staffing and support services to meet the needs of tenants
• Health care provided by Vancouver Coastal Health in neighbourhood clinics
49

HOMELESSNESS SERVICES
PROPOSED BUILDING CONCEPT
• Approx 50 units per building; approx 50-100 units per site
• Self-contained studios with private bathroom and kitchen
• 10% accessible units on ground floor
• Unit size: 250 - 350 sq. ft. to comply with BC Housing guidelines
50

HOMELESSNESS SERVICES
PROPOSED BUILDING CONCEPT
• Amenity space in most buildings with communal kitchen and attached dining areas and client interaction space
• Comprehensive security measures including design features, security cameras and exterior lighting
51

HOMELESSNESS SERVICES
WHERE WILL WE BUILD TEMPORARY MODULAR HOUSING?
• Buildings will be located temporarily on vacant or under-used sites owned by the City or other partners
• Considerations will include: - Access to transit and health services - Site access and servicing - Financial considerations - Lease and legal considerations - Environmental issues with land - Land ownership - Current land use/zoning - Development potential and timing
52

HOMELESSNESS SERVICES
PROPOSED TIMELINE: OPENING WINTER 2017/18
• Current - Site selection according to criteria - staff currently actively exploring possibilities
• Current - BC Housing selects operators
• October/November 2017- Site-specific neighbourhood community engagement begins as sites are selected
• November 2017 - Tenant application process begins
• November/December 2017 - Modular on-site construction begins
• Early Winter 2018 - Tenanting of first Temporary Modular Homes is complete
53

HOMELESSNESS SERVICES
COMMUNITY ENGAGEMENT
• The City of Vancouver will work closely with the community and key stakeholders to listen to interests and priorities
• Hold site-specific Community Information Sessions
• Community liaison will be available directly to answer community member’s questions
• Provide up-to-date information on the City’s website
54

HOMELESSNESS SERVICES
UPCOMING SOCIAL HOUSING
55
Units completed 2017 = 264 (estimate) Units completed 2018 = 629 Total = 893
HOMELESSNESS SERVICES
HOMELESSNESS SERVICES
ONGOING EFFORTS
• Overall, due to our many actions over the last few years, homelessness has increased at a lower rate than in other jurisdictions in the region
• Our Warming Centres will become part of standard operating procedures
• We are making homeless individuals a priority with our Housing First Temporary Modular Housing
• We will be working over the fall and winter to bring more and more people inside
56

HOMELESSNESS SERVICES
THANK YOU!
HOMELESSNESS SERVICES 57