highway capacity manual 2010 - volume 4 and... · highway capacity manual 2010 approved corrections...
TRANSCRIPT
HIGHWAY CAPACITY MANUAL 2010
Approved Corrections and Clarifications as of January 2014
Chapter 10, Freeway Facilities
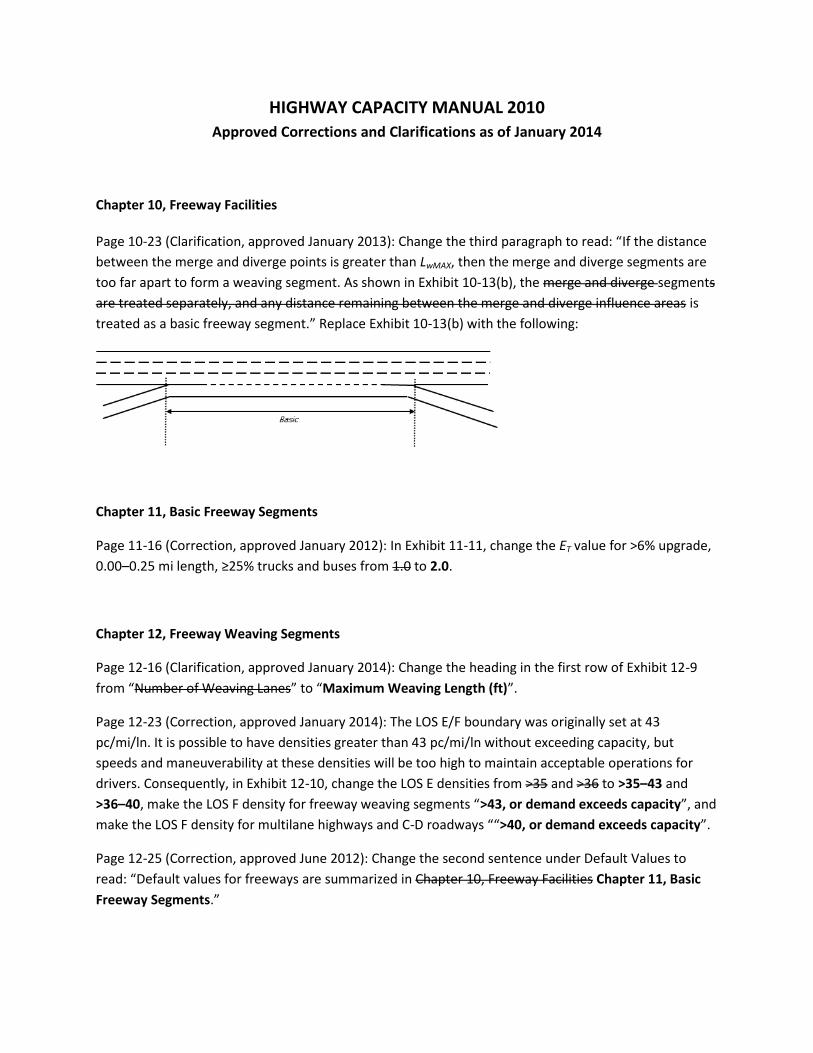
Page 10-23 (Clarification, approved January 2013): Change the third paragraph to read: “If the distance
between the merge and diverge points is greater than LwMAX, then the merge and diverge segments are
too far apart to form a weaving segment. As shown in Exhibit 10‐13(b), the merge and diverge segments
are treated separately, and any distance remaining between the merge and diverge influence areas is
treated as a basic freeway segment.” Replace Exhibit 10-13(b) with the following:
Chapter 11, Basic Freeway Segments
Page 11-16 (Correction, approved January 2012): In Exhibit 11-11, change the ET value for >6% upgrade,
0.00–0.25 mi length, ≥25% trucks and buses from 1.0 to 2.0.
Chapter 12, Freeway Weaving Segments
Page 12-16 (Clarification, approved January 2014): Change the heading in the first row of Exhibit 12-9
from “Number of Weaving Lanes” to “Maximum Weaving Length (ft)”.
Page 12-23 (Correction, approved January 2014): The LOS E/F boundary was originally set at 43
pc/mi/ln. It is possible to have densities greater than 43 pc/mi/ln without exceeding capacity, but
speeds and maneuverability at these densities will be too high to maintain acceptable operations for
drivers. Consequently, in Exhibit 12-10, change the LOS E densities from >35 and >36 to >35–43 and
>36–40, make the LOS F density for freeway weaving segments “>43, or demand exceeds capacity”, and
make the LOS F density for multilane highways and C-D roadways ““>40, or demand exceeds capacity”.
Page 12-25 (Correction, approved June 2012): Change the second sentence under Default Values to
read: “Default values for freeways are summarized in Chapter 10, Freeway Facilities Chapter 11, Basic
Freeway Segments.”

Page 12-43 (Correction, approved January 2014): In the final equation under Step 5, change the value
“> 4,150 veh/h” to “> 4,415 veh/h”, which is (4,150) / PHF, with the PHF = 0.94.
Chapter 13, Freeway Merge and Diverge Segments
Page 13-14 (Correction, approved January 2012): In the list of variables below Equation 13-8, change the
definition of PFD from “proportion of diverging traffic…” to “proportion of through freeway traffic…”
Page 13-14 (Correction, approved June 2012): Add the following to the side of Equation 13-10:
when vU/LUP ≤ 0.2b and add the following below Exhibit 13-7: b When vU/LUP > 0.2, use Equation 13-9.
Page 13-15 (Correction, approved June 2012): Add the following paragraph immediately before the
paragraph starting “A special case exists…”: In cases where Equation 13-12 indicates that Equation 13-
10 should be used to determine PFD, but vU/LUP > 0.20, Equation 13-9 must be used as a default. This is
due to the valid calibration range of Equation 13-10, and the fact that it will yield unreasonable results
when vU/LUP exceeds 0.20. This will lead to step-function changes in PFD for values just below or above
vU/LUP = 0.20.
Page 13-22 (Clarification, approved January 2013): Add the following new subsection following the first
paragraph of the “Special Cases” section:
Single-Lane Ramp Additions and Lane Drops
On-ramps and off-ramps do not always include merge and diverge elements. In some cases, there are
lane additions at on-ramps or lane drops at off-ramps.
Analysis of single-lane additions and lane drops is relatively straightforward. The freeway segment
downstream of the on-ramp or upstream of the off-ramp is simply considered to be a basic freeway
segment with an additional lane. The procedures in Chapter 11 should be applied in this case.
The case of an on-ramp lane addition followed by an off-ramp lane drop may be a weaving segment,
and should be evaluated using the procedures of Chapter 12. This configuration may either be a
weaving segment or a basic segment, depending on the distance between the ramps. Note that some
segments may be classified as a weaving segment at higher volumes and as a basic segment at lower
volumes.
Ramps with two or more lanes frequently have lane additions or drops for some or all of the ramp
lanes. These cases are covered below.
Page 13-28 (Correction, approved June 2012): Change the second sentence of the second paragraph to
read: “Chapter 10, Freeway Facilities, Chapter 11, Basic Freeway Segments, provides a summary of the
default values for freeways.”

Page 13-30 (Correction, approved June 2012): Change the second sentence in the second paragraph
under Planning and Preliminary Engineering Analysis to begin: “Many of the default values specified in
Chapter 11, Basic Freeway Segments; Chapter 12, Freeway Weaving Segments; and Chapter 13,
Freeway Merge and Diverge Segments for freeway facilities in Chapter 10 would be applied;”
Chapter 14, Multilane Highways
Page 14-16, Exhibit 14-13 (Correction, approved January 2012): Change the ET value for >6% upgrade,
0.00–0.25 mi length, ≥25% trucks and buses from 1.0 to 2.0.
Chapter 15, Two-Lane Highways
Page 15-28, list of variables below Equations 15-12 and 15-13 (Correction, approved January 2012):
Change the units for cdATS and cdPTSF from pc/h to veh/h.
Page 15-37, two lines above Equation 15-25 (Correction, approved January 2014): Change the definition
of V from “hourly directional volume” to “hourly directional volume per lane”.
Page 15-37, line above Equation 15-28 (Correction, approved January 2014): Change “160 veh/h” to
“160 veh/h/ln”.
Page 15-38, list of variables at the top of the page (Correction, approved January 2012 and January
2014): Change the definition of V from “hourly directional volume (veh/h)” to “hourly directional
volume per lane (veh/h/ln)”.
Page 15-44, Example Problem 1 (Correction, approved January 2012): Change the units for demand volume in “The Facts” from pc/h to veh/h.
Chapter 19, Two-Way STOP-Controlled Intersections
Page 19-15, Exhibit 19-10 and page 19-16, Exhibit 19-11 (Correction, approved January 2012): Add the
following note below each table: Note: “Narrow” U-turns have a median nose width < 21 ft; “wide” U-
turns have a median nose width ≥21 ft.
Chapter 20, All-Way STOP-Controlled Intersections
Page 20-15 (Correction, approved January 2012):
Change the first sentence of Step 10 as follows: “The departure headway of the approach lane is
the expected value of the saturation headway distribution, given by Equation 20-28.”

Change the paragraph under Step 12 as follows: “The capacity of each approach lane in a
subject approach is computed under the assumption that the flows on the opposing and
conflicting approaches are constant. The given flow rate on the subject lane is increased and the
departure headways are computed for each approach lane on each approach until the degree
of utilization for the subject lane reaches 1. When this occurs, the final value of the subject
approach lane flow rate is the maximum possible throughput or capacity of this lane.”
Page 20-25 (Correction, approved January 2012): Change the first sentence of Step 10 as follows: “The
departure headway of the approach lane is the sum of the products of the adjusted probabilities and
the saturation headways as follows (eastbound illustrated):”
Page 20-26 (Correction, approved January 2012):
Change the first sentence of the first paragraph of Step 12 as follows: “The capacity of each
approach lane in a subject approach is computed by increasing the given flow rate on the
subject lane (assuming the flows on the opposing and conflicting approaches are constant) until
the degree of utilization for the subject lane reaches 1.”
Change the second paragraph of Step 12 as follows: “Here, the eastbound approach lane
capacity is approximately 720 veh/h, which is lower than the value that could be estimated by
dividing the approach lane volume by the degree of utilization (368/0.492 = 748 veh/h). The
difference is due to the interaction effects among the approaches: increases in eastbound traffic
volume increase the departure headways of the lanes on the other approaches, which in turn
increases the departure headway of the lane(s) on the subject approach.”
Change the second sentence of Step 13 as follows: “For the eastbound approach lane (using a
value for m of 2.0 for Geometry Group 1), the calculation is as follows:”
Change the first sentence of Step 14 as follows: “The control delay for each approach lane is
computed with Equation 20-30 as follows (eastbound approach illustrated):”.
Change the sentence after the first equation in Step 14 as follows: “By using Exhibit 20-2, the
eastbound approach lane (and thus approach) is assigned LOS B. A similar calculation for the
westbound and southbound approaches lanes (and thus approaches) yields 13.5 and 10.6 s,
respectively.”
Chapter 31, Signalized Intersections: Supplemental
Note: All page numbers refer to the original December 2010 version of the chapter.
Page 31-34 (Correction, approved December 2013): Add the following text immediately before Section
B, Estimate Shared-Lane Lane Group Flow Rate: “If the opposing approach has two lanes serving
through vehicles and the inside lane serves through and left-turn vehicles, then Equation 31-54a is
used to compute the adjusted duration of permitted left-turn green time that is not blocked by an
opposing queue gu*. This variable is then used in Equation 31-59 in replacement of the variable gu.
This adjustment is intended to reflect the occasional hesitancy of drivers to shift from the inside lane
to the outside lane during higher-volume conditions for this approach lane geometry. In all other
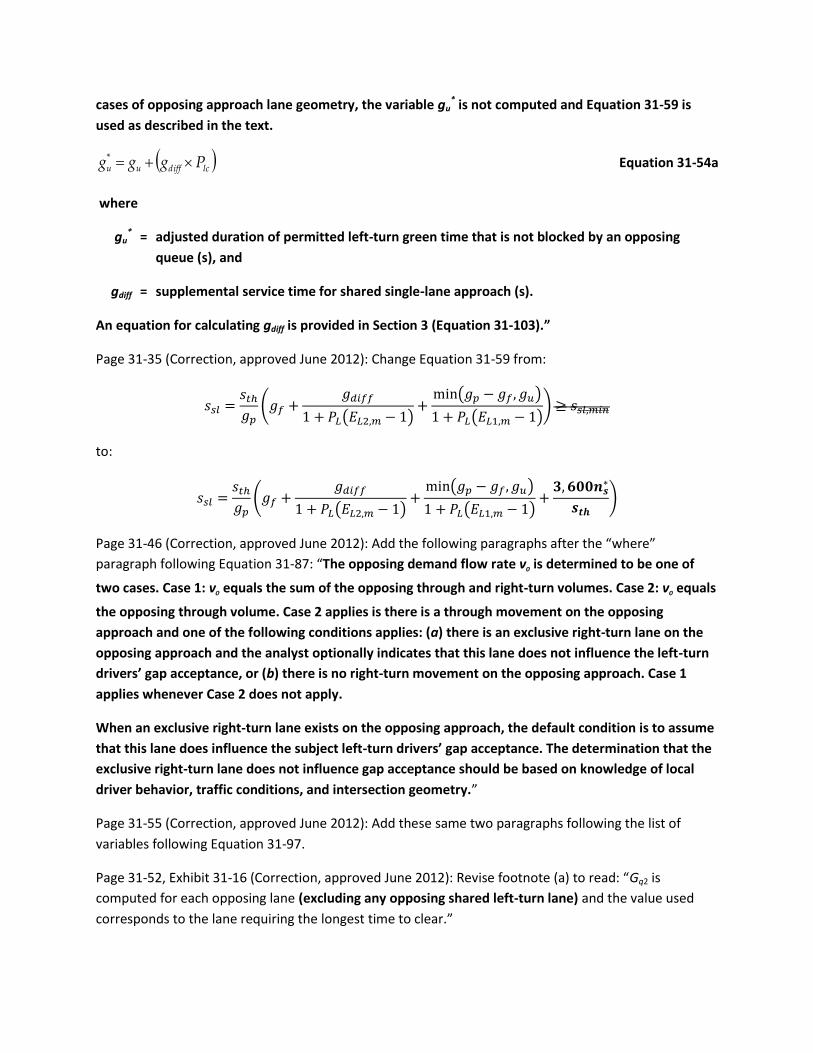
cases of opposing approach lane geometry, the variable gu* is not computed and Equation 31-59 is
used as described in the text.
lcdiffuu Pggg * Equation 31-54a
where
gu* = adjusted duration of permitted left-turn green time that is not blocked by an opposing
queue (s), and
gdiff = supplemental service time for shared single-lane approach (s).
An equation for calculating gdiff is provided in Section 3 (Equation 31-103).”
Page 31-35 (Correction, approved June 2012): Change Equation 31-59 from:
(
( ) ( )
( ))
to:
(
( ) ( )
( )
)
Page 31-46 (Correction, approved June 2012): Add the following paragraphs after the “where”
paragraph following Equation 31-87: “The opposing demand flow rate vo is determined to be one of
two cases. Case 1: vo equals the sum of the opposing through and right-turn volumes. Case 2: vo equals
the opposing through volume. Case 2 applies is there is a through movement on the opposing
approach and one of the following conditions applies: (a) there is an exclusive right-turn lane on the
opposing approach and the analyst optionally indicates that this lane does not influence the left-turn
drivers’ gap acceptance, or (b) there is no right-turn movement on the opposing approach. Case 1
applies whenever Case 2 does not apply.
When an exclusive right-turn lane exists on the opposing approach, the default condition is to assume
that this lane does influence the subject left-turn drivers’ gap acceptance. The determination that the
exclusive right-turn lane does not influence gap acceptance should be based on knowledge of local
driver behavior, traffic conditions, and intersection geometry.”
Page 31-55 (Correction, approved June 2012): Add these same two paragraphs following the list of
variables following Equation 31-97.
Page 31-52, Exhibit 31-16 (Correction, approved June 2012): Revise footnote (a) to read: “Gq2 is
computed for each opposing lane (excluding any opposing shared left-turn lane) and the value used
corresponds to the lane requiring the longest time to clear.”

Page 31-54 (Correction, approved June 2012): Add the following after “Other variables are as previously
defined” following Equation 31-96: “The approach is considered to have one lane for this step if (a)
there is one lane serving all vehicles on the approach, and (b) the left-turn movement on this
approach shares the one lane.”
Page 31-55 (Correction, approved June 2012): Change the definition of tfh in Equation 31-97 from
“follow-up headway (4.5 if the subject left turn is served in a shared lane, 2.5 if the subject left turn is
served in an exclusive lane) (s)” to “follow-up headway = 2.5 (s)”.
Page 31-56 (Correction, approved June 2012): Add the following paragraphs after “Other variables are
as previously defined” following Equation 31-100: “There is one lane on the opposing approach when
this approach has one lane serving through vehicles, a left-turn movement that shares the through
lane, and one of the following conditions applies: (a) there is an exclusive right-turn lane on the
opposing approach and the analyst optionally indicates that this lane does not influence the left-turn
drivers’ gap acceptance, (b) there is a right-turn movement on the opposing approach and it shares
the through lane, or (c) there is no right-turn movement on the opposing approach.
When an exclusive right-turn lane exists on the opposing approach, the default condition is to assume
that this lane does influence the subject left-turn drivers’ gap acceptance. The determination that the
exclusive right-turn lane does not influence gap acceptance should be based on knowledge of local
driver behavior, traffic conditions, and intersection geometry.”
Page 31-58 (Correction, approved June 2012). Add these same two paragraphs following the statement
of variables for Equation 31-104.
Page 31-56 (Correction, approved December 2013): Change Equation 31-99 from
0.1)1(1
2
lto
n
ltoL
P
PE
q
to L
lto
n
ltoL E
P
PE
q
)1(1
2
Page 31-56 (Correction, approved December 2013): Change Equation 31-100 from
0.0)(5.0 fupq gggn to 0.0)(278.0 fupq gggn
Page 31-56 (Correction, approved December 2013): Add the following paragraph after “Other variables
are as previously defined” following Equation 31-100: The value of 0.278 in Equation 31-100 represents
the approximate saturation flow rate (in vehicles per second) of vehicles in the opposing shared lane.
This approximation simplifies the calculation and provides sufficient accuracy in the estimation of nq.
Following page 31-124 (Correction, approved January 2012): A section on generalized daily service
volumes for signalized intersections was inadvertently omitted from the chapter. Insert new page 31-
125 with the missing material.
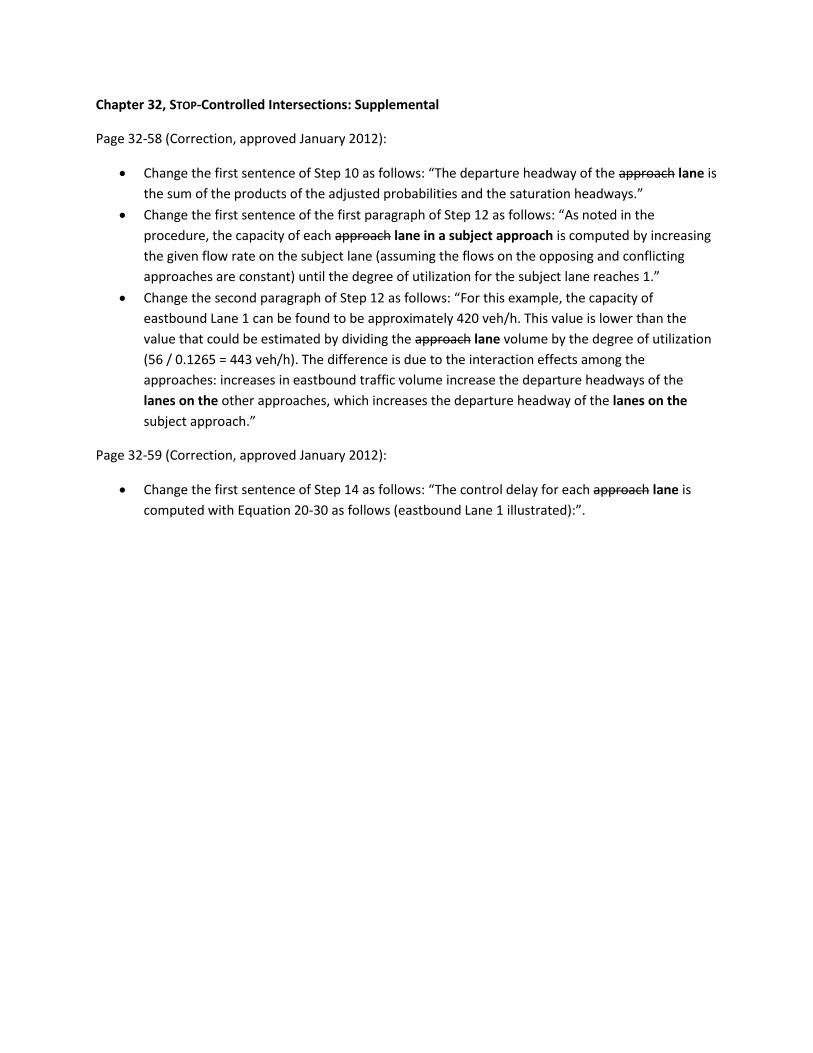
Chapter 32, STOP-Controlled Intersections: Supplemental
Page 32-58 (Correction, approved January 2012):
Change the first sentence of Step 10 as follows: “The departure headway of the approach lane is
the sum of the products of the adjusted probabilities and the saturation headways.”
Change the first sentence of the first paragraph of Step 12 as follows: “As noted in the
procedure, the capacity of each approach lane in a subject approach is computed by increasing
the given flow rate on the subject lane (assuming the flows on the opposing and conflicting
approaches are constant) until the degree of utilization for the subject lane reaches 1.”
Change the second paragraph of Step 12 as follows: “For this example, the capacity of
eastbound Lane 1 can be found to be approximately 420 veh/h. This value is lower than the
value that could be estimated by dividing the approach lane volume by the degree of utilization
(56 / 0.1265 = 443 veh/h). The difference is due to the interaction effects among the
approaches: increases in eastbound traffic volume increase the departure headways of the
lanes on the other approaches, which increases the departure headway of the lanes on the
subject approach.”
Page 32-59 (Correction, approved January 2012):
Change the first sentence of Step 14 as follows: “The control delay for each approach lane is
computed with Equation 20-30 as follows (eastbound Lane 1 illustrated):”.

Highway Capacity Manual 2010
Chapter 31/Signalized Intersections: Supplemental Page 31-125 Generalized Daily Service Volumes January 2012
9. GENERALIZED DAILY SERVICE VOLUMES
Exhibit 31-69 shows an illustrative generalized service volume table for a
signalized intersection. This particular exhibit has been prepared for illustrative
purposes only and should not be used for any specific planning or preliminary
engineering application because the values in the table are highly dependent on
the assumed input variables. Care must be taken in constructing a table that the
analyst believes is representative of a “typical” signalized intersection within the
planning area. In the example table, the volumes represent the total approach
volume (sum of the left, through, and right turn movements). This particular
table illustrates how hourly service volumes vary with the number of through
lanes on the approach and the through movement g/C ratio.
The hourly service volumes could easily be converted to daily service
volumes with the application of appropriate K- and D-factors. Step-by-step
instructions are provided in Appendix B of Chapter 6 for users wishing to learn
more about constructing one’s own service volume table.
Through Movement g/C Ratio
Number of Through
Lanes LOS B LOS C LOS D LOS E
0.40 1 130 610 730 800 2 270 1,220 1,430 1,550 3 380 1,620 1,980 2,000
0.45 1 320 720 840 910 2 630 1,410 1,610 1,740 3 840 1,780 2,000 2,250
0.5 1 490 830 940 1,020 2 940 1,580 1,790 1,930 3 1,180 1,930 2,000 2,500
Notes: LOS E threshold defined by control delay greater than 80 s/veh or v/c >1.0. Assumed values for all entries:
Heavy vehicles: 0% PHF: 0.92 Lane width: 12 ft Grade: 0% Separate left-turn lane: yes Separate right-turn lane: no Pre-timed control Cycle length: 90 s Lost time: 4 s/phase Protected left-turn phasing: yes g/C ratio for left turn movement: 0.10 Parking maneuvers/hour: 0 Buses stopping per hour: 0 Percent left turns: 10% Percent right turns: 10%
Exhibit 31-69 Illustrative Generalized Service Volumes for Signalized Intersections (veh/h)