highway capacity measurements: grade crossing saturation
TRANSCRIPT
Highway Capacity Measurements:
Grade Crossing Saturation Flows
Chicago Region, 2013
Draft
Technical Update
Chicago Metropolitan Agency for Planning
October, 2015
Table of Contents Introduction and Summary ...................................................................................................................... 1
Background and Literature Review ........................................................................................................ 2
Lessons from Literature Review............................................................................................................ 6
Data Collection and Analysis Procedures .............................................................................................. 7
Data Collection ..................................................................................................................................... 7
Site Selection ......................................................................................................................................... 7
Processing and Analysis ....................................................................................................................... 9
Challenges ............................................................................................................................................. 9
Results ........................................................................................................................................................ 10
Conclusion ................................................................................................................................................ 12
Appendix: Detailed Observation Information ..................................................................................... 13
Page 1 Grade-Crossing Saturation Flows
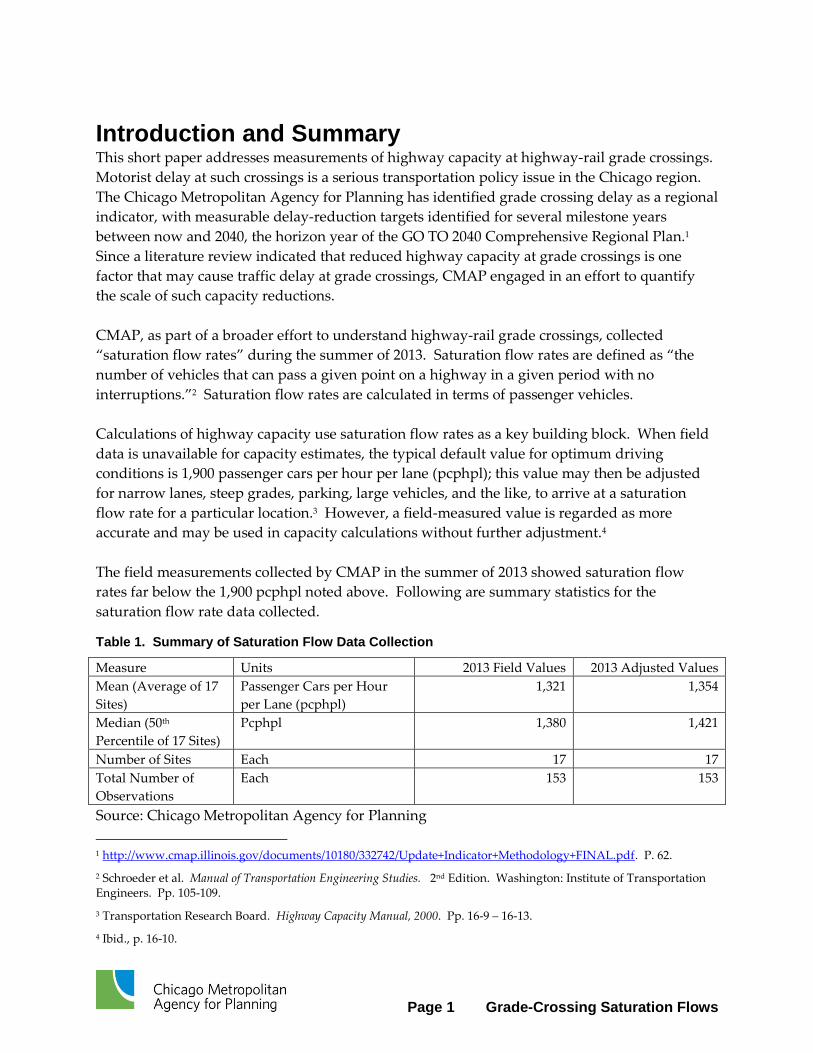
Introduction and Summary This short paper addresses measurements of highway capacity at highway-rail grade crossings.
Motorist delay at such crossings is a serious transportation policy issue in the Chicago region.
The Chicago Metropolitan Agency for Planning has identified grade crossing delay as a regional
indicator, with measurable delay-reduction targets identified for several milestone years
between now and 2040, the horizon year of the GO TO 2040 Comprehensive Regional Plan.1
Since a literature review indicated that reduced highway capacity at grade crossings is one
factor that may cause traffic delay at grade crossings, CMAP engaged in an effort to quantify
the scale of such capacity reductions.
CMAP, as part of a broader effort to understand highway-rail grade crossings, collected
“saturation flow rates” during the summer of 2013. Saturation flow rates are defined as “the
number of vehicles that can pass a given point on a highway in a given period with no
interruptions.”2 Saturation flow rates are calculated in terms of passenger vehicles.
Calculations of highway capacity use saturation flow rates as a key building block. When field
data is unavailable for capacity estimates, the typical default value for optimum driving
conditions is 1,900 passenger cars per hour per lane (pcphpl); this value may then be adjusted
for narrow lanes, steep grades, parking, large vehicles, and the like, to arrive at a saturation
flow rate for a particular location.3 However, a field-measured value is regarded as more
accurate and may be used in capacity calculations without further adjustment.4
The field measurements collected by CMAP in the summer of 2013 showed saturation flow
rates far below the 1,900 pcphpl noted above. Following are summary statistics for the
saturation flow rate data collected.
Table 1. Summary of Saturation Flow Data Collection
Measure Units 2013 Field Values 2013 Adjusted Values
Mean (Average of 17
Sites)
Passenger Cars per Hour
per Lane (pcphpl)
1,321 1,354
Median (50th
Percentile of 17 Sites)
Pcphpl 1,380 1,421
Number of Sites Each 17 17
Total Number of
Observations
Each 153 153
Source: Chicago Metropolitan Agency for Planning
1 http://www.cmap.illinois.gov/documents/10180/332742/Update+Indicator+Methodology+FINAL.pdf. P. 62.
2 Schroeder et al. Manual of Transportation Engineering Studies. 2nd Edition. Washington: Institute of Transportation Engineers. Pp. 105-109.
3 Transportation Research Board. Highway Capacity Manual, 2000. Pp. 16-9 – 16-13.
4 Ibid., p. 16-10.
Page 2 Grade-Crossing Saturation Flows
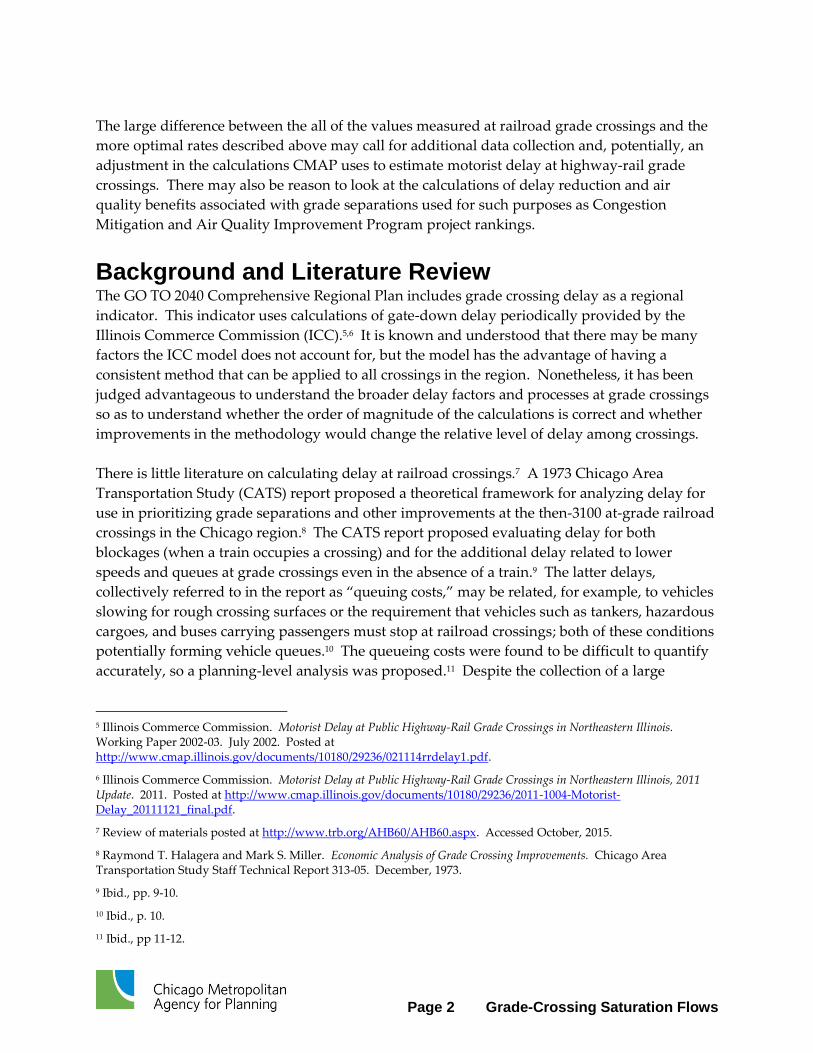
The large difference between the all of the values measured at railroad grade crossings and the
more optimal rates described above may call for additional data collection and, potentially, an
adjustment in the calculations CMAP uses to estimate motorist delay at highway-rail grade
crossings. There may also be reason to look at the calculations of delay reduction and air
quality benefits associated with grade separations used for such purposes as Congestion
Mitigation and Air Quality Improvement Program project rankings.
Background and Literature Review The GO TO 2040 Comprehensive Regional Plan includes grade crossing delay as a regional
indicator. This indicator uses calculations of gate-down delay periodically provided by the
Illinois Commerce Commission (ICC).5,6 It is known and understood that there may be many
factors the ICC model does not account for, but the model has the advantage of having a
consistent method that can be applied to all crossings in the region. Nonetheless, it has been
judged advantageous to understand the broader delay factors and processes at grade crossings
so as to understand whether the order of magnitude of the calculations is correct and whether
improvements in the methodology would change the relative level of delay among crossings.
There is little literature on calculating delay at railroad crossings.7 A 1973 Chicago Area
Transportation Study (CATS) report proposed a theoretical framework for analyzing delay for
use in prioritizing grade separations and other improvements at the then-3100 at-grade railroad
crossings in the Chicago region.8 The CATS report proposed evaluating delay for both
blockages (when a train occupies a crossing) and for the additional delay related to lower
speeds and queues at grade crossings even in the absence of a train.9 The latter delays,
collectively referred to in the report as “queuing costs,” may be related, for example, to vehicles
slowing for rough crossing surfaces or the requirement that vehicles such as tankers, hazardous
cargoes, and buses carrying passengers must stop at railroad crossings; both of these conditions
potentially forming vehicle queues.10 The queueing costs were found to be difficult to quantify
accurately, so a planning-level analysis was proposed.11 Despite the collection of a large
5 Illinois Commerce Commission. Motorist Delay at Public Highway-Rail Grade Crossings in Northeastern Illinois. Working Paper 2002-03. July 2002. Posted at http://www.cmap.illinois.gov/documents/10180/29236/021114rrdelay1.pdf.
6 Illinois Commerce Commission. Motorist Delay at Public Highway-Rail Grade Crossings in Northeastern Illinois, 2011 Update. 2011. Posted at http://www.cmap.illinois.gov/documents/10180/29236/2011-1004-Motorist-Delay_20111121_final.pdf.
7 Review of materials posted at http://www.trb.org/AHB60/AHB60.aspx. Accessed October, 2015.
8 Raymond T. Halagera and Mark S. Miller. Economic Analysis of Grade Crossing Improvements. Chicago Area Transportation Study Staff Technical Report 313-05. December, 1973.
9 Ibid., pp. 9-10.
10 Ibid., p. 10.
11 Ibid., pp 11-12.
Page 3 Grade-Crossing Saturation Flows
amount of data supporting the analysis, no record could be found of this theoretical foundation
having been implemented at CATS, perhaps because of skepticism voiced at the end of the
report about the validity of simplifying assumptions, particularly capital costs of
improvements.12 Unpublished analyses cannot be ruled out.
The most comprehensive review of delay at highway-rail grade crossings, where results were
computed, is a paper by James Powell, “Effects of Rail-Highway Grade Crossings on Highway
Users,” dating from 1982.13 Like the suggested CATS analysis, Powell differentiates between
delay related to a gate-down condition (“occurrence delay”) and delay not related to a gate-
down condition (“non-occurrence delay”). In addition, Powell differentiated between crossings
impacted by adjacent highway traffic controls (“non-isolated crossings”) and those not
impacted by such controls (“isolated crossings,” the focus of his research). Moreover, Powell
had a traffic engineer’s understanding of how nuances in the time-of-day and occurrence-
duration characteristics of traffic could substantially change estimates of delay:
…In the estimation of delays and highway-user costs associated with train blockage of a
crossing, one major study assumes highway vehicle and train volumes to be uniformly
distributed over a 24-hour day. In reality, both vehicle and train traffic can follow
greatly different time patterns over a day, which affects delay a good deal. Another
difficulty is that blockage times are averaged such that each train is treated as though it
causes the same fixed blockage time. Actually, all other things being equal, the expected
vehicle delay of one 10-minute train is on the order of four 5-minute trains.14
Powell suggested that simplified models for train occurrences would be appropriate where
accurate time-of-day train and vehicle data is available, where arrivals are random, and where
the flow ratios (arrival rate divided by departure rate) are <= 0.50.15 Powell’s original models
are discussed for occurrences when the conditions above are not met and for non-occurrence
conditions. Non-occurrence delay is not calculated, but non-occurrence costs are calculated
along with occurrence costs. Nonetheless, even for the busy railroads studied, nonoccurrence
costs were found to exceed occurrence costs.16
Okitsu, Louie, and Lo extended Powell’s work for a 2009-2010 study of 33 grade crossings in the
Alameda Corridor East, with the intention that the work would be used for the prioritization of
grade crossing separations and other improvements.17 The study was focused on providing a
12 Ibid., pp 25-26.
13 James L. Powell. “Effects of Rail-Highway Grade Crossings on Highway Users.” Transportation Research Record 841. Transportation Research Board. Pp. 21 – 29.
14 Ibid., p. 22.
15 Ibid., p. 25
16 Ibid.
17 Walter Okitsu, Jonathan Louie, and Kathy Lo. “Simulation-Free Railroad Grade Crossing Delay Calculations.” Paper presented at Western District, Institute of Transportation Engineers 2010 Annual Meeting. Posted at
Page 4 Grade-Crossing Saturation Flows
delay estimate for each train event; train event data was collected with 24-hour video recordings
of the crossings.18 The work included not only an analysis of isolated intersections (without
upstream or downstream signal preemption), but also an adjustment for the saturation flow rate
for preemptions based on the number of upstream critical intersection phases and the
downstream ratio of green-time to signal cycle length.19 The adjustments rely on Transportation
Research Circular 212, which has since been superseded by the Highway Capacity Manual, so
the validity of these calculations needs to be determined.
Okitsu, Louie, and Lo thus lay out a simplified method of calculating motorist delay at grade
crossings, relying on the saturation flow rate, vehicle arrival rate, and gate-down duration. One
item to note in the paper is the use of a default 1700 vehicles per hour per lane saturation flow
rate.20
Like Powell, this study used methods based on classic traffic flow theory. Despite the
weaknesses identified above, which can be addressed with data collection, the fundamental
soundness of this method calls for additional investigation into whether it can be deployed on a
regional scale in the Chicago region, at least for crossings with high traffic volumes. This is
particularly true if reasonable saturation flow rates can be estimated. Gate-down event times
from crossing-gate event recorders or interconnected highway traffic signal event recorders
might be used to derive an accurate reading of gate-down event durations.21
http://www.westernite.org/annualmeetings/sanfran10/Papers/Session%204_Papers/ITE%20Paper_4A-Okitsu.pdf. Accessed October, 2015.
18 Ibid., p. 1.
19 Ibid., p. 5.
20 Ibid. Again, this value derives from the Transportation Research Circular 212, (“Interim Materials on Highway Capacity,” Transportation Research Board, 1980) so, putting aside the fact that it may be too high for grade crossings, the value may be out of date.
21 Using highway signal event recorders necessarily implies an interconnected signal, not an isolated signal, potentially adding complexity to the analysis. Railroad crossing gate controller event recorder data would need to be acquired from the railroads, also adding complexity.
Page 5 Grade-Crossing Saturation Flows
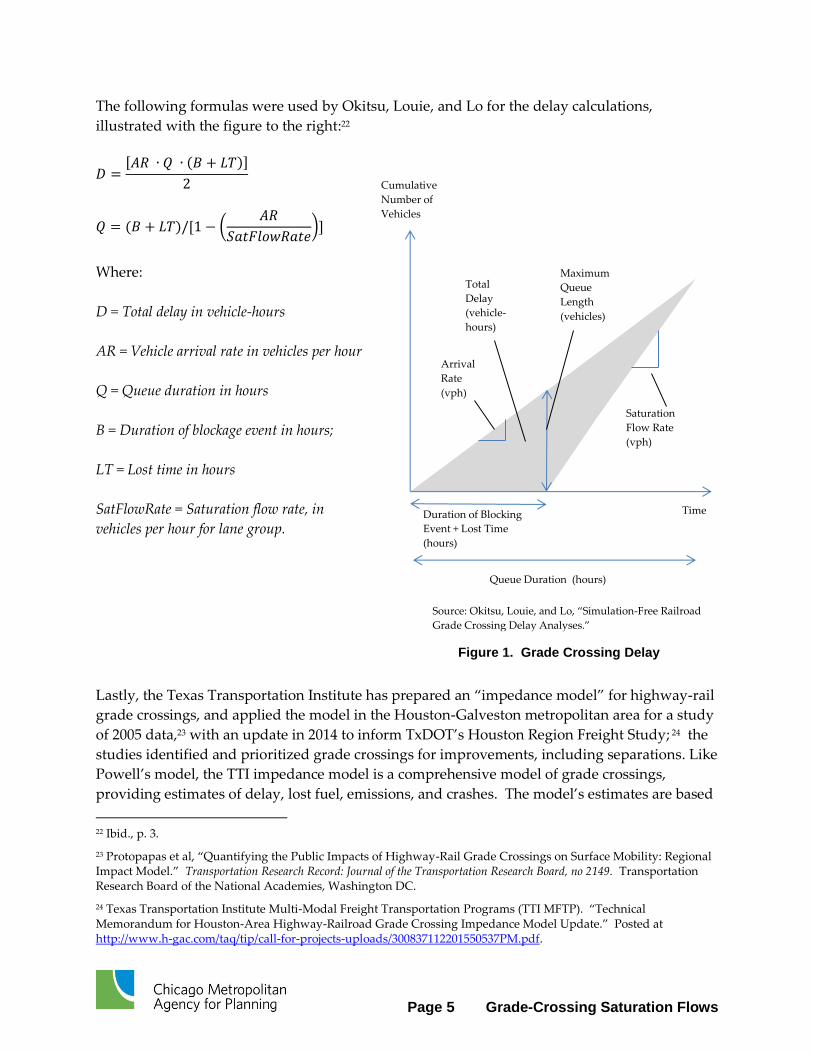
The following formulas were used by Okitsu, Louie, and Lo for the delay calculations,
illustrated with the figure to the right:22
𝐷 =[𝐴𝑅 ∙ 𝑄 ∙ (𝐵 + 𝐿𝑇)]
2
𝑄 = (𝐵 + 𝐿𝑇)/[1 − (𝐴𝑅
𝑆𝑎𝑡𝐹𝑙𝑜𝑤𝑅𝑎𝑡𝑒)]
Where:
D = Total delay in vehicle-hours
AR = Vehicle arrival rate in vehicles per hour
Q = Queue duration in hours
B = Duration of blockage event in hours;
LT = Lost time in hours
SatFlowRate = Saturation flow rate, in
vehicles per hour for lane group.
Lastly, the Texas Transportation Institute has prepared an “impedance model” for highway-rail
grade crossings, and applied the model in the Houston-Galveston metropolitan area for a study
of 2005 data,23 with an update in 2014 to inform TxDOT’s Houston Region Freight Study; 24 the
studies identified and prioritized grade crossings for improvements, including separations. Like
Powell’s model, the TTI impedance model is a comprehensive model of grade crossings,
providing estimates of delay, lost fuel, emissions, and crashes. The model’s estimates are based
22 Ibid., p. 3.
23 Protopapas et al, “Quantifying the Public Impacts of Highway-Rail Grade Crossings on Surface Mobility: Regional Impact Model.” Transportation Research Record: Journal of the Transportation Research Board, no 2149. Transportation Research Board of the National Academies, Washington DC.
24 Texas Transportation Institute Multi-Modal Freight Transportation Programs (TTI MFTP). “Technical Memorandum for Houston-Area Highway-Railroad Grade Crossing Impedance Model Update.” Posted at http://www.h-gac.com/taq/tip/call-for-projects-uploads/300837112201550537PM.pdf.
Arrival
Rate
(vph)
Time
Cumulative
Number of
Vehicles
Saturation
Flow Rate
(vph)
Maximum
Queue
Length
(vehicles)
Total
Delay
(vehicle-
hours)
Duration of Blocking
Event + Lost Time
(hours)
Queue Duration (hours)
Source: Okitsu, Louie, and Lo, “Simulation-Free Railroad
Grade Crossing Delay Analyses.”
Figure 1. Grade Crossing Delay
Page 6 Grade-Crossing Saturation Flows
on train and traffic activity by time of day. The TTI model also includes vehicle behavior,
including acceleration and deceleration around the crossing. However, it’s unclear from the
available reports whether variations in train length or crossing gate-down times are included in
the model; only “average” characteristics are reported in the papers.25 The scale of the TTI
studies is large; the focus is the entire Houston region. However, the detailed analysis of
crossings in such a large region was facilitated by limiting the analysis to crossings with current
or projected AADT levels above 10,000 vehicles per day.26
One notable aspect of the Houston studies is the collection of railroad information. For the
initial study, the Union Pacific and BNSF Railroads
…provided records of daily traffic data from a period in August, 2005…. The railroads
provided data from their respective computer-aided dispatching systems. These data
came in the form of train movements past various ‘control points’ (CPs), which read
train identification data and record the time of day that a train passes. By accumulating
this information, it was possible to determine the movement of trains past pairs of CPs
and calculate the frequency, speed, direction of travel, and time of day that trains moved
during the August sample period. To assign crossing closure time, each highway-rail
grade crossing was place on the network relative to CP pairs.27
For the more recent TTI study, “gate-arm activated” video capture was used to collect delay
time per hour caused by train activity and also the number of trains per day.”28
Lessons from Literature Review Based on the papers described above, a few lessons can be drawn for estimating motorist grade
crossing delay in the Chicago region:
Event durations matter. Basing delay estimates on the average event duration or the
total daily gate-down time will substantially underestimate motorist delay. Ideally, this
data would come from event recorders at crossings. This would require cooperation
from railroads. Video records would provide a second-best alternative.
Since highway traffic levels matter, an analysis by time of day will yield better results.
In addition, unlike some cities, Chicago has substantial commuter train peak-period
activity that affects the time of day profile for both freight and commuter trains. Unlike
the situation in Houston, time-of-day activity estimates for trains would be useful in
Chicago.
Non-occurrence delay at crossings, when the crossing gate is in the up position, may be
substantial. An effort to quantify this delay may be useful in understanding the full
25 Ibid., p. 10.
26 Ibid., pp. 8-9.
27 Protopapas, et al, op cit., pp. 103-104.
28 TTI MFTP, op cit., p 9.
Page 7 Grade-Crossing Saturation Flows
impact of a crossing when evaluating and prioritizing a crossing for various
improvements, including expensive separations.
The bottom line is that a traffic-engineering approach is necessary for evaluating delay
at some grade crossings. Working from Figure 1, any delay after the gates are raised
(represented by the area to the right of the line labeled “maximum queue length”) are
not accounted for in the current calculations used by CMAP. If the arrival rate (traffic
volume) at a crossing is high, or if the saturation flow rate is low, this additional delay
could be substantial. Conversely, this detailed calculation is not necessary for crossings
with low traffic volumes.
Working from the summary point immediately above, reducing delay at grade crossings
may not always require a grade separation. In some cases, improving crossing quality
to raise saturation flow rates or adding lanes for the highway section may also
substantially reduce delay. Thus, an understanding of saturation flow rates is necessary
to understand highway capacity across grade crossings. This requires more
investigation.
Data Collection and Analysis Procedures
Data Collection CMAP’s saturation flow rate data collection procedures follow those laid out in the Institute of
Transportation Engineers’ Manual of Transportation Engineering Studies.29 The procedure,
typically applied to highway traffic signals, is also easily applied methodologically and
theoretically to gate-down conditions at railroad grade crossings. For grade crossings, this
analysis estimates the “ideal” traffic flow past the stop bar in a lane in a hypothetical hour of
uninterrupted gate-up condition given rail crossing characteristics. At the beginning of a gate-
up period, a data collection intern will determine the elapsed time from when the rear wheel of
the fourth vehicle crosses the stop bar and when the tenth vehicle crosses the stop bar. The
calculation only applies to passenger vehicles, so if a truck or bus is among the first seven
vehicles crossing the stop bar, that observation is scrubbed. If a truck or bus is among the
seventh to the tenth vehicles, the data collection is truncated at the previous vehicle. If there are
not at least seven vehicles in the queue of vehicles waiting to cross the railroad at the beginning
of the gate-up period, that observation is also scrubbed.
Site Selection Saturation flow rate data was collected as an adjunct data collection process while other basic
data collection was being conducted for select grade crossings. The grade crossings were
selected for study based on three factors:
CREATE Program grade separation projects (6 of the 17 sites are proposed CREATE
grade separation projects);
Sites estimated as high-delay by the Illinois Commerce Commission (ICC);
Freight planning stakeholder suggestions.
29 Shroeder et al, op cit., pp 105-109.
Page 8 Grade-Crossing Saturation Flows
Note that the ICC method does not take into account saturation flow rates or, more generally,
crossing conditions, but rather gate-down times and crossing volumes. So the results of this
study are independent of the ICC delay estimates.
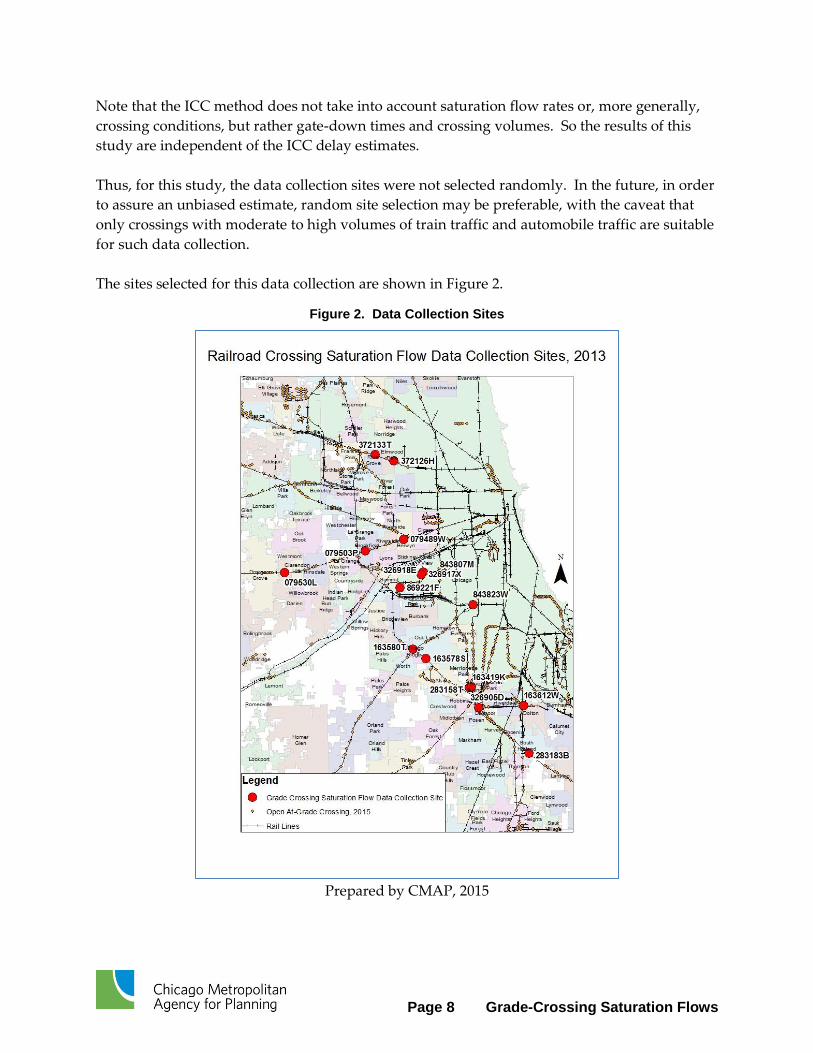
Thus, for this study, the data collection sites were not selected randomly. In the future, in order
to assure an unbiased estimate, random site selection may be preferable, with the caveat that
only crossings with moderate to high volumes of train traffic and automobile traffic are suitable
for such data collection.
The sites selected for this data collection are shown in Figure 2.
Figure 2. Data Collection Sites
Prepared by CMAP, 2015
Page 9 Grade-Crossing Saturation Flows
Processing and Analysis From the elapsed time from the fourth vehicle for each observation, the saturation flow rate is
calculated using the following formula:
𝑀𝑒𝑎𝑛 𝑆𝑎𝑡𝑢𝑟𝑎𝑡𝑖𝑜𝑛 𝐹𝑙𝑜𝑤 𝑅𝑎𝑡𝑒
=3600 ∙ 𝑇𝑜𝑡𝑎𝑙 𝑁𝑢𝑚𝑏𝑒𝑟 𝑜𝑓 𝑂𝑏𝑠𝑒𝑟𝑣𝑎𝑡𝑖𝑜𝑛𝑠
∑ [𝑡(7) − 𝑡(4)]𝑛𝑖=1
3+
∑ [𝑡(8) − 𝑡(4)]𝑝𝑖=1
4+
∑ [𝑡(9) − 𝑡(4)]𝑞𝑖=1
5+
∑ [𝑡(10) − 𝑡(4)]𝑟𝑖=1
6
Where
𝑛 = 𝑁𝑢𝑚𝑏𝑒𝑟 𝑜𝑓 𝑣𝑎𝑙𝑖𝑑 𝑜𝑏𝑠𝑒𝑟𝑣𝑎𝑡𝑖𝑜𝑛𝑠 𝑤𝑖𝑡ℎ 7 𝑣𝑒ℎ𝑖𝑐𝑙𝑒𝑠;
𝑝 = 𝑁𝑢𝑚𝑏𝑒𝑟 𝑜𝑓 𝑣𝑎𝑙𝑖𝑑 𝑜𝑏𝑠𝑒𝑟𝑣𝑎𝑡𝑖𝑜𝑛𝑠 𝑤𝑖𝑡ℎ 8 𝑣𝑒ℎ𝑖𝑐𝑙𝑒𝑠;
𝑞 = 𝑁𝑢𝑚𝑏𝑒𝑟 𝑜𝑓 𝑣𝑎𝑙𝑖𝑑 𝑜𝑏𝑠𝑒𝑟𝑣𝑎𝑡𝑖𝑜𝑛𝑠 𝑤𝑖𝑡ℎ 9 𝑣𝑒ℎ𝑖𝑐𝑙𝑒𝑠;
𝑟 = 𝑁𝑢𝑚𝑏𝑒𝑟 𝑜𝑓 𝑣𝑎𝑙𝑖𝑑 𝑜𝑏𝑠𝑒𝑟𝑣𝑎𝑡𝑖𝑜𝑛𝑠 𝑤𝑖𝑡ℎ 10 𝑣𝑒ℎ𝑖𝑐𝑙𝑒𝑠; and 𝑡(𝑘) − 𝑡(4) = 𝐸𝑙𝑎𝑝𝑠𝑒𝑑 𝑡𝑖𝑚𝑒 𝑖𝑛 𝑠𝑒𝑐𝑜𝑛𝑑𝑠 𝑓𝑟𝑜𝑚 𝑟𝑒𝑎𝑟 𝑤ℎ𝑒𝑒𝑙 𝑜𝑓 𝑓𝑜𝑢𝑡ℎ 𝑣𝑒ℎ𝑖𝑐𝑙𝑒 𝑐𝑟𝑜𝑠𝑠𝑖𝑛𝑔
𝑠𝑡𝑜𝑝 𝑏𝑎𝑟 𝑡𝑜 𝑟𝑒𝑎𝑟 𝑤ℎ𝑒𝑒𝑙 𝑜𝑓 𝑘𝑡ℎ 𝑣𝑒ℎ𝑖𝑐𝑙𝑒 𝑐𝑟𝑜𝑠𝑠𝑖𝑛𝑔 𝑠𝑡𝑜𝑝 𝑏𝑎𝑟.
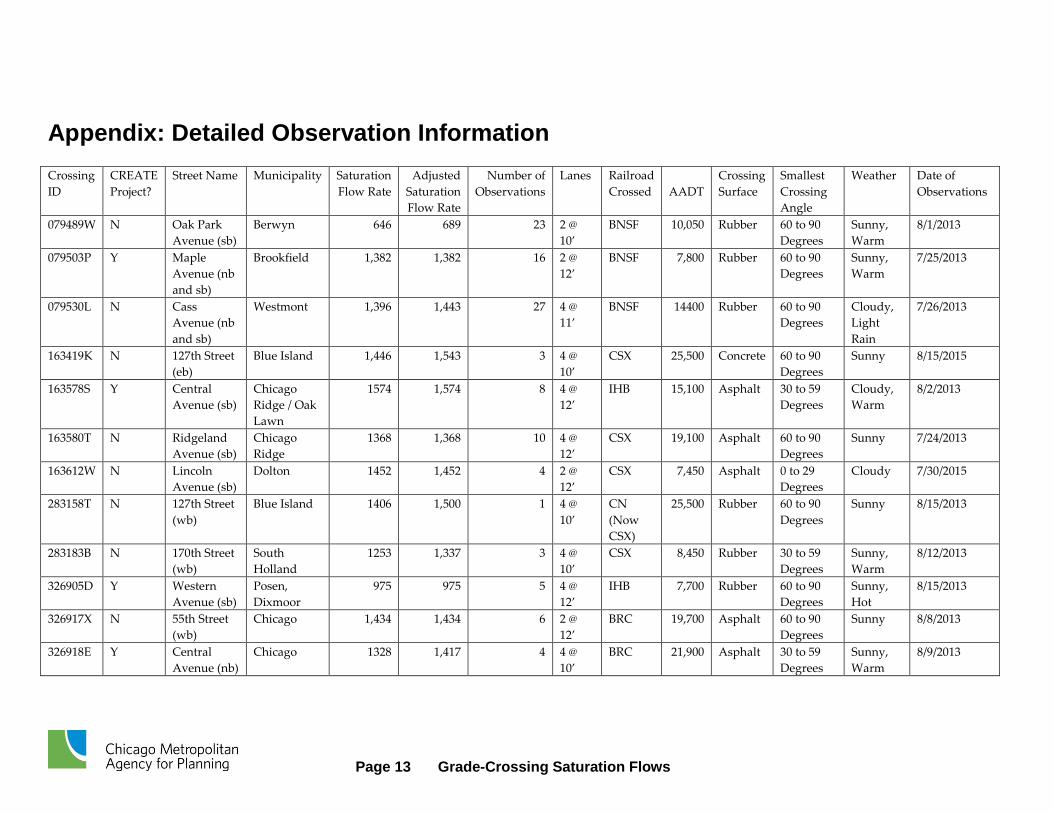
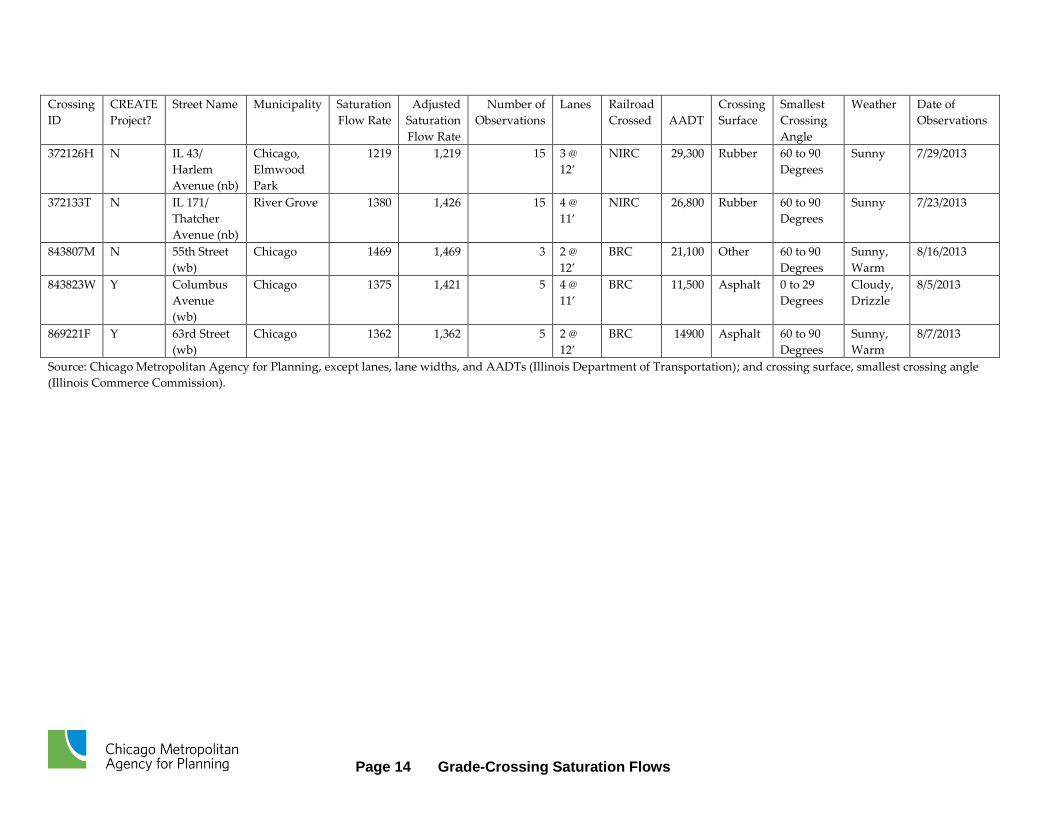
A full compilation of the data collected is available in the Appendix. The compilation also
includes supplementary traffic and roadway data from IDOT and the ICC. In addition, the data
collectors also used the saturation flow rate data collection form available in the ITE Manual; a
sample of a completed form is also in the Appendix.
An adjusted saturation flow rate was calculated based on narrow lane widths at some locations.
Based on the formula for lane width adjustments in Exhibit 16-7 in the 2000 Highway Capacity
Manual, the “ideal” saturation flow rates were adjusted up 3.33% for each foot difference
between 12-feet and the actual lane width reported in IDOT’s highway inventory.30 The
resulting adjusted saturation flow rates, shown in Tables 1 through 3 and the Appendix, allow
for a comparison of saturation flows without the effects of reduced lane widths.
Challenges Collecting saturation flow rates at highway-rail grade crossings presents a number of technical
challenges.
Trucks and Buses
In the Chicago area, particularly in freight-oriented areas of the region, the biggest challenge to
collecting saturation flow rates is the large number of trucks and buses on the roadways. If a
truck or bus is within the first seven vehicles crossing a rail crossing, the observation is
scrubbed, since the saturation flow rates are in terms of passenger cars.
30 Transportation Research Board. Highway Capacity Manual 2000. Exhibit 16-7. P. 16-11.
Page 10 Grade-Crossing Saturation Flows
Low Numbers of Trains and Passenger Cars
The number of data collection points per day is limited by the number of trains in the period.
Thus, while saturation flow rates may sometimes be collected at the rate of about 24 per hour or
more at highway traffic signals, only a few saturation flows may be collected at train crossings.
Saturation flow data collection is limited to higher-volume roads, owing to the need to have
seven vehicles queued at the beginning of a gate-up period to achieve a valid observation.
However, in general, successful observations tended to be at the high end of the potential
vehicle counts; of the 153 valid observations, 10 were with the minimum of seven vehicles; 14
were with eight vehicles, 22 were with nine vehicles, and 107 – more than three-fourths – were
with the maximum ten vehicles. The seventeen data collection sites had an average of 16,800
AADT.
The peak period for passenger cars may yield high numbers of trains per hour for analysis on
commuter rail lines. Thus, the highest numbers of valid observations were on the BNSF line, a
busy commuter corridor. During peak travel periods for passenger cars, some crossings may
have a curfew for some freight trains, resulting in low productivity on freight-only rail lines.
Results
Following is a summary of the measures of saturation flow rates.
Table 2: Summary of Saturation Flow Rates
Measure Units 2013 Field Values 2013 Adjusted Values
(see text)
Mean (Average of 17 Sites) Passenger Cars per
Hour per Lane
(pcphpl)
1,321 1,354
Median (50th Percentile of
17 Sites)
Pcphpl 1,380 1,421
Maximum (of 17 Sites) Pcphpl 1,574 1,574
Minimum (of 17 Sites) Pcphpl 646 689
Number of Sites Each 17 17
Total Number of
Observations
Each 153 153
Source: Chicago Metropolitan Agency for Planning
Page 11 Grade-Crossing Saturation Flows
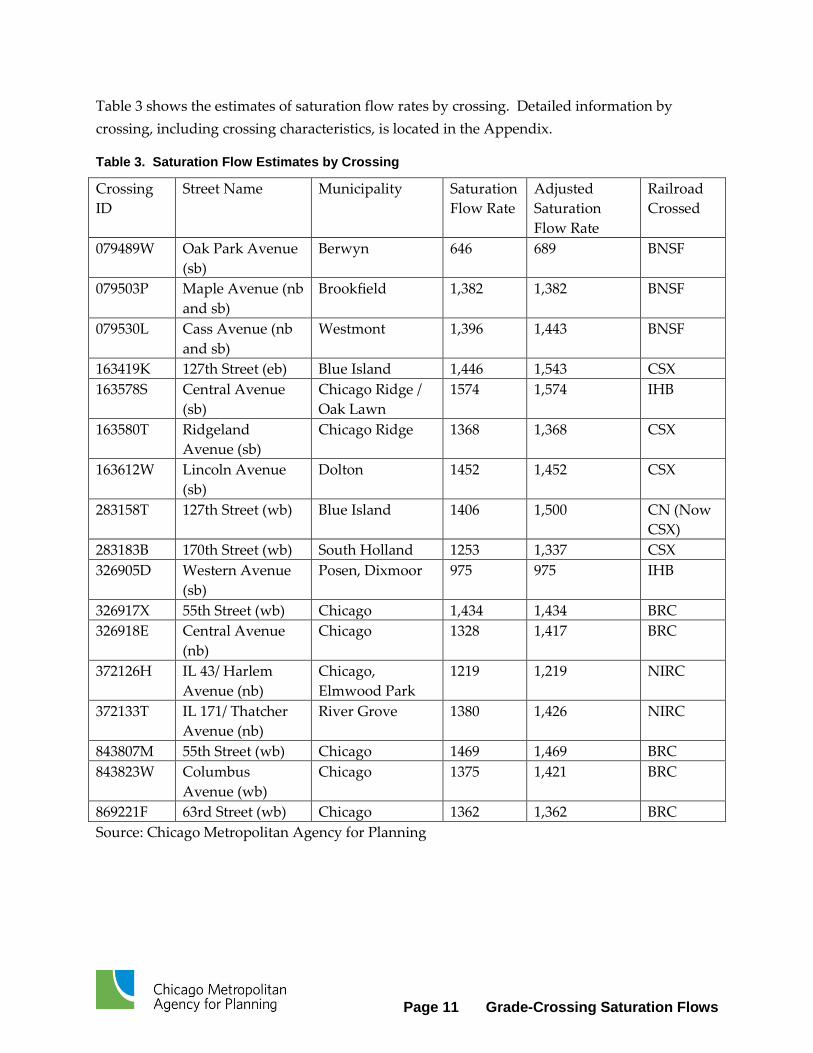
Table 3 shows the estimates of saturation flow rates by crossing. Detailed information by
crossing, including crossing characteristics, is located in the Appendix.
Table 3. Saturation Flow Estimates by Crossing
Crossing
ID
Street Name Municipality Saturation
Flow Rate
Adjusted
Saturation
Flow Rate
Railroad
Crossed
079489W Oak Park Avenue
(sb)
Berwyn 646 689 BNSF
079503P Maple Avenue (nb
and sb)
Brookfield 1,382 1,382 BNSF
079530L Cass Avenue (nb
and sb)
Westmont 1,396 1,443 BNSF
163419K 127th Street (eb) Blue Island 1,446 1,543 CSX
163578S Central Avenue
(sb)
Chicago Ridge /
Oak Lawn
1574 1,574 IHB
163580T Ridgeland
Avenue (sb)
Chicago Ridge 1368 1,368 CSX
163612W Lincoln Avenue
(sb)
Dolton 1452 1,452 CSX
283158T 127th Street (wb) Blue Island 1406 1,500 CN (Now
CSX)
283183B 170th Street (wb) South Holland 1253 1,337 CSX
326905D Western Avenue
(sb)
Posen, Dixmoor 975 975 IHB
326917X 55th Street (wb) Chicago 1,434 1,434 BRC
326918E Central Avenue
(nb)
Chicago 1328 1,417 BRC
372126H IL 43/ Harlem
Avenue (nb)
Chicago,
Elmwood Park
1219 1,219 NIRC
372133T IL 171/ Thatcher
Avenue (nb)
River Grove 1380 1,426 NIRC
843807M 55th Street (wb) Chicago 1469 1,469 BRC
843823W Columbus
Avenue (wb)
Chicago 1375 1,421 BRC
869221F 63rd Street (wb) Chicago 1362 1,362 BRC
Source: Chicago Metropolitan Agency for Planning
Page 12 Grade-Crossing Saturation Flows
Conclusion
The foregoing shows the necessity and results of a study of saturation flow rates at highway-rail
grade crossings in the Chicago region. These flow rates will help understand impaired queue
clearance times at rail crossings with high traffic volumes and a substantial number of daily
trains.
The paper showed that such data collection is possible, though time consuming, so should be
limited to a select few crossings. Table 3 showed that the measurements are clustered together
near the median, but there are a few crossings with very low values. To better understand the
distribution of values, and to assure a more random sample, additional grade crossing
saturation flow data collection is suggested for summer, 2016. It is also suggested that other
data be collected simultaneously, including vehicle delay in the absence of trains (“non-
occurrence delay”). The scope, scale, and process for this data collection will need to be
determined over the course of the next several months.
In the interim, it is suggested that a value of 1,421 passenger vehicles per hour per lane (the
adjusted median saturation flow rate) be used as a default value for highway-rail grade
crossings. This number can support highway-rail delay analyses.
The suggested saturation flow rate of 1,421 pcphpl for highway-rail grade crossings is
substantially below the 1,900 pcphpl default value typical of traffic flow analyses.
Based on the literature review, it is suggested that further improvements to the motorist delay
estimation procedures for highway-rail grade crossings continue. Improvements to consider
include:
An incident-based delay calculation, using the saturation flow rates, arrival rates, and
variations in the length of the gate-down intervals. The use of this improved method is
suggested only for high-volume locations (perhaps using 7,500 minimum AADT and 10
trains per day as a starting point);
Distributions of vehicle traffic and train traffic by time of day;
Non-occurrence delay.
Lastly, estimating the effectiveness of alternative delay mitigation strategies is suggested. Such
strategies might include (1) additional highway lanes across critical grade crossings and (2)
smoother crossings.
Page 13 Grade-Crossing Saturation Flows
Appendix: Detailed Observation Information Crossing
ID
CREATE
Project?
Street Name Municipality Saturation
Flow Rate
Adjusted
Saturation
Flow Rate
Number of
Observations
Lanes Railroad
Crossed
AADT
Crossing
Surface
Smallest
Crossing
Angle
Weather Date of
Observations
079489W N Oak Park
Avenue (sb)
Berwyn 646 689 23 2 @
10’
BNSF 10,050 Rubber 60 to 90
Degrees
Sunny,
Warm
8/1/2013
079503P Y Maple
Avenue (nb
and sb)
Brookfield 1,382 1,382 16 2 @
12’
BNSF 7,800 Rubber 60 to 90
Degrees
Sunny,
Warm
7/25/2013
079530L N Cass
Avenue (nb
and sb)
Westmont 1,396 1,443 27 4 @
11’
BNSF 14400 Rubber 60 to 90
Degrees
Cloudy,
Light
Rain
7/26/2013
163419K N 127th Street
(eb)
Blue Island 1,446 1,543 3 4 @
10’
CSX 25,500 Concrete 60 to 90
Degrees
Sunny 8/15/2015
163578S Y Central
Avenue (sb)
Chicago
Ridge / Oak
Lawn
1574 1,574 8 4 @
12’
IHB 15,100 Asphalt 30 to 59
Degrees
Cloudy,
Warm
8/2/2013
163580T N Ridgeland
Avenue (sb)
Chicago
Ridge
1368 1,368 10 4 @
12’
CSX 19,100 Asphalt 60 to 90
Degrees
Sunny 7/24/2013
163612W N Lincoln
Avenue (sb)
Dolton 1452 1,452 4 2 @
12’
CSX 7,450 Asphalt 0 to 29
Degrees
Cloudy 7/30/2015
283158T N 127th Street
(wb)
Blue Island 1406 1,500 1 4 @
10’
CN
(Now
CSX)
25,500 Rubber 60 to 90
Degrees
Sunny 8/15/2013
283183B N 170th Street
(wb)
South
Holland
1253 1,337 3 4 @
10’
CSX 8,450 Rubber
30 to 59
Degrees
Sunny,
Warm
8/12/2013
326905D Y Western
Avenue (sb)
Posen,
Dixmoor
975 975 5 4 @
12’
IHB 7,700 Rubber 60 to 90
Degrees
Sunny,
Hot
8/15/2013
326917X N 55th Street
(wb)
Chicago 1,434 1,434 6 2 @
12’
BRC 19,700 Asphalt 60 to 90
Degrees
Sunny 8/8/2013
326918E Y Central
Avenue (nb)
Chicago 1328 1,417 4 4 @
10’
BRC 21,900 Asphalt 30 to 59
Degrees
Sunny,
Warm
8/9/2013
Page 14 Grade-Crossing Saturation Flows
Crossing
ID
CREATE
Project?
Street Name Municipality Saturation
Flow Rate
Adjusted
Saturation
Flow Rate
Number of
Observations
Lanes Railroad
Crossed
AADT
Crossing
Surface
Smallest
Crossing
Angle
Weather Date of
Observations
372126H N IL 43/
Harlem
Avenue (nb)
Chicago,
Elmwood
Park
1219 1,219 15 3 @
12’
NIRC 29,300 Rubber
60 to 90
Degrees
Sunny 7/29/2013
372133T N IL 171/
Thatcher
Avenue (nb)
River Grove 1380 1,426 15 4 @
11’
NIRC 26,800 Rubber 60 to 90
Degrees
Sunny 7/23/2013
843807M N 55th Street
(wb)
Chicago 1469 1,469 3 2 @
12’
BRC 21,100 Other 60 to 90
Degrees
Sunny,
Warm
8/16/2013
843823W Y Columbus
Avenue
(wb)
Chicago 1375 1,421 5 4 @
11’
BRC 11,500 Asphalt 0 to 29
Degrees
Cloudy,
Drizzle
8/5/2013
869221F Y 63rd Street
(wb)
Chicago 1362 1,362 5 2 @
12’
BRC 14900 Asphalt 60 to 90
Degrees
Sunny,
Warm
8/7/2013
Source: Chicago Metropolitan Agency for Planning, except lanes, lane widths, and AADTs (Illinois Department of Transportation); and crossing surface, smallest crossing angle
(Illinois Commerce Commission).