groundwater quality monitoring - cwccwc.gov.in/main/hp/download/groundwater quality...
TRANSCRIPT

Government of India & Government of The Netherlands
CSMRS Building, 4th Floor, Olof Palme Marg, Hauz Khas, New Delhi - 110016 (INDIA). Tel: 6861681-84Fax : +91 11 6861685 E-Mail : [email protected]
Groundwater Quality Monitoring
Objectives, Networks and Data Acquisition
March 1998

Groundwater Quality Monitoring March 1998
HYROLOGY PROJECT Technical Assistance i
1. INTRODUCTION 12. MONITORING OBJECTIVES 23. NETWORK LAYOUT AND DESIGN 33.1 Density and Sampling Frequency 33.2 Baseline and Trend (Baseline/Trend Category) 33.3 Water Use (Surveillance Category) 43.4 Management and Research (Survey Category) 44. PARAMETER SELECTION 64.1 Baseline and Trend (Baseline/Trend Category) 64.2 Water Use (Surveillance Category) 74.3 Management and Research (Survey Category) 75. SAMPLE COLLECTION 85.1 Representative samples 85.2 Purging Requirements 85.3 Checking Purging Performance During Field Operation 95.4 Application of Submersible Pumps 96. FIELD MEASUREMENTS 106.1 Measurement of Temperature 106.2 Measurement of pH 106.3 Measurement of Conductivity 106.4 Measurement of Oxidation Reduction Potential (ORP) 107. SAMPLE HANDLING 117.1 Preservation 117.2 Transportation 117.3 Storage 128. EQUIPMENT 138.1 Water Quality Samplers 138.2 Field Kits (for Temperature, pH, ORP, Conductivity and Dissolved Oxygen) 158.3 Sample Containers 158.4 Preparation and Sterilisation Equipment 158.5 Transportation Boxes 168.6 Other Items 169. OBSERVATION PRACTICE 179.1 Taking Samples 179.2 Purging Prior to Sampling 179.3 Labelling and Coding of Samples 189.4 Recording of Field Observations 189.5 On-site Measurements 199.5.1 On-site Measurement of Temperature 199.5.2 On-site Measurement of pH 199.5.3 On-site Measurement of Conductivity 209.5.4 On-site Measurement of ORP 2010. CONCLUDING REMARKS 21APPENDIX A SPECIFICATIONS FOR SUBMERSIBLE PUMPS 28

Groundwater Quality Monitoring March 1998
HYROLOGY PROJECT Technical Assistance 1
1. IntroductionThe Hydrology Project (HP) aims to establish a Hydrological Information System (HIS)at Agency, State and National level for hydro-meteorological, surface water andgroundwater quantity and quality data. The system comprises the infrastructure, humanresources and activities involved in data acquisition, processing, validation, storageand dissemination. The physical infrastructure components of the system includeobservation networks, laboratories and data centres equipped with databases andtools for data entry, processing, and retrieval, whereas the human resources comprisewell-trained staff with a variety of skills who can operate and execute the activitiesinvolved in the system
A major objective of the Hydrology Project is to improve and modernise thegroundwater observation-well networks in all the participating states, throughconstruction of purpose-built piezometers, installation of digital Automatic Water LevelRecorders (DWLR) in key wells, and setting up a modern water quality monitoringprogramme. The expansion of the infrastructure and the functional integration, via theHIS, of both the monitoring networks maintained by the states and those maintained byCentral Ground Water Board (CGWB) is significantly modifying the present situation infour respects, namely:
• increased density of observation points• increased frequency of readings• exploitation of deeper aquifers• additional quality-related parameters to be analysed
As such, the layout, design and operations exercised with regard to monitoring shouldbe reviewed and optimised in the light of monitoring objectives, prevailinghydrogeological regimes, human activities and historical data.
The following document reviews and discusses water quality monitoring issues andfocuses on guidelines for groundwater quality data acquisition procedures in thecontext of monitoring objectives. It addresses network design, parameters, sampling,field measurements and sample handling. To sustain the compatibility of the databasesin the HIS, and promote comparisons and integrated data processing, the overallapproach taken in this document maintains, as far as possible, analogy with thesurface water quality monitoring programme developed simultaneously under HP.

Groundwater Quality Monitoring March 1998
HYROLOGY PROJECT Technical Assistance 2
2. Monitoring ObjectivesThe objectives for quality monitoring of groundwater may be stated as follows:
a) to provide background data against which future changes can be assessedb) to allow early tracing of both slow and rapid quality changes and deterioration
processesc) to check for compliance with standards for designated use (e.g. abstraction for use
in potable water supply)d) to allow analysis of water and solute evolution, including evaluation of primary and
secondary sources and processese) to allow identification of anomalous concentrations of natural and anthropogenic
pollutantsf) to characterise water bodies, including tracing of flow direction and mixing
processes
These objectives may be considered under three categories, as follows:
1. Baseline/Trend - long-term standardised measurements in order to define status ortrends (‘a’ and ‘b’ above)
2. Surveillance - continuous specific measurements for the purpose of water qualitymanagement and operational activities (‘c’ above)
3. Survey - a finite duration, intensive programme to measure for a specific purpose(‘d’, ‘e’ and ‘f’ above)
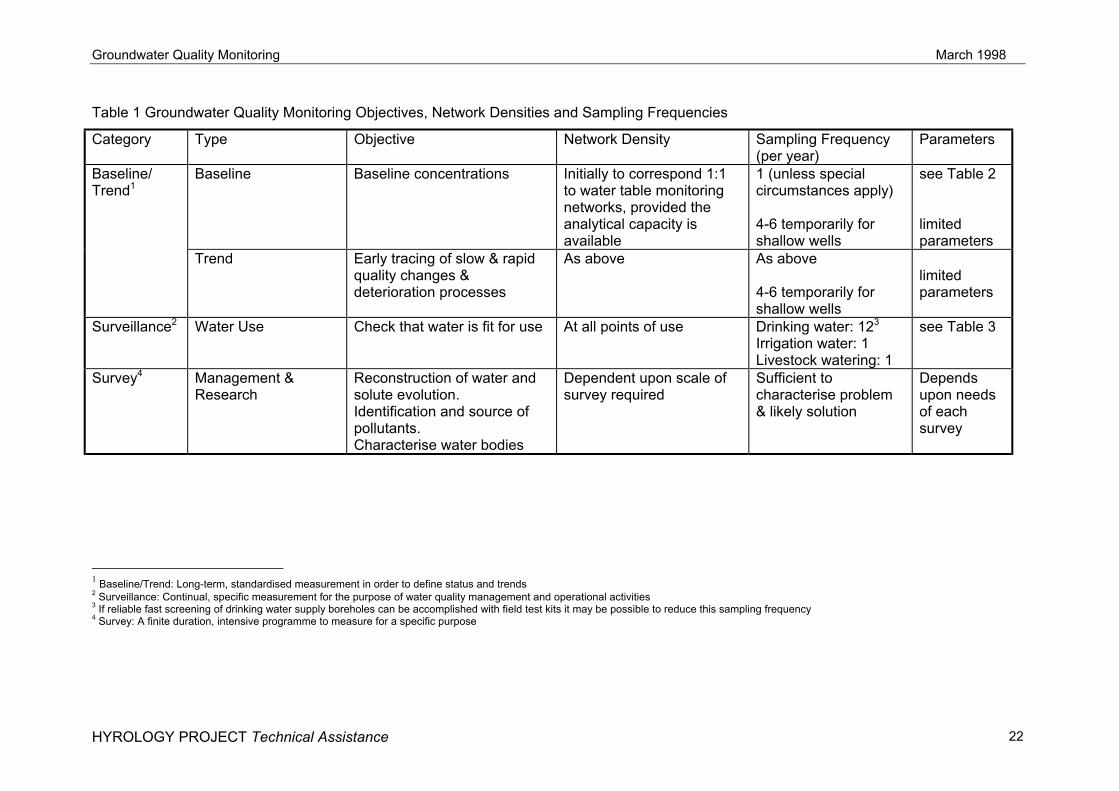
These three sampling categories can be further split into a number of sample types,each of which has a specific objective. These sample types and their associatedobjectives are described in the first three columns of Table 1.

Groundwater Quality Monitoring March 1998
HYROLOGY PROJECT Technical Assistance 3
3. Network Layout and Design
3.1 Density and Sampling Frequency
For each sampling type referred to in Table 1, it is necessary to determine where eachsite will be located and how many sites there will be. This is known as the networkdensity of the overall monitoring programme which approximates the number ofsampling points per unit area. This measure may vary markedly according to objective,known or suspected spatial variability of the quality parameters and specific localconditions. As such, a given value for groundwater network density is only a generalmeasure to assess a network layout; it should never be applied directly for setting upsuch a network even if density figures are derived through sophisticated statisticalanalyses of historical data.
Sampling frequency is the number of samples taken per unit time at each samplingpoint. The sampling frequency is also closely linked with the monitoring objectives, theexpected variability of the measured parameters, the capacity of the laboratories andthe cost of the sampling and analytical effort.
With reference to Table 1, the network density and sampling frequency appropriate toeach sample category is discussed below. It should be noted that at least for the firstthree years, sampling sites for both Surveillance and Survey sampling categories maypartly overlap that of the Baseline/Trend category, though for different parametersand/or varying densities and frequencies.
3.2 Baseline and Trend (Baseline/Trend Category)
In terms of groundwater sampling, the Baseline/Trend category is designed to establishthe groundwater quality conditions which prevail at any given site at the beginning ofthe monitoring programme. Preferably, such baseline conditions should reflect theoriginal undisturbed situation, before significant abstraction started and at early stagesof anthropogenic pollution. However, since widespread development has taken placefor some considerable time, it may only be possible to use historical data to reconstructundisturbed conditions for a limited number of parameters.
As quality parameters are directly related to the groundwater flow regime, qualitybaseline monitoring network layouts should closely correspond to the water levelnetwork. Maintaining this relationship allows for integrated water level and water qualitydata processing which is required for the identification of pollutant sources, flux andchange in storage of any given aquifer. However, because the quality of groundwatersystems is usually quite homogeneous, and changes and fluctuations are slow orlimited, both density and frequency of quality sampling may be lower than required forwater level monitoring. In the event that the available laboratory capacity is notsufficient to allow analysis of all the potential monitoring sampling sites, it will benecessary to further reduce the network density to a feasible level. Discontinuingsampling for one or several of the sites should be done after consideration ofsimilarities in historical water level and quality records in closely spaced observationwells (if available) and on the basis of the local hydrogeological conditions, soilcharacteristics and land use. Methods commonly employed to identify such similaritiesin data derived from neighbouring observation wells include scrutinising of tabulateddata, analysis of water level and quality hydrographs and spatial contour maps, andexecution of regression and correlation matrix tests.

Groundwater Quality Monitoring March 1998
HYROLOGY PROJECT Technical Assistance 4
Sampling for baseline characterisation will continue for an initial period of three years(minimum) after which all of the data collected should be reviewed with the objective ofredesigning the baseline sampling network. At that time, depending upon the analyticalresults obtained from each sampling borehole, it may be possible to discontinue somesampling sites, particularly where adjacent boreholes are seen to have been givingsimilar analytical information. Further, this review of the sampling network will identifyareas where insufficient baseline data have been collected thereby allowingrecommendations to be made regarding the installation of additional samplingboreholes.
Trend monitoring sites are designed to show how groundwater varies over time at aparticular borehole, often as a result of anthropogenic influences. Through regularlsampling of such stations it is possible to detect slow and rapid changes and potentialdeterioration processes. Under the present project, trend analysis needs to beperformed over the entire quality-monitoring network for an initial period of three years,after which it should be similarly reviewed for effectiveness and adequacy. In order torecord possible seasonal variations and relationships with water level fluctuations,selected key wells (purpose-built piezometers equipped with DWLRs) should bemonitored for a limited number of parameters at a higher frequency (4 - 6 times a year).
Samples for the determination of both baseline and trend should, unless specialcircumstances apply, be obtained once per year. It should be mentioned that in order toget a ‘representative sample’ (see Section 5.1) the monitoring network should includeboth observation wells and operational production wells; a mixture with a ratio of about7:3, respectively, is recommended.
3.3 Water Use (Surveillance Category)
This type of sample is obtained to check that water is fit for the use for which it is beingabstracted. Potential uses of groundwater are: drinking water, irrigation water, livestockwatering and various industrial processes not discussed here.
Sampling stations should be sited at all points of use, providing that this is practical anddoes not entail unnecessary duplication. That is, if irrigation water is obtained throughseveral boreholes in the same area from the same aquifer it is probably sufficient tosample only one borehole from this group rather than all of them.
Sampling frequency will depend on the use of the water as follows:
i. drinking water - twelve samples per yearii. irrigation water - one sample per yeariii. livestock watering - one sample per year
With regard to drinking water supply boreholes, it may be possible to reduce thenumber of samples obtained if a reliable field test kit can be used to screen theabstracted water. Such a test kit must be capable of detecting pesticide, nutrient andmicrobiological contaminants and, in certain areas, unacceptable levels of fluoride.
3.4 Management and Research (Survey Category)
These are samples which are taken for special purposes including the following:
• to allow characterisation of water bodies, flow directions, and mixing processes• to allow identification of pollutants, possible inter-relationships, and sources• to allow reconstruction of water and solute evolution

Groundwater Quality Monitoring March 1998
HYROLOGY PROJECT Technical Assistance 5
Samples of this type will normally be taken as part of a survey designed to gatherinformation in order to address a particular problem. As such, each survey must beplanned individually and the number of sampling sites, the parameters to be analysedand the frequency of sampling will depend on the problem, the objectives of the surveyand the information required.

Groundwater Quality Monitoring March 1998
HYROLOGY PROJECT Technical Assistance 6
4. Parameter Selection Suggested parameters for each sample type are given in Table 2 (Baseline/TrendCategory) and Table 3 (Surveillance Category). For convenience, the parameters havebeen split into the following groups: • general - basic parameters, many of which can be measured instrumentally either
in the field or in the laboratory• nutrients - nitrogen and phosphorus parameters which measure plant nutrients and
major fertilisers and collectively reflect the impact of agricultural practices ongroundwater composition
• organic matter - parameters capable of estimating the likely effect on water bodiesof the discharge of organic matter
• major ions - the inorganic anions and cations which describe the chemicalcomposition of the water, determine its classification and help to assess pollution
• other inorganics - miscellaneous inorganic species which are important for certainwater uses or for classification purposes
• trace elements - ion species which are highly toxic even at trace concentrationsand are useful indicators of the presence of other ion species; the specific elementsincluded are known to be present in groundwater in some parts of India
• trace organics - particular species which are important due to their toxicity, effect onpotability of water, or effect on the environment
• microbiology - one indicator species for the presence of faecal pollution of water The choice of parameters for each sampling type is carried out in a similar fashion tonetwork density and sampling frequency selection, that is on the basis of the statedsampling objectives, as discussed below.
4.1 Baseline and Trend (Baseline/Trend Category)
The purpose of baseline samples is to characterise the natural state of groundwaterand to form a datum in time and space to which anomalous concentrations may bereferred. Thus, in addition to a number of general parameters, nutrients, major ions,and other inorganic species need to be determined. Analysis for the parameter group ‘trace elements’ should usually be carried out on anarea specific basis. That is, if contamination by one of the trace elements is known tobe present in a particular area, then the determination of this element should beundertaken. However, if no reliable historical data are available trace elements need tobe included in the initial phase of the monitoring programme. Determination ofparticular parameters in the ‘organic’ parameter group need only be undertaken ifpollution from these species is thought to be present in the area of the borehole beingsampled, or if no relevant data are available. As trend monitoring is carried out to detect changes in groundwater chemistry a fullrange of analysis should be undertaken. However, it is possible to reduce the numberof analytical parameters to be determined by selecting them according to thecontaminants known or suspected to be present in the groundwater in the area of theborehole to be sampled. Thus, from inspection of Table 2 it can be seen that manyparameters are designated as area specific (that is, should be determined if suchcontamination is known to be present in groundwater in the area of the borehole or noreliable data are as yet available), whilst a number are pollution specific (that is, shouldbe determined if this type of pollution is thought to be present in the groundwater bodywhich the borehole is sampling).

Groundwater Quality Monitoring March 1998
HYROLOGY PROJECT Technical Assistance 7
4.2 Water Use (Surveillance Category)
Table 3 gives suggested parameters for three different groundwater uses - drinkingwater, irrigation and livestock watering. Parameter selection has been carried out sothat pollutants particularly important to each use are screened. For example, certaincrops are sensitive to high boron concentrations so this chemical is included insamples of irrigation water. It should be noted that no attempt has been made to sample groundwater which is tobe abstracted for industrial process and cooling water use. This is because the waterquality required for this type of use varies according to the industrial process.Moreover, since those abstracting such water will almost always analyse the waterthemselves, official sampling of such abstractions is not considered necessary.
4.3 Management and Research (Survey Category)
As each particular survey undertaken within this sampling type will have its ownobjectives, no general guidance can be given on the parameters which should bedetermined. It is important to remember that the parameters suggested in Table 2 and Table 3 forbaseline/trend and surveillance represent a minimum suite of parameters for eachsample type. This is to maintain a sensible balance between the desire for moreinformation and analytical costs. It should be noted, however, that some potentiallyimportant parameters have not been included in the lists (e.g., certain heavy metals). Itmay be, therefore, that for selected aquifers some research effort should be directedtowards ascertaining whether or not certain pollutants, which are not routinely coveredby the programme, are present in unacceptable concentrations. Pollutants which couldusefully be subjected to this type of investigation are: • heavy metals such as lead, copper, nickel, and chromium• organic pollutants such as polychlorinated biphenyls (PCBs) and certain types of
pesticide (e.g. DDT)• certain organic solvents If any of the above, or other, parameters are discovered in unacceptableconcentrations in an aquifer this pollutant should be added to the parameter list for thatsampling point for either or both of baseline/trend and surveillance. The frequency ofthe parameter’s analytical determination will then depend on the polluting nature of thesubstance and its concentration in the aquifer.
Groundwater Quality Monitoring March 1998
HYROLOGY PROJECT Technical Assistance 8
5. Sample Collection
5.1 Representative samples
The objective of water quality sample collection is to obtain a small portion of materialthat accurately represents the characteristics of the water body being sampled. This isreferred to as taking a ‘representative sample’ and is vitally important if the analysisthat follows sampling and the conclusions that are ultimately drawn from the data are tohave any validity. Groundwater samples are normally obtained from observation wells and from operatingproduction wells. If the source of groundwater is a well equipped with a pump or aflowing spring, the sample can simply be obtained at the discharge point. Whensampling groundwater in this way, it is important to allow the water to flow for sometime to ensure that water from the aquifer, rather than that which has been standing inthe well, is sampled. This process, known as purging, ensures that standing water,which may differ markedly from aquifer water, does not contaminate the sample. Notethat a sample taken after purging is not the same as taking an agitated sample as isoften believed. An effective way to ensure that the water is ‘fresh’ groundwater is tomonitor the temperature, electric conductivity (EC), pH and oxidation-reductionpotential (ORP) of the emerging water as it is run to waste. Once the readings areconstant for some minutes and the amount of water purged approaches the estimatedvolume of the well, the sample can be taken. In case of sampling in purpose-builtpiezometers not equipped with an installed pump, samples need to be obtained bymeans of a portable lifting device such as a submersible pump (see Sections 8.1). When sampling with a submersible pump, the device is lowered into the well andswitched on. The purging and sampling can then be carried out as if the well wereequipped with a fixed pump, although the rate of discharge may be lower and moretime will be required to ensure proper purging. Special care is required when shallow wells not equipped with a pump are sampledmanually. In this situation the sample can be collected by lowering a specificallydesigned bailer sampler or a sampling can into the well. It is important that the can isnot allowed to touch the sides or bottom of the well as it is likely that this willcontaminate the sample with solid matter. Special precautions are required if it is desired to obtain a groundwater sample fordissolved oxygen analysis. Such samples are best taken by inserting a plastic tube intothe discharge pipe and placing the other end at the bottom of a so-called BOD bottle (a300 ml glass bottle with a ground glass stopper). Water should then flow into the bottleuntil the volume of the bottle has been displaced at least three times. Care should betaken to ensure that no air bubbles are introduced into the sample bottle. Aftersampling, the dissolved oxygen must be chemically ‘fixed’ (see Section 7.1) as soon aspossible and certainly before transportation of the sample.
5.2 Purging Requirements
Purging of the well before sampling is required in order to ensure that aquifer water isdrawn in preference to standing water. Complete removal of stagnant well water ishowever not possible because during purging there will be an accelerated inflow to thewell resulting in mixing of aquifer and well waters. Therefore the purging efficiency isdefined as the volume of aquifer water per unit sample volume. Pump specificationsand operation procedures should be related to the desired purging efficiency.

Groundwater Quality Monitoring March 1998
HYROLOGY PROJECT Technical Assistance 9
Some workers have recommended ‘rule of thumb’ purging guidelines based onremoval of three, five or ten initial well volumes (initial well volume defined as the totalvolume of water standing in the well, which is not under pumping). The number rangesfrom 1 to 20 (Humenick et al, 1980, Unwin and Huis, 1983) and is subject to somedebate. Generally, 3 to 5 well volumes are considered sufficient (Lloyd and Heathcote,1985). Others (Gibb et al., 1981) have recommended calculation of the purgingrequirement from the geometry and hydraulic performance of the wells to be sampled.This approach is followed in Appendix A. The purging efficiency is expressed as afunction of the pump discharge, the time of purging, the diameter of the well, the draw-down and the initial thickness of the water column in the well. A sample calculationunder certain conditions, characteristic for many hard-rock terrain in India, shows thatin order to obtain a purging efficiency of 85% at least 6 initial well-volumes need to bereplaced. The assumed conditions for this specific calculation are listed in Table 5. In case field conditions unfavourably change, e.g. as detailed in the right-hand columnof Table 5, the number of initial well volumes to be replaced increases. It may be notedthat well depth, static water level, pump discharge and pumping time, though essentialin assessing the required pump capacity and horsepower, do not influence the numberof well volumes to be replaced for a selected purging efficiency.
5.3 Checking Purging Performance During Field Operation
As mentioned in Section 5.1, it is recommended to verify the purging efficiency duringpumping by on-line field measurement of parameters like temperature, pH, EC andORP. Purging should continue until reasonable stability indicates that the required highproportion of aquifer water is being drawn. A field kit for these parameters, preferablymounted in a so-called flow-cell (to prevent air contact), should be available with thesubmersible pump.
5.4 Application of Submersible Pumps
The number of well-volumes required to be replaced in order to obtain a selectedpurging efficiency (say 85%) is given by the well and aquifer hydraulics. The timeallowed for purging however is controllable, and should be considered carefully by theagency carrying out the monitoring programme. For example, in order to decrease thepurging time by 33% (from 30 to 20 min) a 65% more powerful pump is required (seeAppendix A and Figure A-3). The logistics of a monitoring programme should be givenserious thought before finalising the pump requirements. In addition, it is advised thatpumps with differing specifications be obtained to cope with the each different fieldcondition that may be encountered. In that case, the pump performance curve, whichshows the decrease in discharge with increasing head, should be used to match thepump specifications with the variation in field conditions.

Groundwater Quality Monitoring March 1998
HYROLOGY PROJECT Technical Assistance 10
6. Field Measurements It is often necessary to measure a number of water quality parameters in the field.Normally, this is because these parameters are likely to change their value before theycan be analysed in a laboratory. In the context of the present programme, there are three physical-chemical parametersthat normally need to be measured in the field. These parameters are temperature, pHand conductivity. A description of the field techniques, which can be adopted for thesedeterminands, is presented in the following paragraphs.
6.1 Measurement of Temperature
Water temperature is usually measured in degrees Celsius, using a thermometer or athermistor. Normally, if temperature is measured electronically using a thermistor thisdevice is built into an instrument which is capable of taking other water qualitymeasurements (e.g., pH) as well.
6.2 Measurement of pH
Measurement of pH is carried out to determine the acid balance of the water on a scaleof 1 (strongly acidic) to 14 (strongly alkaline). Ideally, pH will be measured in the field atthe time of sampling using either indicator paper (which changes colour dependingupon the pH of the water) or a purpose-built meter. As portable pH meters are moreaccurate than indicator papers and relatively inexpensive, this is the recommendedmethod of measuring pH. The operation of such a portable device needs to follow itsspecific manual which usually also includes instructions for field calibration.
6.3 Measurement of Conductivity
Conductivity is a measure of the ability of water to conduct electricity. This, in turn, isdirectly related to the concentration of dissolved ions. Therefore, the conductivity ofwater gives a reasonable indication of the concentration of dissolved solids in thewater. Like pH, conductivity is ideally measured on site at the time of sampling.Measurement is effected with a purpose-built conductivity meter with automatictemperature compensation. NOTE: Rather than use separate meters for temperature, pH, and conductivity it ispreferable to purchase an instrument that will measure all three parameters.
6.4 Measurement of Oxidation Reduction Potential (ORP)
Measurement of ORP (also called Eh) is carried out to characterise the oxidation-reduction state of the water on a scale from approximately -300mV (strongly reducing)up to +500mV (strongly oxidising). Ideally, ORP will be measured in the field at the timeof sampling. Measurement is conducted potentiometrically by a non-reactive electrode(platinum) in combination with a suitable reference electrode. Although the measurement of ORP is straightforward, interference with other factorslimit its interpretation, and the Eh values measured in the field usually correlate poorlywith Eh values calculated from the redox couples present (such as O2/OH-, Fe++/Fe+++,SO4/S
--). Therefore, the main application of this parameter is in recording significantchanges in the redox potential like those expected when purging a stagnant watercolumn in a piezometer and replacing it with “fresh” groundwater. Measurement ofORP should be conducted within the flowing discharge pipe of the submersible pump inorder to avoid contact with air.

Groundwater Quality Monitoring March 1998
HYROLOGY PROJECT Technical Assistance 11
7. Sample Handling The preservation, transportation and storage of samples is another vital link in thesampling chain, as failure to carry out these operations with sufficient care can changethe characteristics of the sample and give false analytical results. Some guidelines onhow these procedures should be undertaken are given below.
7.1 Preservation
As a general rule, water quality samples should be stored at a temperature below 4oCand in the dark, as soon after sampling as possible. In the field this usually meansplacing them in an insulated cool box together with ice or cold packs. Once in thelaboratory, samples should be transferred as soon as possible to refrigerators or a coldroom. Not all water quality samples necessarily need to be stored in this way, but itdoes no harm and it is simpler to treat all samples in the same fashion. To preservestorage space, the size of the sample should be optimal for analytical requirements andcare should be given to avoid unnecessarily large samples. When sampling for dissolved oxygen analysis, it is important that the sample ischemically fixed as soon as possible because the dissolved oxygen concentration inthe sample bottle can change rapidly from its original value. Chemical fixing ofdissolved oxygen is carried out by adding 1 ml of manganese sulphate solution, 1 ml ofalkaline iodide-azide solution, and 1 ml of concentrated sulphuric acid to a 300 mlwater sample. The analytical determination may then be carried out up to 8 hours laterwith no loss of accuracy. If samples collected for chemical oxygen demand (COD) analysis cannot bedetermined on the day of collection, they should be preserved below pH = 2 by additionof concentrated sulphuric acid. This procedure should also be followed for samples forammoniacal nitrogen, total oxidised nitrogen, and phenol analysis. Samples which are to be analysed for the presence of trace metals should be acidifiedto below pH = 2 with concentrated nitric acid (see Table 6). If the water is high insuspended matter, filtration of the water is required before acidification, to avoiddissolution of solids. Such acidified samples can then be kept up to six months beforethey need to be analysed except for mercury determinations which should be carriedout within five weeks.
7.2 Transportation
Normally, a motor vehicle with a reasonable weight carrying capacity, such as a lightvan or car, should be used for the transportation of water quality samples. This isbecause a one day sampling run encompassing a number of sampling points impliesthat many bottles of water are collected. This is particularly the case where a range ofparameters are to be determined, each of which requires a different type of samplebottle. To minimise staff and transport costs, and to ensure samples are analysed as soon aspossible (preferably within a day), it is best to plan a sampling run such that it can becompleted in one day. Ideally, this will entail visiting a number of sampling points in alogical order and ending the day’s journey at the laboratory where the samples can beanalysed or at least refrigerated until the following day. If samples cannot be analyseduntil the following day, such sampling runs should not be carried out the day before alaboratory staff holiday.

Groundwater Quality Monitoring March 1998
HYROLOGY PROJECT Technical Assistance 12
7.3 Storage
As discussed above, many samples need to be stored in the dark and below 4oC sothat the determinand values do not change. For this reason it is good practice to storeall water samples in the refrigerator until they can be analysed. When a sample has to be analysed for a number of different parameters, it is importantthat the determinands, which are likely to degrade within a short time, are analysedfirst. Thus, when a batch of samples is received by the laboratory the analyticalcapabilities and priorities need to be carefully planned to reflect the existingcapabilities. One important factor, which can help to minimise the storage time for samples, issensible long-term planning of the sampling programme. For example, the programmeshould be planned such that the laboratory does not receive at one time any moresamples than it can readily analyse or store under proper conditions. It is better,therefore, to plan for the laboratory to receive samples in small batches rather than allat one time in order to ensure that the analytical results are as accurate as possible. Another factor which needs to be considered in planning the sampling programme isthe necessity of avoiding taking too many samples just before weekends andlaboratory staff holiday periods as this will unnecessarily increase storage times. Table 4 gives ‘recommended’ and ‘required’ maximum storage times for each proposedwater quality parameter.
Groundwater Quality Monitoring March 1998
HYROLOGY PROJECT Technical Assistance 13
8. Equipment
8.1 Water Quality Samplers
The objective of water quality sample collection is to obtain a small portion of waterfrom the well that accurately represents the water in the aquifer being sampled. This isreferred to as taking a ‘representative sample’ and is vitally important if the analysisthat follows sampling and the conclusions, which are ultimately drawn from the data,are to have any validity. A suitable sampling device meets the following requirements: • allows removal of stagnant water from the well (called purging) so that the sampled
water represents the water in the aquifer• avoids degassing of the sample and volatilisation of components in it• prevents oxidation caused by contact with the atmosphere• avoids contamination of the sample and the well
Three conventional and one sophisticated technique (recommended under HP) arereviewed briefly with respect to their capability of providing representative samples.The aspect of costs is not discussed here.
Conventional Techniques (not recommended under HP):
i. Bailers or depth samplers are so called grab samplers that operate by lowering thedevice to a known depth in the water column, closing it and raising it to the groundsurface. Major limitation is the high atmospheric contact during sampling.Furthermore bailers are difficult to clean (dead-volumes) and the risk ofcontamination from one well to another (cross-contamination) is high. In addition,contamination of the well water during sampling can be foreseen when a large bailerscrapes the casing of small diameter wells. Purging of the well before sampling bythe use of bailers is very time consuming.
ii. Suction devices lift the water sample by applying suction directly to the water or via
a collection bottle. Suction can either be generated manually or by a pump (e.g.peristaltic or centrifugal type) but the sampling depth is limited to 8 or 10m. Themajor limitation is degassing and aeration that cannot be controlled. As with bailers,effective purging is very time consuming using suction devices.
iii. Gas driven devices apply positive gas (air) pressure directly on the water which
drives it from the borehole - back flow being prevented by check valves. Usuallycompressed air is pumped down the borehole through a delivery tube. The air thenforces water up a second tube (acting as an airlift pump) and the air water mixtureemerges at the head of the well. The intense contact between high-pressure air andthe sample causes oxidation and disturbance in the dissolved gas balance of thesample water, namely, degassing and volatilisation, which in turn can causeprecipitation of contaminants. This will mean that the sampled water is no longerrepresentative of the groundwater from which it was taken.

Groundwater Quality Monitoring March 1998
HYROLOGY PROJECT Technical Assistance 14
Sophisticated Technique (recommended under HP):
iv. Submersible pumps are lowered into the borehole and water is driven outcontinuously at the surface. The following three principles are used drive out thewater: gears or rotor assembly (electric centrifugal pump), gas operated plunger(piston pump) or by a gas operated diaphragm (bladder pump). Submersible pumpsof these three types are rated acceptable for sampling groundwater for allparameters, including volatile organic carbon, trace metals and dissolved gassesand is therefore recommended as the lifting device for the current water qualityprogramme under HP.
If a submersible pump is used to obtain water samples from boreholes it should ideallyhave the following characteristics:
• Variable pumping rate: the capacity assessment has been calculated in AppendixA. And a variable pumping rate is also necessary, which allows high speed for rapidpurging and slower speeds for sampling.
• Size: the outer diameter of the pump should be considerably less than the smallestinner diameter of the boreholes or piezometers in the monitoring programme. A gapof at least 3 cm is needed to guarantee that the pump does not touch the sides ofthe wells during lowering and lifting. The smaller the pump compared to the innerdiameter of the well, the easier the lowering and lifting will be. If the well isequipped with an automatic water level recorder (AWLR), it is recommended that theAWLR is removed before insertion of the submersible pump to avoid physicaldamage to the equipment, tubes or cables.
• Material: the material of the pump, tubing and fittings (all parts that make contactwith the well water) should be inert and resistant to corrosion. The most commonmaterial used is stainless steel.
• Power supply: a portable generator set together with an adjustable frequencyconverter (to regulate the pumping speed) is required.
• Portability: the weight and size of the complete set should be such that it is easilytransported through off-road terrain (is the site accessible by car; if not how manypeople are available and how far must the equipment be carried?). A battery startwill decrease the portability of the set. Technically speaking, there are no objectionsagainst manual starting; even if the site is accessible by car a lighter set is easier tohandle and will increase the ease and speed of transportation and positioning.
• Noise: the noise level of the sets should be acceptable and for this purpose anexhaust silencer with muffler is advised (provided the weight is not excessivebecause in that case it is better to install the generator somewhat further away fromthe well).
• Cleaning: the pump and tubes must be easy to clean (no ‘dead-volumes’) in orderto avoid cross-contamination of wells.
• Maintenance and repair: the pump must be easy to repair in the field and all toolsand spare parts must be included with the portable set.
• Accessories: a water level indicator and a flow cell in which field parameters liketemperature, pH, conductivity and dissolved oxygen electrodes can be mounted areworth considering.
For manual sampling of hand-dug-wells all that is required is a weighted sampling canwith a rope attached to its handle. The can is then carefully lowered down the well untilit fills with water and then recovered. Although virtually any style of sampling can isacceptable for this application there are a number of features that are preferable asfollows:

Groundwater Quality Monitoring March 1998
HYROLOGY PROJECT Technical Assistance 15
• small volume and diameter - it is preferable that the sampling can has a relativelysmall volume and diameter. This makes it easier to haul the can up the well when itis full of water and helps to ensure that the can does not touch the sides of the well
• plastic - this makes the sampling can lighter, easier to clean and less likely tochemically react with the parameters to be determined in the water sample. For thesame reasons the rope attached to the bucket should also be made of a syntheticfibre
• lipped - the provision of a lip to the sampling can makes pouring the water into asample bottle much easier
8.2 Field Kits (for Temperature, pH, ORP, Conductivity andDissolved Oxygen)
In addition to sampling, field operatives also need to be able to take measurementsand chemically ‘fix’ certain samples so that their parameter values do not change priorto laboratory analysis. The measurements that need to be taken in the field are those of temperature, pH andconductivity. These can most usefully be determined in the field by means of a smallportable instrument capable of measuring all these parameters. As meters of this typerequire at least daily calibration and regular maintenance, a supply of distilled water,pH buffers, standard solutions, batteries, and basic spare parts should also be carriedwith the meter. As discussed above, any samples obtained for dissolved oxygen analysis must bechemically ‘fixed’ as soon as they are obtained, by adding three different reagents (seeSection 7.1). Therefore, it is necessary to equip every field operative with three‘pipetted’ glass or plastic stoppered 500 millilitre bottles containing these solutions. Asthese solutions can be corrosive, the three bottles should be carried in an appropriatelysized bottle carrier to ensure they do not tip over and spill their contents. Samples for metals analysis should be acidified with concentrated nitric acid as soonas they are obtained, and in case of high concentrations of suspended matter, filtrationof the sample is required prior to acidification. Therefore, the sampler also needs tocarry a bottle of concentrated nitric acid in a bottle carrier and a field filtration device.
8.3 Sample Containers
In order to cover the range of parameters which need to be sampled and analysed, avariety of sample containers are required as discussed below: • BOD bottles (300 ml) with ground glass stoppers for dissolved oxygen samples• millilitre glass (or Teflon) bottles with Teflon lined caps for pesticides and phenols• millilitre polyethylene bottles for metals (except mercury)• millilitre glass bottles for mercury and phosphorus• millilitre polyethylene bottles for all other chemical parameters• strong thick-walled glass bottles of at least 300 millilitre capacity for microbiological
analysis. These should be fitted with screw caps capable of maintaining a goodseal even after multiple sterilisations in an autoclave
8.4 Preparation and Sterilisation Equipment
Bottles that are to be used for collecting microbiological samples must be thoroughlywashed before use. This can be done by hand but, if there are many bottles to wash, it

Groundwater Quality Monitoring March 1998
HYROLOGY PROJECT Technical Assistance 16
is often best undertaken by machine. At the sampling site bottles should be rinsed withthe water to be sampled. Bottles to be used for the collection of microbiological samples must be sterilised priorto use. This can be carried out by placing them in an autoclave at 121°C for fifteenminutes or, if the caps of the bottles do not contain plastic or rubber materials, in anoven at 170°C for at least two hours. Therefore, any laboratory that needs to preparebottles for microbiological samples requires either an autoclave capable of sterilising atleast twenty bottles at one time or an equivalent size sterilising oven.
8.5 Transportation Boxes
After sampling, many water quality parameters undergo chemical or biochemicalreactions in the sample bottle, causing the concentration to change from their originalvalues. To prevent this alteration of parameter values, samples should be kept at atemperature below 4°C until they are analysed. In the field, the best way to ensure thatsamples are kept cold is to pack them into insulated cool boxes containing either anice/water mixture or a large number of ice packs. Therefore, a number of cool boxessufficient to contain a full day’s sampling run should be available to each field operativewho is required to take water quality samples.
8.6 Other Items
In addition to that specified above, a field operator will need certain other items ofequipment for taking water quality samples as specified below: • list of, and relevant information on, sampling sites including historical data on EC,
temperature and pH• keys to the premises of the well sites and protection covers, tools, and PVC tubing• maps marked with relevant sampling points and travelling routes• a sampling programme split into daily tasks• bottles with distilled water• standard glass and plastic-ware required for sampling and related measuring and
treatment procedures• a supply of labels, pencils, and marker pens• report forms and a field notebook• first aid kit
Groundwater Quality Monitoring March 1998
HYROLOGY PROJECT Technical Assistance 17
9. Observation Practice
9.1 Taking Samples
If a sampling can or a bailer is used to take manual samples from hand-dug wells, thesampling device should be rinsed out several times with the water to be sampledbefore any bottles are filled; each sample bottle should be similarly rinsed out beforefilling. In order to prevent samples degrading and giving false analytical results, it isnecessary to chemically pre-treat some samples as soon as they are obtained. Also,many parameters require particular sample containers for the same reason. Table 6gives the type of container that should be used and the pre-treatment method requiredfor each proposed water quality parameter. For all samples, except those for dissolved oxygen analysis, it is good practice to leavea small air space at the top of the sample bottle to allow for mixing prior to analysis. Forsamples intended for dissolved oxygen analysis, care should be taken to excludeexcess air from the sample. Therefore, sample bottles should be filled to the brim; thesample should be poured carefully to avoid agitation, and the bottle should be gentlytapped once full to dislodge any air bubbles clinging to its inside surface. When taking samples for microbiological analysis it is important to preventcontamination of the inside of the bottle or cap by touching with fingers or any non-sterile tools. Samples for this type of analysis should be obtained before other sampletypes.
9.2 Purging Prior to Sampling
To be worked out in detail. Check italics also The minimum purging requirement for each well to be sampled need to be workedbefore starting the field sampling programme, in accordance with the approach detailedin appendix A. In the field the observer should have the following information before he goes to thewell:• Minimum number of initial well volumes to be replaced (default value 6 but well-
specific adjustments based on calculations (as in Appendix A) using static field datafor the specific well is recommended)
• Depth and diameter of the well (static well data)• Available pump rate (limited by the maximum permissible purging rate of 100 lpm)
At the site the field observer should obtain:• The actual static water level (SWL)

Groundwater Quality Monitoring March 1998
HYROLOGY PROJECT Technical Assistance 18
From this information he must calculate the minimum required purging time accordingto:
Q
MPV(H.MPT
SWL ×−××=
)52 φπ
MPT = minimum required time of purging, minutesMPV = minimum number of purging volumes, -H = initial thickness of water column, mSWL = depth to static water level, mφ = internal diameter of well, cmQ = pump discharge (limited to 100), lpm
The monitoring of the various field parameters (T, pH, ORP and EC) should start at thesame time as purging. Do not stop purging before all these parameters have stablereadings for a minimum of 5 minutes and the purging time exceeds the minimumrequired purging time. The initial and final values for T, pH, ORP and EC should berecorded along with all other data related to the sampling operation. If the well is equipped with an AWLR it should carefully be removed conform instructionsprovided with the instrument. Before starting purging, the technical condition of the well needs to be checked and itssuitability for the insertion of a submersible pump needs to be verified. This is usuallyperformed by inserting a metal body similar in shape to the submersible pump, into thewell. Once smooth insertion of the metal body to the required depth and its subsequentremoval is performed, the submersible pump can be safely inserted and the purgingoperation may start.
9.3 Labelling and Coding of Samples
Immediately after sampling, the sample bottles should be labelled and given a uniquecode number. Information on the label should include: • sample code number• date and time of sampling• sample point description and code number (if applicable)• depth of the sample and well diameter• analysis to be carried out• pre-treatment carried out on the sample• any special notes for the analyst• sampler’s name After labelling the samples should be placed in a purpose-built bottle carrier fortransportation.
9.4 Recording of Field Observations
All water quality sampling personnel should carry with them a field notebook in whichobservations and records can be kept. At the time of sampling this notebook should befilled in with the following information: • all the information on the sample label (see above)

Groundwater Quality Monitoring March 1998
HYROLOGY PROJECT Technical Assistance 19
• details of which samples were collected• the on-site measurements made and the results obtained• the weather conditions, including the shade air temperature, at the time of sampling• any details about the condition of the sample which may be relevant (e.g., if it has
an odour)
The above information will be of considerable value when interpreting the subsequentanalytical results
9.5 On-site Measurements
Water quality sampling personnel are also required to measure some water qualityparameters in the field. First, because it is more convenient to do so and secondbecause a number of these parameters can change their value before they can bereturned to the laboratory for analysis. These parameters, which provide immediateinformation on the specific site, should be compared with historical data as a validationmeasure. Significant departure from previous data requires repeated measurementsand, if confirmed, the samples from this point should be given for detailed laboratoryanalyses.
9.5.1 On-site Measurement of Temperature
Temperature can be measured in the field with a glass thermometer or a thermistorattached to a suitable meter. If a pH or conductivity meter (or a combined meter) isbeing used for water quality, a temperature measurement can normally be obtaineddirectly from this device.
Water temperature must be determined in the sample immediately after it is collectedfrom the borehole. Temperature should be measured in Celsius to the nearest 0.1oCafter the reading has become stable.
9.5.2 On-site Measurement of pH
The most accurate method of measuring water pH in the field is by means of aportable, purpose-designed meter. Such meters are normally capable of measuring pHto the nearest 0.05 of a pH unit by using a ‘glass’ and a ‘reference’ electrode (althoughthese are often combined in a single probe).
Before measuring pH, it is necessary to calibrate the meter. This should be done atleast once per day, before the first pH measurement is attempted. The procedure for apH meter with automatic temperature correction (as most now have) is as follows:
i. After removing their protective caps, the electrodes are rinsed in distilled water andcarefully blotted dry with soft absorbent paper. NOTE: Care needs to be exercisedhere as the electrodes can be very fragile.
ii. The electrodes are then placed in a fresh buffer solution and, after allowing time formeter stabilisation, the pH reading of the meter is adjusted to the pH of the buffersolution (normally pH = 7)
iii. The electrodes are then rinsed again with distilled water and blotted dryiv. If a pH measurement is not to be taken immediately, the electrodes should be
replaced in their protective caps. Normally, the glass electrode cap is filled withdistilled water before replacement to prevent the electrode drying out.
Once calibrated, the pH meter can be used to directly measure water pH by placing theelectrodes in the water sample immediately after it is obtained. Care should be taken toensure that the electrodes are rinsed with distilled water before and after each

Groundwater Quality Monitoring March 1998
HYROLOGY PROJECT Technical Assistance 20
determination, and that distilled water is placed into the glass electrode cap fortransportation.
9.5.3 On-site Measurement of Conductivity
Conductivity can be measured in the field with a purpose-designed meter inmilliSiemens per centimetre (1 mS/cm = 1000 µmhos/cm). Before measuringconductivity it is necessary to calibrate the meter. This should be carried out at leastonce per day, before the first measurement is taken. Calibration is achieved bydetermining the conductivity of a known, fresh solution of potassium chloride andadjusting the meter accordingly. In order to ensure the conductivity reading is accurate,it is necessary to adjust the conductivity reading to compensate for temperaturechanges. In most modern meters this is done automatically, however.
Once calibrated, the conductivity of the water can be measured by immersing theelectrode in a sample of water as soon as it is taken. It is important to remember thatconductivity meters often take some minutes to stabilise. The reading must, therefore,be taken after this stabilisation has occurred.
9.5.4 On-site Measurement of ORP
ORP can be measured in the field with a purpose-designed platinum (Pt) electrode andmeter in mV. Before measuring the ORP it is necessary to calibrate the meter. Thisshould be carried out at least once per day, before the first measurement is taken.Calibration is achieved by determining the ORP of a solution with known ORP (Zobell’ssolution). For correct interpretation, simultaneous recording of the temperature of thewater sample is necessary.
Once calibrated, the ORP of the water can be measured by immersing the electrode ina sample of water as soon as it is taken. Contact with air should be prevented as muchas possible. It is important to remember that an ORP electrode often takes someminutes to stabilise, the reading must therefore be taken after this stabilisation hasoccurred.

Groundwater Quality Monitoring March 1998
HYROLOGY PROJECT Technical Assistance 21
10. Concluding RemarksCommonly, groundwater quality networks and programmes evolve over time frombaseline data collection to trend and surveillance data collection. Such evolutionreflects a change in monitoring objectives, and implies on the one hand, a reduction inthe density of the observation sites, and on the other hand, increasing the variety ofparameters monitored. The frequency of sampling and the list of parameters coveredroutinely is gradually modified into an area-specific monitoring programme, reflectingthe background configuration established through baseline monitoring and theoutcomes of survey monitoring programmes.
Special attention needs to be given to regions prone to rapid quality deterioration whichinclude:
• shallow groundwater associated with irrigation (command) areas• highly developed and over-exploited aquifers where the groundwater table has been
lowering over the years• coastal multi-aquifer systems where the fresh/seawater interface balance has been
disturbed• industrialised and intensively urbanised regions• polluted surface water sources which recharge shallow groundwater aquifers
The change in the quality monitoring setting is actually an on-going process that oftenreflects the impact of human activities on the environment. To keep pace with thisdynamic process, the agencies who are in charge of groundwater monitoring needfeedback from land-use planning and development agencies in order that monitoringobjectives can be continually assessed and monitoring plans and activities can bemodified accordingly.
Groundwater Quality Monitoring March 1998
HYROLOGY PROJECT Technical Assistance 22
Table 1 Groundwater Quality Monitoring Objectives, Network Densities and Sampling Frequencies
Category Type Objective Network Density Sampling Frequency(per year)
Parameters
Baseline/Trend1
Baseline Baseline concentrations Initially to correspond 1:1to water table monitoringnetworks, provided theanalytical capacity isavailable
1 (unless specialcircumstances apply)
4-6 temporarily forshallow wells
see Table 2
limitedparameters
Trend Early tracing of slow & rapidquality changes &deterioration processes
As above As above
4-6 temporarily forshallow wells
limitedparameters
Surveillance2 Water Use Check that water is fit for use At all points of use Drinking water: 123
Irrigation water: 1Livestock watering: 1
see Table 3
Survey4 Management &Research
Reconstruction of water andsolute evolution.Identification and source ofpollutants.Characterise water bodies
Dependent upon scale ofsurvey required
Sufficient tocharacterise problem& likely solution
Dependsupon needsof eachsurvey
1 Baseline/Trend: Long-term, standardised measurement in order to define status and trends
2 Surveillance: Continual, specific measurement for the purpose of water quality management and operational activities3 If reliable fast screening of drinking water supply boreholes can be accomplished with field test kits it may be possible to reduce this sampling frequency4 Survey: A finite duration, intensive programme to measure for a specific purpose

Groundwater Quality Monitoring March 1998
HYROLOGY PROJECT Technical Assistance 23
Table 2 Groundwater Quality Parameters (Baseline/Trend)
Parameter Group Parameter Baseline TrendGeneral Temperature X X
Suspended Solids X XConductivity X XpH X XTotal Dissolved Solids
Nutrients Ammonia NitrogenTotal Oxidised Nitrogen X XTotal Phosphorus X X
Organic Matter Chemical Oxygen Demand ABiochemical OxygenDemand
X
Major Ions Sodium X APotassium X ACalcium X AMagnesium X ACarbonates andBicarbonates
X A
Chloride X XSulphate X A
Other Inorganics Silica X AFluoride X AIron X ABoron X A
Trace Elements Cadmium A AArsenic A AMercury A AZinc A A
Organics Pesticide Indicator P PSynthetic Detergents P POrganic Solvents P PPhenols P P
Microbiology Total coliforms A AX = Analysis of parameter required.A =Area specific - analysis of parameter is required unless previous analyses indicatethat concentrations are stable and far below any limiting thresholds.P = Pollution suspected - analysis of parameter only required if this type of pollution isknown or suspected.

Groundwater Quality Monitoring March 1998
HYROLOGY PROJECT Technical Assistance 24
Table 3 Groundwater Quality Parameters (Surveillance)
ParameterGroup
Parameter WaterUse1
D I LGeneral Temperature X X
Suspended Solids XConductivity X X XpH X X XTotal Dissolved Solids X
Nutrients Ammonia Nitrogen XTotal Oxidised Nitrogen XTotal Phosphorus
Organic Matter Chemical Oxygen DemandBiochemical OxygenDemand
X
Major Ions Sodium XPotassiumCalcium XMagnesium XCarbonates andBicarbonatesChloride X XSulphate
Other Inorganics SilicaFluoride XIronBoron X
Trace Elements CadmiumArsenicMercuryZinc
Trace Organics Pesticide Indicator XSynthetic DetergentsOrganic Solvents XPhenols X
Microbiology Total coliforms X X2 X2
1 D = Water Abstracted for Treatment as Drinking Water, I = Water for Irrigation, L = Water forLivestock Watering2 It is recognised that practically, even though high concentrations of coliforms may exist in irrigation andlivestock watering waters, it may not be possible to discontinue the use of a particular water source

Groundwater Quality Monitoring March 1998
HYROLOGY PROJECT Technical Assistance 25
Table 4 Water Quality Parameters Maximum Storage Times
Parameter Group Parameter Recommended1 Required2
General Temperature Immediate ImmediateSuspended Solids 7 days 7 daysConductivity 28 days 28 dayspH Immediate ImmediateTotal Dissolved Solids 7 days 7 days
Nutrients Ammonia Nitrogen3 7 days 28 daysTotal Oxidised Nitrogen3 --- 28 daysTotal Phosphorus --- ---
Organic Matter Chemical Oxygen Demand3 7 days 28 daysBiochemical Oxygen 6 hours 48 hours
Major Ions Sodium3 6 months 6 monthsPotassium3 6 months 6 monthsCalcium3 6 months 6 monthsMagnesium3 6 months 6 monthsCarbonates and
424 hours 14 days
Chloride 28 days 28 daysSulphate 28 days 28 days
Other Inorganics Silica 28 days 28 daysFluoride 28 days 28 daysIron3 6 months 6 monthsBoron 28 days 6 months
Trace Elements Cadmium3 6 months 6 monthsArsenic3 6 months 6 monthsMercury3 28 days 28 daysZinc3 6 months 6 months
Trace Organics Pesticide Indicator) 7 days 7 daysSynthetic Detergents --- ---Organic Solvents --- ---Phenols3 --- 28 days
Microbiological Total coliforms 8 hours5 24 hours5
1Time limits taken from those recommended in: ‘Standard Methods for the Examination of Water and Wastewater’,19th Edition 1995, Eds: Eaton A D, Clesceri L S and Greenberg A E; Published by: APHA, AWWA and WEF2 “Required” means that unless the parameter is determined within this time period the results will have littlevalidity. Times correspond to limits imposed by the US Environmental Protection Agency (EPA) for ‘regulatory’samples.3 After recommended pre-treatment4 Time limit stated is equivalent to that given for ‘alkalinity’ analysis5 Storage times taken from recommended and maximum times stated in: ‘Standard Methods for the Examination ofWater and Wastewater’, 19th Edition 1995, Eds: Eaton A D, Clesceri L S and Greenberg A E; Published by: APHA,AWWA and WE

Groundwater Quality Monitoring March 1998
HYROLOGY PROJECT Technical Assistance 26
Table 5 Parameter values giving 85% purging efficiency when 6 well volumes arereplaced
Parameter Value More well-volumes required if Well Diameter 10 cm diameter larger then 10 cm Transmissivity 20 m2/d transmissivity lower then 2 m2/d Specific Yield 2 % specific yield lower then 2 %

Groundwater Quality Monitoring March 1998
HYROLOGY PROJECT Technical Assistance 27
Table 6 Water Quality Parameters - Sampling Containers and Pre-treatments Required
ParameterGroup
Parameter Sample Container Sample Pre-treatment
General Temperature None - on-site analysis None - on-site analysisSuspended Solids 1 NoneConductivity None - on-site analysis None - on-site analysispH None - on-site analysis None - on-site analysisTotal Dissolved Solids 1 None
Nutrients Ammoniacal Nitrogen 2 6Total Oxidised Nitrogen 2 6Total Phosphorus 3 None
Organic Matter Chemical Oxygen Demand 2 6Biochemical Oxygen Demand 1 None
Major Ions Sodium 2 7Potassium 2 7Calcium 2 7Magnesium 2 7Carbonates and Bicarbonates 1 NoneChloride 1 NoneSulphate 1 None
Other Inorganics Silica 1 NoneFluoride 1 NoneIron 2 7Boron 1 None
Metals Cadmium 2 7Arsenic 2 7Mercury 3 7Zinc 2 7
Organics Pesticide (Indicator) 4 NoneSynthetic Detergents 1 NoneOrganic Solvents 1 NonePhenols 4 6
Microbiology Total coliforms 5 None
Notes:
1. 1000 millilitre polyethylene bottle2. 500 millilitre polyethylene bottle3. 100 millilitre glass bottle4. 1000 millilitre glass (or Teflon) bottle with Teflon lined caps5. Strong thick-walled, screw-capped glass bottle (300 millilitre capacity)6. Samples should be acidified with 2 ml of concentrated sulphuric acid7. Samples should be acidified with 2 ml of concentrated nitric acid.
(Information adapted from ‘Water Quality Monitoring’, Edited by Bartram J & BallanceR, E & F N Spon, London, 1996)

Groundwater Quality Monitoring March 1998
HYROLOGY PROJECT Technical Assistance 28
A Specifications for Submersible PumpsThe specifications for capacity and discharge of submersible pumps depend largely onthe situation in the field (depth of the water table, hydraulic characteristics of theaquifer, diameter of the well, initial thickness of the water column, time available for thesampling procedure etc.). The effect of varying field conditions on the required pumpcapacity are calculated and presented in Table A-1. In these calculations the followingassumptions are made:
• pump heat loss is 20% (η, efficiency = 80%)
• specific yield is 2%
• Darcy-Weisbach coefficient is 0.04 (for both casing and delivery tube)
• transition losses add up to 1 m
• height of delivery point above ground is 2m
• diameter of the delivery tube is 3.81cm (1.5 inch)
• depth of pump below the dynamic water level is 2m
The set-up of the well under purging is presented in Figure A-1. In the calculations it isassumed that mixing of well water and aquifer water is complete and instantaneous.The fraction aquifer water in the water pumped from the well is expressed in EquationA-1. The formula is composed of the quotient of the volume of water purged from theaquifer (Q x t minus draw down volume) and the total volume of water involved (Q x tplus the initial well volume). Rewritten in Equation A-2 its shows that the ratio of thevolumes of pumped and initial water almost equals the ratio of the fractions of aquiferand non-aquifer water. The additional term (s/H/(1-C) represents the effect of therelative drawdown (s/H). The formula to calculate draw down is expressed in EquationA-3.
QtrH
srQtC
2
2
+−
=π
π
Equation A-1
C1
s/H
C1
C
rH
tQ2 −
+−
=π
Equation A-2
Sr
t T 2.25log
4
2.3Qs
210=
Equation A-3
where:C = purging efficiency expressed as fraction of aquifer water, (-)Q = pump discharget = time of purgings = drawdownH = initial thickness of water columnr = internal radius of wellT = aquifer transmissivityS = specific yield

Groundwater Quality Monitoring March 1998
HYROLOGY PROJECT Technical Assistance 29
These equations are dimensionally homogenous and as such any consistent system ofunits may be used.
The required capacity of the pump is calculated as given Equation A-4, it computes theproduct of discharge, Q and total height to overcome (consisting of actual height (hd +d + s), virtual height caused by friction in tubes, hvt and casing, hfc and the energycontents of the out-flowing water, v2/2g).
75
)2g
vhhhds(hQ1000
Capacity Pump
2t
tfcftd ++++++=
with:
hfc = 4gr
v )d-s-(H f 2pc
; 2r
0.33Qv =
hft = t
2tdpt
4gr
v )hds(d f +++ ;
2t
tr
Qv =
Equation A-4where:
HP = horsepower of the pumphd = height of delivery tube above ground leveld = depth to static water levels = draw-downhft = friction loss in tubinghfc = friction loss in casinght = height loss in transitions (bends etc.)vt = stream velocity in delivery tubeg = gravity (9.81 m/s2)η = pump efficiencyfc = Darcy-Weisbach coefficient of well casing, (-)dp = depth of pump below dynamic water levelr = internal radius of wellft = Darcy-Weisbach coefficient of delivery tube, (-)rt = radius of delivery tubev = stream velocity in well
These equations are applicable in metric system only, Pump Capacity in horsepower
A.1 Pump discharge
Figure A-2 shows the effect of pumping time on purging efficiency for different pumpdischarges. As expected, purging efficiency increases with pumping time and pumpdischarge applied. This figure can be used to select the appropriate pump discharge fora required purging time.
A.2 Pump capacity (HP)
The required pump capacity (in terms of power consumption) is a function of thedynamic lift head of the water in the well, the discharge rate needed to obtain the

Groundwater Quality Monitoring March 1998
HYROLOGY PROJECT Technical Assistance 30
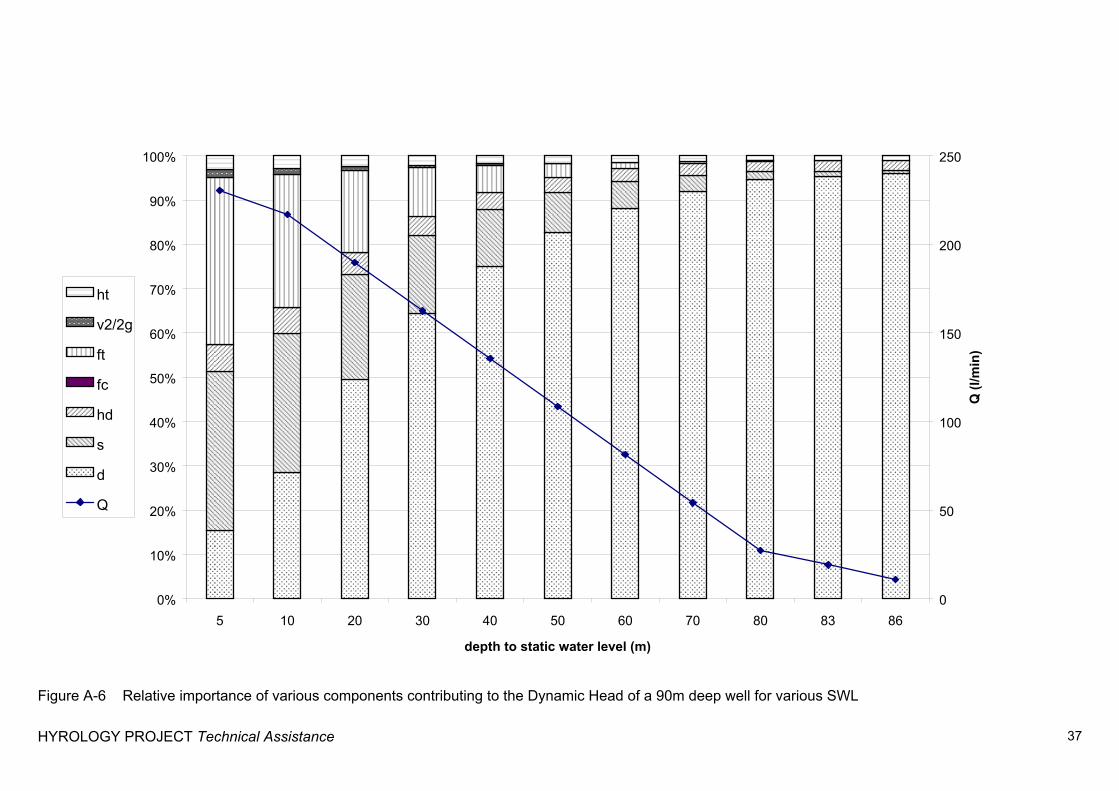
desired purging efficiency within the time available and the heat loss of the pump.Table A-1 presents the conditions used in the calculations. The dynamic head is afunction of the depth to the static water, the draw-down caused by pumping and a fewother factors, like friction in tubing, as listed in Equation A-4. Figure A-6 shows the buildup of the dynamic head for various depth’ to static water level. As shown, all factorsexcept friction loss in casing and the energy content of the out-flowing water havepractical importance at small depths to SWL. For greater depth to SWL only the depth toSWL itself is contributing significantly to the dynamic head (all other factors becomerelatively unimportant also caused by the decline in Q).
Figure A-3 shows the pump capacity as a function of static water level depth. Thecurve shows a maximum pump capacity at moderate depths to SWL. At lower depths toSWL the pump capacity requirement is relatively low because of limited lift head. Athigher depths to SWL the pump capacity requirement is also relatively low because of alow discharge needed to purge the small initial well volume. This figure also shows theeffect of purging time. In order to decrease the purging time by 33% (say from 30 to 20minutes) a 65% more powerful pump is needed (1.8 instead of 1.1 HP). Thisdisproportionate increase is caused by the additional draw-down resulting in increasedlift head and this effect will be larger in aquifers with lower transmissivity.
Figure A-4 shows that the transmissivity of the aquifer determines to a large extent therequired discharge and capacity; lower transmissivities require higher capacity (HP)pumps!
Figure A-5 shows that a larger well diameter requires a larger capacity pump. Therequired capacity increases by almost a factor of three when the well diameterincreases from 2.5 to 4 or from 4 to 6 inches. The most commonly applied diameter ofpurpose build piezometers under Hydrology Project is 4 inch (is this correct?). In manycountries in Europe and the US a diameter of 2 to 2.5 inch is common for this type ofmonitoring piezometers. From a monitoring point of view sec one can state that thesmaller the diameter the better, for practical reasons (drilling, availability of materialand experienced contractors etc.) a larger diameter may be preferred.

HYROLOGY PROJECT Technical Assistance 31
Pump dischage
������������������������������������������������������������������������������������������������� ������������������������������������������������������������������������������������������������ �����������������������������������������������������������������������������������������������
draw-down (s)
static water level (SWL)
dynamic water level (DWL)
well
initial thickness of water column (H)
φ(2r)
depth to SWL (d)
depth pump below DWL (dp)
delivery height (hd)
pump
Figure A-1 Schematic Presentation of Well Under Purging (pumping) Operation

HYROLOGY PROJECT Technical Assistance 32
Table A-1 Pump Capacity in a 90 m-deep, 4-inch diameter Well with Varying Depths to Static Water Level
Initial water column (H) (m) 85 80 70 60 50 40 30 20 10 5 3Depth to static water level (d) (m) 5 10 20 30 40 50 60 70 80 85 87Transmissivity (T) (m2/d) 20 20 20 20 20 20 20 20 20 20 20Specific yield (S) (-) 0.02 0.02 0.02 0.02 0.02 0.02 0.02 0.02 0.02 0.02 0.02Well Diameter (ϕ) (inch) 4 4 4 4 4 4 4 4 4 4 4Depth of pump below dynamic water level (dp) (m) 2 2 2 2 2 2 2 2 2 2 2Height of delivery above ground level (hd) (m) 2 2 2 2 2 2 2 2 2 2 2Head loss in transitions and bends (ht) (m) 1 1 1 1 1 1 1 1 1 1 1Tube Diameter (inch) 1.5 1.5 1.5 1.5 1.5 1.5 1.5 1.5 1.5 1.5 1.5Darcy-Weisbach coef. for casing (fc) (-) 0.04 0.04 0.04 0.04 0.04 0.04 0.04 0.04 0.04 0.04 0.04Darcy-Weisbach coef. for delivery tube (ft) (-) 0.04 0.04 0.04 0.04 0.04 0.04 0.04 0.04 0.04 0.04 0.04
Pumping Time (t) (min) 30 30 30 30 30 30 30 30 30 30 30Pump Discharge (Q) (lpm) 143.7 136.1 119.0 102.0 85.0 67.9 50.9 34.0 17.0 8.5 5.1
O p g ( ) ( p )Initial Well Volume (l) 689 648 567 486 405 324 243 162 81 41 24No. of Initial Volumes Purged (-) 6.3 6.3 6.3 6.3 6.3 6.3 6.3 6.3 6.3 6.3 6.3Draw-down (s) (m) 8.1 7.6 6.7 5.7 4.8 3.8 2.9 1.9 1.0 0.5 0.3Dynamic Head (m) 20.1 24.2 32.2 40.5 48.9 57.5 66.2 75.1 84.0 88.5 90.3
Purging efficiency (C) (-) 0.85 0.85 0.85 0.85 0.85 0.85 0.85 0.85 0.85 0.85 0.85
Velocity in casing (v) (m/s) 0.098 0.093 0.082 0.070 0.058 0.047 0.035 0.023 0.012 0.006 0.003Velocity in delivery tube (Vt) (m/s) 2.101 1.991 1.741 1.491 1.243 0.993 0.745 0.497 0.248 0.124 0.074Friction head in casing (hfc) (m) 0.01 0.01 0.01 0.01 0.00 0.00 0.00 0.00 0.00 0.00 0.00Friction head in delivery tube (hft) (m) 3.80 3.32 2.38 1.63 1.06 0.62 0.32 0.13 0.03 0.01 0.00Height of delivery above ground level (hd) (m) 2.00 2.00 2.00 2.00 2.00 2.00 2.00 2.00 2.00 2.00 2.00Head loss in transitions and bends (ht) (m) 1.00 1.00 1.00 1.00 1.00 1.00 1.00 1.00 1.00 1.00 1.00Pump Capacity (efficiency 80% assumed) (HP) 0.80 0.91 1.07 1.15 1.15 1.08 0.94 0.71 0.40 0.21 0.13Pump Capacity (efficiency 80% assumed) (W) 599 682 795 855 861 809 699 528 295 155 95
Co
nd
itio
ns
Ca
lcu
lati
on
s
After 30 minutes of pumping, 85% of the water pumped originates from the aquifer and 15% from stagnant well water.
Fie
ldE
quip
ment
Chois
�� ���������������� ��� ���� ���� ��� ���� ���� ��� ���� ��� ���� ����
�� ���������������� ��� ���� ���� ��� ���� ���� ��� ���� ��� ���� ����
���������������� ��� ���� ���� ��� ���� ���� ��� ���� ��� ���� ����
���
���
���

HYROLOGY PROJECT Technical Assistance 33
0.0
0.2
0.4
0.6
0.8
1.0
0 10 20 30 40 50 60 70 80 90 100
Pumping Time, t (min)
Pu
rgin
g E
ffic
ien
cy, C
(-)
Q=100 lpm Q=50 lpm Q=25 lpm
Figure A-2 Purging efficiency as a function of pumping time for different pump discharges.
Conditions: depth to SWL=40m, Well Depth=90m, T=20m2/d, S=2%, Pump Efficiency =0.8, φ=4'', fc=ft=0.04)

HYROLOGY PROJECT Technical Assistance 34
0.0
0.5
1.0
1.5
2.0
2.5
0 10 20 30 40 50 60 70 80 90 100Depth to Static Water Level, d (m)
Pu
mp
Cap
acit
y (H
P)
30 minutesPumping
20 minutesPumping
Figure A-3 Pump capacity required to obtain a 85% % purging efficiency as a function of depth to the static water level and purging time.
Conditions: Well Depth=90m,T=20m2/day, S=2%, Pump Efficiency=0.80, φ=4'', fc=ft=0.04

HYROLOGY PROJECT Technical Assistance 35
0.0
0.5
1.0
1.5
2.0
2.5
0 20 40 60 80 100 120Transmissivity, T (m2/d))
Pu
mp
Cap
acit
y (H
P)
0
20
40
60
80
100
120
140
Dis
char
ge,
Q (
lpm
)
Capacity
Pump Discharge
Figure A-4 Pump capacity and discharge required obtaining 85% purging efficiency after 30 minutes as a function of aquifer transmissivity.
Conditions: depth to SWL=40m, Well Depth=90m, φ=4'', Pump Efficency=0.80, S=2%, fc=ft=0.04

HYROLOGY PROJECT Technical Assistance 36
0.0
0.5
1.0
1.5
2.0
2.5
3.0
3.5
4.0
0 1 2 3 4 5 6 7 8Well Diameter, φ inch)
Pu
mp
Cap
acit
y (H
P)
0
25
50
75
100
125
150
175
200
Dis
char
ge,
Q (
lpm
)
Pump Capacity
Discharge
Figure A-5 Pump capacity and discharge required obtaining 85% purging efficiency after 30 minutes as a function of well diameter.
Conditions: depth to SWL=40m, Well Depth=90m,T=20m2/d, S=2%, Pump Efficiency = 0.80, fc=ft=0.04
HYROLOGY PROJECT Technical Assistance 37
������������������������������������������������������������������������������������
���������������������������������������������������� �����������������������������������������������������������������������������������������������������
���������������������������������������������������������������������������������������������������������������������������������������������������������������������������������������������������������������������������������������������������������������������
���������������������������������������������������������������������������������������������������������������������������������������������������������������������������������������������������������������������������������������������������������������������������������������������������������������������������������������������������
����������������������������������������������������������������������������������������������������������������������������������������������������������������������������������������������������������������������������������������������������������������������
������������������������������������������������������������������������������������������������������������������������������������������������������������������������������������������������������������������������������������������������������������������������������������������������������������������������������������������������������������������������������������������������������������������������������������������������
������������������������������������������������������������������������������������������������������������������������������������������������������������������������������������������������������������������������������������������������������������������������������������������������������������������������������������������������������������������������������������������������������������������������������������������������������������������������������
����������������������������������������������������������������������������������������������������������������������������������������������������������������� �������������������������������������������������������������������������������������������������������������������������������������������������������������������������������������������������������������������������������������������������������������������������������������������������������������������������������
���������������������������������������������������������������������������������������������������������������������������������������������������������������������������������������������������������������������������������������������������������������������������������������������������������������������������������������������������������������������������������������������������������������������������������������������������������������������������������������������������������������
����������������������������������������������������������������������������������������������������������������������������������������������������������������������������������������������������������������������������������������������������������������������������������������������������������������������������������������������
������������������������������������������������������������������������������������������������������������������������������������������������������������������������������������������������������������������������������������������������������������������������������������������������������������������������������������������������������������������������������������������������������������������������������������������������������������������������������������������������������������������������
���������������������������������������������������������������������������������������������������������������������������������������������������������������������������������������������
�������������������������������������������������������� �������������������������������������������������������������������������������������������������������������
������������������������������������������������������������������������������������������������������������������������������
���������������������������������������������������������������������������������������������
������������������������������������������������
���������������������������������������������������
���������������������������������
��������� ���������������
������������ ���� ������
������������������������������������
������������ ���������������������
������������������������������
���������������������������
��������������
���������������������
������������������
���������������
���������������
����������
���������������������������������������������������������������������������������
������������������������������������������������������������������������������������������������������������������������������������
������������������������������������������������������ ���������������������������������������������������������������������������������������������������������
���������������������������������������������������������������������������������������������������
������������������������������������������������������������
������������������������
������������������
������������
������ ��� ����
������������
������������
������ ������ �� ������ ��� ������������������������
������������������
������������������
���������������
����������
������������ ������������ ������������ ������������ ������ ���������
0%
10%
20%
30%
40%
50%
60%
70%
80%
90%
100%
5 10 20 30 40 50 60 70 80 83 86
depth to static water level (m)
0
50
100
150
200
250
Q (
l/min
)
��������������� ht
������������ v2/2g
������������ ft
fc
��������������� hd
������������ s
������������ d
Q
Figure A-6 Relative importance of various components contributing to the Dynamic Head of a 90m deep well for various SWL