assessment of groundwater quality using water quality
TRANSCRIPT

Journal of Indian Association for Environmental Management Vol. 40, No. 3 (2020), 24-38 25
Assessment of Groundwater Quality using Water Quality
Index (WQI) in Kulpahar watershed, District Mahoba, Uttar
Pradesh, India
A Ram1*, S K Tiwari
2, H K Pandey
3, M. N.Khan
4
1 Research Scholar, Department of Geology, CAS, Institute of Science, Banaras Hindu University, Varanasi-221005, India 2 Associate professor, UGC-HRDC, Coordinator: National Resource Centre for Earth Science, Banaras Hindu University, Varanasi-221005, India 3 Associate professor, Department of Civil Engineering, MNNIT, Allahabad-211004, UP, India 4 Superintending Hydrogeologist, CGWB, SOU, Allahabad -211004, UP
* Corresponding Author E-mail: [email protected], [email protected]
Submitted: August 05, 2020 Revised: August 20, 2020 Accepted: August 21, 2020
Abstract: The continuous stress on groundwater due to its overexploitation and rampant use which is indispensable to
the quality of life on the earth. The study area is occupied by Precambrian basement comprised of Bundelkhand massif
unconformably overlain by Quaternary sediments consisting of alluvium, clay, silt, sand and gravel. The present study
deals with the various geochemical characteristic of groundwater and henceforth assess the water quality index (WQI)
which is an important criterion for the determination of drinking water quality of the area. The WQI is significant
unique digital rating expression to decipher the overall quality of groundwater viz. excellent, good, poor, etc. that is
helpful for selecting appropriate and economically feasible treatment process to cope up with the concerned quality
issues. It is one of the most relevant and effective tool for educating the people residing in the area concerned and policy-
makers about water quality.
An attempt has been made to understand the suitability of groundwater for human consumption in hard rock terrain
of Bundelkhand region particularly in Kulpahar watershed, district Mahoba, Uttar Pradesh using WQI. The WQI has
been calculated considering twenty parameters of twenty-two groundwater samples of different locations of the study
area. These parameters pH, EC, TDS, alkalinity, total hardness, Ca2+
, Mg2+
, Na+, K
+, HCOᶾ
⁻, SO₄2⁻, Cl⁻, F⁻, NO₃⁻, Ag, Cu,
Fe, Mn, Ni, Zn. The WQI in the study area ranges from 4.75 to 115.93. The extreme southern part of the Kulpahar
watershed, district Mahoba of Bundelkhand region is dominant with poor groundwater quality. The higher value of
WQI indicative of poor quality has been observed which is mainly due to the higher values of EC, fluoride, nitrate,
manganese, and nickel in the groundwater. The study suggests that groundwater quality in Panwari Block mainly
belongs to excellent and good categories. A remarkable portion in the southern part of Jaitpur block is affected by poor
to unsuitable category and needs sincere effort for a detailed zonation at micro-level to understand properly and provide
accurate information to the residents as well as policy makers.
Keywords: Groundwater, Watershed, WQI, GIS, Bundelkhand massif.
I. INTRODUCTION
here has been tremendous increase in the demand of
groundwater due to geometric growth of population, rapid
pace of industrialization and urbanization in India (Yisa and
Jimoh, 2010). The availability and quality of groundwater is
badly affected due to its overexploitation and unmonitored
waste disposal. The anthropogenic activities are mainly
responsible for infusing industrial, domestic and agricultural
waste gradually into groundwater reservoirs at a galloping rate
(Panda and Sinha, 1991). As a result, human health is being
endangered by the exiting agricultural practices particularly
T
Journal of Indian Association for Environmental Management
Journal homepage: www.http://op.niscair.res.in/index/php/JIAEM/index
e-ISSN No.: 2582-4228

Journal of Indian Association for Environmental Management Vol. 40, No. 3 (2020), 24-38 26
with respect to excessive use of chemicals and fertilizers.
Disposal of industrial effluent and sewage into groundwater
cause groundwater pollution and unsanitary conditions
(Panigrahi et al., 2012). The quality of groundwater is
deciphered using various physical, chemical and biological
characteristics of water (Diersing and Nancy, 2009). It is a
measure of health and hygiene of groundwater with respect to
the need and purpose of human beings (Johnson et al., 1997).
The amount of water that percolates into the ground varies
widely from place to place due to different type of lithology
and geomorphology. The groundwater quality varies with
depth of water table, periodic monsoonal changes, leached
dissolved salts and sub-surface environment (Gebrehiwot et
al., 2011). It is essential to monitor the quality of groundwater
regularly and to device ways and means to prevent it from
further contamination as it becomes very difficult to ensure its
proper quality and restoration once it is contaminated. In this
study, the physicochemical properties of representative
groundwater samples collected from wells and hand pumps of
different locations from the study area have been determined
and compared with recommended guidelines of World Health
Organization (WHO, 2017) and BIS (2012, 2015)
specification for drinking, domestic and other uses based on
Water Quality Index (WQI).
Horton (1965), for the first time developed the concept of
WQI based on weighted arithmetical calculation. In the past
fifty years or so, several researchers (Brown et al., 1972;
GEMS UNEP, 2007; Kavitha and Elangovan, 2010; Alobaidy
et al., 2010) have developed different types of WQI models on
the basis of weightage and rating of different water quality
parameters derived by weighted arithmetic method. The WQI
is a dimensionless number with values ranging between 0 and
100. It is a unique digital expression which reflects the overall
water quality at a specified space with time on the basis of
various water quality parameters. It has become an important
tool to compare the quality of groundwater in a particular
region. Such indices are very important and effective means to
communicate the information related to groundwater quality
and their management (Jagadeeswari and Ramesh, 2012). In
fact, it is a water quality categorization viz: excellent, good,
poor, very poor and unsuitable; and express overall water
quality at a certain location and time reflecting the composite
influence of different water quality parameters. It depicts and
discusses the unified impact of various water quality
parameters and communicates water quality information to the
residence in the concerned area and legislative policy makers
to design strong policy and implement the water quality
programs (Kalavathy et al., 2011) by the government. In order
to keep the health of an aquifer system at an optimal level,
certain water quality indicators or parameters needs to be
regularly monitored and controlled. Therefore, the objective of
the study is to calculate the WQI of groundwater in the study
area in order to assess its suitability for human consumption,
agricultural practices and other land use practices.
II. STUDY AREA
The study area Jaitpur and Panwari blocks of Kulpahar
tehsil, district Mahoba, Uttar Pradesh extends between
longitudes 79⁰10′E and 79⁰40′E to latitudes 24⁰50′N and
25⁰30′N having an area of 1240 km² (Fig. 1). The typical
subtropical climate punctuated by long and intense summer,
with distinct seasons characterizes the study area. The average
annual precipitation of 864 mm is catered by the south-west
monsoon. January is usually the coolest month with an
average temperature 8.3⁰C while May is the warmest with
temperature shooting upto 47.5⁰C. The rivers Virma, Arjun
and Chandrawal mainly drain the area under investigation.
The study area is consisting mainly of hard rock formation
of Bundelkhand massif. The Jaitpur block is characterized by
rugged topography with a very thin soil cover as overburden
while Panwari Block is covered by a thick overburden
consisting of clay, silt and fine grained sand. The prominent
rock formations viz. granite, granitic-gneiss are having
secondary porosity due to its highly fractured and jointed
nature. These may be responsible for the occurrence of
groundwater mostly in the upper weathered zone and under
secondary porosity in deeper fractured zone. The rainfall
generally does not percolate subsurface since the rocks are of
massive and compact in nature. However, secondary porosity
in the form of cracks, fractures, joints and fissures allow some
surface water to percolate underneath.
Geological Set-up:
The study area is mainly characterized by granite,
particularly leucogranite, older and younger alluvium
consisting of clay, silt, sand and gravel. The most dominant
lithology is leucogranite which covers mainly central and
eastern part while recent alluvium occurs in northern part of
the study area (Fig. 2). There are few patches of pink granite
which appears enclosed in leucogranite or adjacent to its
outcrop.
Stratigraphically, the quaternary sediments of recent to sub-
recent age comprising alluvium, sand, gravel, silt and clay lies
unconformably over the Precambrian rocks comprising
Bundelkhand massif, granite, gneiss, schist, dolerite and
quartz reef
III. MATERIALS & METHOD
The groundwater samples were collected from twenty-two
different locations in the study area following the standard
procedures of American Public Health Association (APHA,
2017). The sterilized bottles (1 litre capacity each) under
aseptic condition were used for collecting the samples to avoid
unpredictable contamination leading to any changes in the
characteristics of groundwater samples. The sample locations
have been marked using global positioning system (GPS) as
indicated in the Figure 1. In the present study, twenty
groundwater quality parameters of twenty-two samples have
been analysed in the laboratory except unstable parameters
viz. pH, EC and TDS were determined in situ by portable
device (pH-meter, EC-meter and TDS-meter). The studied
parameters are alkalinity, total hardness (TH), calcium(Ca2+),
magnesium (Mg2+), sodium (Na+), potassium (K+),
bicarbonate (HCOᶾ⁻), sulfate (SO₄2⁻), chloride (Cl⁻), fluoride
(F⁻), nitrate (NO₃⁻), silver (Ag), copper (Cu), iron (Fe),
manganese (Mn), nickel (Ni) and zinc (Zn). The accuracy of

Journal of Indian Association for Environmental Management Vol. 40, No. 3 (2020), 24-38 27
the chemical analysis has been validated by charge balance
errors and samples with < 5 % error. The correlation matrix
and statistical analysis of the analyzed groundwater quality
parameters have been laid down as shown in Table 2 and
Table 3 respectively.
Figure 1: Map of the Study area
Figure 2: Geological Map of Study area
Water Quality Index (WQI): The WQI has been determined
with the help of drinking water quality standards as
recommended by the World Health Organization (WHO,
2017). It has been calculated by using weighted arithmetic
water quality index as has been originally proposed by Horton
(1965) and modified by Brown et al., (1972). The weighted
arithmetic WQI is represented in the following way:
WQI = (1)
where,
n = number of variables or parameters,
Wi = unit weight for the ith
parameter,
Qi = quality rating (sub index) of the ith
water quality
parameter.
The unit weight (Wi) of the various water quality parameters
are inversely proportional to the recommended standards for
the corresponding parameters.
Wi = K/Sn (2)
where,
Wi = unit weight for the ith
parameter,
Sn = standard value for ith
parameters,
K = proportional constant,
The value of K has been considered ‘1’ here and is calculated
using the following equation:
K=1/Σ (1/ Sn) (3)
According to Brown et al., (1972), the value of quality rating
or sub-index (Qi) is calculated using the following equation:
Qi = 100[(Vo – Vi) / (Sn– Vi)] (4)
where,
Vo = observed value of ith
parameter at a given sampling site,
Vi = ideal value of ith
parameter in pure water,
Sn = standard permissible value of ith
parameter.
All the ideal values (Vi) have been taken as zero for potable
water except pH and dissolved oxygen (Tripathy and Sahu,
2005). The ideal value of pH is 7.0 for natural or pure water
while the permissible value is 8.5. Similarly, the ideal value of
dissolved oxygen is 14.6 mg/l while the standard permissible
value for potable water is 5 mg/l. Hence, the quality rating for
pH and Dissolved Oxygen are calculated respectively from the
following equations:
QpH= 100 [(VpH – 7.0) / (8.5 – 7.0)] (5)
Qdo= 100 [(Vdo 14.6) / (5.0 – 14.6)] (6)
where,
VpH = observed value of pH
Vdo = observed value of dissolved oxygen
Qi = 0 indicates complete absence of contaminants, while 0 <
Qi < 100 indicates that the contaminants are within the
prescribed standard. Further, Qi >100 indicates that the
contaminants are above the prescribed standards.

Journal of Indian Association for Environmental Management Vol. 40, No. 3 (2020), 24-38 28
In this study, the water quality index (WQI) proposed by
Brown et al. (1972) and Chatterji and Raziuddin (2002) have
been considered for the classification of water quality as given
in Table 1.
TABLE 1
Classification of water quality and status based on weighted
arithmetic WQI Method
WQI Rating Class
0-25 Excellent
26-50 Good
51-75 Poor
76-100 Very Poor
> 100 Unsuitable
Source: Brown et al. (1972), Chatterji and Raziuddin (2002)
IV. RESULT AND DISCUSSION
(i) Statistical analysis, Correlation Matrix and Relative
Weightage: The correlation matrix, statistical analysis and
relative weightage of groundwater quality parameters are
tabulated in Table 2, 3 and 4 respectively. The correlation
matrix of twenty groundwater quality parameters including six
heavy metals has been created and analysed (Table 2). Out of
these, eight parameters viz. EC, Alkalinity, TH, Ca2+
, Mg2+
,
Na+ and Cu are significantly correlated to each other reflecting
more than 0.50 correlation values. Further, EC vs TDS,
Alkalinity vs Na+ and HCO₃⁻, TH as CaCO3 vs Mg
2+ and
SO₄²ˉ, Ca2+
vs Ni, and Cu vs Fe indicates most relevant
correlation having a significant impetus on the overall
assessment of quality of groundwater than any other major
radicals and physical parameters. However, the majority of
quality parameters are positively correlated with each other. A
critical analysis of the correlation matrix for the heavy metals,
indicates that Ag is positively correlated with AK, TH, Ca2+,
Mg2+, K+, SO₄²⁻, Cl⁻ and NO₃⁻. Similarly, Cu is positively
correlated with EC, TDS, AK, Na+, K+, F⁻ and NO₃⁻. While,
Fe is positively correlated with TDS, Mg2+, Na+, K+, HCO₃⁻,
SO₄²⁻, NO₃⁻, Ag and Cu. Further, Mn is positively correlated
with pH, EC, TDS, NO₃⁻ and Ag. Similarly, Ni is positively
correlated with pH, EC, TDS, Ca2+, K+, NO₃⁻ and Cu.
The higher concentration of Ni, Fe and Cu may trigger the
presence of other heavy metals viz. Pb, Cd and Cr which are
very sensitive and significant heavy metal and needs to be
observed carefully in future for groundwater quality in the
study area. The presence of Fe, SO₄²⁻ and NO₃⁻ may trigger
the presence of Cd (Chaurasia et al., 2018).
(ii) Groundwater Quality Parameters and Spatial
Distribution Pattern: In the present study, the spatial
distribution pattern of the contour for different groundwater
quality parameters have been generated using the Arc GIS
10.4 software as represented in Fig. 3A, 3B, 3C, 3D, 3E, 3F,
3G, 3H, 3I, 3J, 3K, 3L, 3M, 3N, 3O, 3P, 3Q, 3R, 3S and 3T.
The Bureau of Indian Standard (BIS, 2012, 2015) and World
Health Organization (WHO, 2017) of drinking water standards
have been considered as a reference in this study.
Hydrogen ion concentration (pH): It is an important
indicator for assessing the quality and pollution of any aquifer
system as it is closely related to other chemical constituents of
water. The ideal range of pH for human consumption needs to
be in the range of 6.5–8.5. In the study area the pH varies
between 6.81 (minimum) to 8.32 (maximum) which suggest
that it is well within the acceptable limit (6.5 - 8.5) with an
average of 7.95 suggesting the alkaline nature of groundwater.
The spatial distribution pattern of the pH indicates that mainly
the eastern part and some patches in western part of the study
area is affected by the presence of alkaline groundwater (Fig.
3A).
Electrical conductivity (EC): It is a measure of ability of a
substance or solution to conduct electrical current through the
water due to the presence of dissolved salts in it and is directly
proportional to the dissolved salts. The desirable limit of EC
for drinking purpose is 750 µS/cm. In the study area the EC
varies between 286 and 1162 µS/cm. In the vicinity of dense
urban areas presence of high EC suggests that open
sewer/drain carrying domestic waste is triggering the
contamination of groundwater .EC is mainly higher (> 750
mg/l) in the eastern part (Fig. 3B).
Total Dissolved Solids (TDS): It is defined by the presence of
calcium, magnesium, sodium, potassium, carbonate,
bicarbonate, chloride and sulfate. The potable water contains
less than 500 mg/l TDS as per BIS recommendation. In the
study area it ranges between 285 to 879 mg/l. The existing
agricultural patterns, anthropogenic wastes and leaching of top
soil causing contamination may be the primary sources for
enhancing the TDS (Boyd, 2000).
The eastern portion of the study area is having high TDS (>
500 mg/l) in groundwater (Fig. 3C). The sympathetic
relationship between TDS and EC as evinced from the
correlation matrix of the quality parameters (Table 2).
Alkalinity (AK): The presence of carbonate, bicarbonate and
hydroxide ions in water defines its alkalinity. Its desirable
limit in drinking water is 200 mg/l, above which the taste of
water become unpleasant. In this study, the alkalinity ranges
between 50 to 452 mg/l which is within the permissible limit
(600 mg/l).
The alkalinity map clearly indicates that it is higher in NE part
(Fig. 3D). The quality of groundwater in a significant portion
of the study area is alkaline in nature which may be due to
presence of dissolved carbonates in the form of bicarbonates
(Adams et al., 2001). A positive correlation exits between
alkalinity of groundwater and fluoride content (Table 2)
affecting fluoride in the groundwater. This fact validates the
leaching of fluoride from alkali granite.

Journal of Indian Association for Environmental Management Vol. 40, No. 3 (2020), 24-38 29
TABLE 2
Correlation matrix of analysed groundwater quality parameters
Parameters pH EC TDS AK TH Ca2+
Mg2+
Na+
K+
HCO₃⁻ SO₄²ˉ Cl⁻ F⁻ NO₃⁻ Ag Cu Fe Mn Ni Zn
pH 1.000
EC -0.048 1.000
TDS -0.218 0.886 1.000
AK 0.033 0.364 0.350 1.000
TH -0.193 -0.050 0.150 -0.248 1.000
Ca2+
-0.015 -0.335 -0.357 -0.086 -0.033 1.000
Mg2+
-0.175 -0.180 -0.024 -0.072 0.664 -0.150 1.000
Na+
0.021 0.366 0.382 0.811 -0.414 -0.280 -0.059 1.000
K+
-0.063 0.077 0.285 0.026 0.233 -0.158 0.297 0.115 1.000
HCO₃⁻ -0.027 0.245 0.327 0.779 -0.008 -0.098 0.118 0.754 0.375 1.000
SO₄²ˉ -0.502 -0.050 0.190 -0.425 0.663 -0.309 0.557 -0.366 0.334 -0.143 1.000
Cl⁻ -0.005 0.122 0.236 -0.094 0.453 -0.265 0.357 0.058 -0.174 -0.211 0.236 1.000
F⁻ 0.319 0.308 0.167 0.270 -0.053 -0.322 -0.058 0.243 -0.035 0.143 -0.212 0.265 1.000
NO₃⁻ -0.155 0.241 0.232 0.019 0.137 0.027 0.095 -0.065 -0.039 -0.262 0.067 0.217 -0.342 1.000
Ag -0.128 -0.363 -0.156 0.044 0.233 0.146 0.361 -0.077 0.093 -0.029 0.029 0.134 -0.328 0.163 1.000
Cu -0.406 0.413 0.457 0.080 -0.223 -0.006 -0.195 0.132 0.094 -0.013 -0.061 -0.096 0.058 0.127 -0.148 1.000
Fe -0.325 -0.117 0.061 -0.045 -0.021 -0.312 0.325 0.103 0.357 0.050 0.219 -0.098 -0.258 0.020 0.383 0.506 1.000
Mn 0.095 0.231 0.186 -0.155 -0.123 -0.008 -0.154 -0.168 -0.365 -0.231 -0.043 -0.152 -0.082 0.124 0.068 -0.005 -0.165 1.000
Ni 0.100 0.074 0.091 -0.268 -0.017 0.515 -0.253 -0.257 0.352 -0.030 -0.010 -0.345 -0.279 0.007 -0.361 0.134 -0.235 -0.044 1.000
Zn 0.000 0.000 0.000 0.000 0.000 0.000 0.000 0.000 0.000 0.000 0.000 0.000 0.000 0.000 0.000 0.000 0.000 0.000 0.000 1.000 [Unit of each groundwater quality parameter is in mg/l except EC (μS/cm) and pH (on scale); The highlighted value indicates
significant correlation (> 0.5); AK denotes Alkalinity and TH denotes Total Hardness as CaCO3.]
TABLE 3
BIS, WHO specifications & statistical analysis of groundwater quality parameters
Parameters BIS (2012, 2015) * WHO (2017) Min. Max. Mean SD (σ)
pH (On Scale) 6.5-8.5 7 - 8 6.81 8.32 7.95 0.44
EC (μS/cm) 300 - 286.00 1162.00 616.73 251.98
TDS (mg/l) 500-2000 600-1000 285.00 879.00 482.00 177.73
Alkalinity (mg/l) 200-600 - 50.00 452.00 172.73 112.25
TH as CaCO₃ (mg/l) 200-600 200 139.00 536.00 284.00 100.53
Ca²⁺ (mg/l) 75-200 100-300 12.00 112.00 63.52 30.67
Mg²⁺ (mg/l) 30-100 - 6.80 64.80 30.15 15.05
Na⁺ (mg/l) - 50-200 48.71 233.50 129.49 55.94
K⁺ (mg/l) - - 0.96 2.41 1.71 0.48
HCO⁻ (mg/l) 300-600 - 36.61 536.95 226.76 132.42
SO²⁻ (mg/l) 200-400 250 3.47 73.04 17.80 15.92
Cl⁻ (mg/l) 250-1000 250 70.92 241.13 156.30 44.84
F⁻ (mg/l) 1-1.5 1.5 0.11 3.34 1.18 0.83
NO⁻ (mg/l) 45 50 86.95 210.40 156.96 35.41
Ag (mg/l) 0.1 0.1 0.00 0.02 0.01 0.01
Cu (mg/l) 0.05-1.5 2 0.00 0.01 0.00 0.00
Fe (mg/l) 1 0.3 0.10 0.38 0.23 0.08
Mn (mg/l) 0.1-0.3 0.1-0.4 0.01 0.22 0.05 0.04
Ni (mg/l) 0.02 0.07 0.00 0.04 0.01 0.01
Zn (mg/l) 5.0-15 3 - 5 0.01 0.01 0.01 0.00
* The lower value denotes acceptable/desirable limit and the higher value denotes the permissible limit in absence of alternate
source (Bureau of Indian Standards, 2012, 2015).

Journal of Indian Association for Environmental Management Vol. 40, No. 3 (2020), 24-38 30
Calcium (Ca2+
): In the study area the calcium concentration
ranges between 12 to 112 mg/l and is within permissible limit
(200 mg/l). The higher concentration of calcium in
groundwater is in northern and south eastern part of the study
area (Fig.3F)
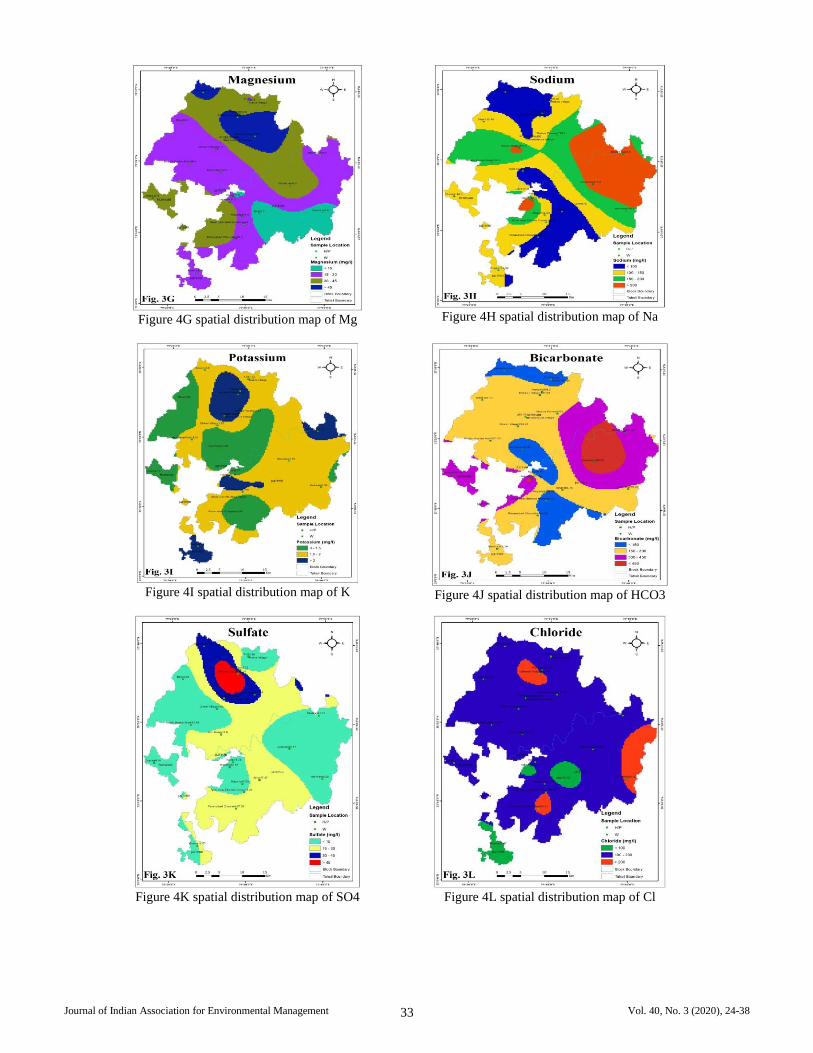
Magnesium (Mg2+
): The presence of magnesium is equally
responsible for the hardness of water. Its concentration ranges
between 6.8 to 64.8 mg/l in the study area and is within
permissible limit (100 mg/l). Spatial distribution reveals that
the magnesium concentration in groundwater is higher in
northern part of the study area (Fig. 3G).
Total Hardness (TH): The presence of calcium and
magnesium in the water determines the total hardness. In
general, hard water originates in areas where the top soil is
thick and limestone formations are present (Arumugam,
2010). The naturally occurring minerals are dissolved and
carried down by the water while moving through soil and rock
into the groundwater as water is a great solvent for calcium
and magnesium. In the study area it ranges between 139 to 536
mg/l which is within the permissible limits (600 mg/l).
The spatial distribution map of Ca2+
indicates presence of
varying concentration within permissible limit thought out the
area concerned (Fig. 3F). Similarly, Mg2+
is also unevenly
distributed within permissible limit except in NE part of the
study area (Fig. 3G). Further, in coherence with the presence
of Ca2+
and Mg2+
and in consequence the spatial distribution
pattern of total hardness in the study reflects that the
groundwater is moderately hard (Fig. 3E). Higher
concentration of TH in groundwater may cause heart disease
and kidney stone in human beings. The correlation matrix
clearly marks a significant positive correlation between Mg2+
and total hardness as well as Na+ and alkalinity (Table 2).
Sodium (Na+): It is one of the highly reactive alkali metal. It
is commonly present in the groundwater. The rock forming
minerals and soils contain sodium compounds which are easily
dissolved and liberate sodium in groundwater. The weathering
of rock forming minerals i.e., particularly silicate minerals
cause the higher concentration of Na+ in groundwater (Stallard
and Edmond 1983). The higher concentration of Na+ in
groundwater may be due to the mechanism of cation exchange
(Kangjoo Kim and Seong-Taekyun, 2005). In the study area it
ranges between 48.71 to 233.5 mg/l. Na+
is highest in the NE
part which is in conformity with the alkalinity and TDS (Fig.
3C, 3D & 3H).
Potassium (K+): Many rocks and minerals contain potassium
which are released in the groundwater due to relatively soluble
nature of these minerals and rocks. In this study it varies
between 0.96 to 2.41 mg/l.
Although, K+ is insignificant present and it’s lower
concentration is covering major portion of the study area. Its
distribution pattern is more or less conformable with the TDS
and Na+ (Fig. 3C, 3H & 3I).
Bicarbonate (HCO3⁻): HCO3⁻ is another important quality
parameter. It is produced by the carbonate rocks viz. limestone
and dolomite through its reaction with carbon dioxide and
water. Also, the carbon-dioxide present in the soil reacts with
the rock forming minerals to produced bicarbonate, resulting
an alkaline environment in the groundwater. It varies between
36.61 to 536.95 mg/l in the study area and is within the
permissible limit of 600 mg/l.
It is showing a significant positive correlation (> 0.50) with
alkalinity and Na+
(Table 2) which is also reflected in the
spatial distribution pattern of these parameters (Fig. 3D, 3H &
3J).
Sulfate (SO₄²⁻): The dissolution of rocks containing gypsum,
iron sulfides, and other sulfur bearing compounds cause their
leaching and releases sulfates. It ranges between the 3.47 to
73.04 mg/l in the study area which is well within the
acceptable limit i.e.200 mg/l. Although, sulfate (SO₄²⁻) is an
important quality parameter, it is insignificantly distributed in
the study area (Fig. 3K).
Chloride (Cl⁻): It is also a significant component in quality
analysis. It ranges between 70.92 to 241.13 mg/l in the study
area which is within the desirable limit (250 mg/l) as revealed
from the spatial distribution map of chloride (Fig. 3L).
Fluoride (F⁻): It is an important and sensitive/vulnerable
quality parameter. In groundwater, fluoride is geogenic in
nature. It usually occurs either in trace amounts or as a major
ion with high concentration in groundwater (Gaciri and
Davies, 1993; Apambire et al., 1997; Fantong et al., 2010).
The fluoride-bearing minerals release fluoride into
groundwater mainly due to groundwater-host rock interaction.
The granite, granitic gneiss etc. predominantly present in the
study area is commonly found to contain fluorite (CaF2) as an
accessory mineral (Ozsvath, 2006; Saxena and Ahmed, 2003)
which plays a significant role in controlling the geochemistry
of fluoride (Deshmukh et al. 1995). Besides fluorite mineral, it
is also abundant in other rock-forming minerals like apatite,
micas, amphiboles, and clay minerals (Karro and Uppin, 2013;
Narsimha and Sudarshan, 2013; Naseem et al., 2010; Jha et
al., 2010; Rafique et al., 2009; Carrillo-Rivera et al., 2002). Its
concentration ranges between 0.11 to 3.34 mg/l in the study
area. The concentration of fluoride exceeds the permissible
limit (1.5 mg/l) in about 22% of the groundwater samples. In
acidic water, fluoride is adsorbed on clay surface, while in
alkaline water, fluoride is absorbed from solid phases;
therefore, alkaline pH is more favorable for fluoride
dissolution, (Keshavarzi et al., 2010; Rafique et al., 2009;
Saxena and Ahmed 2003; Rao, 2009; Ravindra and Garg,
2007; Vikas et al., 2009).
F⁻ is present noticeably in NE portion of the study area where
it is beyond permissible limit (3.34 mg/l) (Fig. 3M). The high
concentration (>3.0 mg/l) of fluoride may lead to skeletal
fluorosis (Raju et al, 2009). Several factors viz. temperature,
pH, presence or absence of complexing or precipitating ions

Journal of Indian Association for Environmental Management Vol. 40, No. 3 (2020), 24-38 31
and colloids, solubility of fluorine bearing minerals, anion
exchange capacity of aquifer materials (i.e. OH⁻ with F⁻), size
and type of geological formations traversed by groundwater
and the contact time period during which water remains in
contact with a particular formation are responsible for fluoride
concentration in groundwater (Apambire et al., 1997). The
secondary porosity developed due to presence of cracks, joints
and fractures contain more fluoride bearing minerals in
comparision to massive rocks (Pandey et al., 2016).
Nitrate (NO3⁻): Nitrate and Nitrite are naturally occurring
ions and are significant component in nitrogen cycle.
Groundwater mainly contains anthropogenic nitrate which
could be due to leaching from waste disposal, sanitary
landfills, over application of inorganic nitrate fertilizer or
improper manure management (Chapman, 1996).
In the study area its concentration ranges between 86.95 to
210.4 mg/l and is in excess of the permissible limits (45 mg/l)
with varying degree of concentration (Fig. 3N). This may be
hazardous to health. The higher values of nitrate in potable
water increases the chances of gastric ulcer/cancer and other
health hazards to pregnant women and infants less than 6
months of age causing Methaemoglobinaemia, birth
malformations and hypertension (Majumdar and Gupta, 2000;
Egereonu and Nwachukwu, 2005; Rao, 2006; Kumar et al.,
2012; Kumar et al., 2014). The high values of nitrate in
groundwater samples may be due to unlined septic tanks and
unplanned sewerage system that contaminates to phreatic
aquifer. Hence, proper monitoring and regulated effort are
consistently required to get the desired impact.
Silver (Ag): It is a naturally occurring metal which usually
occurs in the form of insoluble and immobile oxides, sulfides
and some salts. It is rarely present at concentrations above
5µg/litre (WHO, 2017) in groundwater and surface water
under natural condition. In the present study, silver does not
show any remarkable presence in groundwater (Fig. 3O) and it
ranges between 0.000 to 0.021 mg/l which is within the
permissible limit (0.1 mg/l).
Copper (Cu): This metal naturally occurs in rock, soil,
plants, animals, and groundwater in very less concentration.
The quarrying and mining activities, farming practices,
manufacturing operations and municipal or industrial waste
released enrich the concentration of Cu into groundwater. Cu
enters into drinking water either by contamination of well
water or corrosion of copper pipes in case of water is acidic. It
is negligibly present between 0 to 0.0078 mg/l in the study
area (Fig. 3P) which is well within permissible limit (1.5
mg/l).
Iron (Fe): The mafic minerals especially the iron bearing
minerals and rocks are the most common sources of iron in
groundwater. In the aquifer system the iron occurs naturally in
the reduced Fe2+
state but its concentration in groundwater
increases gradually by its dissolution and has no ill effect on
human health. The study area is having secondary porosity and
groundwater containing iron in ferrous state (Fe2+
) usually
occurs below the water table. This Fe2+
state is oxidised to
Fe3+
state when it comes in contact with atmospheric oxygen
or by the action of iron related bacteria. It forms insoluble
hydroxides which precipitates in groundwater and causes
health hazards. So, by raising the water table through
recharging, the ill impacts can be reduced and the affected
area can be mitigated. In fact, concentration of iron in
groundwater is often higher than those measured in surface
water. In the study area it ranges between 0.102 to 0.381 mg/l
(Fig. 3Q) which is well within the permissible limit (1.0 mg/l,
BIS, 2015).
Manganese (Mn): It occurs naturally in groundwater,
especially in anaerobic environment. The rainfall chemistry,
aquifer lithology, geochemical environment, groundwater flow
paths and residence time, etc. are responsible for the
concentration of Mn in groundwater which may vary
significantly in space and time. It may be released by the
leaching of the overlying soils and minerals in underlying
rocks as well as from the minerals of the aquifer itself in
groundwater. In the study area it ranges between 0.005 to
0.221 mg/l (Fig. 3R) which is well within the permissible limit
(0.3 mg/l).
Nickel (Ni): The nickel ore bearing rocks and minerals are the
primary source of nickel in groundwater. The nickel which
occurs in drinking water is usually derived through the
leaching from metals present in water supply pipes and
fittings. It ranges between 0 to 0.0408 mg/l in the study area
and it crosses the permissible limit (0.02 mg/l). It shows its
remarkable presence in smaller patches (Fig. 3S) and possibly
it does not reflect any hazard to human health.
Zinc (Zn): Groundwater rarely contains zinc above 0.1 mg/l
though it occurs in significant quantities in rocks and minerals.
In the study area the groundwater shows insignificant
concentration of Zn (0.0136 mg/l) which is well within the
acceptable limit (5 mg/l) (Fig. 3T).
(iii) Water Quality Index: The water quality index (WQI)
map of the study area has been prepared using the twenty
analysed parameters for twenty-two locations (Fig. 4)
following the standard procedure. It has become a significant
digital tool to categorize the samples depicting their quality for
various specific uses. The samples of the study area have been
classified into five different classes ranging from excellent to
unsuitable (Table 5) on the basis of WQI.
The WQI Map of the study area indicates that its major
portion is having excellent (0-25 mg/l) and good (25-50)
quality of groundwater while very poor (75-100 mg/l) to
unsuitable (> 100 mg/l) quality is prevailing only in small
pockets in southern part (Fig. 4). The WQI map has been
generated based on the selective quality parameters to
decipher the various groundwater quality classes viz.
excellent, good, poor, very poor and unsuitable for different
types of uses at each location (Table 5 & Fig. 4).

Journal of Indian Association for Environmental Management Vol. 40, No. 3 (2020), 24-38 32
Figure 4A spatial distribution map of pH
Figure 4D spatial distribution map of Alkalinity
Figure 4B spatial distribution map of EC
Figure 4E spatial distribution map of Total Harddness
Figure 4C spatial distribution map of TDS
Figure 4F spatial distribution map of Ca
Journal of Indian Association for Environmental Management Vol. 40, No. 3 (2020), 24-38 33
Figure 4G spatial distribution map of Mg
Figure 4H spatial distribution map of Na
Figure 4I spatial distribution map of K
Figure 4J spatial distribution map of HCO3
Figure 4K spatial distribution map of SO4
Figure 4L spatial distribution map of Cl

Journal of Indian Association for Environmental Management Vol. 40, No. 3 (2020), 24-38 34
Figure 4M spatial distribution map of F
Figure 4N spatial distribution map of NO3
Figure 4O spatial distribution map of Ag
Figure 4P spatial distribution map of Cu
Figure 4Q spatial distribution map of Fe
Figure 4R spatial distribution map of Mn

Journal of Indian Association for Environmental Management Vol. 40, No. 3 (2020), 24-38 35
Figure 4S spatial distribution map of Ni
Figure 4T spatial distribution map of Zn
The map clearly indicates that groundwater quality in Panwari
Block mainly belongs to excellent and good categories and is
suitable for drinking as well as for other domestic uses. In the
Jaitpur block there is a noticeable variation in the quality class.
A remarkable portion in the SW part is affected by poor-very
poor-unsuitable categories while SE part is covered by good-
poor-very poor category and needs sincere effort for a detailed
zonation at micro-level to understand properly and provide
accurate information to the residents as well as policy makers.
Fig. 4 Water Quality Index map of the study area, Kulpahar
Watershed, Mahoba
TABLE 4
Weight (wi), Relative Weight (Wir) & Unit Weight (Wi) of
each groundwater quality parameter
Parameters BIS
Standard
Weightage
(wi)
Relative
Weightage
(Wir)
Wi=
K/Sn
Ph
(On Scale) 6.5-8.5 1 0.0333 0.0016
EC
(μS/cm) 300 2 0.0667 0.0000
TDS
(mg/l)
500-
2000 1 0.0333 0.0000
AK
(mg/l) 200-600 1 0.0333 0.0001
TH
(mg/l) 200-600 1 0.0333 0.0001
Ca²⁺
(mg/l) 75-200 1 0.0333 0.0001
Mg²⁺
(mg/l) 30-100 1 0.0333 0.0004
Na⁺
(mg/l) - 2 0.0667 0.0002
K⁺
(mg/l) - 1 0.0333 0.0011
HCO₃⁻
(mg/l) 300-600 1 0.0333 0.0000
SO₄²⁻
(mg/l) 200-400 1 0.0333 0.0001
Cl⁻
(mg/l)
250-
1000 1 0.0333 0.0000
F⁻
(mg/l) 1-1.5 2 0.0667 0.0105
NO₃⁻ (mg/l) 45 3 0.1000 0.0002
Ag
(mg/l) 0.1 2 0.0667 0.1054
Cu
(mg/l) 0.05-1.5 2 0.0667 0.2107
Fe
(mg/l) 1 2 0.0667 0.0351
Mn 0.1-0.3 2 0.0667 0.1054

Journal of Indian Association for Environmental Management Vol. 40, No. 3 (2020), 24-38 36
(mg/l)
Ni
(mg/l) 0.02 2 0.0667 0.5268
Zn
(mg/l) 5 - 15 1 0.0333 0.0021
Σwi=30 ΣWir=1.0 ΣWi=1.0
TABLE 5
Water Quality Index and its groundwater quality class for each
hydro-station in study area, Kulpahar Watershed, Mahoba
Sam.
No
Hydro-station Abstraction
Structures
WQI
Values
Rating
Class
S-1 Ajnar Hand Pump 86.02 Very Poor
S-2 Panwari Hand Pump 115.93 Unsuitable
S-3 Pasanabad Chauraha Hand Pump 4.75 Excellent
S-4 Ajnar near Electiric
House
Hand Pump 10.56 Excellent
S-5 Beside Koelari Nadi Hand Pump 9.94 Excellent
S-6 Magariya Hand Pump 7.78 Excellent
S-7 Mahua Panwari Hand Pump 8.98 Excellent
S-8 Towards Rath Road Hand Pump 10.35 Excellent
S-9 Kodai Hand Pump 29.58 Good
S-10 Ruri Kalan Hand Pump 13.59 Excellent
S-11 Panwari Village Hand Pump 12.79 Excellent
S-12 Dhwar Village Hand Pump 11.55 Excellent
S-13 Nakra Village Hand Pump 8.52 Excellent
S-14 Bahadurpura Village Hand Pump 9.98 Excellent
S-15 Takariya Hand Pump 11.16 Excellent
S-16 Khama Hand Pump 115.64 Unsuitable
S-17 Chauka Hand Pump 8.81 Excellent
S-18 Bihat Key Well 9.25 Excellent
S-19 Seonrhi Hand Pump 10.31 Excellent
S-20 Bhatewra Hand Pump 8.56 Excellent
S-21 Ghosiona Hand Pump 13.91 Excellent
S-22 Nanwara Hand Pump 67.64 Poor
V. CONCLUSION
The observations of the groundwater quality class of the
area under investigation reflects that the extreme southern part
of the Kulpahar watershed, district Mahoba of Bundelkhand
region is dominant with poor water quality index (WQI) due
the occurrence of granite massif with isolated patches of
Alkali granite and Syenite.
The prolonged interactions between water and country rock
has resulted the enriched fluoride concentration in
groundwater. The presence of higher TDS and total hardness
in certain patches may be corroborated with the occurrence of
syenite and alkali granite. The poor fluxing of groundwater is
responsible to deteriorate the groundwater quality in the study
area. The unlined septic tanks, unplanned sewerage system
and other anthropogenic activities have triggered the nitrate
concentration in groundwater particularly in central and
northern part of the study area. The remaining area is quite
safe and bears excellent to good quality of groundwater
suitable for human consumption.
VI. ACKNOWLEDGEMENT
The authors wish to thank the Central Groundwater Board
(CGWB), Lucknow, NR, Region and Department of Soil
Science & Agricultural Chemistry, BHU, Varanasi for their
valuable chemical analysis support. Also the authors are
thankful to the Department of Mining and Metallurgical
Engineering, Indian Institute of Technology (BHU), Varanasi
for assistance during analysis and useful discussion.
VII. REFERENCES
Adams, S., Titus, R., Pietersen, K., Tredoux, G., Harris, C.,
(2001). Hydrochemical characteristics of aquifers near
Sutherland in the Western Karoo, South Africa. Journal of
hydrology. v.241, pp.91-103.
Alobaidy, A.M., Abid, H.S., Maulood, B.K., (2010).
Application of water quality index for assessment of
Dokan lake ecosystem, Kurdistan region, Iraqi. Journal of
Water Resource and Protection. v.2, pp.792-798.
Apambire, W.B., Boyle, D.R., Michel, F.A., (1997).
Geochemistry, genesis, and health implications of
fluoriferous groundwaters in the upper regions of Ghana.
Environ Geol. v.33, pp.13–2.
APHA, AWWA and WEF (2017). Standard Methods for the
Examination of Water and Wastewater. 23th
Edn., APHA,
Washington, DC. v.6,.
Arumugam, K., (2010). Assessment of Yisa, J., Jimoh, T.,
(2010). Analytical studies on water quality index of river
Landzu. American Journal of Applied sciences. v.7,
pp.453-458.
BIS (Bureau of Indian Standard) (2012). Indian standard
drinking water specification, second revision, pp.2-6.
BIS (Bureau of Indian Standard) (2015). Indian standard
drinking water specification, second revision, pp.2-6.
Boyd, C.E., (2000). Water Quality an Introduction. Kluwer
Acadamic Publi-shers, Boston, USA, pp.330.
Brown, R. M., Mccleiland, N. J., Deiniger, R. A., O’Connor,
M. F., (1972). Water quality index-crossing the physical
barrier. Res. Jerusalem. v.6, pp.787-797.
Carrillo-Rivera, J.J., Cardona, A., Edmunds, W.M., (2002).
Use of abstraction regime and knowledge of
hydrogeological conditions to control high-fluoride
concentration in abstracted groundwater: San Luis Potosı
basin, Mexico. Journal of hydrology. v.261, pp.24-47.
Chapman, D., (1996). Water Quality Assessment-A guide to
use of biota, sediments and water environmental
monitoring 2nd Edition EPFN Spon. London. pp.626.
Chatterjee, C., Raziuddin, M., (2002). Determination of Water
Quality Index (WQI) of a degraded river in Asansol
industrial area (West Bengal). Nature, Environment and
Pollution Technology. v.1, pp.181-189.
Chaurasia, A.K., Pandey, H.K., Tiwari, S.K., Prakash, R.,
Pandey, P., Ram, A., (2018). Groundwater quality
assessment using water quality index (WQI) in parts of
Varanasi district, Uttar Pradesh, India. Journal of the
Geological Society of India. v.92, pp.76-82.

Journal of Indian Association for Environmental Management Vol. 40, No. 3 (2020), 24-38 37
Deshmukh, A.N., Shah, K.C., Sriram, A., (1995). Coal Ash: a
source of fluoride pollution, a case study of Koradi
thermal power station, District Nagpur, Maharashtra.
Gondwana Geol Mag. v.9, pp.21–29.
Diersing, N., Nancy, F., (2009). Water quality: Frequently
asked questions. Florida Brooks National Marine
Sanctuary, Key West, FL.
Egereonu, U.U., Nwachukwu, U.L., (2005). Evaluation of the
surface and groundwater resources of Efuru River
Catchment, Mbano, South Eastern, Nigeria. J. Assoc.
Adv. Model. Simulat. Tech. Enterpr. v.66, pp.53-71
Fantong, W.Y., Satake, H., Ayonghe, S.N., Suh, E.C.,
Adelana, S.M., Fantong, E.B.S., Zhang, J., (2010).
Geochemical provenance and spatial distribution of
fluoride in groundwater of Mayo Tsanaga River Basin,
Far North Region, Cameroon: implications for incidence
of fluorosis and optimal consumption
dose. Environmental Geochemistry and Health. v.32,
pp.147-163.
Gaciri, S.J., Davies, T.C., (1993). The occurrence and
geochemistry of fluoride in some natural waters of
Kenya. Journal of Hydrology. v.143, pp.395-412.
Gebrehiwot, A.B., Tadesse, N., Jigar, E., (2011). Application
of water quality index to assess suitablity of groundwater
quality for drinking purposes in Hantebet watershed,
Tigray, Northern Ethiopia. ISABB Journal of Food and
Agriculture Science. v.1, pp.22-30.
GEMS, U., (2007). Global drinking water quality index
development and sensitivity analysis report. United
Nations Environment Programme Global Environment
Monitoring System/Water Programme. pp.58.
Horton, R. K. (1965). An index number system for rating
water quality. Journal of the Water Pollution Control
Federation. v.373, pp.303–306.
Jagadeeswari, P.B., Ramesh, K., (2012). Deciphering fresh
and saline groundwater interface in south Chennai coastal
aquifer, Tamil Nadu, India. International Journal of
Research in Chemistry and Environment (IJRCE). v.2,
pp.123-132.
Jha, S.K., Nayak, A.K., Sharma, Y.K., (2010). Potential
fluoride contamination in the drinking water of Marks
Nagar, Unnao district, UP, India. Environmental
Geochemistry and Health. v.32, pp.217-226.
Johnson, D.L., Ambrose, S.H., Bassett, T.J., Bowen, M.L.,
Crummey, D.E., Isaacson, J.S., Winter‐Nelson, A.E.,
(1997). Meanings of environmental terms. Journal of
Environmental Quality. v.26, pp.581-589.
Kalavathy, S., Sharma, T.R., Sureshkumar, P., (2011). Water
quality index of river Cauvery in Tiruchirappalli district,
Tamilnadu. Arch Environ Sci. v.5, pp.55-61.
Kangjoo, K., Yun, S.T., (2005). Buffering of sodium
concentration by cation exchange in the groundwater
system of a sandy aquifer. Geochemical Journal. v.39,
pp.273-284.
Karro, E., Uppin, M., (2013). The occurrence and
hydrochemistry of fluoride and boron in carbonate aquifer
system, central and western Estonia. Environmental
Monitoring and Assessment. v.185, pp.3735-3748.
Kavitha, R., Elangovan, K., (2010). Ground water quality
characteristics at Erode district, Tamilnadu
India. International Journal of Environmental Sciences.
v.1, pp.163-175.
Keshavarzi, B., Moore, F., Esmaeili, A., Rastmanesh, F.,
(2010). The source of fluoride toxicity in Muteh area,
Isfahan, Iran. Environmental Earth Sciences. v.61,
pp.777-786.
Kumar, S.K., Chandrasekar, N., Seralathan, P., Godson, P.S.,
Magesh, N.S., (2012). Hydrogeochemical study of
shallow carbonate aquifers, Rameswaram Island,
India. Environmental Monitoring and Assessment. v.184,
pp.4127-4138.
Kumar, S.K., Logeshkumaran, A., Magesh, N.S., Godson,
P.S., Chandrasekar, N., (2014). Hydro-geochemistry and
application of water quality index (WQI) for groundwater
quality assessment, Anna Nagar, part of Chennai City,
Tamil Nadu, India. Applied Water Science. v.5, pp.335-
343.
Majumdar, D., Gupta, N., (2000). Nitrate pollution of
groundwater and associated human health
disorders. Indian Journal of Environmental Health. v.42,
pp.28-39.
Narsimha, A., Sudarshan, V., (2013). Hydrogeochemistry of
groundwater in Basara area, Adilabad District, Andhra
Pradesh, India. Journal of Applied Geochemistry. v.15,
pp.224-237.
Naseem, S., Rafique, T., Bashir, E., Bhanger, M.I., Laghari,
A., Usmani, T.H., (2010). Lithological influences on
occurrence of high-fluoride groundwater in Nagar Parkar
area, Thar Desert, Pakistan. Chemosphere. v.78, pp.1313-
1321.
Ozsvath, D.L., (2006). Fluoride concentrations in a crystalline
bedrock aquifer Marathon County,
Wisconsin. Environmental Geology. v.50, pp.132-138.
Panda, R.B., Sahu, B.K., Garnaik, B.K., Sinha, B.K., Nayak,
A., (1991). Investigation of water quality of Brahmani
River. Indian Journal of Environmental Health. v.33,
pp.45-50.
Pandey, H.K., Duggal, S.K., Jamatia, A., (2016). Fluoride
contamination of groundwater and it’s hydrogeological
evolution in District Sonbhadra (UP) India. Proceedings
of the National Academy of Sciences, India Section A:
Physical Sciences. v.86, pp.81-93.
Panigrahi, T., Das, K.K., Dey, B.S., Panda, R.B., (2012).
Assessment of Water Quality of river Sono,
Balasore. International Journal Environmental Science.
v.3, pp.49-56.
Rafique, T., Naseem, S., Usmani, T.H., Bashir, E., Khan, F.A.,
Bhanger, M.I., (2009). Geochemical factors controlling
the occurrence of high fluoride groundwater in the Nagar

Journal of Indian Association for Environmental Management Vol. 40, No. 3 (2020), 24-38 38
Parkar area, Sindh, Pakistan. Journal of Hazardous
Materials. v.171, pp.424-430.
Raju, N.J., Dey, S., Das, K., (2009). Fluoride contamination in
groundwaters of Sonbhadra district, Uttar Pradesh,
India. Current Science. v.96, pp.979-985.
Rao, N.S., (2006). Nitrate pollution and its distribution in the
groundwater of Srikakulam district, Andhra Pradesh,
India. Environmental Geology. v.51, pp.631-645.
Rao, N. S., (2009). Fluoride in groundwater, Varaha River
Basin, Visakhapatnam District, Andhra Pradesh,
India. Environmental Monitoring and Assessment. v.152,
pp.47-60.
Ravindra, K., Garg, V.K., (2007). Hydro-chemical survey of
groundwater of Hisar city and assessment of
defluoridation methods used in India. Environmental
Monitoring and Assessment. v.132, pp.33-43.
Saxena, V., Ahmed, S., (2003). Inferring the chemical
parameters for the dissolution of fluoride in
groundwater. Environmental Geology. v.43, pp.731-736.
Stallard, R.F., Edmond, J.M., (1983). Geochemistry of the
Amazon: 2.The influence of geology and weathering
environment on the dissolved load. Journal of
Geophysical Research: Oceans. v.88, pp.9671-9688.
Tripathy, J.K., Sahu, K.C., (2005). Seasonal hydrochemistry
of groundwater in the Barrier Spit system of the Chilika
Lagoon, India. Journal of Environmental Hydrology. v.13,
pp.1-9.
Vikas, C., Kushwaha, R.K., Pandit, M.K., (2009).
Hydrochemical status of groundwater in district Ajmer
(NW India) with reference to fluoride distribution. Journal
of the Geological Society of India. v.73, pp.773-784.
WHO, (2017). Guideline for drinking water quality, 4th
edition, World Health Organization, Geneva.
Yisa, J., Jimoh, T., (2010). Analytical studies on water quality
index of river Landzu. American Journal of Applied
sciences. v.7, pp.453-458.