global leadership
TRANSCRIPT

1 9 9 7 A n n u a l R e p o r t
Global Leadershipi n p r e c i s i o n i n s t r u m e n t s
METTLER TOLEDOCH-8606 Greifensee, SwitzerlandTelephone +41-1- 944 22 11http://www.mt.com
Printed in the U.S.A.
A b o u t t h e C o m p a n y
Mettler-Toledo International Inc. is a leading global supplier of precision instruments. The Company is the world’s
largest manufacturer and marketer of weighing instruments for use in laboratory, industrial and food retailing
applications. The Company also holds one of the top three market positions in several related analytical instruments,
including titrators, thermal analysis systems, pH meters, automatic lab reactors and electrodes. In addition, it is the
world’s largest manufacturer and marketer of metal detection systems used in production and packaging.
METTLER TOLEDO focuses on the high value-added segments of its markets by providing innovative instruments
that are often integrated into application-specific solutions for customers. The Company designs its instruments not only
to gather valuable data but also to facilitate the processing and transfer of this data into customers’ management
information systems.
Headquartered in Greifensee, Switzerland, METTLER TOLEDO serves customers worldwide through its own sales
and service organization, and it has a manufacturing presence in Europe, the United States and Asia. The Company has
approximately 6,800 employees.
METTLER TOLEDO became a public company on November 14, 1997. Previously, it was privately held by manage-
ment and AEA Investors Inc., which together purchased the METTLER TOLEDO Group from Ciba-Geigy AG in October
1996. Management and employees continue to maintain a sizable ownership stake in METTLER TOLEDO.
C o n t e n t s
Financial Highlights...............................................1
Letter to Shareholders.............................................2
Quality.................................................................6
Technology.........................................................10
Global Presence..................................................14
Management’s Discussion and Analysis...................18
Independent Auditors’ Report.................................25
Consolidated Financial Statements..........................26
Selected Financial Data.........................................42
Corporate Information...........................................44
Board of Directors and Officers...............................45
Portions of this report may contain ”forward-looking statements” under the Private Securities
Litigation Reform Act of 1995. The forward-looking statements in this report are subject to risks
and uncertainties that could cause actual events or results to differ materially from those expressed
in or implied by the statements. Further information concerning issues that could materially affect
financial performance is contained in the ”Forward-Looking Statements” section of Management’s
Discussion and Analysis in this report and in the Company’s periodic filings with the Securities and
Exchange Commission.

P re c i s i o n Ba l an ce s
Ti t r a t o r s
pH Me te r s
The rma l Ana l y s i s S y s t ems
Au t oma t i c L ab Reac t o r s
E l e c t r o de s
Dens i t y Me t e r s / Re f r a c t ome t e r s
Pha rmaceu t i c a l
Chem i ca l s
Cosme t i c s
Food and Beve r age
Me t a l s
E l e c t r o n i c s
P l a s t i c s / Rubbe r
Jewe l r y a nd P r e c i ou s Me t a l s
Edu ca t i o na l I n s t i t u t i o n s
Gove r nmen t S t anda r d s L ab s
Pha rmaceu t i c a l
Chem i ca l s
Cosme t i c s
Food and Beve r age
Me t a l s
E l e c t r o n i c s
P l a s t i c s / Rubbe r
Tr an spo r t a t i o n
Supe rma r ke t s /G r o ce r i e s
L a b o r a t o r y I n d u s t r i a l / R e t a i l
Mar
kets
Pro
duct
s &
App
licat
ions
Perform precision weighing functions vital to research and development and quality control.
Provide accurate measures of the composition of solutions.
Measure acidity of solutions.
Measure different properties (weight, dimension, energy flow) of materials at various temperatures.
Simulate an entire chemical manufacturing process in the lab to ensure its safety and feasibility
before proceeding to production.
Used in pH meters and titrators as well as in in-line applications to monitor production processes.
Measure density and concentrations in solutions.
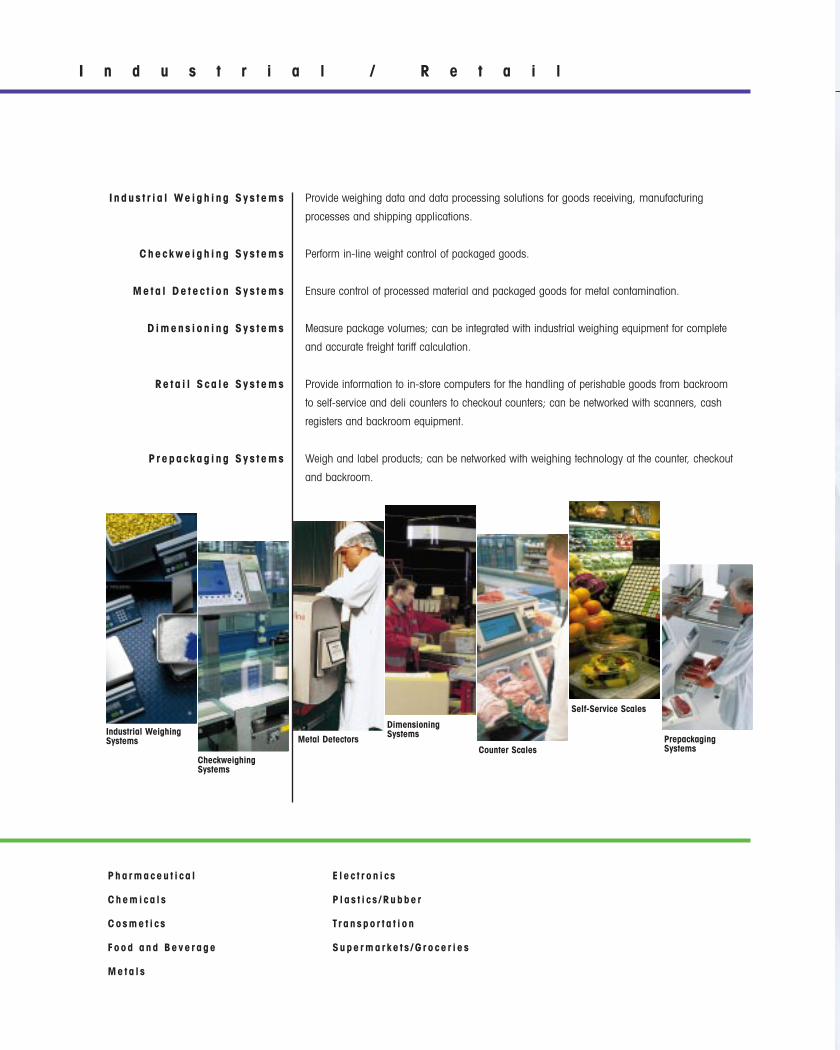
Provide weighing data and data processing solutions for goods receiving, manufacturing
processes and shipping applications.
Perform in-line weight control of packaged goods.
Ensure control of processed material and packaged goods for metal contamination.
Measure package volumes; can be integrated with industrial weighing equipment for complete
and accurate freight tariff calculation.
Provide information to in-store computers for the handling of perishable goods from backroom
to self-service and deli counters to checkout counters; can be networked with scanners, cash
registers and backroom equipment.
Weigh and label products; can be networked with weighing technology at the counter, checkout
and backroom.
I n du s t r i a l We i gh i ng S y s t ems
Chec kwe i gh i ng S y s t ems
Me ta l De t e c t i o n S y s t ems
D imens i on i ng S y s t ems
Re t a i l S ca l e S y s t ems
P repac kag i ng S y s t ems
Titrators CheckweighingSystems
Density Meters Metal DetectorsCounter Scales
Industrial WeighingSystems
pH Meters Thermal AnalysisSystems
Automatic Lab Reactors
ElectrodesDimensioningSystems Prepackaging
Systems
Self-Service ScalesPrecision Balances
Mettler-Toledo International Inc.
PHILIP CALDWELLChairman of the Board*Senior Managing Director, Lehman Brothers Inc.;Retired Chairman of the Board and Chief Executive Officer, Ford Motor CompanyDirector since 1996
REGINALD H. JONES2
Retired Chairman of the Board and Chief Executive Officer, General Electric CompanyDirector since 1996
JOHN D. MACOMBER1
Principal, JDM Investment Group; Former Chairman and President,Export-Import Bank of the United StatesDirector since 1996
JOHN M. MANSERTreasurer,Novartis International AGDirector since 1996
LAURENCE Z.Y. MOH2
Chairman Emeritus,Universal Furniture LimitedDirector since 1996
THOMAS P. SALICE1, 2
Managing Director,AEA Investors Inc.Director since 1996
ROBERT F. SPOERRYPresident and Chief Executive Officer*Director since 1996
ALAN W. WILKINSON1
Managing Director, AEA Investors Inc. Director since 1996
1 Member of the Audit Committee2 Member of the Compensation Committee
*As of May 18, 1998, Robert F. Spoerry, President and Chief Executive Officer, will become Chairman of the Board. Philip Caldwell will step down as Chairman, but will remain a member of the Board.
LUKAS BRAUNSCHWEILERHead, Industrial and Retail, Europe
PETER BÜRKERHead, Human Resources
WILLIAM P. DONNELLYChief Financial Officer
KARL M. LANGHead, Laboratory Division
JOHN D. ROBECHEKHead, Industrial and Retail, Americas
THOMAS RUBBEHead, Logistics and Information Systems
ROBERT F. SPOERRYPresident and Chief Executive Officer
Board of Directors Corporate Officers
45
P re c i s i o n Ba l a n c e s
Ti t r a t o r s
pH Me te r s
Th e r m a l Ana l y s i s S y s t e m s
A u t o ma t i c L a b R eac t o r s
E l e c t r o d e s
De n s i t y M e t e r s / R e f r a c t ome t e r s
Pha rmaceu t i c a l
Chem i ca l s
Cosme t i c s
Food and Beve r age
Me t a l s
E l e c t r o n i c s
P l a s t i c s / Rubbe r
Jewe l r y a nd P r e c i ou s Me t a l s
Edu ca t i o na l I n s t i t u t i o n s
Gove r nmen t S t anda r d s L ab s
Pha rmaceu t i c a l
Chem i ca l s
Cosme t i c s
Food and Beve r age
Me t a l s
E l e c t r o n i c s
P l a s t i c s / Rubbe r
Tr an spo r t a t i o n
Supe rma r ke t s /G r o ce r i e s
L a b o r a t o r y I n d u s t r i a l / R e t a i l
Mar
kets
Pro
duct
s &
App
licat
ions
Perform precision weighing functions vital to research and development and quality control.
Provide accurate measures of the composition of solutions.
Measure acidity of solutions.
Measure different properties (weight, dimension, energy flow) of materials at various temperatures.
Simulate an entire chemical manufacturing process in the lab to ensure its safety and feasibility
before proceeding to production.
Used in pH meters and titrators as well as in in-line applications to monitor production processes.
Measure density and concentrations in solutions.
Provide weighing data and data processing solutions for goods receiving, manufacturing
processes and shipping applications.
Perform in-line weight control of packaged goods.
Ensure control of processed material and packaged goods for metal contamination.
Measure package volumes; can be integrated with industrial weighing equipment for complete
and accurate freight tariff calculation.
Provide information to in-store computers for the handling of perishable goods from backroom
to self-service and deli counters to checkout counters; can be networked with scanners, cash
registers and backroom equipment.
Weigh and label products; can be networked with weighing technology at the counter, checkout
and backroom.
I n d u s t r i a l We i g h i n g S y s t e m s
C h e c k w e i g h i n g S y s t e m s
M e t a l D e t e c t i o n S y s t e m s
D i m e n s i o n i n g S y s t e m s
Re t a i l S c a l e S y s t e m s
P r e p a c k a g i n g S y s t e m s
Titrators CheckweighingSystems
Density Meters Metal DetectorsCounter Scales
Industrial WeighingSystems
pH Meters Thermal AnalysisSystems
Automatic Lab Reactors
ElectrodesDimensioningSystems Prepackaging
Systems
Self-Service ScalesPrecision Balances
Mettler-Toledo International Inc.
PHILIP CALDWELLChairman of the Board*Senior Managing Director, Lehman Brothers Inc.;Retired Chairman of the Board and Chief Executive Officer, Ford Motor CompanyDirector since 1996
REGINALD H. JONES2
Retired Chairman of the Board and Chief Executive Officer, General Electric CompanyDirector since 1996
JOHN D. MACOMBER1
Principal, JDM Investment Group; Former Chairman and President,Export-Import Bank of the United StatesDirector since 1996
JOHN M. MANSERTreasurer,Novartis International AGDirector since 1996
LAURENCE Z.Y. MOH2
Chairman Emeritus,Universal Furniture LimitedDirector since 1996
THOMAS P. SALICE1, 2
Managing Director,AEA Investors Inc.Director since 1996
ROBERT F. SPOERRYPresident and Chief Executive Officer*Director since 1996
ALAN W. WILKINSON1
Managing Director, AEA Investors Inc. Director since 1996
1 Member of the Audit Committee2 Member of the Compensation Committee
*As of May 18, 1998, Robert F. Spoerry, President and Chief Executive Officer, will become Chairman of the Board. Philip Caldwell will step down as Chairman, but will remain a member of the Board.
LUKAS BRAUNSCHWEILERHead, Industrial and Retail, Europe
PETER BÜRKERHead, Human Resources
WILLIAM P. DONNELLYChief Financial Officer
KARL M. LANGHead, Laboratory Division
JOHN D. ROBECHEKHead, Industrial and Retail, Americas
THOMAS RUBBEHead, Logistics and Information Systems
ROBERT F. SPOERRYPresident and Chief Executive Officer
Board of Directors Corporate Officers
45

9
3
5
7
1993 1994 1995 1996 1997
6.8
4.64.0
4
6
8
4.5
9.3
0
200
400
1993 1994 1995 1996 1997
600
800
$1,0007%
729769
850 849 878
D r a m a t i c a l l y I m p r o v i n g M a r g i n
G r o w i n g S a l e s
(In millions)
(In percent)
S a l e s b y G e o g r a p h y
S a l e s b y C u s t o m e r A p p l i c a t i o n
1
(Dollars in thousands) Fiscal Year Ended Fiscal Year Ended 1997 Highlights
December 31, December 31,1997 1996
Net sales $ 878,415 $ 849,133 11% growth in constant currencies
Adjusted operating income (a) $ 81,541 $ 57,752 41% growth
Net debt $ 373,198 $ 393,508 Retired high-yield senior subordinated notes
Interest coverage (b) 4.8 3.9 Borrowing costs reduced to 6.3% from 8.8%
Net debt to EBITDA (b) 3.3 4.6 32% EBITDA growth
a) Adjusted operating income represents gross profit less research and development and selling, general and administrative expenses before amortizationand non-recurring costs.
b) Amounts in 1997 are presented pro forma for the Safeline acquisition and IPO related refinancing.
The 7% is the compounded annual growth rate in constant currencies.
Adjusted operating margin
42%Americas
45%Europe
Asia & Others13%
Retail13%
49%Industrial
38%Laboratory
Mettler-Toledo International Inc.
F i n a n c i a l H i g h l i g h t s

T o O u r S h a r e h o l d e r s
Today we clearly lead the market in
offering the most varied line of products
to address one of the world’s most fun-
damental needs — the determination of
weight. What’s more, we are a leader in
offering our customers integrated prod-
ucts and solutions that directly address
their needs for everything from quality
control to information management.
A COMPETIT IVE EDGE
Through this annual report, we hope
to better acquaint you with METTLER
TOLEDO. Specifically, we hope you’ll
gain a clearer understanding of some of
our key competitive advantages. These
strengths have been central to achieving
and sustaining our leadership position
and will continue to drive further
improvements in that position:
• Our technological prowess.
• Our corporatewide commitment to
product and process quality.
• Our global network of manufacturing
and service capabilities.
You’ll see why customers consis-
tently rely on us as valuable partners in
meeting their own goals. And we hope
you’ll appreciate why we’re so proud
of where we are today and excited
about our future.
wRobert F. Spoerry
e are delighted to share with you
METTLER TOLEDO’s first annual report.
Our management team and employees
take great pride in our Company and its
reputation. We welcome you as partners
in our journey to create an exceptional
public company. Indeed, our financial
performance in 1997 demonstrates we
are well on our way.
While our public-company status
is new, our industry leadership is well
established. The Mettler and Toledo
Scale brand names, which were
combined in 1989, have outstanding
historic reputations for quality and
innovation.
2

FOCUSED STRATEGIES
At METTLER TOLEDO, our goal is to
grow revenues and earnings in a man-
ner which enhances shareholder value.
Toward this goal, we are pursuing four
targeted strategies, which allow us to
build on our strengths and leverage our
leading brand name, global presence
and diverse customer base.
First, we continue to vigorously
invest in research and development,
with a focus on innovative new prod-
ucts. Second, we are seeking to grow
by further penetrating developed markets
and expanding in emerging markets.
Third, we continue to improve our cost
structure and enhance operating
margins through select reengineering
projects. And finally, we are actively
pursuing the acquisition of comple-
mentary product lines and technologies
to help us expand our product offerings
and provide integrated solutions to
customers; we also are interested in
acquiring businesses which will enable
us to build our geographic market
position throughout the world.
Not only are our strategies support-
ed by concrete operating plans, but our
employees understand these plans
and possess the skills and drive to
carry them out. We truly believe that
our extraordinary determination and
dedication make the difference in turning
our plans into reality.
STRONG PERFORMANCE
We believe our financial performance
and market share gains of the past
several years demonstrate that our
strategies are sound.
In fact, 1997 marked another year
of record performance for METTLER
TOLEDO. Sales were $878.4 million, up
11 percent in local currency over 1996,
though somewhat offset by unfavorable
exchange rates. Gross profit percentage
before non-recurring acquisition charges
improved to 44.1 percent from 41.1 per-
cent. Adjusted operating income was
$81.5 million, representing an increase
of more than 41 percent over the 1996
amount.
In all three of our geographic
regions, we enjoyed increased sales in
local currency. For the year, sales grew
by 11 percent in the Americas, 6 percent
in Europe and 30 percent in Asia and
the rest of the world.
Results included non-recurring
charges, after-tax, of $84.2 million for
the year. These involved principally non-
cash charges of $41.2 million for the
early extinguishment of debt, non-cash
acquisition charges of $31.3 million
and restructuring and other non-recurring
charges of $11.7 million.
Another highlight of 1997 was our
initial public offering. We were very
pleased with the results of the IPO,
especially given its occurrence during a
period of volatility in worldwide financial
markets. Concurrent with the IPO, we
also successfully completed an attrac-
tive new senior credit agreement, which
allowed us to retire our high-yield sub-
ordinated notes and provides more
than $200 million of available funds
to pursue our acquisition strategy.
During the past year, we also
made progress in each of our major
strategies by accomplishing a number
of key initiatives. Each contributed to
our overriding efforts to be a customer-
centered organization that delivers
products and services of exceptional
quality and value.
“our management
team and employees
take great pride
in our Company and
its reputation.”
3
T o O u r S h a r e h o l d e r s c o n t i n u e d
o“we believe
that our unique
global approach to
manufacturing and
service will continue
to provide significant
returns...”ur investment in R&D and customer
engineering continued to pay off in
1997 and helped to improve our
margins. New products introduced
to solid market reception included
a network retail scale with an improved
price/performance ratio and attractive
industrial design; a memo titrator with
a built-in chip card for easy customiza-
tion; and a line of standard precision
balances which features our new high-
performance, cost-reduced MonoBloc
weighing sensor. We believe our
MonoBloc sensor provides powerful
advantages over competitor products,
and we are expanding the use of the
sensor throughout our product line.
Our efforts to grow globally were
highlighted by our continued expansion
in Asia, where we have quadrupled the
number of employees since 1990 and
recently opened a facility in Shanghai,
China, with production and research
and development capabilities. The
result? Our revenue in the region grew
by 26 percent in 1997, despite shaky
market conditions. While our growth in
Asia may be restricted in the near term,
we believe that our unique global
approach to manufacturing and service
will continue to provide significant
returns in the medium to long term.
We also made great strides in
improving our cost structure. Profitability
was affected positively by reducing
product costs, achieving greater flexibility
with our workforce, consolidating
manufacturing facilities and transferring
production to lower-cost manufacturing
facilities — notably without any delays
in servicing our customers. We also
centralized our parts distribution and
can now offer direct-from-the-plant
deliveries to more than half of our
European customers.
And, in an excellent example of our
acquisition strategy, in May 1997 we
acquired Safeline Limited, which
strengthened our ability to offer cus-
tomers integrated solutions to meet their
needs. Safeline is the world’s leading
supplier of metal detection systems,
which can be used in conjunction with
our checkweighing instruments for criti-
4

cal quality and safety checks for our
customers in the food processing, phar-
maceutical, cosmetics, chemical and
other industries.
A BRIGHT FUTURE
We are committed to further growth
in sales and profit margins to satisfy
your — and our — high standards and
expectations.
We enter 1998 stronger than ever,
and we expect the year to be another
successful one for METTLER TOLEDO.
Our entire workforce is enthusiastically
focused on our strategies. Our business
outlook remains solid in the United
States and Europe, our largest markets.
We look forward to positive reception for
pivotal new products, as well as the
successful rollout of new organizational
initiatives, such as a consolidated mar-
keting organization in North America.
In addition, several other factors
combine to make METTLER TOLEDO a
particularly attractive investment on an
ongoing basis. Our revenue base con-
tinues to be diversified by geographic
region, product range, industries and
individual customers — which reduces
our risk and increases our appeal for
investors.
Our end markets are stable and
growing, especially the chemical, phar-
maceutical, transportation, and food
and beverage industries where we are
clear market leaders in the United States
and Europe. Despite Asia’s recent eco-
nomic turmoil, we remain convinced
that the region represents excellent long-
term opportunities for our Company.
Emerging markets, including Latin
America and Eastern Europe, offer us
tremendous growth opportunities, princi-
pally as a result of improving economic
conditions, the increasing multinational
presence of our customers and the
adoption of more sophisticated weigh-
ing instruments by local manufacturers.
Furthermore, key industry trends
continue to fuel demand for METTLER
TOLEDO products. Among these
trends are:
• The integration of instruments into
data management software systems
to automate processes and/or improve
process control.
• The development of solutions that
combine weighing and related technol-
ogies into integrated systems.
• The harmonization of national
weighing standards among countries,
such as in the European Union.
• More demanding quality standards
such as ISO-9001, Good Laboratory
Practices and Good Manufacturing
Practices.
We believe METTLER TOLEDO is
uniquely positioned to capitalize on all
of these market opportunities.
5
OUR THANKS
At this exciting juncture in our develop-
ment, we extend our gratitude to our
employees, who are committed to
maintaining and increasing the
METTLER TOLEDO reputation for quality
and integrity. We also remain deeply
appreciative of our customers, who con-
tinue to place their trust in us for innova-
tive solutions and help provide us with
the motivation to deliver only the best.
And we offer special thanks to our
investors, who have expressed confi-
dence in supporting the next phase
of this Company’s growth. Our goal is
to make you just as proud of METTLER
TOLEDO as we are, and to provide you
with ongoing reasons to affirm your vote
of faith in us.
Sincerely,
Robert F. Spoerry
President and Chief Executive Officer

Q u a l i t y
quality leadership. It is METTLER
TOLEDO’s shining hallmark. It is the
competitive advantage our people prize
the most and work passionately to
sustain. Our commitment to quality
and continual improvement is pivotal
in satisfying the high standards of our
customers and positively influencing
our own profitability.
A CORNERSTONE OF OUR CULTURE
At METTLER TOLEDO, quality has never
been just a buzzword. Quality distin-
guishes our culture and permeates our
decision-making. It has its roots in hir-
ing and training the best employees and
S e t t i n g n e w
harnessing their talents in innovative
ways, such as operating within highly
motivated, self-managed work cells.
The pride and dedication employees
have in our Company and its commit-
ment to quality are evident in our high
degree of employee ownership. More
than 1,000 employees worldwide own
shares in METTLER TOLEDO.
From product development and
manufacturing to customer service, our
quality culture is demonstrated in all we
do, and is continually supported by a
wide range of initiatives.
THE BENCHMARK
To see exactly what we mean, ask
customers in a variety of industrial, lab-
oratory and retail settings. The ”Mettler”
and ”Toledo” brand names have long
been synonymous with quality, accura-
cy and innovation. For instance, thanks
to its exceptional quality, a METTLER
TOLEDO balance is the most commonly
used instrument in laboratories around
the world. Indeed, customers often
use ”Mettler” to refer to balances in gen-
eral. And, according to independent
research, METTLER TOLEDO ranks
among the top three most recognized
brands in the broader market of
analytical instruments.
6 Analytical Balance

standards
mETTLER TOLEDO’s
precision instruments are a
staple in laboratories in virtually
every industry. Developed and
crafted with exceptional quality,
our precision balances and
analytical instruments meet
fundamental lab applications
in R&D, quality assurance,
production and education.
7

Q u a l i t y
S e t t i n g n e w
to disturbing voltages, electrostatic
discharges, electromagnetic fields,
heavy shocks, vibrations, extreme
temperatures, moisture levels and more.
Our accredited test labs, which also
are sought by third parties, verify that
product testing meets official industry
standards and international safety
regulations.
This development process results
in the creation of quality products target-
ed to customer needs, as well as in
dramatically reduced time from concept
to market launch. This was exemplified
recently in a major partnership with
Pitney Bowes, which chose us as the
single-source supplier for its weighing
equipment. A team, which involved the
customer from initial design, created
an entirely new family of electronic
scales to meet tight specifications in
only 16 months. The test lab provided
the team with quick performance
assessments throughout the product
development process.
standardsc
So well respected is METTLER
TOLEDO quality that numerous govern-
ments rely on our mass comparator
equipment to uphold their own national
weights-and-measures standards.
DESIGNED FOR QUALITY
Quality is designed into METTLER
TOLEDO products from inception.
Concurrent product engineering teams
not only include representatives of all
Company resources needed throughout
the product innovation cycle, but also
directly involve customers and suppliers.
These multi-disciplinary teams are often
assigned to a single project with the
aim of developing the best solution for
the customer and minimizing the prod-
uct’s time to market.
From the earliest design phase,
our products undergo extensive testing
to ensure they meet the highest specifi-
cations and withstand the harshest
treatment. Technicians at our in-house
testing labs subject every product
ustomers routinely recognize our
Company for meeting their highest
quality standards. For example, in the
United States, VWR Scientific Products
has recognized METTLER TOLEDO with
its ”1997 special achievement award
for customer fulfillment.” And Fisher
Scientific has honored METTLER TOLEDO
as an ”outstanding quality supplier” in
its annual ratings of product and
service quality for each of the past
six years.
m1
y1
y2
m1m2
Applied load
100%
100%
50%
8
Electromagnetic Compatibility Test
Automatic Linearity Calibration

quality is the uncompromising
link from the time our products
are conceived and developed
through to their servicing in
specific customer applications.
Tough in-house testing epitomizes
our efforts to ensure products
meet the highest specifications
and perform to customer
demands. Indeed, our products
and services continue to be the
industry touchstone for quality.
9
installation, service and training sup-
port, in addition to expert counsel on
product and software applications. The
Company also conducts workshops to
teach customers and industry represen-
tatives about quality management,
compliance issues and related subjects.
In short, customers benefit from
our dedication to quality at every turn.
They get extremely reliable, precise
products delivered on time and serviced
efficiently. Ultimately, they look to us as
vital partners in achieving critical appli-
cations at low cost and maintaining
their own high quality standards. What
better testimony to our quality could
there be?
CONSTRUCTED WITH QUALITY
Our ISO-9001-certified manufacturing
operations continue the emphasis on
quality, as evidenced by excellent
yields, low failure rates and low
warranty costs. We were the first
weighing instruments manufacturer
to receive ISO-9000 certification and
are on the way to ISO-14001, the
environmental management quality
standard. An extensive quality control
system is integrated into each step
of the manufacturing process.
In fact, beyond designing and
building products according to quality
standards, we pioneered technology
that builds standards into the products
themselves, through specialized soft-
ware and other features. For example,
the Company’s FACT (Fully Automatic
Calibration Technology), used in our
balances, detects when permitted
tolerance ranges for temperature and
humidity are exceeded and then auto-
matically initiates a calibration process
to adjust the balance for optimum
performance.
UNMATCHED TECHNICAL SERVICE
METTLER TOLEDO is unmatched in the
high quality of technical service and
support it offers customers, as well as
in its ability to deliver that assistance on
a global scale. More than 1,500 highly
trained service technicians provide
Pitney Bowes Mail Scale

T e c h n o l o g y
our state-of-the-art technological
capabilities are showcased every time
one of our instruments detects a pin-
point-size piece of metal in a package
of ground beef or measures the precise
proportion of ingredients that makes a
medication potent but not toxic. But what
truly distinguishes our technology is the
ability to translate those capabilities into
specific solutions for customers.
A COMMITMENT TO R&D
Our R&D process is intensive and cus-
tomer-centered. We invest significantly
more in research and development than
any of our competitors — a commitment
which has led to a position of technology
C r e a t i n g
leadership. One-tenth of our employees
work in research, development and
product engineering, offering expertise
in sensor technology, electronics and
software development.
R&D efforts, including a multi-
disciplinary product development
process, are aimed at providing a com-
petitive edge for METTLER TOLEDO and
enhanced solutions for customers.
Indeed, we partner with customers in
everything from generating new product
ideas to ensuring products meet
exact specifications in their intended
application.
Our R&D capabilities often enable
us to deepen customer loyalty and
dictate the pace of technology in the
marketplace.
REVOLUTIONARY APPROACHES
Consider the Company’s advances in
the design and manufacture of weighing
sensors, which comprise the heart
of every balance. Our new proprietary
MonoBloc design eliminates many of
the complex mechanical linkages in a
weighing sensor, with one piece
replacing as many as 90 assembled
parts in a conventional weighing cell.
10 MonoBloc Weighing Sensor

solutions
mETTLER TOLEDO’s
leading-edge technology has
helped customers in a wide
range of industries devise
solutions to their special
challenges. Ongoing innovations,
such as our unique MonoBloc
weighing sensor, provide
significant cost and performance
benefits for our customers as
well as our Company.
11

mIn a novel approach to meet
customer needs, our Jaguar terminal
enables industrial customers to integrate
weighing directly into a plant’s process
control system or nerve center. In fact,
METTLER TOLEDO was the first weighing
instruments company to utilize a PC as
an industrial terminal. With the recent
additions of a touch screen, Pentium
processor and radio communication link,
the product continues to be the leading-
edge terminal on the market today.
Similarly, our technology has
allowed customers who package goods
to utilize one system for controlling both
metal contamination and the filling
weight of each package on their lines.
With the acquisition of Safeline, the
world’s leading supplier of metal
detection systems, METTLER TOLEDO
assists these customers in effectively
ensuring the quality and safety of
products, as well as the accuracy
of filling operations, in food processing,
pharmaceutical, cosmetics and other
industries.
In another example of innovation,
we created a sophisticated solution to
help our large shipping customers deal
T e c h n o l o g y
through our R&D capabilities, we
routinely help customers ensure product
quality, manage information and
improve productivity. Specific solutions
include aiding large food retailers in
efficiently managing perishable goods,
assisting industrial customers in
integrating weighing into process
control systems, and making it easier
for companies to control the quality
and accuracy of packaging operations.
C r e a t i n g
anufactured using a unique
electromagnetic discharge technique,
MonoBloc reflects innovations in cell
mechanics, electronics, software and
optronics.
For customers, our MonoBloc
weighing sensor provides greater relia-
bility and reproducibility of results, as
well as lower service and maintenance
costs. It also significantly reduces
manufacturing costs and the time and
expense of design changes. Today
more than 60 percent of METTLER
TOLEDO’s weighing products, including
all precision balances, incorporate the
technology.
CUSTOMER-FOCUSED SOLUTIONS
Our technology is aimed at solving spe-
cific customer challenges. Our greatest
value often lies in our ability to combine
our instruments and integrate the result-
with trends toward larger but lighter
parcels, which had rendered weight
alone inadequate to calculate tariffs. Our
patented PILAR (Parallel Infrared Laser
Array) technology, when integrated with
our industrial scales, enables customers
to use the dual variables of weight and
volume to issue invoices and plan
capacities. As the most advanced solu-
tion for in-motion weighing/dimension-
ing applications, our system can handle
up to 1,700 parcels an hour, while
making available in seconds databases
for pricing, space optimization and
other decisions.
Our focus on providing solutions,
together with a strong and growing
pipeline of new products, promises
to keep METTLER TOLEDO at the
technological forefront of the industry.
1213
solutionsing data into processes which help
customers ensure product quality,
manage information
and optimize the
efficiency of their
operations.
For example, we
recently developed an
innovative solution for
American and European
super- and hypermarkets that were
struggling to efficiently manage their
perishable goods, often across multiple
stores, and improve their margins in
this very competitive
business. Our MIRA
counter scale and its
range of software
applications and net-
working capabilities
form the basis of in-
tegrated weighing and
data processing systems
which help these retailers
manage their perishable
PC-based Industrial Terminal
goods inventory, pricing, promotions
and more. The MIRA scale, which
also can be teamed with our weight/
price labelers and automatic wrapping
machines, represents the industry’s
premier technological solution for
store-wide and chain-wide perishable
goods management.
Extending our retail leadership, we
are in the process of introducing
the first personal computer-based
retail scale with open standards
for data management and
integration. Such standards
make it easy for customers
to connect, integrate and adapt
the product to their own local quality
management and production systems.
INDUSTRY INNOVATIONS
We also specialize in solutions for
industrial customers. In fact, many
of these customers come to us
to fulfill SAP requirements,
as we are one of only
five certified SAP
equipment suppliers
in the world, and the
only one in weighing
instruments.
Retail Counter Scale

G l o b a l P r e s e n c e
with operations in 37 countries,
METTLER TOLEDO’s leadership extends
to virtually all major markets around the
world. Our extensive network puts us
in a unique position to embrace large
customers and serve their needs for
high-quality products and services on
a worldwide basis. Our global approach
has proven a profitable strategy for
us as well as a beneficial one for our
customers.
R e a c h i n g
U N I Q U E N E T W O R K
We operate the only global manufactur-
ing and marketing network in the
weighing instruments industry, holding
a market share more than double that
of our nearest competitor. Our network
is comprised of distinct, but comple-
mentary, producing and marketing
organizations.
Producing organizations, located
throughout America, Europe and Asia,
are responsible for product develop-
ment, research and manufacturing.
These organizations have enabled us
to achieve economies of scale, maintain
technological and engineering leadership
and provide a uniform level of quality
throughout the Company.
Marketing organizations, located
in 37 countries, are responsible for all
aspects of sales and service. This gives
us the agility to provide timely, respon-
sive service and support to customers
and distributors around the world.
14

the world
our unique
global manufacturing and
marketing network extends
from Shanghai, China,
to Steinbach, Germany, to
Spartanburg, South Carolina.
In every corner of the world,
our aim is to delight our
customers — and help them
in turn satisfy their own customers.
15

d
G l o b a l P r e s e n c e
the worldR e a c h i n g
esigned to be close to customers,
each organization can adapt its
marketing and service efforts for different
cultural and economic conditions.
Yet, each organization delivers the same
high service standards to customers
everywhere, as all of our service
technicians receive training at a central
location.
A G L O B A L P A R T N E R
Our global infrastructure has helped us
become the trusted partner of customers
who seek to maintain manufacturing
and product standards on a worldwide
basis. For example, in the transportation
industry, DHL Worldwide Express is
utilizing our new automated dimension-
ing equipment to calculate freight costs
and plan capacities based on volume
and weight in facilities in some 15
countries. In 1996, METTLER TOLEDO
acquired the majority holding in
Norwegian-based Cargoscan, the
leader in scanning and dimensioning
systems, as part of our strategy to offer
comprehensive solutions to customers.
Customers also benefit from our
expertise in tailoring products and
applications on a global scale. A multi-
national food manufacturer, for
instance, turned to METTLER TOLEDO
to help develop standardized measuring
processes and methods for titration used
in its production facilities worldwide.
16
Our new memory card feature, in which
methods and standards are electronically
preprogrammed on chip cards easily
inserted into titrators, allows the
manufacturer to apply uniform testing
methods across multiple facilities.
We also provided this customer with
worldwide training and support as the
new methods were rolled out throughout
its organization.
In addition, our vast network
provides valuable support as customers
expand their own global presence.
Thanks to our leading market position
in China and our unique global service
capabilities, we were chosen the weigh-
ing supplier for METRO Cash & Carry,
a German wholesaler, when it entered
the Chinese market in 1997.
P O S I T I O N E D F O R G R O W T H
METTLER TOLEDO already has the
largest installed base of weighing
instruments in the world. And, largely
because of our established global
presence, we are poised for further
Dimensioning System

industry. These manufactur-
ing facilities, which com-
plement eight Asian sales
and service organizations,
are part of our efforts to
develop and manufac-
ture products in Asia
for Asia, as well as to
supply customers
throughout the world
in the most cost-
effective manner.
A recent
example of
our manufac-
turing capabili-
ties in China is the
new Tiger stand-
alone price-computing
counter scale. The Tiger
product line represents the first
such Chinese-designed and -manufac-
tured scales sold throughout the world.
With our broad and growing array
of quality products, our technological
expertise and our unique ability to reach
the world’s customers and markets,
METTLER TOLEDO is in an excellent
position to further strengthen its global
leadership in precision instruments.
significant growth in markets around the
world. Key drivers of this growth,
especially in developed countries,
include the need to automate processes
in both laboratories and production
facilities, the need for integrated technol-
ogy solutions, and the standardization
of quality manufacturing and lab prac-
tices on a global basis.
Emerging markets also provide us
with dynamic growth opportunities,
including helping local companies com-
ply with international quality require-
ments and upgrade from mechanical
to electronic scales. To realize such
opportunities, we have invested in new
sales and service operations in growing
markets of Latin America, Eastern
Europe and Asia.
Despite recent economic turmoil,
Asia offers us great potential for long-
term growth. In 1997, we constructed
a wholly owned facility in Shanghai for
the production of laboratory balances,
analytical instruments and weighing
systems. At the same time, we celebrat-
ed the10th anniversary of our industrial
and retail scale manufacturing joint
venture in Changzhou, which was
China’s first foreign joint venture in the
mETTLER TOLEDO is the only
company in the weighing instruments
industry to provide products for lab,
industry and food retailing applica-
tions throughout the world. Our
extensive presence enables us to
serve global customers with multiple
weighing needs and to assist them
in maintaining uniform manufacturing
and product standards throughout
their diverse operations.
17
Chinese-manufacturedRetail Scale
Memory CardTitrator

18
Mettler-Toledo International Inc.
Management’s Discussion and Analysis of Financial Condition and Results of Operations
The following discussion and analysis of the Company’s financial condi-tion and results of operations should be read in conjunction with the con-solidated financial statements included herein.
GENERAL
The financial statements for periods ended prior to October 15, 1996 reflect the combined operations of the Mettler-Toledo Group, while thefinancial statements for periods after October 15, 1996 reflect the consoli-dated operations of the Company after accounting for the Acquisitionusing the purchase method of accounting. See Note 1 to the consolidatedfinancial statements included herein. Operating results subsequent to theAcquisition and the Safeline Acquisition are not comparable in manyrespects to the operating results prior to the Acquisition and the SafelineAcquisition. Financial information is presented in accordance with gener-ally accepted accounting principles in the United States of America.
The Company operates a global business, with net sales that are diversifiedby geographic region, product range and customer. The Company believesthat it has achieved its market leadership positions through its continuedinvestment in product development, the maintenance and, in someinstances, expansion of its existing position in established markets and itspursuit of new markets. Net sales in local currency (adjusted for the exitin 1996 and 1995 from certain systems businesses) have increased in boththe laboratory and industrial and food retailing product lines, increasingby 11% in 1997 and by 3% and 6% in 1996 and 1995, respectively. Net sales in U.S. dollars increased by 3% in 1997, as the strengthening of theU.S. dollar versus the Company’s major trading currencies reduced U.S.dollar reported sales. Net sales in U.S. dollars were unchanged in 1996 andincreased by 11% in 1995. The Company’s growth in 1997 has benefitedfrom recent investments to establish distribution and manufacturinginfrastructure in certain emerging markets, particularly in Asia. Net salesin Asia and other emerging markets in local currency increased by 30% in1997 over the prior year, despite weakening economic conditions in theregion. The Company believes that its growth over the next several yearswill come primarily from (i) the needs of customers in developed marketsto continue to automate their research and development and manufactur-ing processes, (ii) the needs of customers in emerging markets to contin-ue modernizing these same processes through the use of increasinglysophisticated instruments and (iii) the pursuit of the Company’s acquisi-tion strategy.
During the periods presented, the Company increased its gross profit mar-gins before non-recurring acquisition costs from 40.3% in 1995 to 44.1%in 1997 and increased its Adjusted Operating Income (gross profit lessresearch and development and selling, general and administrative expenses) before amortization and non-recurring costs as a percentage ofnet sales from 4.6% in 1995 to 9.3% for 1997. These increases wereachieved despite the Company’s continued investments in product devel-opment and in its distribution and manufacturing infrastructure. TheCompany believes that a significant portion of these increases can beattributed to its strategy to reduce costs and reengineer its operations. This
strategy has a number of key elements, such as ongoing efforts to directmore of its research and development activities to the reduction of productcosts, to reengineer manufacturing, distribution, sales and administrativeprocesses, and to consolidate operations and redeploy resources to lowercost facilities. Examples of recent efforts to implement the different elements of this strategy include the introduction of several products in1997 with significantly reduced manufacturing costs compared to theirpredecessors, the closure of the Westerville, Ohio manufacturing facility in1996, completion of a targeted workforce reduction of approximately 170personnel, planned closure of three North American facilities as describedbelow and the opening of a new laboratory manufacturing facility inShanghai, China in 1997 with significant production and research anddevelopment capabilities. The Company is currently implementing severaladditional reengineering and cost reduction projects, including the con-solidation of worldwide precision balance manufacturing, the restruc-turing of its ordering process, product delivery and parts inventory man-agement in Europe, the realignment of industrial product manufactur-ing in Europe and the consolidation of the Company’s North Americanlaboratory, industrial and food retailing businesses into a single market-ing organization.
On May 30, 1997, the Company acquired Safeline for £61.0 million(approximately $100.0 million at May 30, 1997), plus up to an additional£6.0 million (approximately $10.0 million at May 30, 1997) for a contin-gent earn-out payment. In October 1997, the Company made an addi-tional payment, representing a post-closing adjustment, of £1.9 million(approximately $3.1 million at October 3, 1997). Such amount has beenaccounted for as additional purchase price. Safeline, based in Manchester,United Kingdom, is the world’s largest manufacturer and marketer ofmetal detection systems for companies that produce and package goods inthe food processing, pharmaceutical, cosmetics, chemicals and otherindustries. Safeline’s metal detectors can also be used in conjunction withthe Company’s checkweighing products for important quality and safetychecks in these industries. From 1992 to 1996, Safeline’s sales increased ata compounded annual growth rate of approximately 30%, in part due tothe introduction of new products such as the first digital electronic andZero Metal-Free Zone metal detectors. Safeline had net sales and Adjusted Operating Income of $40.4 million and $9.9 million, respectively, for theyear ended December 31, 1996. The Safeline Acquisition was financed by£47.3 million (approximately $77.4 million at May 30, 1997) loanedunder a credit agreement together with the issuance of £13.7 million(approximately $22.4 million at May 30, 1997) of seller loan notes whichmature May 30, 1999.
In the third and fourth quarters of 1997, the Company recorded restruc-turing charges totaling approximately $6.3 million. These charges are inconnection with the closure of three facilities in North America and arecomprised primarily of severance and other related benefits and costs ofexiting facilities, including lease termination costs and write-down ofexisting assets to their expected net realizable value. The Company expectsthese actions will be substantially completed in 1998 and that the two

Mettler-Toledo International Inc.
owned facilities will be sold after that period. In connection with the clo-sure of these facilities, the Company expects to involuntarily terminateapproximately 70 employees. The Company is undertaking these actionsas part of its efforts to reduce costs through reengineering. When com-plete, these actions will enable the Company to close certain operationsand realize cost savings estimated at approximately $2.5 million on anannual basis. The Company also estimates that it will receive, after 1998,upon the sale of the two facilities which the Company owns proceeds inexcess of $5.0 million. The Company believes that the fair market value ofthese facilities approximates their respective book values.
During the fourth quarter of 1997, the Company completed its initial pub-lic offering of 7,666,667 shares of common stock, including the under-writers’ over-allotment option, (the “Offering”) at a per share price equalto $14.00. The Offering raised net proceeds, after underwriters’ commis-sion and expenses, of approximately $97.3 million. In connection withthe Offering, the Company effected a merger by and between it and itsdirect wholly owned subsidiary, Mettler-Toledo Holding Inc., whereby Mettler-Toledo Holding Inc. was merged with and into the Company (the“Merger”). In connection with the Merger, all classes of the Company’sprevious outstanding common stock were converted into 30,669,348shares of a single class of common stock. Concurrently with the Offering,the Company entered into a bank credit agreement (the “Credit Agree-ment”) borrowings from which, along with the proceeds from the Offer-ing, were used to repay substantially all of the Company’s then existingdebt (collectively, the “Refinancing”). In connection with the Refinanc-ing, the Company recorded an extraordinary charge of $31.6 million, net
of tax, principally for prepayment premiums on certain debt repaid andfor the write-off of existing deferred financing fees. The Company alsoincurred a non-recurring termination fee of $2.5 million in connectionwith the termination of its management consulting agreement with AEAInvestors Inc. (the “Termination Fee”).
RESULTS OF OPERATIONS
The following table sets forth certain items from the consolidated state-ments of operations for the year ended December 31, 1995, for the periodfrom January 1, 1996 to October 14, 1996, for the period from October 15,1996 to December 31, 1996, pro forma for the year 1996 and actual for theyear ended December 31, 1997. The pro forma 1996 information giveseffect to the Acquisition, the Safeline Acquisition, the Offering and theRefinancing as if such transactions had occurred on January 1, 1996, anddoes not purport to represent the Company’s actual results if such transac-tions had occurred on such date. The pro forma 1996 information reflectsthe historical results of operations of the Predecessor Business for the peri-od from January 1, 1996 to October 14, 1996 and the historical results ofoperations of the Company for the period from October 15, 1996 toDecember 31, 1996, together with certain pro forma adjustments asdescribed below. The consolidated statement of operations data for theyear ended December 31, 1997 includes Safeline results from May 31,1997. The pro forma 1996 information includes Safeline’s historicalresults of operations for all of 1996. The pro forma information is present-ed in order to facilitate management’s discussion and analysis.
19
Predecessor Business Mettler-Toledo International Inc.
For the period For the periodYear ended January 1, 1996 October 15, 1996 Pro forma Year ended
December 31, to October 14, to December 31, 1996 December 31,(In thousands) 1995 1996 1996(b)(c) (a)(b)(c)(d)(e) 1997(b)(c)Net sales $850,415 $662,221 $ 186,912 $889,567 $878,415
Cost of sales 508,089 395,239 136,820 523,783 493,480
Gross profit 342,326 266,982 50,092 365,784 384,935
Research and development 54,542 40,244 9,805 50,608 47,551
Selling, general and administrative 248,327 186,898 59,353 252,085 260,397
Amortization 2,765 2,151 1,065 6,526 6,222
Purchased research and development — — 114,070 — 29,959
Interest expense 18,219 13,868 8,738 30,007 35,924
Other charges (income), net(f) (9,331) (1,332) 17,137 14,036 10,834
Earnings (loss) before taxes, minority interest and extraordinary items $ 27,804 $ 25,153 $(160,076) $ 12,522 $ (5,952)
Adjusted Operating Income(g) $ 39,457 $ 39,840 $ 17,912 $ 63,091 $ 81,541
(a) In giving effect to the Acquisition, the Safeline Acquisition, the Offering and the Refinancing, the pro forma 1996 data includes certain adjustments to historical results to reflect:(i) an increase in interest expense resulting from acquisition-related borrowings, which expense has been partially offset by reduced borrowings following application of Offeringproceeds and a lower effective interest rate following the Refinancing including the repayment of the Company’s 9 3⁄4% Senior Subordinated Notes, (ii) an increase in amortiza-tion of goodwill and other intangible assets following the Acquisition and the Safeline Acquisition and (iii) changes to the provision for taxes to reflect the Company’s estimatedeffective income tax rate at a stated level of pro forma earnings before tax for the year ended December 31, 1996.
(b) In connection with the Acquisition and the Safeline Acquisition, the Company allocated $32,194 and $2,054, respectively, of the purchase prices to revalue certain inventories(principally work-in-progress and finished goods) to fair value (net realizable value). Substantially all such inventories revalued in connection with the Acquisition were soldduring the period October 15, 1996 to December 31, 1996, and substantially all such inventories revalued in connection with the Safeline Acquisition were sold in the secondquarter of 1997. The expense related to inventory revalued in connection with the Acquisition has been excluded from the 1996 pro forma information.
(Footnotes continued on next page)

(c) In conjunction with the Acquisition and the Safeline Acquisition, the Companyallocated, based upon independent valuations, $114,070 and $29,959, respec-tively, of the purchase prices to purchased research and development in process.These amounts were expensed immediately following the Acquisition and theSafeline Acquisition, respectively. The amounts related to the Acquisition and havebeen excluded from the 1996 pro forma information.
(d) Certain one-time charges incurred during 1996 have not been excluded from the1996 pro forma information. These charges consist of certain non-recurringitems for (i) advisory fees associated with the reorganization of the Company’sstructure of approximately $4,800 and (ii) restructuring charges of approximately$12,600.
(e) Selling, general and administrative expense has been adjusted to eliminate theAEA Investors annual management fee of $1,000, payment of which was discontinued upon consummation of the Offering.
( f ) Other charges (income), net generally includes interest income, foreign currencytransactions (gains) losses, (gains) losses from sales of assets and othercharges (income). For the period January 1,1996 to October 14,1996, theamount shown includes employee severance and other exit costs associatedwith the closing of its Westerville, Ohio facility. For the period October 15,1996to December 31,1996, the amount shown includes employee severance benefitsassociated with the Company’s general headcount reduction programs in Europeand North America and the realignment of the analytical and precision balancebusiness in Switzerland. For the year ended December 31,1997, the amountshown includes a restructuring charge of $6,300 to close three facilities in NorthAmerica. See Note 14 to the consolidated financial statements included herein.
(g) Adjusted Operating Income is operating income (gross profit less research anddevelopment and selling, general and administrative expenses) before amortiza-tion and non-recurring costs. Non-recurring costs which have been excluded arethose costs associated with selling inventories revalued to fair value in connec-tion with the Acquisition and the Safeline Acquisition, fees associated with the termination of the Company’s management consulting agreement with AEAInvestors at the time of the Offering of $2,500 in 1997 and advisory fees associated with the reorganization of the Company’s structure of approximately$4,800 in 1996.
Year Ended December 31, 1997 Compared to Pro Forma Year Ended December 31, 1996
Net sales were $878.4 million for 1997, compared to pro forma 1996 netsales of $889.6 million. As previously described, pro forma 1996 includes afull year of Safeline’s operating results, while 1997 only includes the oper-ating results of Safeline from May 31,1997. Net sales in local currencyduring the year increased 11% (excluding Safeline results from pro forma1996) and 7% (excluding Safeline results from both pro forma 1996 andactual 1997).
Net sales in local currency in 1997 in Europe increased 6% as compared tonet sales in local currency in pro forma 1996 (excluding Safeline resultsfrom pro forma 1996). Net sales in local currency during 1997 in theAmericas increased 11%, principally due to improved market conditionsfor sales to industrial and food retailing customers. Net sales in local cur-rency in 1997 in Asia and other markets increased 30%, primarily as aresult of the establishment of additional direct marketing and distributionin the region. During the six months ended December 31, 1997, salestrends in Europe were more favorable compared to sales trends in the firsttwo quarters of 1997. Overall, the Company’s business in Asia and othermarkets has remained solid. However, growth in net sales in SoutheastAsia and Korea (which collectively represent approximately 3% of theCompany’s total net sales for 1997) has slowed, and the Company antici-
pates that overall net sales growth in Asia will slow in 1998 and marginswill be reduced. The Company believes Asia and other emerging marketswill continue to provide opportunities for growth in the long term basedupon the movement toward international quality standards, the need toupgrade mechanical scales to electronic versions and the establishment oflocal production facilities by the Company’s multinational client base.
The operating results for Safeline (which as previously noted were includ-ed in the Company’s results from May 31, 1997) had the effect of increas-ing the Company’s net sales by $28.5 million for 1997. Additionally, Safe-line’s operating results had the effect of increasing the Company’s Adjust-ed Operating Income by $7.1 million for the same period. The Companyrecorded non-cash purchase accounting adjustments for purchasedresearch and development ($30.0 million) and the sale of inventoriesrevalued to fair value ($2.1 million) during such period.
Gross profit before non-recurring acquisition costs as a percentage of netsales increased to 44.1% for 1997, compared to 41.1% for pro forma 1996.Gross profit in 1997 includes the previously noted $2.1 million non-cashcharge associated with the excess of the fair value over the historic valueof inventory acquired in the Safeline Acquisition. The improved gross profit percentage reflects the benefits of reduced product costs arising fromthe Company’s research and development efforts, ongoing productivityimprovements and the depreciation of the Swiss franc against the Compa-ny’s other principal trading currencies.
Research and development expenses as a percentage of net sales decreasedto 5.4% for 1997, compared to 5.7% for pro forma 1996; however, the localcurrency spending level remained relatively constant period to period.
Selling, general and administrative expenses as a percentage of net salesincreased to 29.6% for 1997, compared to 28.3% for pro forma 1996. Thisincrease is primarily a result of establishing additional direct marketingand distribution in Asia.
Adjusted Operating Income was $81.5 million, or 9.3% of net sales in 1997, compared to $63.1 million, or 7.1% of net sales in pro forma 1996, anincrease of 29.2% (40.0% excluding Safeline results from both pro forma1996 and actual 1997). The 1997 period excludes non-recurring costs of$2.1 million for the revaluation of inventories to fair value in connectionwith the Safeline Acquisition and $2.5 million for the Termination Fee.
As previously noted, in connection with the Safeline Acquisition, $30.0 million of the purchase price was attributed to purchased researchand development in process. Such amount was expensed immediately fol-lowing the Safeline Acquisition. The technological feasibility of the prod-ucts being developed had not been established as of the date of the Safe-line Acquisition. The Company expects that the projects underlying theseresearch and development efforts will be substantially complete over thenext two years.
Interest expense was $35.9 million for 1997, compared to $30.0 millionfor pro forma 1996. The difference is principally due to the fact that thepro forma 1996 information reflects a full year of the benefits of reducedborrowing costs in connection with the Company’s Offering and Refinanc-ing which occurred in November 1997.
20
Mettler-Toledo International Inc.

Mettler-Toledo International Inc.
21
Other charges, net of $10.8 million for 1997 includes restructuring relatedcharges of approximately $6.3 million and other charges of approximately$3.5 million relating to (i) certain derivative financial instrumentsacquired in 1996 and closed in 1997 and (ii) foreign currency exchangelosses resulting from certain unhedged bank debt denominated in foreigncurrencies (such derivative financial instruments and such unhedgedbank debt are no longer held pursuant to current Company policy). Thedecrease compared to other charges, net of $14.0 million for pro forma1996 is principally a result of lower restructuring related charges in 1997compared to pro forma 1996 ($6.3 million versus $12.6 million).
The significant increase in the Company’s effective tax rate in 1997 wasprimarily attributable to the nondeductibility of goodwill and purchasedresearch and development charges incurred in connection with the Safe-line Acquisition.
Net earnings before non-recurring items were $19.1 million in 1997. Suchnon-recurring items in 1997 include the previously mentioned charges for purchased research and development, the revaluation of inventories tofair value, the Termination Fee, the restructuring of North American oper-ations and losses relating to derivative financial instruments andunhedged bank debt denominated in foreign currencies. Including thesecharges of $43.0 million after taxes, the net loss before extraordinaryitems was $23.9 million for 1997, compared to net earnings of $5.0 mil-lion for pro forma 1996.
The extraordinary loss of $41.2 million in 1997 represents charges for theearly repayment premium on the Senior Subordinated Notes and thewrite-off of capitalized debt issuance fees associated with the SeniorSubordinated Notes and previous credit facilities. See “Liquidity and Capital Resources.”
For the Period From January 1, 1996 to October 14, 1996,the Period From October 15, 1996 to December 31, 1996and Pro Forma 1996 Compared to Year Ended December 31, 1995
Net sales for the period from January 1, 1996 to October 14, 1996 and forthe period from October 15, 1996 to December 31, 1996 were $662.2 mil-lion and $186.9 million, respectively. Pro forma 1996 net sales were$889.6 million, or $849.1 million excluding Safeline results, compared toactual net sales of $850.4 million in 1995. Net sales (pro forma excludingSafeline) in local currency increased 3%, excluding the impact of reduc-tions of the systems business, but were offset by a strengthening of the U.S.dollar, the Company’s reporting currency, relative to the local currencies ofthe Company’s operations. The flat sales (pro forma excluding Safeline)in 1996 compared to actual 1995 resulted from slightly lower sales fromproducts in the industrial and food retailing markets, offset by strong per-formance by the product lines in the laboratory market. The growth in the
laboratory market was across substantially all product lines and geo-graphical regions as sales in local currency (excluding Safeline) increased7% compared to the previous year. In particular, new product introduc-tions in titration, thermal and reaction calorimetry as well as new Ohausproducts for the education, laboratory and light industrial market helpedto increase laboratory market sales. The slight decline in industrial andfood retailing sales resulted from overall weakness in the European market where the Company has been able to retain its market share. Thismarket weakness has persisted in early 1997.
Net sales (pro forma excluding Safeline) in Europe in local currencydecreased 2% in 1996 compared to actual 1995 due to a weaker secondhalf of the year in 1996 in all major markets, and especially in key coun-tries such as Germany, France and the United Kingdom. Net sales (proforma excluding Safeline) in the Americas in local currency increased by5% over actual 1995 due to growth in the United States and Latin Americaand double digit expansion in laboratory measurement instruments otherthan balances and in related service. Net sales (pro forma excluding Safe-line) in Asia and other markets in local currency increased by 8% overactual 1995, primarily as a result of significantly increased sales in theShanghai operation and strong sales in Japan and Australia.
Gross profit for the period from January 1, 1996 to October 14, 1996 andfor the period from October 15, 1996 to December 31, 1996 was $267.0 million and $50.1 million, respectively. Pro forma 1996 gross profit was $365.8 million or $349.3 million (excluding Safeline results). Thiscompares to $342.3 million in actual 1995. Pro forma gross profit as apercentage of sales increased to 41.1% in 1996 from 40.3% in actual 1995.The increased gross profit margin resulted principally from operationalimprovements and the depreciation of the Swiss franc against the Compa-ny’s other principal trading currencies. See “Effect of Currency on Resultsof Operations.”
Selling, general and administrative expenses and research and develop-ment expenses for the period from January 1, 1996 to October 14, 1996and for the period from October 15, 1996 to December 31, 1996 were$227.1 million and $69.2 million, respectively. Pro forma 1996 selling,general and administrative and research and development expensestotaled $302.7 million or $296.1 million excluding Safeline. This com-pares to $302.9 million in actual 1995. Pro forma selling, general andadministrative expenses and research and development expenses as a percentage of net sales decreased to an aggregate of 34.0% in 1996 from35.6% in actual 1995. The cost decreases resulted primarily from the currency effect of the depreciation of the Swiss franc against the Com-pany’s other major trading currencies and the Company’s cost controlefforts. These cost decreases were partially offset by non-recurring legaland advisory fees of $4.8 million.

22
Mettler-Toledo International Inc.
In connection with the Acquisition, the Company allocated, based uponindependent valuations, $114.1 million of the purchase price to pur-chased research and development in process. Such amount was expensedimmediately following the Acquisition.
Interest expense for the period from January 1, 1996 to October 14, 1996and for the period from October 15, 1996 to December 31, 1996 was $13.9 million and $8.7 million, respectively. Pro forma interest expenseincreased to $30.0 million in 1996 from $18.2 million in actual 1995,principally due to a higher debt level as a result of the Acquisition and theSafeline Acquisition. Interest expense since the Acquisition and the Safeline Acquisition is materially different. See “Liquidity and CapitalResources.”
Other income, net for the period January 1, 1996 to October 14, 1996 of$1.3 million includes interest income of $3.4 million and severance andother exit costs of $1.9 million associated with the closing of its Wester-ville, Ohio facility. Other charges, net for the period October 15, 1996 toDecember 31, 1996 of $17.1 million principally represent (i) losses on for-eign currency transactions of $8.3 million of which $5.7 million wereincurred in connection with the Acquisition, (ii) employee severance ben-efits associated with the Company’s general headcount reduction pro-grams in Europe and North America of $4.6 million which wereannounced during such period, and (iii) the realignment of the analyticaland precision balance business in Switzerland of $6.2 million which wasinternally announced in December 1996. In connection with such programs, the Company reduced its workforce by approximately 170employees in 1996 and intends to further reduce its workforce by approxi-mately 70 employees in 1997. The Company anticipates that as a result of the foregoing it will achieve cost savings in the range of $8.3 million.Such cost savings consist primarily of lower employee salary and bene-fit costs and fixed manufacturing costs. In addition, at the time of theAcquisition, the Company estimated it would incur additional selling,general and administrative expenses of $1.3 million annually as a resultof the Acquisition.
Earnings before taxes and minority interest for the period from January 1,1996 to October 14, 1996 were $25.2 million. Loss before taxes and minor-ity interest for the period from October 15, 1996 to December 31, 1996 was$160.1 million. This loss includes non-recurring costs of $114.1 millionfor the allocation of purchase price to in-process research and develop-ment projects, $32.2 million for the revaluation of inventories to fairvalue, $9.9 million of other charges (an additional $1.9 million of othercharges was incurred by the Predecessor Business in 1996) and $4.8 mil-lion for non-recurring legal and advisory fees. Pro forma earnings beforetaxes and minority interest would have been $12.5 million in 1996. Proforma Adjusted Operating Income would have been $67.9 million in1996, or $58.0 million (excluding Safeline), compared to $39.5 million inactual 1995.
Net earnings for the period from January 1, 1996 to October 14, 1996 were$14.5 million. The net loss for the period from October 15, 1996 to Decem-ber 31, 1996 was $159.0 million. Pro forma net earnings of $5.0 millionin 1996 compared to net earnings of $18.3 million in actual 1995.
LIQUIDITY AND CAPITAL RESOURCES
In November 1997, the Company refinanced its previous credit agreementand purchased all of its 93 ⁄4% Senior Subordinated Notes due 2006 (the“Notes”) pursuant to a tender offer with proceeds from the Offering andadditional borrowings under the Credit Agreement. The Notes were origi-nally issued in October 1996 at the time of the Acquisition.
The Credit Agreement provides for term loan borrowings in aggregateprincipal amounts of $101.6 million, SFr 85.5 million (approximately$59.0 million at December 31, 1997) and £21.7 million (approximately$36.2 million at December 31, 1997) that are scheduled to mature in 2004,a Canadian revolver with availability of CDN $26.3 million (approximatelyCDN $19.0 million of which was drawn as of December 31, 1997) which is scheduled to mature in 2004, and a multi-currency revolving creditfacility with availability of $400.0 million (approximately $220.0 millionwas available at December 31, 1997) which is also scheduled to mature in2004. The Company had borrowings of $357.6 million under the CreditAgreement and $39.2 million under various other arrangements as ofDecember 31, 1997. Under the Credit Agreement, amounts outstandingunder the term loans amortize in quarterly installments. In addition, theCredit Agreement obligates the Company to make mandatory prepay-ments in certain circumstances with the proceeds of asset sales or issuanceof capital stock or indebtedness and with certain excess cash flow. TheCredit Agreement imposes certain restrictions on the Company and itssubsidiaries, including restrictions on the ability to incur indebtedness,make investments, grant liens, sell financial assets and engage in certainother activities. The Company must also comply with certain financialcovenants. The Credit Agreement is secured by certain assets of the Com-pany. The Credit Agreement imposes certain restrictions on the Company’sability to pay dividends to its shareholders.
In connection with the Refinancing, the Company recorded an extraordi-nary charge amounting to $31.6 million, principally for prepayment pre-miums on its Notes and the write-off of capitalized debt issuance fees. Inaddition, with the May 29, 1997 refinancing of its previous credit facility,the Company recorded an extraordinary charge of $9.6 million, represent-ing a charge for the write-off of capitalized debt issuance fees and relatedexpenses associated with the previous credit facility.
At December 31, 1997, approximately $102.0 million of the borrowingsunder the Credit Agreement were denominated in U.S. dollars. The bal-ance of the borrowings under the Credit Agreement and under local work-ing capital facilities were also denominated in certain of the Company’sother principal trading currencies amounting to approximately $295.0 million at December 31, 1997. Changes in exchange rates betweenthe currencies in which the Company generates cash flow and the curren-cies in which its borrowings are denominated will affect the Company’sliquidity. In addition, because the Company borrows in a variety of cur-rencies, its debt balances will fluctuate due to changes in exchange rates.See “Effect of Currency on Results of Operations.”

Mettler-Toledo International Inc.
The Acquisition was financed principally through capital contributions of$190.0 million before related expenses from the Company, borrowingsunder a previous credit agreement of $307.0 million and $135.0 millionfrom the issuance of the Notes. The Safeline Acquisition was financed by£47.3 million ($77.4 million at May 30, 1997) loaned under the Com-pany’s previous credit agreement together with the issuance of £13.7 million ($22.4 million at May 30, 1997) of seller loan notes whichmature May 30, 1999.
Prior to the Acquisition, the Company’s cash and other liquidity was usedprincipally to fund capital expenditures, working capital requirements,debt service and dividends to Ciba. Following the Acquisition and the Safe-line Acquisition, the annual interest expense associated with increasedborrowings, as well as scheduled principal payments of term loans underthe Credit Agreement, have significantly increased the Company’s liquidityrequirements.
The Company’s capital expenditures totaled $25.9 million in 1995, $29.4 million in pro forma 1996 and $22.3 million in actual 1997. Capi-tal expenditures are primarily for machinery, equipment and the purchaseand expansion of facilities, including the purchase of land for, and con-struction of, the Company’s Shanghai manufacturing facility. Capitalexpenditures for 1998 are expected to increase over 1997 levels, but shouldremain consistent with earlier periods. In connection with the transfer ofthe Japanese laboratory business from a former agent to a subsidiary ofthe Company, the Company agreed to make total payments of approxi-mately SFr 8.0 million of which only approximately SFr 1.0 millionremains to be paid.
The Company’s cash provided by operating activities was $55.6 million in1997 as compared to $62.5 million for the period January 1, 1996 to Octo-ber 14, 1996 and $9.6 million for the period October 15, 1996 to December31, 1996. The 1997 results include higher interest costs resulting from theAcquisition and the Safeline Acquisition.
At December 31, 1997, consolidated debt, net of cash, was $373.2 million.
The Company continues to explore potential acquisitions to expand itsproduct portfolio and improve its distribution capabilities. In connectionwith any acquisition, the Company may incur additional indebtedness.
The Company currently believes that cash flow from operating activities,together with borrowings available under the Credit Agreement and localworking capital facilities, will be sufficient to fund currently anticipatedworking capital needs and capital spending requirements as well as debtservice requirements for at least several years, but there can be no assur-ance that this will be the case.
Effect of Currency on Results of Operations
The Company’s operations are conducted by subsidiaries in many coun-tries, and the results of operations and the financial position of each ofthose subsidiaries are reported in the relevant foreign currency and thentranslated into U.S. dollars at the applicable foreign exchange rate for
inclusion in the Company’s consolidated financial statements. Accord-ingly, the results of operations of such subsidiaries as reported in U.S. dol-lars can vary as a result of changes in currency exchange rates. Specifical-ly, a strengthening of the U.S. dollar versus other currencies reduces netsales and earnings as translated into U.S. dollars, whereas a weakening ofthe U.S. dollar has the opposite effect.
Swiss franc-denominated costs represent a much greater percentage of theCompany’s total expenses than Swiss franc-denominated sales represent oftotal sales. In general, an appreciation of the Swiss franc versus the Com-pany’s other major trading currencies, especially the principal Europeancurrencies, has a negative impact on the Company’s results of operationsand a depreciation of the Swiss franc versus the Company’s other majortrading currencies, especially the principal European currencies, has apositive impact on the Company’s results of operations. The effect of thesechanges generally offsets in part the translation effect on earnings beforeinterest and taxes of changes in exchange rates between the U.S. dollarand other currencies described in the preceding paragraph.
Taxes
The Company is subject to taxation in many jurisdictions throughout theworld. The Company’s effective tax rate and tax liability will be affected bya number of factors, such as the amount of taxable income in particularjurisdictions, the tax rates in such jurisdictions, tax treaties between juris-dictions, the extent to which the Company transfers funds between juris-dictions and income is repatriated, and future changes in law. Generally,the tax liability for each legal entity is determined either (i) on a non-consolidated/combined basis or (ii) on a consolidated/combined basisonly with other eligible entities subject to tax in the same jurisdiction, ineither case without regard to the taxable losses of non-consolidated/com-bined affiliated entities. As a result, the Company may pay income taxes tocertain jurisdictions even though the Company on an overall basis incursa net loss for the period.
Environmental Matters
The Company is subject to various environmental laws and regulations inthe jurisdictions in which it operates. The Company, like many of its com-petitors, has incurred, and will continue to incur, capital and operatingexpenditures and other costs in complying with such laws and regulationsin both the United States and abroad. The Company does not currentlyanticipate any material capital expenditures for environmental controltechnology. Some risk of environmental liability is inherent in the Com-pany’s business, and there can be no assurance that material environ-mental costs will not arise in the future. However, the Company does notanticipate any material adverse effect on its results of operations or finan-cial condition as a result of future costs of environmental compliance.
23
24
Mettler-Toledo International Inc.
Inflation
Inflation can affect the costs of goods and services used by the Company.The competitive environment in which the Company operates limitssomewhat the Company’s ability to recover higher costs through increasedselling prices. Moreover, there may be differences in inflation ratesbetween countries in which the Company incurs the major portion of itscosts and other countries in which the Company sells its products, whichmay limit the Company’s ability to recover increased costs, if not offset byfuture increase of selling prices. The Company’s growth strategy includesexpansion in China, Latin America and Eastern Europe, which have expe-rienced inflationary conditions. To date, inflationary conditions have nothad a material effect on the Company’s operating results. However, as theCompany’s presence in China, Latin America and Eastern Europe increas-es, these inflationary conditions could have a greater impact on the Com-pany’s operating results.
Seasonality
The Company’s business has historically experienced a slight amount ofseasonal variation, with sales in the first fiscal quarter slightly lower than,and sales in the fourth fiscal quarter slightly higher than, sales in the sec-ond and third fiscal quarters. This trend has a somewhat greater effect onincome from operations than on net sales due to the effect of fixed costs.
Financial Instruments With Off-Balance Sheet Risks
Prior to 1997, the Company entered into currency forward and optioncontracts primarily as a hedge against anticipated foreign currency expo-sures and not for speculative purposes. Such contracts, which are types offinancial derivatives, limit the Company’s exposure to both favorable andunfavorable currency fluctuations. These contracts are adjusted to reflectmarket values as of each balance sheet date, with the resulting unrealizedgains and losses being recognized in financial income or expense, asappropriate. At December 31, 1997, all remaining derivative instrumentsmet the requirements of hedge accounting.
During 1997, the Company has entered into certain interest rate swap andcap agreements. See Note 5 to the consolidated financial statementsincluded herein.
New Accounting Standards
In June 1997, the Financial Accounting Standards Board issued Statementof Financial Accounting Standards No. 130, “Reporting ComprehensiveIncome”(“SFAS 130”). SFAS 130 becomes effective for fiscal years begin-ning after December 15, 1997 and requires reclassification of earlierfinancial statements for comparison purposes. SFAS 130 requires thatchanges in the amounts of certain items, including foreign currencytranslation adjustments and gains and losses on certain securities, be
shown in the financial statements. SFAS 130 does not require a specificformat for the financial statement in which comprehensive income isreported, but does require that an amount representing total comprehen-sive income be reported in that statement. Management has not yet deter-mined the effect of the adoption of SFAS 130.
Also in June 1997, the Financial Accounting Standards Board issued State-ment of Financial Accounting Standards No. 131, “Disclosures about Seg-ments of an Enterprise and Related Information” (“SFAS 131”). ThisStatement will change the way public companies report informationabout segments of their business in annual financial statements andrequires them to report selected financial information in their quarterlyreports issued to shareholders. It also requires entity-wide disclosuresabout products and services an entity provides, the material countries inwhich it holds assets and reports revenues, and its major customers. TheStatement is effective for fiscal years beginning after December 15, 1997.Management has not determined the effect of the adoption of SFAS 131.
Forward-Looking Statements and Associated Risks
This annual report includes forward-looking statements that reflect theCompany’s current views with respect to future events and financial per-formance, including capital expenditures, planned product introductions,research and development expenditures, potential future growth, includ-ing potential penetration of developed markets and potential growthopportunities in emerging markets, potential future acquisitions, potentialcost savings from planned employee reductions and restructuring pro-grams, estimated proceeds from and timing of asset sales, planned opera-tional changes and research and development efforts, strategic plans andfuture cash sources and requirements. The words “believe,” “expect,”“anticipate” and similar expressions identify forward-looking statements.Readers are cautioned not to place undue reliance on these forward-look-ing statements, which speak only as of their dates. The Company under-takes no obligation to publicly update or revise any forward-looking state-ments, whether as a result of new information, future events or otherwise.These forward-looking statements are subject to a number of risks anduncertainties, including the risk of substantial indebtedness on operationsand liquidity, risks associated with currency fluctuations, risks associatedwith international operations, highly competitive markets and technolog-ical developments, risks relating to downturns or consolidation affectingthe Company’s customers, risks relating to future acquisitions, risks asso-ciated with reliance on key management, uncertainties associated withenvironmental matters, risks relating to restrictions on payment of divi-dends and risks relating to certain anti-takeover provisions, which couldcause actual results to differ materially from historical results or thoseanticipated. For a discussion of these risks and uncertainties, see Exhibit99.1, Factors Affecting Future Operating Results, included as part of theCompany’s Annual Report on Form 10-K filed with the Securities andExchange Commission.

Mettler-Toledo International Inc.
We have audited the accompanying consolidated balance sheets of Mettler-Toledo International Inc. (formerly “MT Investors Inc.”) and sub-sidiaries (as defined in Note 1 to the consolidated financial statements) asof December 31, 1996 and 1997, and the related consolidated statementsof operations, net assets/shareholders’ equity and cash flows for the yearended December 31, 1995 and for the period January 1, 1996 to October14, 1996, the Predecessor periods, and for the period October 15, 1996 toDecember 31, 1996, and for the year ended December 31, 1997, the Suc-cessor periods. These consolidated financial statements are the responsi-bility of the Company’s management. Our responsibility is to express anopinion on these consolidated financial statements based on our audits.
We conducted our audits in accordance with generally accepted auditingstandards in the United States of America. Those standards require that weplan and perform the audit to obtain reasonable assurance about whetherthe financial statements are free of material misstatement. An auditincludes examining, on a test basis, evidence supporting the amounts anddisclosures in the financial statements. An audit also includes assessingthe accounting principles used and significant estimates made by man-agement, as well as evaluating the overall financial statement presenta-tion. We believe that our audits provide a reasonable basis for our opinion.
In our opinion, the consolidated financial statements referred to abovepresent fairly, in all material respects, the consolidated financial positionof Mettler-Toledo International Inc. and subsidiaries as of December 31,1996 and 1997, and the consolidated results of their operations and theircash flows for the year ended December 31, 1995 and for the period Janu-ary 1, 1996 to October 14, 1996, the Predecessor periods, and for the periodOctober 15, 1996 to December 31, 1996, and for the year ended December31, 1997, the Successor periods, in conformity with generally acceptedaccounting principles in the United States of America.
As more fully described in Note 1 to the consolidated financial statements,Mettler-Toledo International Inc. acquired the Mettler-Toledo Group as ofOctober 15, 1996 in a business combination accounted for as a purchase.As a result of the acquisition, the consolidated financial statements for theSuccessor periods are presented on a different basis of accounting thanthat of the Predecessor periods, and therefore are not directly comparable.
KPMG Fides Peat
Zurich, Switzerland
February 6, 1998
25
Independent Auditors’ Report
The Board of Directors and ShareholdersMettler-Toledo International Inc.

26
Mettler-Toledo International Inc.
Consolidated Balance Sheets
Successor
December 31, December 31,(In thousands, except per share data) 1996 1997
ASSETS
Current assets:Cash and cash equivalents $ 60,696 $ 23,566Trade accounts receivable, less allowances of $8,388 in 1996 and $7,669 in 1997 151,161 153,619Inventories 102,526 101,047Deferred taxes 7,565 7,584Other current assets and prepaid expenses 17,268 24,066
Total current assets 339,216 309,882Property, plant and equipment, net 255,292 235,262Excess of cost over net assets acquired, net of accumulated amortization
of $982 in 1996 and $6,427 in 1997 135,490 183,318Non-current deferred taxes 3,916 5,045Other assets 37,974 15,806
Total assets $771,888 $749,313
LIABILITIES AND SHAREHOLDERS’ EQUITY
Current liabilities:Trade accounts payable $ 32,797 $ 39,342Accrued and other liabilities 79,857 80,844Accrued compensation and related items 35,457 43,214Taxes payable 17,580 33,267Deferred taxes 9,132 10,486Short-term borrowings and current maturities of long-term debt 80,446 56,430
Total current liabilities 255,269 263,583Long-term debt 373,758 340,334Non-current deferred taxes 30,467 25,437Other non-current liabilities 96,810 91,011
Total liabilities 756,304 720,365Minority interest 3,158 3,549Shareholders’ equity:
Preferred stock, $0.01 par value per share; authorized 10,000,000 shares — —Common stock, $0.01 par value per share; authorized 125,000,000 shares;
issued 38,336,015 (excluding 64,467 shares held in treasury) at December 31,1997 — 383
Class A, B and C common stock, $0.01 par value per share; authorized 2,775,976 shares; issued 2,438,514 at December 31,1996 25 —
Additional paid-in capital 188,084 284,630Accumulated deficit (159,046) (224,152)Currency translation adjustment (16,637) (35,462)
Total shareholders’ equity 12,426 25,399Commitments and contingenciesTotal liabilities and shareholders’ equity $771,888 $749,313
See the accompanying notes to the consolidated financial statements

27
Mettler-Toledo International Inc.
Consolidated Statements of Operations
Predecessor Successor
For the period For the periodYear ended January 1,1996 October 15,1996 Year ended
December 31, to October 14, to December 31, December 31,(In thousands, except per share data) 1995 1996 1996 1997
Net sales $850,415 $662,221 $ 186,912 $ 878,415Cost of sales 508,089 395,239 136,820 493,480
Gross profit 342,326 266,982 50,092 384,935Research and development 54,542 40,244 9,805 47,551Selling, general and administrative 248,327 186,898 59,353 260,397Amortization 2,765 2,151 1,065 6,222Purchased research and development — — 114,070 29,959Interest expense 18,219 13,868 8,738 35,924Other charges (income), net (9,331) (1,332) 17,137 10,834
Earnings (loss) before taxes, minority interest and extraordinary items 27,804 25,153 (160,076) (5,952)
Provision for taxes 8,782 10,055 (938) 17,489Minority interest 768 637 (92) 468
Net earnings (loss) before extraordinary items 18,254 14,461 (159,046) (23,909)Extraordinary items-debt extinguishments, net of tax — — — (41,197)
Net earnings (loss) $ 18,254 $ 14,461 $(159,046) $ (65,106)
Basic and diluted loss per common share:Loss before extraordinary items $ (5.18) $ (0.76)Extraordinary items — (1.30)Net loss $ (5.18) $ (2.06)
Weighted average number of common shares 30,686,065 31,617,071
See the accompanying notes to the consolidated financial statements

28
Mettler-Toledo International Inc.
Predecessor
Year ended December 31,1995 and for the period January 1, 1996 to October 14,1996
CurrencyCapital Translation
(In thousands, except per share data) Employed Adjustment Total
Net assets at December 31,1994 $218,129 $ 10,065 $228,194Capital transactions with Ciba and affiliates (73,779) — (73,779)Net earnings 18,254 — 18,254Change in currency translation adjustment — 20,585 20,585Net assets at December 31,1995 162,604 30,650 193,254Capital transactions with Ciba and affiliates (88,404) — (88,404)Net earnings 14,461 — 14,461Change in currency translation adjustment — (6,538) (6,538)Net assets at October 14,1996 $ 88,661 $ 24,112 $112,773
Successor
For the period from October 15,1996 to December 31,1996 and for the year ended December 31,1997
Common Stock Additional CurrencyAll Classes Paid-in Accumulated Translation
(In thousands, except per share data) Shares Amount Capital Deficit Adjustment Total
Balance at October 15,1996 1,000 $ 1 $ — $ — $ — $ 1New issuance of Class A and C shares 2,437,514 24 188,084 — — 188,108Net loss — — — (159,046) — (159,046)Change in currency translation adjustment — — — — (16,637) (16,637)Balance at December 31,1996 2,438,514 25 188,084 (159,046) (16,637) 12,426New issuance of Class A and C shares 3,857 — 300 — — 300Purchase of Class A and C treasury stock (5,123) (1) (668) — — (669)Common stock conversion 28,232,100 282 (282) — — —Proceeds from stock offering 7,666,667 77 97,196 — — 97,273Net loss — — — (65,106) — (65,106)Change in currency translation adjustment — — — — (18,825) (18,825)Balance at December 31,1997 38,336,015 $383 $284,630 $(224,152) $(35,462) $ 25,399
See the accompanying notes to the consolidated financial statements
Consolidated Statements of Changes in Net Assets /Shareholders’ Equity

Mettler-Toledo International Inc.
29
Predecessor Successor
For the period For the periodYear ended January 1,1996 October 15,1996 Year ended
December 31, to October 14, to December 31, December 31,(In thousands) 1995 1996 1996 1997
Cash flows from operating activities:Net earnings (loss) $ 18,254 $ 14,461 $(159,046) $ (65,106)Adjustments to reconcile net earnings (loss) to net cash
provided by operating activities:Depreciation 30,598 19,512 7,925 25,613Amortization 2,765 2,151 1,065 6,222Write-off of purchased research and development and
cost of sales associated with revaluation of inventories — — 146,264 32,013Extraordinary items — — — 41,197Net loss (gain) on disposal of long-term assets (1,053) (768) — 33Deferred taxes and adjustments to goodwill (551) (1,934) (4,563) (4,244)Minority interest 768 637 (92) 468
Increase (decrease) in cash resulting from changes in:Trade accounts receivable, net (9,979) 9,569 (10,159) (8,113)Inventories (607) 1,276 3,350 (2,740)Other current assets (3,058) 14,748 (10,605) (7,177)Trade accounts payable 1,437 (3,065) 3,415 4,936Accruals and other liabilities, net 13,095 5,948 32,030 32,547
Net cash provided by operating activities 51,669 62,535 9,584 55,649Cash flows from investing activities:
Proceeds from sale of property, plant and equipment 4,000 1,606 736 15,913Purchase of property, plant and equipment (25,858) (16,649) (11,928) (22,251)Acquisition of Mettler-Toledo from Ciba — — (314,962) —Acquisition, net of seller financing — — — (80,469)Other investing activities (7,484) (1,632) 4,857 (9,184)
Net cash used in investing activities (29,342) (16,675) (321,297) (95,991)Cash flows from financing activities:
Proceeds from borrowings 3,983 — 414,170 614,245Repayments of borrowings — (13,464) — (703,201)Proceeds from issuance of common stock — — 188,108 97,573Purchase of treasury stock — — — (669)Ciba and affiliates borrowings (repayments) (15,693) (26,589) (184,666) —Capital transactions with Ciba and affiliates (37,361) (7,716) (80,687) —
Net cash provided by (used in) financing activities (49,071) (47,769) 336,925 7,948Effect of exchange rate changes on cash and cash equivalents 4,344 (3,394) (615) (4,736)Net increase (decrease) in cash and cash equivalents (22,400) (5,303) 24,597 (37,130)
Cash and cash equivalents:Beginning of period 63,802 41,402 36,099 60,696End of period $ 41,402 $ 36,099 $ 60,696 $ 23,566
Supplemental disclosures of cash flow information:Cash paid during the year for:
Interest $ 18,927 $ 6,524 $ 17,874 $ 38,345Taxes 9,970 9,385 2,470 6,140
Non-cash financing and investing activities:Due to Ciba for capital transactions 36,418 — — —Seller financing on acquisition — — — 22,514
See the accompanying notes to the consolidated financial statements
Consolidated Statements of Cash Flows

Mettler-Toledo International Inc. (“Mettler Toledo,” the “Company” or“Successor”), formerly MT Investors Inc., is a global supplier of precisioninstruments and is a manufacturer and marketer of weighing instrumentsfor use in laboratory, industrial and food retailing applications. The Company also manufactures and sells certain related analytical and measurement technologies. The Company’s manufacturing facilities arelocated in Switzerland, the United States, Germany, the United Kingdomand China. The Company’s principal executive offices are located inGreifensee, Switzerland.
The Company was incorporated by AEA Investors Inc. (“AEA”) and recap-italized to effect the acquisition (the “Acquisition”) of the Mettler-ToledoGroup (“Predecessor”) from Ciba-Geigy AG (“Ciba”) and its whollyowned subsidiary, AG für Präzisionsinstrumente (“AGP”) on October 15,1996. The Company acquired the Mettler-Toledo Group for cash consider-ation of SFr 504,996 (approximately $402,000) including dividends ofSFr 109,406 (approximately $87,100) which were paid to Ciba by theCompany in conjunction with the Acquisition. In addition, the Companyincurred expenses in connection with the Acquisition and related financ-ing of approximately $29,000, including approximately $5,500 paid toAEA, and paid approximately $185,000 to settle amounts due to Ciba andaffiliates. The Company has accounted for the Acquisition using the pur-chase method of accounting. Accordingly, the costs of the Acquisition wereallocated to the assets acquired and liabilities assumed based upon theirrespective fair values.
In connection with the Acquisition, the Company allocated, based uponindependent valuations, $114,070 of the purchase price to purchasedresearch and development in process. Such amount was recorded as anexpense in the period from October 15, 1996 to December 31, 1996. Addi-tionally, the Company allocated approximately $32,200 of the purchaseprice to revalue certain inventories (principally work-in-process and fin-ished goods) to fair value (net realizable value). Substantially all of suchinventories were sold during the period from October 15, 1996 to Decem-ber 31, 1996. The excess of the cost of the Acquisition over the fair value ofthe net assets acquired of approximately $137,500 is being amortized over32 years. Because of this purchase price allocation, the accompanyingfinancial statements of the Successor are not directly comparable to thoseof the Predecessor.
The consolidated financial statements have been prepared in accor-dance with generally accepted accounting principles in the United States of America and include all entities in which the Company has control, including its majority owned subsidiaries. All intercompanytransactions and balances have been eliminated. Investments in whichthe Company has voting rights between 20% to 50% are generallyaccounted for using the equity method of accounting. Certain amounts inthe prior year financial statements have been reclassified to conform with current period presentation.
30
Mettler-Toledo International Inc.
The combined financial statements of the Predecessor include the com-bined historical assets and liabilities and combined results of operations ofthe Mettler-Toledo Group. All intergroup transactions have been eliminat-ed as part of the combination process.
The preparation of financial statements requires management to makeestimates and assumptions that affect the reported amounts of assets andliabilities, as well as disclosure of contingent assets and liabilities at thedate of the financial statements and the reported amounts of revenues and expenses during the reporting period. Actual results may differ fromthose estimates.
Note 2SUMMARY OF SIGNIFICANT ACCOUNTING POLICIES
Cash and Cash Equivalents
Cash and cash equivalents include highly liquid investments with originalmaturity dates of three months or less.
Inventories
Inventories are valued at the lower of cost or market. Cost, which includesdirect materials, labor and overhead plus indirect overhead, is determinedusing the first in, first out (FIFO) or weighted average cost methods and toa lesser extent the last in, first out (LIFO) method.
Property, Plant and Equipment
Property, plant and equipment are stated at cost less accumulated depreci-ation. Depreciation is charged on a straight line basis over the estimateduseful lives of the assets as follows:
Buildings and improvements 15 to 50 yearsMachinery and equipment 3 to 12 yearsComputer software 3 to 5 yearsLeasehold improvements Shorter of useful life or lease term
Beginning January 1, 1996, the Company adopted Statement of FinancialAccounting Standards No. 121, “Accounting for the Impairment of Long-Lived Assets and for Long-Lived Assets to Be Disposed Of” (“SFAS 121”).SFAS 121 requires that long-lived assets and certain identifiable intangi-bles to be held and used by an entity be reviewed for impairment when-ever events or changes in circumstances indicate that the carryingamount of an asset may not be recoverable. In addition, SFAS 121 requiresthat long-lived assets and certain identifiable intangibles to be disposed of be reported at the lower of carrying amount or fair value less cost to sell. Adoption of SFAS 121 had no material effect on the consolidatedfinancial statements.
Notes to Consolidated Financial Statements (In thousands unless otherwise stated)
Note 1 BUSINESS DESCRIPTION AND BASIS OF PRESENTATION
Mettler-Toledo International Inc.
Excess of Cost Over Net Assets Acquired
The excess of purchase price over the fair value of net assets acquired isamortized on a straight line basis over the expected period to be benefited.The Company assesses the recoverability of such amount by determiningwhether the amortization of the balance over its remaining life can berecovered from the undiscounted future operating cash flows of theacquired operation. The amount of impairment, if any, is measured basedon projected discounted future operating cash flows using a discount ratereflecting the Company’s average cost of funds. The assessment of therecoverability of the excess of cost over net assets acquired will be impact-ed if estimated future operating cash flows are not achieved.
Deferred Financing Costs
Debt financing costs are deferred and amortized over the life of the under-lying indebtedness using the interest method.
Taxation
The Company files tax returns in each jurisdiction in which it operates.Prior to the Acquisition discussed in Note 1, in certain jurisdictions theCompany filed its tax returns jointly with other Ciba subsidiaries. TheCompany had a tax sharing arrangement with Ciba in these countries toshare the tax burden or benefits. Such arrangement resulted in each com-pany’s tax burden or benefit equating to that which it would haveincurred or received if it had been filing a separate tax return.
Deferred tax assets and liabilities are recognized for the future tax conse-quences attributable to differences between the financial statement carry-ing amounts of existing assets and liabilities and their respective tax basesand operating loss and tax credit carryforwards. Deferred tax assets andliabilities are measured using enacted tax rates in the respective jurisdic-tions in which the Company operates that are expected to apply to taxableincome in the years in which those temporary differences are expected tobe recovered or settled. In assessing the realizability of deferred tax assets,management considers whether it is more likely than not that some por-tion or all of the deferred tax assets will not be realized.
Generally, deferred taxes are not provided on the unremitted earnings ofsubsidiaries outside of the United States because it is expected that theseearnings are permanently reinvested and such determination is not prac-ticable. Such earnings may become taxable upon the sale or liquidationof these subsidiaries or upon the remittance of dividends. Deferred taxesare provided in situations where the Company’s subsidiaries plan to makefuture dividend distributions.
Research and Development
Research and development costs are expensed as incurred. Research anddevelopment costs, including customer engineering (which representsresearch and development charged to customers and, accordingly, isincluded in cost of sales), amounted to approximately $62,400, $45,100,$11,100 and $50,200 for the year ended December 31, 1995, for the periodfrom January 1, 1996 to October 14, 1996, for the period from October 15,1996 to December 31, 1996 and for the year ended December 31, 1997,respectively.
Currency Translation and Transactions
The reporting currency for the consolidated financial statements of theCompany is the United States dollar (USD). The functional currency forthe Company’s operations is generally the applicable local currency.Accordingly, the assets and liabilities of companies whose functional cur-rency is other than the USD are included in the consolidation by translat-ing the assets and liabilities into the reporting currency at the exchangerates applicable at the end of the reporting year. The statements of opera-tions and cash flows of such non-USD functional currency operations aretranslated at the monthly average exchange rates during the year. Trans-lation gains or losses are accumulated as a separate component of netassets/shareholders’ equity.
The Company has designated certain of its Swiss franc debt as a hedge ofits net investments. Any gains and losses due to changes on the debt arerecorded to currency translation adjustment and offset the net investmentswhich they hedge.
Derivative Financial Instruments
The Company has only limited involvement with derivative financialinstruments and does not use them for trading purposes. The Companyenters into foreign currency forward contracts to hedge short-term inter-company transactions with its foreign businesses. Such contracts limit the Company’s exposure to both favorable and unfavorable currency fluc-tuations. These contracts are adjusted to reflect market values as of eachbalance sheet date, with the resulting unrealized gains and losses beingrecognized in other charges (income), net.
The Company enters into certain interest rate cap and swap agreements inorder to reduce its exposure to changes in interest rates. The differentialpaid or received on interest rate swap agreements is recognized over thelife of the agreements. Realized and unrealized gains on interest rate capagreements are recognized as adjustments to interest expense as incurred.
Stock Based Compensation
The Company applies Accounting Principles Board Opinion No. 25“Accounting for Stock Issued to Employees” and related interpretations inaccounting for its stock option plan.
Loss per Common Share
Effective December 31, 1997, the Company adopted the Statement ofFinancial Accounting Standards No. 128, “Earnings per Share” (“SFAS128”). Accordingly, basic and diluted loss per common share data for eachperiod presented have been determined in accordance with the provisionsof SFAS 128. Outstanding options to purchase shares of common stock, asdescribed in Note 11, were not included in the computation of diluted lossper common share for the periods ended December 31, 1996 and 1997, asthe effect is antidilutive. The Company retroactively adjusted its weightedaverage common shares for the purpose of the basic and diluted loss percommon share computations for the 1996 and 1997 periods pursuant toSFAS 128 and Securities and Exchange Commission Staff Accounting Bul-letin No. 98 issued in February 1998.
31
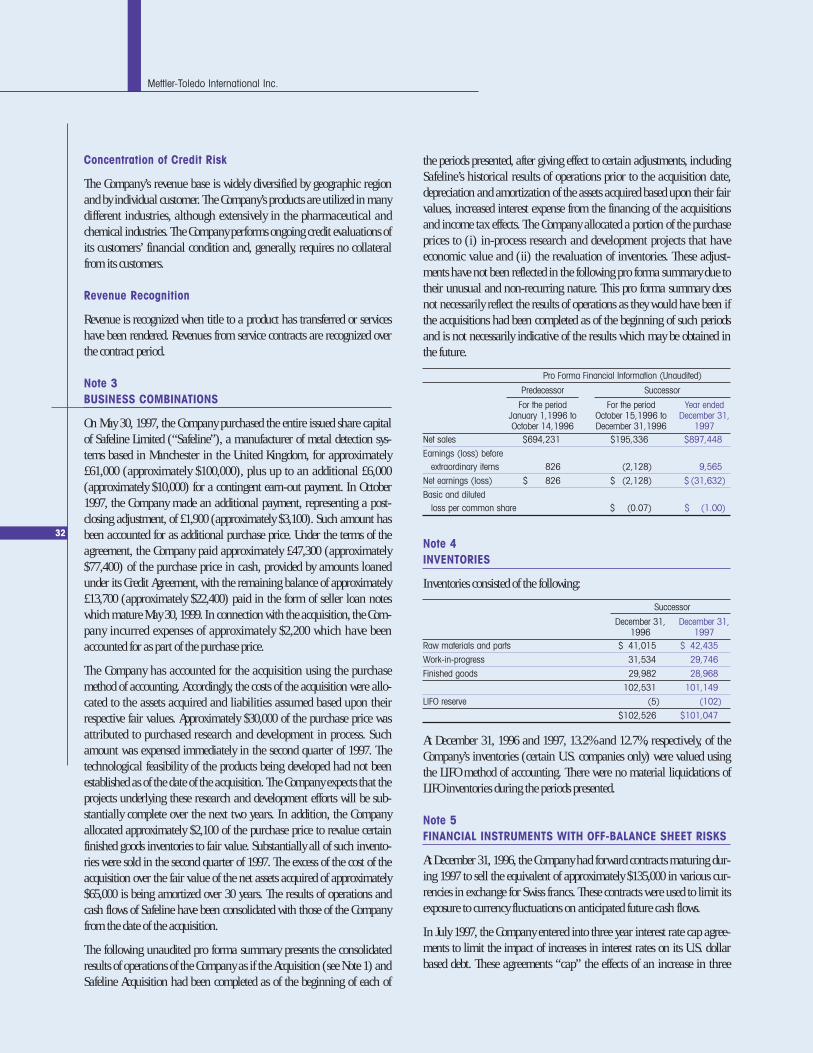
32
Mettler-Toledo International Inc.
Concentration of Credit Risk
The Company’s revenue base is widely diversified by geographic regionand by individual customer. The Company’s products are utilized in manydifferent industries, although extensively in the pharmaceutical andchemical industries. The Company performs ongoing credit evaluations ofits customers’ financial condition and, generally, requires no collateralfrom its customers.
Revenue Recognition
Revenue is recognized when title to a product has transferred or serviceshave been rendered. Revenues from service contracts are recognized overthe contract period.
Note 3BUSINESS COMBINATIONS
On May 30, 1997, the Company purchased the entire issued share capitalof Safeline Limited (“Safeline”), a manufacturer of metal detection sys-tems based in Manchester in the United Kingdom, for approximately£61,000 (approximately $100,000), plus up to an additional £6,000(approximately $10,000) for a contingent earn-out payment. In October1997, the Company made an additional payment, representing a post-closing adjustment, of £1,900 (approximately $3,100). Such amount hasbeen accounted for as additional purchase price. Under the terms of theagreement, the Company paid approximately £47,300 (approximately$77,400) of the purchase price in cash, provided by amounts loanedunder its Credit Agreement, with the remaining balance of approximately£13,700 (approximately $22,400) paid in the form of seller loan noteswhich mature May 30, 1999. In connection with the acquisition, the Com-pany incurred expenses of approximately $2,200 which have beenaccounted for as part of the purchase price.
The Company has accounted for the acquisition using the purchasemethod of accounting. Accordingly, the costs of the acquisition were allo-cated to the assets acquired and liabilities assumed based upon theirrespective fair values. Approximately $30,000 of the purchase price wasattributed to purchased research and development in process. Suchamount was expensed immediately in the second quarter of 1997. Thetechnological feasibility of the products being developed had not beenestablished as of the date of the acquisition. The Company expects that theprojects underlying these research and development efforts will be sub-stantially complete over the next two years. In addition, the Companyallocated approximately $2,100 of the purchase price to revalue certainfinished goods inventories to fair value. Substantially all of such invento-ries were sold in the second quarter of 1997. The excess of the cost of theacquisition over the fair value of the net assets acquired of approximately$65,000 is being amortized over 30 years. The results of operations andcash flows of Safeline have been consolidated with those of the Companyfrom the date of the acquisition.
The following unaudited pro forma summary presents the consolidatedresults of operations of the Company as if the Acquisition (see Note 1) andSafeline Acquisition had been completed as of the beginning of each of
the periods presented, after giving effect to certain adjustments, includingSafeline’s historical results of operations prior to the acquisition date,depreciation and amortization of the assets acquired based upon their fairvalues, increased interest expense from the financing of the acquisitionsand income tax effects. The Company allocated a portion of the purchaseprices to (i) in-process research and development projects that have economic value and (ii) the revaluation of inventories. These adjust-ments have not been reflected in the following pro forma summary due totheir unusual and non-recurring nature. This pro forma summary doesnot necessarily reflect the results of operations as they would have been ifthe acquisitions had been completed as of the beginning of such periodsand is not necessarily indicative of the results which may be obtained inthe future.
Pro Forma Financial Information (Unaudited)
Predecessor Successor
For the period For the period Year endedJanuary 1,1996 to October 15,1996 to December 31,October 14,1996 December 31,1996 1997
Net sales $694,231 $195,336 $897,448
Earnings (loss) beforeextraordinary items 826 (2,128) 9,565
Net earnings (loss) $ 826 $ (2,128) $ (31,632)
Basic and diluted loss per common share $ (0.07) $ (1.00)
Note 4INVENTORIES
Inventories consisted of the following:
Successor
December 31, December 31,1996 1997
Raw materials and parts $ 41,015 $ 42,435
Work-in-progress 31,534 29,746
Finished goods 29,982 28,968
102,531 101,149
LIFO reserve (5) (102)
$102,526 $101,047
At December 31, 1996 and 1997, 13.2% and 12.7%, respectively, of theCompany’s inventories (certain U.S. companies only) were valued usingthe LIFO method of accounting. There were no material liquidations ofLIFO inventories during the periods presented.
Note 5FINANCIAL INSTRUMENTS WITH OFF-BALANCE SHEET RISKS
At December 31, 1996, the Company had forward contracts maturing dur-ing 1997 to sell the equivalent of approximately $135,000 in various cur-rencies in exchange for Swiss francs. These contracts were used to limit itsexposure to currency fluctuations on anticipated future cash flows.
In July 1997, the Company entered into three year interest rate cap agree-ments to limit the impact of increases in interest rates on its U.S. dollarbased debt. These agreements “cap” the effects of an increase in three

month LIBOR above 8.5%. In addition, the Company has entered intothree year interest rate swap agreements which swap the interest obliga-tion associated with $100,000 of U.S. dollar based debt from variable tofixed. The fixed rate associated with the swap is 6.09% plus the Company’snormal interest margin. The swap is effective at three month LIBOR ratesup to 7.00%.
In August 1997, the Company entered into certain three year interest rateswap agreements that fix the interest obligation associated with SFr 112,500 of Swiss franc based debt at rates varying between 2.17% and2.49% plus the Company’s normal interest margin. The swaps are effectiveat one month LIBOR rates up to 3.5%.
The Company may be exposed to credit losses in the event of nonper-formance by the counterparties to its derivative financial instrument contracts. Counterparties are established banks and financial institu-tions with high credit ratings. The Company has no reason to believe thatsuch counterparties will not be able to fully satisfy their obligations underthese contracts.
At December 31, 1996 and 1997, the fair value of such financial instru-ments was approximately $(5,100) and $(1,064), respectively. The fairvalues of all derivative financial instruments are estimated based on cur-rent settlement prices of comparable contracts obtained from dealerquotes. The values represent the estimated amount the Company wouldpay to terminate the agreements at the reporting date, taking into accountcurrent creditworthiness of the counterparties.
Note 6PROPERTY, PLANT AND EQUIPMENT, NET
Property, plant and equipment, net, consisted of the following:
Successor
December 31, December 31,1996 1997
Land $ 63,514 $ 58,226
Buildings and leasehold improvements 120,173 111,065
Machinery and equipment 75,675 93,418
Computer software 3,067 3,948
262,429 266,657
Less accumulated depreciation and amortization (7,137) (31,395)
$255,292 $235,262
Note 7OTHER ASSETS
Other assets include deferred financing fees of $22,015 and $4,101, net of accumulated amortization of $820 and $76, at December 31, 1996 and1997, respectively. During 1997, the Company wrote-off deferred financingcosts associated with its previous credit facilities and its Senior Subordinat-ed Notes as further discussed in Note 9. Also included in other assets arerestricted bank deposits of $5,960 and $1,756 at December 31, 1996 and1997, respectively. Other assets at December 31, 1996 and 1997 alsoincluded a loan due from the Company’s Chief Executive Officer ofapproximately $740 and $690, respectively. Such loan bears an interest rateof 5% and is payable upon demand, which may not be made until 2003.
Mettler-Toledo International Inc.
Note 8SHORT-TERM BORROWINGS AND CURRENT MATURITIES OF LONG-TERM DEBT
Short-term borrowings and current maturities of long-term debt consistedof the following:
Successor
December 31, December 31,1996 1997
Current maturities of long-term debt $ 8,968 $14,915
Borrowings under revolving credit facility 51,928 33,320
Other short-term borrowings 19,550 8,195
$80,446 $56,430
Note 9LONG-TERM DEBT
Long-term debt consisted of the following:
Successor
December 31, December 31,1996 1997
9.75% Senior Subordinated Notes due October 1,2006 $135,000 $ —
Credit Agreement:Term A USD Loans, interest at LIBOR plus
1.125% (7.03% at December 31,1997) payable in quarterly installments beginning March 31,1998 due May 19, 2004 — 101,573
Term A SFr Loans, interest at LIBOR plus 1.125% (2.57% at December 31,1997) payable in quarterly installments beginning March 31,1998 due May 19, 2004 — 58,991
Term A GBP Loans, interest at LIBOR plus 1.125% (8.71% at December 31,1997) payable in quarterly installments beginning March 31,1998 due May 19, 2004 — 36,198
Seller Notes, interest at LIBOR plus 0.26% (7.84% at December 31,1997) due in full May 30,1999 — 22,946
Term A SFr Loans, interest at LIBOR plus 2.5% (4.38% at December 31,1996) payable in quarterly installments beginning March 31,,1997 due December 31, 2002 92,730 —
Term B USD Loans, interest at LIBOR plus 3.00% (8.53% at December 31,1996) payable in quarterly installments beginning March 31,1997 due December 31,2003 75,000 —
Term C USD Loans, interest at LIBOR plus 3.25% (8.78% at December 31,1996) payable in quarterly installments beginning March 31,1997 due December 31,2004 72,000 —
Revolving credit facilities 51,928 160,862
Other 27,546 16,194
454,204 396,764
Less current maturities 80,446 56,430
$373,758 $340,334
33

34
Mettler-Toledo International Inc.
To provide a portion of the financing required for the Acquisition and forworking capital and for general corporate purposes thereafter, in October1996 Mettler-Toledo Holding Inc., a wholly owned subsidiary of the Com-pany, entered into a credit agreement with various banks.
At December 31, 1996, loans under the credit agreement consisted of: (i) Term A Loans in an aggregate principal amount of SFr 125,000($92,730 at December 31, 1996), (ii) Term B Loans in an aggregate prin-cipal amount of $75,000, (iii) Term C loans in an aggregate principalamount of $72,000 and (iv) a multi-currency revolving credit facility inan aggregate principal amount of $140,000, which included letter of cred-it and swingline subfacilities available to certain subsidiaries.
On May 29, 1997, the Company refinanced its previous credit facility and entered into a new credit facility. This credit facility provided for termloan borrowings in an aggregate principal amount of approximately$133,800, SFr 171,500 and £26,700, that were scheduled to maturebetween 2002 and 2004, a Canadian revolving credit facility with avail-ability of CDN $26,300 and a multi-currency revolving credit facility withavailability of $151,000. The revolving credit facilities were scheduled tomature in 2002. The Company recorded an extraordinary loss of approxi-mately $9,600 representing a charge for the write-off of capitalized debtissuance fees and related expenses associated with the Company’s previouscredit facility.
On November 19, 1997, in connection with the initial public offering, theCompany refinanced its existing credit facility by entering into a new cred-it facility (the “Credit Agreement”) with certain financial institutions. AtDecember 31,1997, loans under the Credit Agreement consisted of: (i) TermA Loans in aggregate principal amount of $101,573, SFr 85,467 ($58,991at December 31, 1997) and £21,661 ($36,198 at December 31, 1997), (ii) a Canadian revolving credit facility with availability of CDN $26,300and (iii) a multi-currency revolving credit facility in an aggregate princi-pal amount of $400,000 including a $100,000 acquisition facility.
Concurrent with the initial public offering and refinancing, the Companyconsummated a tender offer to repurchase the Senior Subordinated Notes.The aggregate purchase price in connection with the tender offer wasapproximately $152,500. In connection with the refinancing and the noterepurchase, the Company recorded an extraordinary loss of $31,600 repre-senting primarily the premium paid in connection with the early extin-guishment of the notes of $17,900 and the write-off of capitalized debtissuance fees associated with the Senior Subordinated Notes and the Com-pany’s previous credit facility.
The Company’s weighted average interest rate at December 31, 1997 wasapproximately 6.3%.
Loans under the Credit Agreement may be repaid and reborrowed and aredue in full on May 19, 2004. The Company is required to pay a facility feebased upon certain financial ratios per annum on the amount of therevolving facility and letter of credit fees on the aggregate face amount of
letters of credit under the revolving facility. The facility fee at December31, 1997 was equal to 0.3%. At December 31, 1997, the Company hadavailable approximately $220,000 of additional borrowing capacity underits Credit Agreement. The Company has the ability to refinance its short-term borrowings through its revolving facility for an uninterrupted periodextending beyond one year. Accordingly, approximately $128,000 of theCompany’s short-term borrowings at December 31, 1997 have been reclas-sified to long-term. At December 31, 1997, borrowings under the Com-pany’s revolving facility carried an interest rate of LIBOR plus 0.825%.
The Credit Agreement contains covenants that, among other things, limitthe Company’s ability to incur liens; merge, consolidate or dispose ofassets; make loans and investments; incur indebtedness; engage in certaintransactions with affiliates; incur certain contingent obligations; pay divi-dends and other distributions; or make certain capital expenditures. TheCredit Agreement also requires the Company to maintain a minimum networth and a minimum fixed charge coverage ratio, and to maintain aratio of total debt to EBITDA below a specified maximum.
The aggregate maturities of long-term obligations during each of theyears 1999 through 2002 are approximately $42,748, $32,691, $34,531and $34,531, respectively.
The estimated fair value of the Company’s obligations under the CreditAgreement approximate fair value due to the variable rate nature of theobligations.
Note 10SHAREHOLDERS’ EQUITY
Common Stock
At December 31, 1996, the authorized capital stock of the Company con-sisted of 2,775,976 shares of common stock, $0.01 par value of which2,233,117 shares were designated as Class A common stock, 1,000 shareswere designated as Class B common stock and 541,859 shares were desig-nated as Class C common stock. All general voting power was vested in theholders of the Class B common stock. At December 31, 1996, the Companyhad outstanding 1,899,779 shares of Class A common stock, 1,000 sharesof Class B common stock and 537,735 shares of Class C common stock.
In November 1997, pursuant to a merger with its wholly owned subsidiaryMettler-Toledo Holding Inc., each share of the Company’s existing Class A,Class B and Class C common stock converted into 12.58392 shares ofcommon stock and increased the number of authorized shares to125,000,000 shares with a par value of $0.01 per share. Concurrent there-with, the Company completed an underwritten initial public offering of7,666,667 shares at a public offering price of $14.00 per share. The netproceeds from the offerings of approximately $97,300 were used to repay aportion of the Company’s 9.75% Senior Subordinated Notes (see Note 9).As part of the offering, the Company sold approximately 287,000 shares

Mettler-Toledo International Inc.
of its common stock to Company sponsored benefit plans at the publicoffering price. Holders of the Company’s common stock are entitled to onevote per share.
At December 31, 1997, 6,368,445 shares of the Company’s common stockwere reserved for the Company’s stock option plan.
Preferred Stock
The Board of Directors, without further shareholder authorization, isauthorized to issue up to 10,000,000 shares of preferred stock, par value$0.01 per share in one or more series and to determine and fix the rights,preferences and privileges of each series, including dividend rights andpreferences over dividends on the common stock and one or more series ofthe preferred stock, conversion rights, voting rights (in addition to thoseprovided by law), redemption rights and the terms of any sinking fundtherefore, and rights upon liquidation, dissolution or winding up, includ-ing preferences over the common stock and one or more series of the pre-ferred stock. The issuance of shares of preferred stock, or the issuance ofrights to purchase such shares, may have the effect of delaying, deferringor preventing a change in control of the Company or an unsolicitedacquisition proposal.
Note 11STOCK OPTION PLAN
Effective October 15, 1996, the Company adopted a stock option plan toprovide certain key employees and/or directors of the Company additionalincentive to join and/or remain in the service of the Company as well as to maintain and enhance the long-term performance and profitability ofthe Company.
Under the terms of the plan, options granted shall be nonqualified andthe exercise price shall not be less than 100% of the fair market value ofthe common stock on the date of grant. Options vest equally over a fiveyear period from the date of grant.
Stock option activity is shown below:
Weighted AverageNumber of Shares Exercise Price
Granted during the period October 15, 1996 to December 31,1996 3,510,747 $ 7.95
Exercised — —
Forfeited — —
Outstanding at December 31,1996 3,510,747 $ 7.95
Granted 1,028,992 14.68
Exercised — —
Forfeited (130,999) (7.95)
Outstanding at December 31,1997 4,408,740 $ 9.75
Shares exercisable at December 31,1997 675,950 $ 7.95
At December 31, 1997, there were 3,537,047 and 871,693 options out-standing to purchase shares of common stock with exercise prices of $7.95and $15.89, respectively. The weighted average remaining contractual lifeof such options was 8.7 and 9.7 years, respectively.
As of the date granted, the weighted average grant date fair value of theoptions granted during the period from October 15, 1996 to December 31,1996 and for the year ended December 31, 1997 was approximately $1.99and $3.37 per share, respectively. Such weighted average grant date fairvalue was determined using an option pricing model which incorporatedthe following assumptions:
Successor
For the period Year endedOctober 15,1996 to December 31,December 31,1996 1997
Risk-free interest rate 4.0% 5.4%
Expected life, in years 7 4
Expected volatility — 26%
Expected dividend yield — —
The Company applies Accounting Standards Board Opinion No. 25 andrelated interpretations in accounting for its plans. Had compensation costfor the Company stock option plan been determined based upon the fairvalue of such awards at the grant date, consistent with the methods ofStatement of Financial Accounting Standards No. 123, “Accounting forStock Based Compensation” (“SFAS 123”), the Company’s net loss andbasic and diluted net loss per common share for the twelve months endedDecember 31, 1997 would have been as follows:
Net loss:As reported $(65,106)
Pro forma (66,417)
Basic and diluted loss per common share:As reported $ (2.06)
Pro forma (2.10)
The Company’s net loss for the period October 15, 1996 to December 31,1996 would not have been materially different had compensation costbeen determined consistent with SFAS 123.
35

The (prepaid) accrued pension costs are recognized in the accompanyingconsolidated financial statements as other long-term assets and otherlong-term liabilities, respectively.
The assumed discount rates and rates of increase in future compensationlevel used in calculating the projected benefit obligations vary accordingto the economic conditions of the country in which the retirement plansare situated. The range of rates used for the purposes of the above calcula-tions are as follows:
1996 1997Discount rate 6.0% to 8.5% 6.0% to 8.5%
Compensation increase rate 2.0% to 6.5% 2.0% to 6.5%
The expected long-term rates of return on plan assets ranged between9.5% and 10.0% for 1995, 7.0% and 10.0% for 1996, and 6.0% and 9.5% in 1997. The assumptions used above have a significant effect on thereported amounts of projected benefit obligations and net periodic pen-sion cost. For example, increasing the assumed discount rate would havethe effect of decreasing the projected benefit obligation and increasingunrecognized net gains. Increasing the assumed compensation increaserate would increase the projected benefit obligation and decrease unrecog-nized net gains. Increasing the expected long-term rate of return oninvestments would decrease unrecognized net gains.
Plan assets relate principally to the Company’s U.S. companies and consistof equity investments, obligations of the U.S. Treasury or other govern-mental agencies, and other interest-bearing investments.
36
Mettler-Toledo International Inc.
Note 12BENEFIT PLANS
Mettler Toledo maintains a number of retirement plans for the benefit ofits employees.
Certain companies sponsor defined contribution plans. Benefits are deter-mined and funded annually based upon the terms of the plans. Contribu-tions under these plans amounted to $9,413, $9,484, $2,496 and $8,925 in1995, for the period January 1, 1996 to October 14, 1996, for the periodOctober 15, 1996 to December 31, 1996 and for the year ended December31, 1997, respectively.
Certain companies sponsor defined benefit plans. Benefits are provided toemployees primarily based upon years of service and employees’ compen-sation for certain periods during the last years of employment. The follow-ing table sets forth the funded status and amounts recognized in the con-solidated financial statements for the Company’s principal defined benefitplans at December 31, 1996 and 1997:
Successor
December 31, December 31,1996 1997
Assets exceed Accumulated Assets exceed Accumulatedaccumulated benefits accumulated benefits
benefits exceed assets benefits exceed assetsActuarial present value of accumulated benefit obligations:
Vested benefits $10,211 $ 97,639 $11,712 $ 98,974
Non-vested benefits 16 2,280 20 3,574
10,227 99,919 11,732 102,548
Projected benefit obligations 12,458 108,504 13,350 111,608
Plan assets at fair value 13,336 50,609 14,899 58,176
Projected benefit obligations in excess of (less than) plan assets (878) 57,895 (1,549) 53,432
Unrecognized net (losses) gains 22 1,479 544 561
(Prepaid) accrued pension costs $ (856) $ 59,374 $ (1,005) $ 53,993
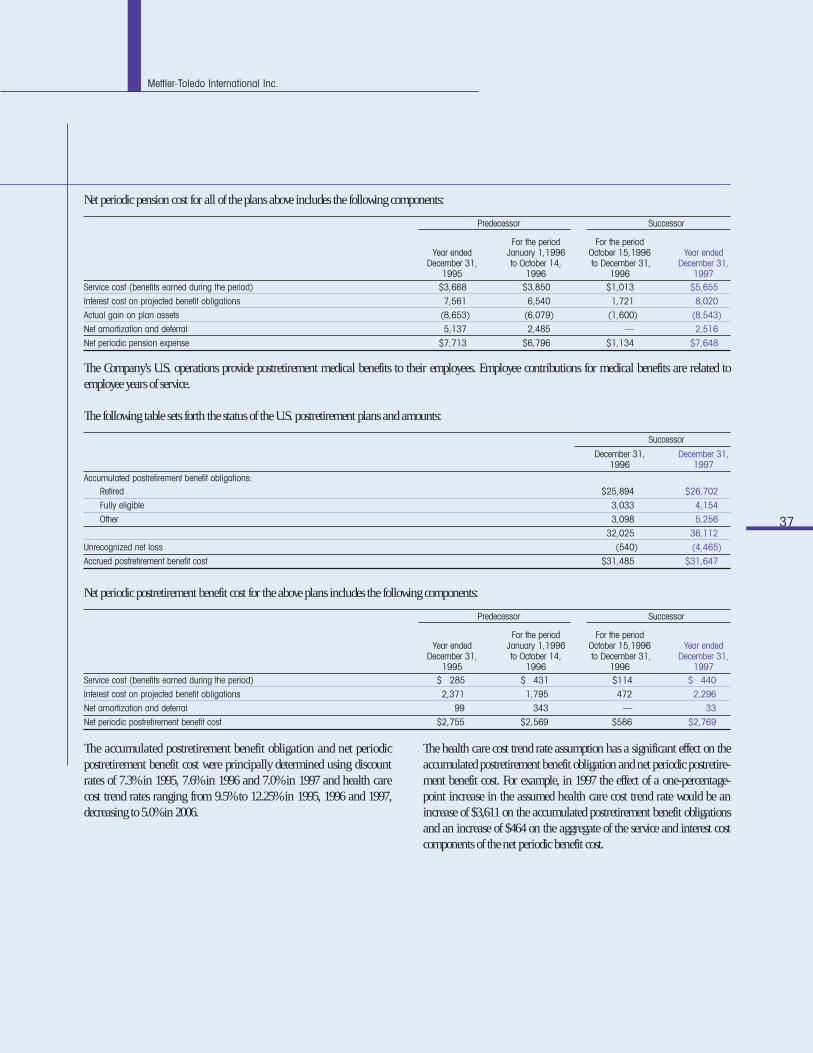
Mettler-Toledo International Inc.
37
Net periodic pension cost for all of the plans above includes the following components:
Predecessor Successor
For the period For the periodYear ended January 1,1996 October 15,1996 Year ended
December 31, to October 14, to December 31, December 31,1995 1996 1996 1997
Service cost (benefits earned during the period) $3,668 $3,850 $1,013 $5,655
Interest cost on projected benefit obligations 7,561 6,540 1,721 8,020
Actual gain on plan assets (8,653) (6,079) (1,600) (8,543)
Net amortization and deferral 5,137 2,485 — 2,516
Net periodic pension expense $7,713 $6,796 $1,134 $7,648
The Company’s U.S. operations provide postretirement medical benefits to their employees. Employee contributions for medical benefits are related toemployee years of service.
The following table sets forth the status of the U.S. postretirement plans and amounts:
Successor
December 31, December 31,1996 1997
Accumulated postretirement benefit obligations:Retired $25,894 $26,702
Fully eligible 3,033 4,154
Other 3,098 5,256
32,025 36,112
Unrecognized net loss (540) (4,465)
Accrued postretirement benefit cost $31,485 $31,647
Net periodic postretirement benefit cost for the above plans includes the following components:
Predecessor Successor
For the period For the periodYear ended January 1,1996 October 15,1996 Year ended
December 31, to October 14, to December 31, December 31,1995 1996 1996 1997
Service cost (benefits earned during the period) $ 285 $ 431 $114 $ 440
Interest cost on projected benefit obligations 2,371 1,795 472 2,296
Net amortization and deferral 99 343 — 33
Net periodic postretirement benefit cost $2,755 $2,569 $586 $2,769
The accumulated postretirement benefit obligation and net periodicpostretirement benefit cost were principally determined using discountrates of 7.3% in 1995, 7.6% in 1996 and 7.0% in 1997 and health care cost trend rates ranging from 9.5% to 12.25% in 1995, 1996 and 1997,decreasing to 5.0% in 2006.
The health care cost trend rate assumption has a significant effect on theaccumulated postretirement benefit obligation and net periodic postretire-ment benefit cost. For example, in 1997 the effect of a one-percentage-point increase in the assumed health care cost trend rate would be anincrease of $3,611 on the accumulated postretirement benefit obligationsand an increase of $464 on the aggregate of the service and interest costcomponents of the net periodic benefit cost.
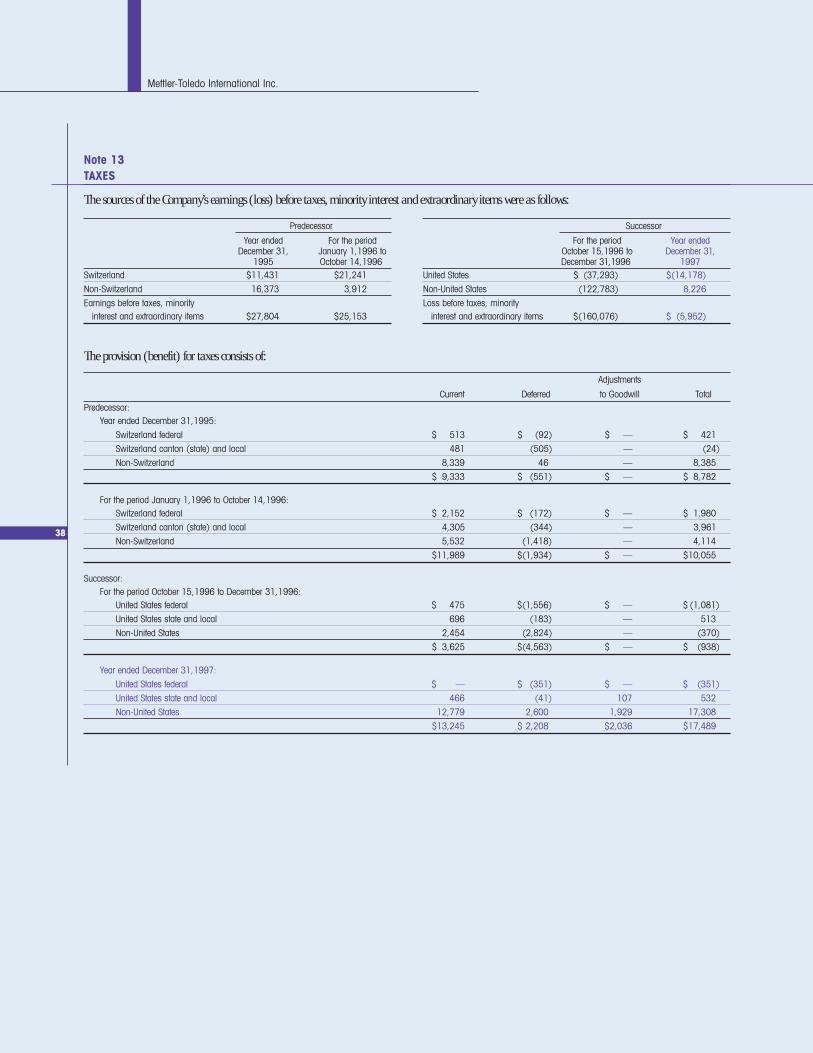
38
Mettler-Toledo International Inc.
Note 13TAXES
The sources of the Company’s earnings (loss) before taxes, minority interest and extraordinary items were as follows:
Predecessor
Year ended For the periodDecember 31, January 1,1996 to
1995 October 14,1996Switzerland $11,431 $21,241
Non-Switzerland 16,373 3,912
Earnings before taxes, minority interest and extraordinary items $27,804 $25,153
Successor
For the period Year endedOctober 15,1996 to December 31,December 31,1996 1997
United States $ (37,293) $(14,178)
Non-United States (122,783) 8,226
Loss before taxes, minority interest and extraordinary items $(160,076) $ (5,952)
The provision (benefit) for taxes consists of:
Adjustments
Current Deferred to Goodwill TotalPredecessor:
Year ended December 31,1995:
Switzerland federal $ 513 $ (92) $ — $ 421
Switzerland canton (state) and local 481 (505) — (24)
Non-Switzerland 8,339 46 — 8,385
$ 9,333 $ (551) $ — $ 8,782
For the period January 1,1996 to October 14,1996:Switzerland federal $ 2,152 $ (172) $ — $ 1,980
Switzerland canton (state) and local 4,305 (344) — 3,961
Non-Switzerland 5,532 (1,418) — 4,114
$11,989 $(1,934) $ — $10,055
Successor:For the period October 15,1996 to December 31,1996:
United States federal $ 475 $(1,556) $ — $ (1,081)
United States state and local 696 (183) — 513
Non-United States 2,454 (2,824) — (370)
$ 3,625 $(4,563) $ — $ (938)
Year ended December 31,1997:
United States federal $ — $ (351) $ — $ (351)
United States state and local 466 (41) 107 532
Non-United States 12,779 2,600 1,929 17,308
$13,245 $ 2,208 $2,036 $17,489
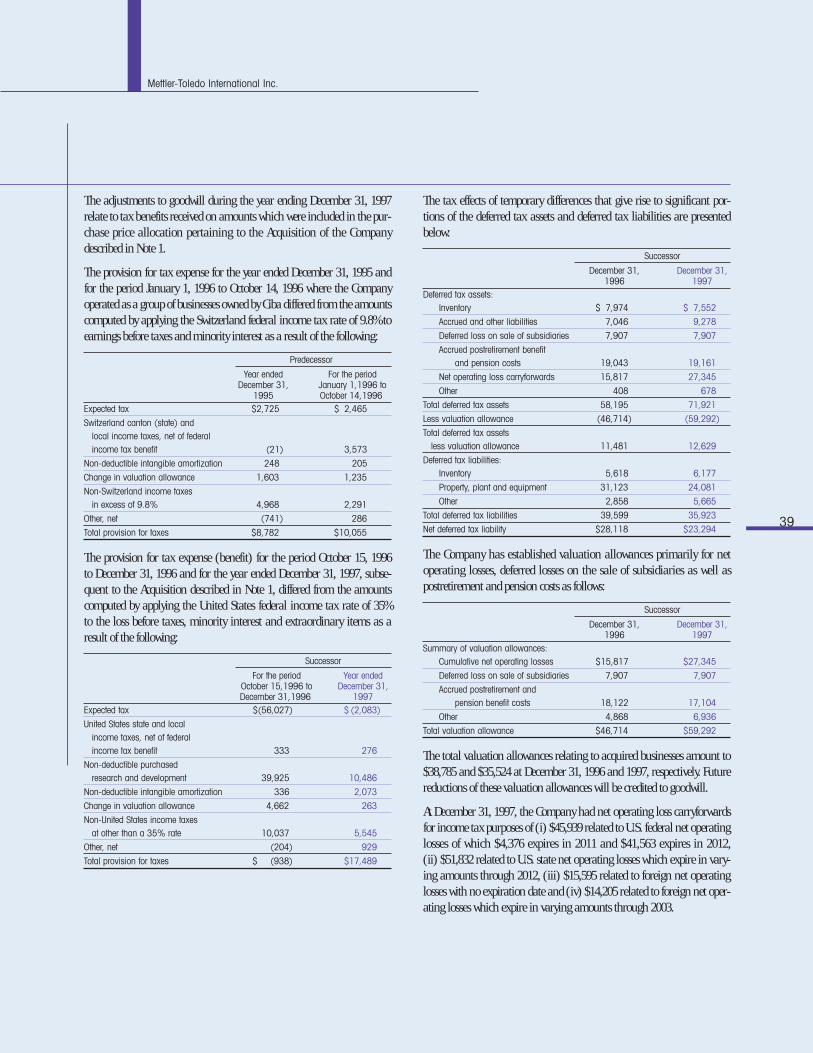
Mettler-Toledo International Inc.
The adjustments to goodwill during the year ending December 31, 1997relate to tax benefits received on amounts which were included in the pur-chase price allocation pertaining to the Acquisition of the Companydescribed in Note 1.
The provision for tax expense for the year ended December 31, 1995 andfor the period January 1, 1996 to October 14, 1996 where the Companyoperated as a group of businesses owned by Ciba differed from the amountscomputed by applying the Switzerland federal income tax rate of 9.8% toearnings before taxes and minority interest as a result of the following:
Predecessor
Year ended For the periodDecember 31, January 1,1996 to
1995 October 14,1996Expected tax $2,725 $ 2,465
Switzerland canton (state) and local income taxes, net of federal income tax benefit (21) 3,573
Non-deductible intangible amortization 248 205
Change in valuation allowance 1,603 1,235
Non-Switzerland income taxes in excess of 9.8% 4,968 2,291
Other, net (741) 286
Total provision for taxes $8,782 $10,055
The provision for tax expense (benefit) for the period October 15, 1996 to December 31, 1996 and for the year ended December 31, 1997, subse-quent to the Acquisition described in Note 1, differed from the amountscomputed by applying the United States federal income tax rate of 35% to the loss before taxes, minority interest and extraordinary items as aresult of the following:
Successor
For the period Year endedOctober 15,1996 to December 31,December 31,1996 1997
Expected tax $(56,027) $ (2,083)
United States state and local income taxes, net of federalincome tax benefit 333 276
Non-deductible purchased research and development 39,925 10,486
Non-deductible intangible amortization 336 2,073
Change in valuation allowance 4,662 263
Non-United States income taxes at other than a 35% rate 10,037 5,545
Other, net (204) 929
Total provision for taxes $ (938) $17,489
The tax effects of temporary differences that give rise to significant por-tions of the deferred tax assets and deferred tax liabilities are presentedbelow:
Successor
December 31, December 31,1996 1997
Deferred tax assets:Inventory $ 7,974 $ 7,552
Accrued and other liabilities 7,046 9,278
Deferred loss on sale of subsidiaries 7,907 7,907
Accrued postretirement benefit and pension costs 19,043 19,161
Net operating loss carryforwards 15,817 27,345
Other 408 678
Total deferred tax assets 58,195 71,921
Less valuation allowance (46,714) (59,292)
Total deferred tax assets less valuation allowance 11,481 12,629
Deferred tax liabilities:Inventory 5,618 6,177
Property, plant and equipment 31,123 24,081
Other 2,858 5,665
Total deferred tax liabilities 39,599 35,923
Net deferred tax liability $28,118 $23,294
The Company has established valuation allowances primarily for netoperating losses, deferred losses on the sale of subsidiaries as well aspostretirement and pension costs as follows:
Successor
December 31, December 31,1996 1997
Summary of valuation allowances:Cumulative net operating losses $15,817 $27,345
Deferred loss on sale of subsidiaries 7,907 7,907
Accrued postretirement and pension benefit costs 18,122 17,104
Other 4,868 6,936
Total valuation allowance $46,714 $59,292
The total valuation allowances relating to acquired businesses amount to$38,785 and $35,524 at December 31, 1996 and 1997, respectively. Futurereductions of these valuation allowances will be credited to goodwill.
At December 31, 1997, the Company had net operating loss carryforwardsfor income tax purposes of (i) $45,939 related to U.S. federal net operatinglosses of which $4,376 expires in 2011 and $41,563 expires in 2012, (ii) $51,832 related to U.S. state net operating losses which expire in vary-ing amounts through 2012, (iii) $15,595 related to foreign net operatinglosses with no expiration date and (iv) $14,205 related to foreign net oper-ating losses which expire in varying amounts through 2003.
39

40
Mettler-Toledo International Inc.
Note 14OTHER CHARGES (INCOME), NET
Other charges (income), net consists primarily of foreign currency trans-actions, interest income and charges related to the Company’s restructur-ing programs. Foreign currency transactions, net for the year endedDecember 31, 1995, for the period January 1, 1996 to October 14, 1996, forthe period October 15, 1996 to December 31, 1996 and for the year endedDecember 31, 1997 were $(3,242), $(220), $8,324 and $4,235, respective-ly. Interest income for the year ended December 31, 1995, for the periodJanuary 1, 1996 to October 14, 1996, for the period October 15, 1996 toDecember 31, 1996 and for the year ended December 31, 1997 was$(5,388), $(3,424), $(1,079) and $(1,832), respectively.
Severance and other exit costs for the period January 1, 1996 to October14, 1996 of $1,872 represent employee severance of $1,545 and other exitcosts of $327 associated with the closing of its Westerville, Ohio facility.Severance costs for the period October 15, 1996 to December 31, 1996principally represent employee severance benefits associated with (i) theCompany’s general headcount reduction programs in Europe and NorthAmerica of $4,557 which were announced during such period and (ii) the realignment of the analytical and precision balance business inSwitzerland of $6,205 which was announced in December 1996. In con-nection with such programs, the Company reduced its workforce by 168employees in 1996.
The Company recorded further restructuring charges of $6,300 during1997. Such charges are in connection with the closure of three facilities in North America and are comprised primarily of severance and otherrelated benefits and costs of exiting facilities, including lease terminationcosts and write-down of existing assets to their expected net realizablevalue. In connection with the closure of these facilities, the Companyexpects to involuntarily terminate approximately 70 employees. The Com-pany is undertaking these actions as part of its efforts to reduce coststhrough reengineering.
A rollforward of the components of the Company’s accrual for restructur-ing activities is as follows:
Balance at December 31, 1996 $10,762
1997 Activities:Restructuring accrual for North American operations 6,300
Reductions in workforce and other cash outflows (7,182)
Non-cash write-downs of property, plant and equipment (540)
Impact of foreign currency (582)
Balance at December 31, 1997 $ 8,758
The Company’s accrual for restructuring activities of $8,758 at December31, 1997 primarily consisted of $6,544 for severance and other related bene-fits with the remaining balance for lease termination and other costs ofexiting facilities. Such programs are expected to be substantially completein 1998.
Note 15COMMITMENTS AND CONTINGENCIES
Operating Leases
The Company leases certain of its facilities and equipment under operat-ing leases. The future minimum lease payments under non-cancelableoperating leases are as follows at December 31, 1997:
1998 $12,006
1999 8,565
2000 5,771
2001 4,023
2002 3,296
Thereafter 1,856
Total $35,517
Rent expense for operating leases amounted to $13,034, $3,430 and$16,420 for the period January 1, 1996 to October 14, 1996, for the periodOctober 15, 1996 to December 31, 1996 and for the year ended December31, 1997, respectively.
Legal
The Company is party to various legal proceedings, including certainenvironmental matters, incidental to the normal course of business. Management does not expect that any of such proceedings will have amaterial adverse effect on the Company’s financial condition or results of operations.
Note 16GEOGRAPHIC SEGMENT INFORMATION
The following tables show the Company’s operations by geographicregion. Transfers between geographic regions are priced to reflect consid-eration of market conditions and the regulations of the countries in whichthe transferring entities are located.
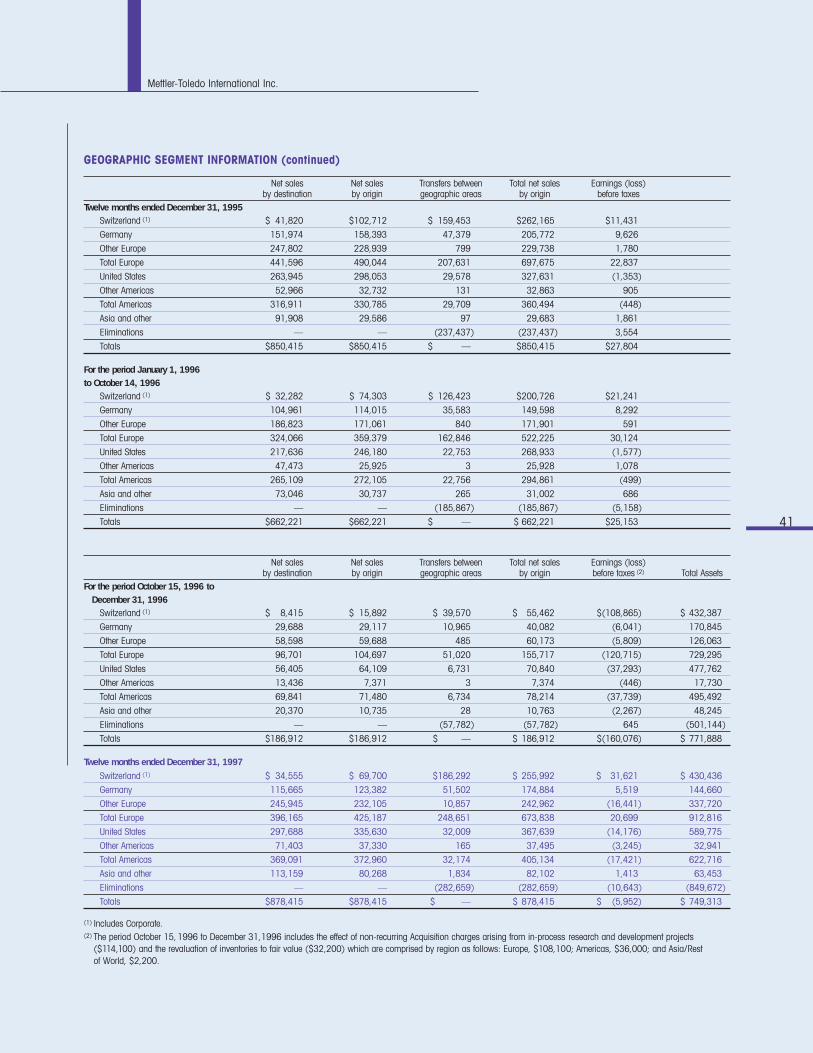
Mettler-Toledo International Inc.
41
GEOGRAPHIC SEGMENT INFORMATION (continued)
Net sales Net sales Transfers between Total net sales Earnings (loss)by destination by origin geographic areas by origin before taxes
Twelve months ended December 31, 1995Switzerland (1) $ 41,820 $102,712 $ 159,453 $262,165 $11,431
Germany 151,974 158,393 47,379 205,772 9,626
Other Europe 247,802 228,939 799 229,738 1,780
Total Europe 441,596 490,044 207,631 697,675 22,837
United States 263,945 298,053 29,578 327,631 (1,353)
Other Americas 52,966 32,732 131 32,863 905
Total Americas 316,911 330,785 29,709 360,494 (448)
Asia and other 91,908 29,586 97 29,683 1,861
Eliminations — — (237,437) (237,437) 3,554
Totals $850,415 $850,415 $ — $850,415 $27,804
For the period January 1, 1996 to October 14, 1996
Switzerland (1) $ 32,282 $ 74,303 $ 126,423 $200,726 $21,241
Germany 104,961 114,015 35,583 149,598 8,292
Other Europe 186,823 171,061 840 171,901 591
Total Europe 324,066 359,379 162,846 522,225 30,124
United States 217,636 246,180 22,753 268,933 (1,577)
Other Americas 47,473 25,925 3 25,928 1,078
Total Americas 265,109 272,105 22,756 294,861 (499)
Asia and other 73,046 30,737 265 31,002 686
Eliminations — — (185,867) (185,867) (5,158)
Totals $662,221 $662,221 $ — $ 662,221 $25,153
Net sales Net sales Transfers between Total net sales Earnings (loss)by destination by origin geographic areas by origin before taxes (2) Total Assets
For the period October 15, 1996 to December 31, 1996
Switzerland (1) $ 8,415 $ 15,892 $ 39,570 $ 55,462 $(108,865) $ 432,387
Germany 29,688 29,117 10,965 40,082 (6,041) 170,845
Other Europe 58,598 59,688 485 60,173 (5,809) 126,063
Total Europe 96,701 104,697 51,020 155,717 (120,715) 729,295
United States 56,405 64,109 6,731 70,840 (37,293) 477,762
Other Americas 13,436 7,371 3 7,374 (446) 17,730
Total Americas 69,841 71,480 6,734 78,214 (37,739) 495,492
Asia and other 20,370 10,735 28 10,763 (2,267) 48,245
Eliminations — — (57,782) (57,782) 645 (501,144)
Totals $186,912 $186,912 $ — $ 186,912 $(160,076) $ 771,888
Twelve months ended December 31, 1997
Switzerland (1) $ 34,555 $ 69,700 $186,292 $ 255,992 $ 31,621 $ 430,436
Germany 115,665 123,382 51,502 174,884 5,519 144,660
Other Europe 245,945 232,105 10,857 242,962 (16,441) 337,720
Total Europe 396,165 425,187 248,651 673,838 20,699 912,816
United States 297,688 335,630 32,009 367,639 (14,176) 589,775
Other Americas 71,403 37,330 165 37,495 (3,245) 32,941
Total Americas 369,091 372,960 32,174 405,134 (17,421) 622,716
Asia and other 113,159 80,268 1,834 82,102 1,413 63,453
Eliminations — — (282,659) (282,659) (10,643) (849,672)
Totals $878,415 $878,415 $ — $ 878,415 $ (5,952) $ 749,313
(1) Includes Corporate.(2) The period October 15,1996 to December 31,1996 includes the effect of non-recurring Acquisition charges arising from in-process research and development projects
($114,100) and the revaluation of inventories to fair value ($32,200) which are comprised by region as follows: Europe, $108,100; Americas, $36,000; and Asia/Rest of World, $2,200.

42
Mettler-Toledo International Inc.
Note 17QUARTERLY FINANCIAL DATA (UNAUDITED)
Quarterly financial data for the years 1996 and 1997 are as follows:
First Second Third FourthQuarter Quarter (1) Quarter Quarter (2)
1996
Net sales $201,373 $222,429 $200,391 $ 224,940
Gross profit 80,394 91,204 79,013 66,463
Net income (loss) $ 929 $ 9,078 $ 3,129 $(157,721)
1997
Net sales $197,402 $220,412 $215,929 $ 244,672
Gross profit 83,282 97,016 94,365 110,272
Net income (loss) before extraordinary items (1,122) (25,613) (284) 3,110
Extraordinary items — (9,552) — (31,645)
Net income (loss) $ (1,122) $(35,165) $ (284) $ (28,535)
Basic earnings (loss) per common share:Earnings (loss) before extraordinary items $ (0.04) $ (0.84) $ (0.01) $ 0.09
Extraordinary items — (0.31) — (0.92)
Net loss $ (0.04) $ (1.15) $ (0.01) $ (0.83)
Diluted earnings (loss) per common share:Earnings (loss) before extraordinary items $ (0.04) $ (0.84) $ (0.01) $ 0.09
Extraordinary items — (0.31) — (0.88)
Net loss $ (0.04) $ (1.15) $ (0.01) $ (0.79)
Market price per share(3)
High — — — 18 3⁄4
Low — — — 14 1⁄16
(1) The financial data for the second quarter of 1997 includes charges in connection with the Safeline Acquisition, as discussed in Note 3, for the sale of inventories revalued to fairvalue of $2,054 and in-process research and development of $29,959. The second quarter also includes extraordinary charges for the write-off of capitalized debt issuancefees of $9,552 as discussed in Note 9.
(2) The financial data for the fourth quarter of 1996 represents the Company’s combined results of operations for the period from October 1,1996 to October 14,1996 and for theperiod from October 15,1996 to December 31,1996. The period from October 15,1996 to December 31,1996 includes charges in connection with the Acquisition, as discussed in Note 1, for the sale of inventories revalued to fair value of $32,194 and in-process research and development of $114,070. The fourth quarter 1997 data includescharges for the early extinguishment of debt and the write-off of capitalized debt issuance fees totaling $31,645 as further discussed in Note 9.
(3) The Company’s shares began trading on the New York Stock Exchange on November 14,1997.
The following selected historical financial information at December 31, 1994, 1995, 1996 and 1997, for the years ended December 31, 1993, 1994 and 1995,for the period from January 1, 1996 to October 14, 1996, for the period from October 15, 1996 to December 31, 1996 and for the year ended December 31,1997 is derived from the Company’s financial statements, which were audited by KPMG Fides Peat, independent auditors. The financial information for allperiods prior to October 15, 1996, the date of the Acquisition, is combined financial information of the Mettler-Toledo Group (the “Predecessor Business”).The combined historical data of the Predecessor Business and the consolidated historical data of the Company are not comparable in many respects due tothe Acquisition and the Safeline Acquisition. See Management’s Discussion and Analysis of Financial Condition and Results of Operations and the consoli-dated financial statements and accompanying notes included herein. The following financial information was prepared in accordance with generallyaccepted accounting principles in the United States.
Selected Financial Data

Mettler-Toledo International Inc.
Predecessor Business Mettler-Toledo International Inc.
January 1 to October 15 to Year EndedYear Ended December 31, October 14, December 31, December 31,
(In thousands, except per share data) 1993 1994 1995 1996 1996 1997Statement of Operations Data:
Net sales $728,958 $769,136 $850,415 $662,221 $ 186,912 $878,415
Cost of sales 443,534 461,629 508,089 395,239 136,820(b) 493,480(d)
Gross profit 285,424 307,507 342,326 266,982 50,092 384,935
Research and development 46,438 47,994 54,542 40,244 9,805 47,551
Selling, general and administrative 209,692 224,978 248,327 186,898 59,353 260,397
Amortization 2,917 6,437 2,765 2,151 1,065 6,222
Purchased research and development — — — — 114,070(c) 29,959(e)
Interest expense 15,239 13,307 18,219 13,868 8,738 35,924
Other charges (income), net (f) 14,110 (7,716) (9,331) (1,332) 17,137 10,834
Earnings (loss) before taxes, minority interest and extraordinary items (2,972) 22,507 27,804 25,153 (160,076) (5,952)
Provision for taxes 3,041 8,676 8,782 10,055 (938) 17,489
Minority interest 1,140 347 768 637 (92) 468
Earnings (loss) before extraordinary items (7,153) 13,484 18,254 14,461 (159,046) (23,909)
Extraordinary items – debt extinguishments — — — — — (41,197)(g)
Net earnings (loss) $ (7,153) $ 13,484 $ 18,254 $ 14,461 $(159,046) $ (65,106)
Basic and diluted loss per common share (h):
Loss per common share before extraordinary items $ (5.18) $ (0.76)
Extraordinary items — (1.30)
Loss per common share $ (5.18) $ (2.06)Weighted average number of common shares 30,686,065 31,617,071
Balance Sheet Data (at end of period)(a):
Cash and cash equivalents $ 63,802 $ 41,402 $ 60,696 $ 23,566
Working capital 132,586 136,911 103,697 79,163
Total assets 683,198 724,094 771,888 749,313
Long-term third party debt 862 3,621 373,758 340,334
Net borrowing from Ciba and affiliates(i) 177,651 203,157 — —
Other long-term liabilities (j) 83,964 84,303 96,810 91,011
Shareholders’ equity (k) 228,194 193,254 12,426 25,399
(a) Balance sheet information at December 31,1993 is not available. (b) In connection with the Acquisition, the Company allocated $32,194 of the purchase price to revalue certain inventories (principally work-in-progress and finished goods) to fair
value (net realizable value). Substantially all such inventories were sold during the period October 15,1996 to December 31,1996.(c) In connection with the Acquisition, the Company allocated, based upon independent valuations, $114,070 of the purchase price to purchased research and development in
process. This amount was recorded as an expense immediately following the Acquisition.(d) In connection with the Safeline Acquisition, the Company allocated $2,054 of the purchase price to revalue certain inventories (principally work-in-progress and finished goods)
to fair value (net realizable value). Substantially all such inventories were sold during the second quarter of 1997.(e) In connection with the Safeline Acquisition, the Company allocated, based upon independent valuations, $29,959 of the purchase price to purchased research and development
in process. This amount was recorded as an expense immediately following the Safeline Acquisition.(f) Other charges (income), net generally includes interest income, foreign currency transactions (gains) losses, (gains) losses from sales of assets and other charges (income).
In 1993, the amount shown includes costs associated with the closure of a manufacturing facility in Cologne, Germany, the restructuring of certain manufacturing operationsand an early retirement program in the United States. For the period January 1, 1996 to October 14,1996, the amount shown includes employee severance and other exit costsassociated with the closing of the Company’s Westerville, Ohio facility. For the period October 15,1996 to December 31,1996, the amount shown includes employee severancebenefits associated with the Company’s general headcount reduction programs in Europe and North America and the realignment of the analytical and precision balance business in Switzerland. For the period ended December 31,1997, the amount shown includes a restructuring charge of $6,300 to close three facilities in North America. See Note 14 to the consolidated financial statements included herein.
(g) Represents charges for the write-off of capitalized debt issuance fees and related expenses associated with the Company’s previous credit facilities as well as the prepaymentpremium on the Senior Subordinated Notes and the write-off of the related capitalized debt issuance fees.
(h) Effective December 31,1997, the Company adopted the Statement of Financial Accounting Standards No. 128, “Earnings per Share” (“SFAS 128”). Accordingly, basic and diluted loss per common share data for each period presented have been determined in accordance with the provisions of SFAS 128. Outstanding options to purchase shares of common stock were not included in the computation of diluted loss per common share for the periods ended December 31,1996 and 1997, as the effect is antidilutive.
(i) Includes notes payable and long-term debt payable to Ciba and affiliates less amounts due from Ciba and affiliates. (j) Consists primarily of obligations under various pension plans and plans that provide postretirement medical benefits. See Note 12 to the consolidated financial statements
included herein.(k) Shareholders’ equity for the Predecessor Business consists of the combined net assets of the Mettler-Toledo Group.
43
Selected Financial Data (continued)

44
Mettler-Toledo International Inc.
CORPORATE OFFICESMettler-Toledo International Inc.Im LangacherP.O. Box MT-100CH-8606 Greifensee, Switzerland+41-1-944 22 11Fax +41-1-944 30 60
STOCK EXCHANGEShares of Mettler-Toledo International Inc. common stock are traded on the New York Stock Exchange under the listing MTD.
DIVIDEND POLICYThe Company has never paid any dividends on its common stock.The Company presently intends to retain earnings to finance theoperations and expansion of its business and therefore does notanticipate paying any cash dividends in the foreseeable future.
TRANSFER AGENT AND REGISTRARChaseMellon Shareholder Services L.L.C. acts as primary TransferAgent and Registrar for the Company. Questions on change of ownership, total shares owned, consolidation of accounts and other such matters should be sent to:
ChaseMellon Shareholder Services85 Challenger RoadRidgefield Park, New Jersey 076601-800-851-96771-201-329-8660http://www.chasemellon.com
INDEPENDENT AUDITORSKPMG, Zurich, Switzerland, is the independent public accountingfirm for the Company.
ANNUAL MEETINGThe annual meeting of shareholders will be held at 10:00 a.m. onMonday, May 18, 1998 at Chase Securities Inc., 270 Park Avenue,New York, New York 10017. A notice of the meeting, together with a form of proxy and a proxy statement, will be mailed toshareholders on or about March 31, 1998.
INTERNETCompany and product information is available at our World WideWeb site at the following address:
http://www.mt.com
TRADEMARKS
The following registered and unregistered trademarks, found in thisannual report, are among those used by METTLER TOLEDO: Mettler Toledo, Mettler, Safeline, FACT, MIRA, Jaguar, PILAR, Tiger,MonoBloc and Ohaus.
FORM 10-K
Mettler-Toledo International Inc.’s Form 10-K filed with the Securitiesand Exchange Commission for the year ended December 31,1997is available to shareholders upon written request to the InvestorRelations Department at the corporate offices.
INVESTOR RELATIONS
Security analysts, investment professionals and shareholdersshould direct their business-related inquiries and requests for information to:
William P. Donnelly, Chief Financial Officer+41-1-944 22 62
Corporate Information
WORLDWIDE FACILITIES
Europe
Vienna, AustriaLot, BelgiumZagreb, CroatiaPrague, Czech RepublicGlostrup, DenmarkCambridge, EnglandLeicester, EnglandSalford (Manchester),
EnglandParis, FranceViroflay, FranceAlbstadt, GermanyGiesen, GermanyGiessen, GermanySteinbach, GermanyBudapest, HungaryNovate Milanese, ItalyTiel, NetherlandsOslo, NorwayWarsaw, PolandMoscow, RussiaBratislava, SlovakiaLjubljana, SloveniaBarcelona, SpainStockholm, SwedenGreifensee, SwitzerlandNänikon, SwitzerlandSchwerzenbach, SwitzerlandUrdorf, SwitzerlandUznach, Switzerland
North America
Burlington, CanadaTampa, FloridaWilmington, MassachusettsMexico City, MexicoFlorham Park, New JerseyHightstown, New JerseyIthaca, New YorkWorthington, OhioSpartanburg, South CarolinaFranksville, Wisconsin
South America
Alphaville, Brazil
Asia
Melbourne, AustraliaChangzhou, ChinaShanghai, ChinaHong Kong, Hong KongBombay, IndiaOsaka, JapanPetaling Jaya, MalaysiaSingapore, SingaporeSeoul, South KoreaTaipei, TaiwanBangkok, Thailand
P re c i s i o n Ba l an ce s
Ti t r a t o r s
pH Me te r s
The rma l Ana l y s i s S y s t ems
Au t oma t i c L ab Reac t o r s
E l e c t r o de s
Dens i t y Me t e r s / Re f r a c t ome t e r s
Pha rmaceu t i c a l
Chem i ca l s
Cosme t i c s
Food and Beve r age
Me t a l s
E l e c t r o n i c s
P l a s t i c s / Ru bb e r
Jewe l r y a n d P r e c i o u s Me t a l s
Edu ca t i o n a l I n s t i t u t i o n s
Gove r nmen t S t anda r d s L ab s
Pha rmaceu t i c a l
Chem i ca l s
Cosme t i c s
Food and Beve r age
Me t a l s
E l e c t r o n i c s
P l a s t i c s / Rubbe r
Tr an spo r t a t i o n
Supe rma r ke t s /G r o ce r i e s
L a b o r a t o r y I n d u s t r i a l / R e t a i l
Mar
kets
Pro
duct
s &
App
licat
ions
Perform precision weighing functions vital to research and development and quality control.
Provide accurate measures of the composition of solutions.
Measure acidity of solutions.
Measure different properties (weight, dimension, energy flow) of materials at various temperatures.
Simulate an entire chemical manufacturing process in the lab to ensure its safety and feasibility
before proceeding to production.
Used in pH meters and titrators as well as in in-line applications to monitor production processes.
Measure density and concentrations in solutions.
Provide weighing data and data processing solutions for goods receiving, manufacturing
processes and shipping applications.
Perform in-line weight control of packaged goods.
Ensure control of processed material and packaged goods for metal contamination.
Measure package volumes; can be integrated with industrial weighing equipment for complete
and accurate freight tariff calculation.
Provide information to in-store computers for the handling of perishable goods from backroom
to self-service and deli counters to checkout counters; can be networked with scanners, cash
registers and backroom equipment.
Weigh and label products; can be networked with weighing technology at the counter, checkout
and backroom.
I n du s t r i a l We i g h i n g S y s t e m s
Che c k w e i g h i n g S y s t e m s
Me ta l D e t e c t i o n S y s t e m s
D i m e n s i o n i n g S y s t e m s
Re t a i l S c a l e S y s t e m s
P r e p a c k a g i n g S y s t e m s
Titrators CheckweighingSystems
Density Meters Metal DetectorsCounter Scales
Industrial WeighingSystems
pH Meters Thermal AnalysisSystems
Automatic Lab Reactors
ElectrodesDimensioningSystems Prepackaging
Systems
Self-Service ScalesPrecision Balances
Mettler-Toledo International Inc.
PHILIP CALDWELLChairman of the Board*Senior Managing Director, Lehman Brothers Inc.;Retired Chairman of the Board and Chief Executive Officer, Ford Motor CompanyDirector since 1996
REGINALD H. JONES2
Retired Chairman of the Board and Chief Executive Officer, General Electric CompanyDirector since 1996
JOHN D. MACOMBER1
Principal, JDM Investment Group; Former Chairman and President,Export-Import Bank of the United StatesDirector since 1996
JOHN M. MANSERTreasurer,Novartis International AGDirector since 1996
LAURENCE Z.Y. MOH2
Chairman Emeritus,Universal Furniture LimitedDirector since 1996
THOMAS P. SALICE1, 2
Managing Director,AEA Investors Inc.Director since 1996
ROBERT F. SPOERRYPresident and Chief Executive Officer*Director since 1996
ALAN W. WILKINSON1
Managing Director, AEA Investors Inc. Director since 1996
1 Member of the Audit Committee2 Member of the Compensation Committee
*As of May 18, 1998, Robert F. Spoerry, President and Chief Executive Officer, will become Chairman of the Board. Philip Caldwell will step down as Chairman, but will remain a member of the Board.
LUKAS BRAUNSCHWEILERHead, Industrial and Retail, Europe
PETER BÜRKERHead, Human Resources
WILLIAM P. DONNELLYChief Financial Officer
KARL M. LANGHead, Laboratory Division
JOHN D. ROBECHEKHead, Industrial and Retail, Americas
THOMAS RUBBEHead, Logistics and Information Systems
ROBERT F. SPOERRYPresident and Chief Executive Officer
Board of Directors Corporate Officers
45

1 9 9 7 A n n u a l R e p o r t
Global Leadershipi n p r e c i s i o n i n s t r u m e n t s
METTLER TOLEDOCH-8606 Greifensee, SwitzerlandTelephone +41-1- 944 22 11http://www.mt.com
Printed in the U.S.A.
A b o u t t h e C o m p a n y
Mettler-Toledo International Inc. is a leading global supplier of precision instruments. The Company is the world’s
largest manufacturer and marketer of weighing instruments for use in laboratory, industrial and food retailing
applications. The Company also holds one of the top three market positions in several related analytical instruments,
including titrators, thermal analysis systems, pH meters, automatic lab reactors and electrodes. In addition, it is the
world’s largest manufacturer and marketer of metal detection systems used in production and packaging.
METTLER TOLEDO focuses on the high value-added segments of its markets by providing innovative instruments
that are often integrated into application-specific solutions for customers. The Company designs its instruments not only
to gather valuable data but also to facilitate the processing and transfer of this data into customers’ management
information systems.
Headquartered in Greifensee, Switzerland, METTLER TOLEDO serves customers worldwide through its own sales
and service organization, and it has a manufacturing presence in Europe, the United States and Asia. The Company has
approximately 6,800 employees.
METTLER TOLEDO became a public company on November 14, 1997. Previously, it was privately held by manage-
ment and AEA Investors Inc., which together purchased the METTLER TOLEDO Group from Ciba-Geigy AG in October
1996. Management and employees continue to maintain a sizable ownership stake in METTLER TOLEDO.
C o n t e n t s
Financial Highlights...............................................1
Letter to Shareholders.............................................2
Quality.................................................................6
Technology.........................................................10
Global Presence..................................................14
Management’s Discussion and Analysis...................18
Independent Auditors’ Report.................................25
Consolidated Financial Statements..........................26
Selected Financial Data.........................................42
Corporate Information...........................................44
Board of Directors and Officers...............................45
Portions of this report may contain ”forward-looking statements” under the Private Securities
Litigation Reform Act of 1995. The forward-looking statements in this report are subject to risks
and uncertainties that could cause actual events or results to differ materially from those expressed
in or implied by the statements. Further information concerning issues that could materially affect
financial performance is contained in the ”Forward-Looking Statements” section of Management’s
Discussion and Analysis in this report and in the Company’s periodic filings with the Securities and
Exchange Commission.