ghana national education assessment · ghana national education assessment ... 4.8 test...
TRANSCRIPT

Ghana National Education
Assessment
Operations Manual
February 2011
Ministry of Education Ghana Education Service Assessment Services Unit

Ghana National Education Assessment Operations Manual
February 2011 Prepared by the Assessment Services Unit (ASU), Curriculum Research and Development Division (CRDD), Ghana Education Service Contributors: Mr. Isaac Asiegbor Mr. Fofie Asiedu Mr. Antwi Aning Mr. Yaw Seidu Mr. Kwabena Nyamekye Prof. Francis Amedahe Mr. Anthony Sarpong Prof. Kofi Mereku Mr. John K. Adu Prof. Kafui Etsey Mr. Emmanuel Acquaye
This manual was made possible by the support of the American people through the United States Agency for International Development (USAID) through technical assistance and direct funding support to the Ministry of Education and the Ghana Education Service. The contents of this report are the responsibility of RTI International and do not necessarily reflect the views of USAID or the United States Government. Funded under EdData II Technical and Managerial Assistance, Task Number 12, Contract Number AID-641-BC-11-00001, Strategic Objective 3. Submitted to Luis Tolley, USAID/Ghana; and Sandra Bertoli, Office of Education, Bureau for Economic Growth, Agriculture and Trade (EGAT/ED), USAID/Washington. RTI contributors: Chris Cummiskey, Elizabeth Gichumbi, Jamie Friedman, Tracy Kline, and Pierre Varly, RTI International, 3040 Cornwallis Road, Post Office Box 12194, Research Triangle Park, North Carolina, 27709-2194, USA. RTI International is a trade name of Research Triangle Institute.
iii
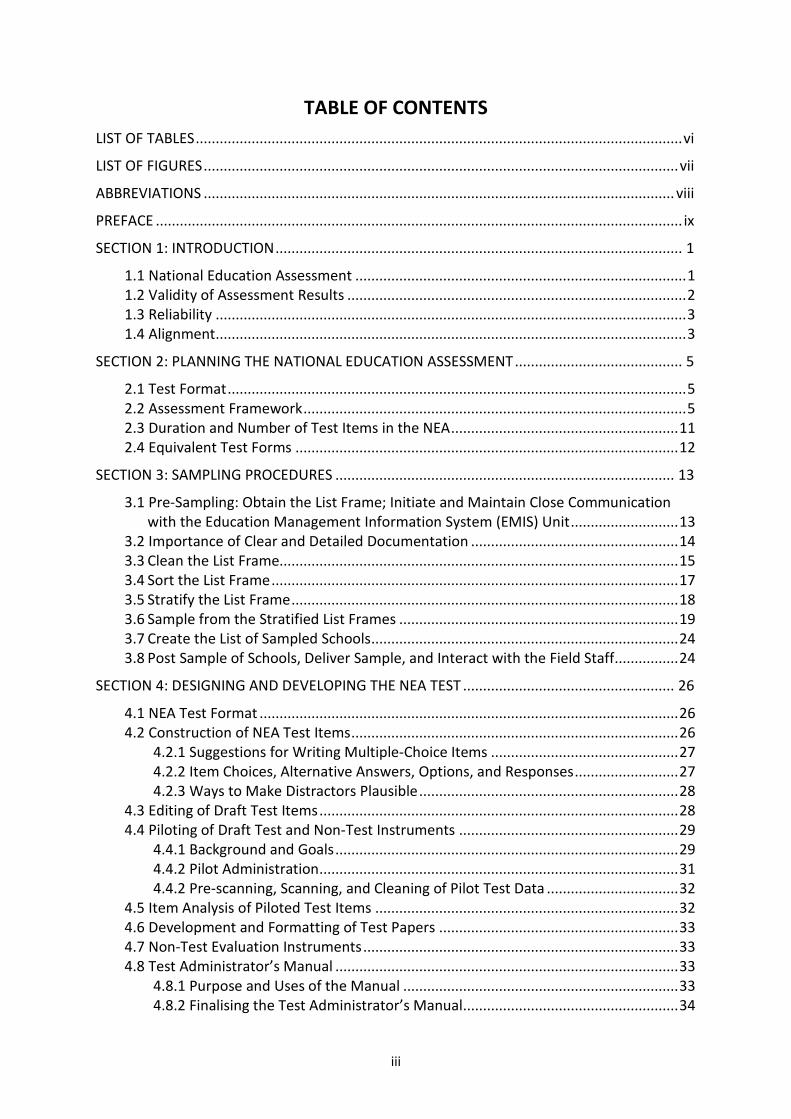
TABLE OF CONTENTS LIST OF TABLES .......................................................................................................................... vi
LIST OF FIGURES ....................................................................................................................... vii
ABBREVIATIONS ...................................................................................................................... viii
PREFACE .................................................................................................................................... ix
SECTION 1: INTRODUCTION ...................................................................................................... 1
1.1 National Education Assessment ................................................................................... 1 1.2 Validity of Assessment Results ..................................................................................... 2 1.3 Reliability ...................................................................................................................... 3 1.4 Alignment ...................................................................................................................... 3
SECTION 2: PLANNING THE NATIONAL EDUCATION ASSESSMENT .......................................... 5
2.1 Test Format ................................................................................................................... 5 2.2 Assessment Framework ................................................................................................ 5 2.3 Duration and Number of Test Items in the NEA ......................................................... 11 2.4 Equivalent Test Forms ................................................................................................ 12
SECTION 3: SAMPLING PROCEDURES ..................................................................................... 13
3.1 Pre-Sampling: Obtain the List Frame; Initiate and Maintain Close Communication with the Education Management Information System (EMIS) Unit ........................... 13
3.2 Importance of Clear and Detailed Documentation .................................................... 14 3.3 Clean the List Frame.................................................................................................... 15 3.4 Sort the List Frame ...................................................................................................... 17 3.5 Stratify the List Frame ................................................................................................. 18 3.6 Sample from the Stratified List Frames ...................................................................... 19 3.7 Create the List of Sampled Schools ............................................................................. 24 3.8 Post Sample of Schools, Deliver Sample, and Interact with the Field Staff ................ 24
SECTION 4: DESIGNING AND DEVELOPING THE NEA TEST ..................................................... 26
4.1 NEA Test Format ......................................................................................................... 26 4.2 Construction of NEA Test Items .................................................................................. 26
4.2.1 Suggestions for Writing Multiple-Choice Items ............................................... 27 4.2.2 Item Choices, Alternative Answers, Options, and Responses .......................... 27 4.2.3 Ways to Make Distractors Plausible ................................................................. 28
4.3 Editing of Draft Test Items .......................................................................................... 28 4.4 Piloting of Draft Test and Non-Test Instruments ....................................................... 29
4.4.1 Background and Goals ...................................................................................... 29 4.4.2 Pilot Administration .......................................................................................... 31 4.4.2 Pre-scanning, Scanning, and Cleaning of Pilot Test Data ................................. 32
4.5 Item Analysis of Piloted Test Items ............................................................................ 32 4.6 Development and Formatting of Test Papers ............................................................ 33 4.7 Non-Test Evaluation Instruments ............................................................................... 33 4.8 Test Administrator’s Manual ...................................................................................... 33
4.8.1 Purpose and Uses of the Manual ..................................................................... 33 4.8.2 Finalising the Test Administrator’s Manual ...................................................... 34

iv
SECTION 5: ADMINISTRATIVE PROCEDURES .......................................................................... 35
5.1 Budgeting .................................................................................................................... 35 5.2 NEA Implementation Programme .............................................................................. 36 5.3 Procurement of Test Materials ................................................................................... 36 5.4 Printing of Test Items .................................................................................................. 37 5.5 Allocation and Packaging of Test Materials ................................................................ 37
5.5.1 Overview of Allocating Materials to Schools .................................................... 37 5.5.2 Steps for Allocating Materials .......................................................................... 38
5.6 Packaging and Transporting Test Materials to Regional Centres ............................... 39 5.6.1 Test Materials Assembly Steps ......................................................................... 39 5.6.2 Test Materials Packaging Steps ........................................................................ 39 5.6.3 Receipt of Test Materials at Regional Offices .................................................. 40 5.6.4 Collection of Test Materials from Regional Offices .......................................... 40
5.7 Roles and Responsibilities of Directors of Education and Circuit Supervisors ........... 40 5.7.1 Regional Education Office ................................................................................ 40 5.7.2 District Education Office ................................................................................... 41 5.7.3 Circuit Supervisors ............................................................................................ 41 5.7.4 School Personnel .............................................................................................. 41
5.8 Administration of NEA and Monitoring ...................................................................... 41 5.8.1 Selection of Test Administrators ...................................................................... 41 5.8.2 Trainers of Test Administrators ........................................................................ 41 5.8.3 Test Administration Training Programme ........................................................ 42 5.8.4 Registration of Participants at the Training ..................................................... 42 5.8.5 Selecting the Date for Administering the NEA Tests ........................................ 42 5.8.6 Monitoring ........................................................................................................ 43
SECTION 6: HANDLING OF COMPLETED TEST MATERIALS ..................................................... 44
6.1 Retrieval of Security Bags ........................................................................................... 44 6.2 Receipting Process ...................................................................................................... 44 6.3 Storage ........................................................................................................................ 45 6.4 Management of Missing Items ................................................................................... 45 6.5 Pre-Scanning and Editing (Answer Sheets) ................................................................. 45
6.5.1 Completely Blank Answer Sheets ..................................................................... 46 6.5.2 Partially Blank Answer Sheets .......................................................................... 46 6.5.3 Errors in Top Part of Answer Sheet .................................................................. 46 6.5.4 Errors in Shading Answers ................................................................................ 46 6.5.5 Damaged Answer Sheets .................................................................................. 47
6.6 Scanning Process (Answer Sheets) ............................................................................. 47 6.7 Data Cleaning .............................................................................................................. 48
SECTION 7: STATISTICAL ANALYSIS OF DATA .......................................................................... 51
7.1 Data Analysis: Why Is It Important? ........................................................................... 51 7.2 General Education Assessment Framework ............................................................... 51 7.3 Research Questions or Policy Issues ........................................................................... 54 7.4 Indicators Calculation from EMIS Data ....................................................................... 57 7.5 Analysing Items ........................................................................................................... 59 7.6 Calculating Final Scores .............................................................................................. 63

v
7.7 Sample Design ............................................................................................................. 66 7.7.1 Definitions ........................................................................................................ 66 7.7.2 Application to NEA ............................................................................................ 66
7.8 Sample Size ................................................................................................................. 67 7.9 Application of Sampling Weights ................................................................................ 67 7.10 One-Way Frequencies .............................................................................................. 69 7.11 Two-Way Frequencies .............................................................................................. 72 7.12 Regression and Logistics Models .............................................................................. 77 7.13 How Should We Interpret These Results? ................................................................ 79 7.14 Teachers’ Practice, the Unknown Parameter ........................................................... 80
SECTION 8: REPORTING OF RESULTS ...................................................................................... 82
8.1 Target Audience and Report Formats ......................................................................... 82 8.2 Contents of the NEA Findings Report ......................................................................... 82 8.3 Contents of the Executive Summary .......................................................................... 84 8.4 Dissemination of NEA Results ..................................................................................... 84
Appendix A. Vocabulary Sheet: Statistical Sampling, Weighting, and Documentation ........ 85
Appendix B. NEA Test Material Allocation Form (TMAF) ....................................................... 87
vi
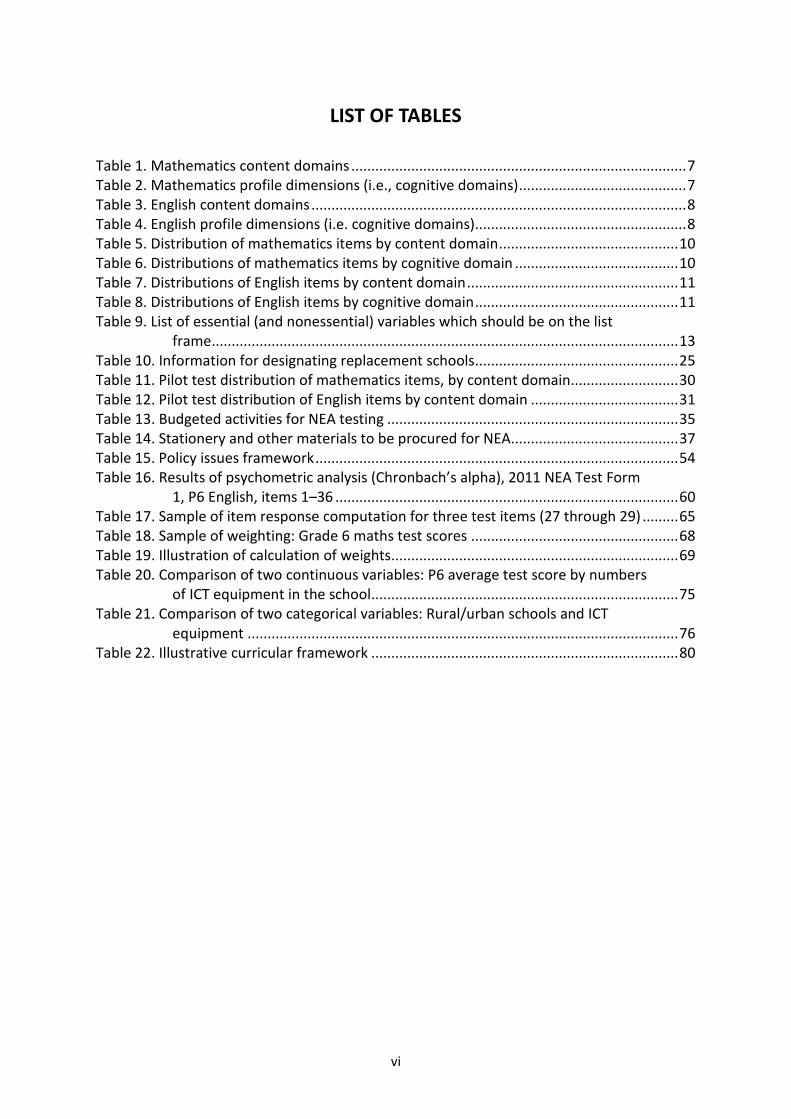
LIST OF TABLES Table 1. Mathematics content domains .................................................................................... 7 Table 2. Mathematics profile dimensions (i.e., cognitive domains) .......................................... 7 Table 3. English content domains .............................................................................................. 8 Table 4. English profile dimensions (i.e. cognitive domains) ..................................................... 8 Table 5. Distribution of mathematics items by content domain ............................................. 10 Table 6. Distributions of mathematics items by cognitive domain ......................................... 10 Table 7. Distributions of English items by content domain ..................................................... 11 Table 8. Distributions of English items by cognitive domain ................................................... 11 Table 9. List of essential (and nonessential) variables which should be on the list
frame ..................................................................................................................... 13 Table 10. Information for designating replacement schools ................................................... 25 Table 11. Pilot test distribution of mathematics items, by content domain ........................... 30 Table 12. Pilot test distribution of English items by content domain ..................................... 31 Table 13. Budgeted activities for NEA testing ......................................................................... 35 Table 14. Stationery and other materials to be procured for NEA .......................................... 37 Table 15. Policy issues framework ........................................................................................... 54 Table 16. Results of psychometric analysis (Chronbach’s alpha), 2011 NEA Test Form
1, P6 English, items 1–36 ...................................................................................... 60 Table 17. Sample of item response computation for three test items (27 through 29) ......... 65 Table 18. Sample of weighting: Grade 6 maths test scores .................................................... 68 Table 19. Illustration of calculation of weights ........................................................................ 69 Table 20. Comparison of two continuous variables: P6 average test score by numbers
of ICT equipment in the school ............................................................................. 75 Table 21. Comparison of two categorical variables: Rural/urban schools and ICT
equipment ............................................................................................................ 76 Table 22. Illustrative curricular framework ............................................................................. 80

vii
LIST OF FIGURES Figure 1. Create sheets in sampling document and label them ‘EMIS Data’,
‘Population’, and ‘Summary’ ................................................................................ 14 Figure 2. The ‘Population’ sheet before the double-entered schools are removed ............... 16 Figure 3. Sample of exclusion of schools with P3 enrolment less than 10 .............................. 17 Figure 4. ‘Summary’ sheet indicating exclusions ..................................................................... 17 Figure 5. Sample of sorting framework ................................................................................... 18 Figure 6. Sample of regional stratum labels ............................................................................ 18 Figure 7. Sample documentation of stratification variables ................................................... 19 Figure 8. Sample of completed stratification by region .......................................................... 19 Figure 9. Sample of coding for selected replacement schools: Select1, School #6 ................. 21 Figure 10. Sample of Summary sheet for selected schools, by region .................................... 22 Figure 11. Sample of coding for selected and replacement schools: Select3, School
#100 ...................................................................................................................... 23 Figure 12. Sample of missing values for ‘Class’ and ‘Subject’ ................................................. 50 Figure 13. SSME data framework ............................................................................................ 53 Figure 14. EMIS data framework for NEA analysis .................................................................. 58 Figure 15a. P3 English Form 1: Item difficulty index ............................................................... 61 Figure 15b. P6 English Form 1: Item difficulty index ............................................................... 62 Figure 15c. P3 mathematics Form 1: Item difficulty index ...................................................... 62 Figure 15d. P6 mathematics Form 4: Item difficulty index ..................................................... 63 Figure 16. Sample: Percentage of P6 pupils reaching minimum competency and
proficiency in mathematics .................................................................................. 65 Figure 17. P6 English score distribution, urban/rural .............................................................. 70 Figure 18. Excel presentations: Categorical variables ............................................................. 71 Figure 19. Comparison of two continuous variables: Scatter plot, relationship
between textbooks-per-pupil ratio in English and maths .................................... 72 Figure 20. Comparison of one categorical and one continuous variable: Box plot, P6
English score by region ......................................................................................... 74 Figure 21. Comparison of two categorical subsample variables: Average scores of
urban schools vs. rural schools ............................................................................. 77

viii
ABBREVIATIONS AK Application of Knowledge ASU Assessment Services Unit CRDD Curriculum Research and Development Division EdData II Education Data for Decision Making (project) EMIS education management information system EMS Expedited Mail Services FAQ frequently asked questions GES Ghana Education Service ICT information and communication technology ID identification JHS junior high school KR 21 Kuder-Richardson Formula 21 KR 20 Kuder-Richardson Formula 20 KU Knowledge and Understanding MOE Ministry of Education NALAP National Literacy Acceleration Programme NEA National Education Assessment P3 primary school, grade 3 P4 primary school, grade 4 P6 primary school, grade 6 QE5 MOE Strategic Plan (2003–2015) sub-section 5 QE6 MOE Strategic Plan (2003–2015) sub-section 6 RTI RTI International (trade name of Research Triangle Institute) SACMEQ Southern and Eastern Africa Consortium for Monitoring Educational
Quality SEA School Education Assessment SMC school management committee SSME Snapshot of School Management Effectiveness TA test administrator TMAF Test Material Allocation Form TWG Technical Working Group UK Use of Knowledge UNESCO United Nations Educational, Scientific, and Cultural Organization USAID United States Agency for International Development

ix
PREFACE Objective of the Handbook The objective of this handbook is to provide clear and unambiguous processes and procedures for running the National Education Assessment (NEA). The document provides guidelines for training new officers on the job and hence ensuring the sustainability of the NEA process. The handbook serves as a reference source of information on NEA for the Assessment Services Unit (ASU) and other stakeholders.
Structure of the Handbook This handbook begins with a general introduction, followed by eight sections and two appendices. Tables and figures have been inserted into some sections to throw more light onto the processes and procedures for implementing the NEA.

1
SECTION 1: INTRODUCTION Educational assessment is the process of gathering information about learners and using the information to make decisions. It involves measuring pupils’ achievement during or after instruction. Assessment of students or pupils is a means to an end. The data collected are used to make decisions about students’ progress, to design or modify programmes, and to facilitate policy formulation to ensure improvement. Assessment is a way of finding out whether teaching and learning objectives are achieved and the extent to which learning is taking place. Assessment, therefore, provides evidence of how the schools are doing, and whether the pupils are receiving value for money. The quality of education envisaged and provided is ascertained through the assessment or evaluation of pupils’ performance. Any deficiencies detected in pupils’ performance should be clearly communicated to the relevant stakeholders.
Assessment is a management tool for improving instruction as well as informing policy formulation for quality education. It is one of the three essential components of the process of education. The other two are Curriculum and Instruction. All three elements of the education process are interrelated: Ignore one, and the education process is incomplete. Talking about quality of education in the absence of assessment or evaluation is, to a large extent, pointless.
1.1 National Education Assessment
The National Education Assessment (NEA) is a type of evaluation and has all four attributes of an evaluation:
• Systematic collection of evidence • Interpretation of evidence • Value judgment made about what is being evaluated • Action orientation.
In Ghana, test information has consistently indicated severe problems in the learning repertoires for most pupils, and these problems have persisted over generations of children. Testing helps to identify the problems of students and hold schools and teachers accountable. The challenge is to produce a high-quality assessment programme that will document progress and provide a guide to improve the system, the school, and the pupil. The response to this challenge and to the Ministry of Education’s (MOE’s) Education Strategic Plan (2003–2015) sub-sections 5 and 6, dubbed QE5 and QE6, is the development of a reliable and comprehensive assessment system. The NEA is a component of this system.
The NEA provides an overall summary report card for the country in mathematics and English—thus giving the MOE and Ghana Education Service (GES) reliable and useful information for evaluating the quality of primary school education in Ghana. The tests are for primary school, grades 3 (P3) and 6 (P6) and are developed by a Technical Working Group (TWG), which consists of representatives from the GES and other educational organizations with experience in writing test items. Ghanaian university consultants and the staff of the Assessment Services Unit (ASU) of the Curriculum Research and Development

2
Division (CRDD) of the GES rate the syllabus objectives and choose those they identify as ‘core’. The development of the test items focuses on this set of core objectives.
1.2 Validity of Assessment Results
The NEA is to serve as the nation’s report card. To be able to perform this function properly, the NEA assessment results must be valid and reliable. The NEA is planned and developed in a way as to ensure the reliability and validity of the results.
Essentially, validity refers to the soundness or appropriateness of the interpretations and uses of students’ assessment results. It is the degree to which evidence and theory support the interpretation of assessment scores entailed by proposed uses of tests. Validity, therefore, emphasizes the interpretation of results and the uses to which the results are put. Validity is a matter of degree or magnitude. Various pieces of evidence are used to validate the uses and interpretation of assessment results. These are:
• Content-related validity evidence • Criterion-related validity evidence • Construct-related validity evidence.
For the purposes of this document, it is expedient to highlight some of the factors that, in diverse ways, affect validity of assessment results. Generally, the factors include:
• The quality of the assessment instrument overall • The clarity or ambiguity of items or the assessment tasks • The quality of construction of items and clues • Administration of the test/instrument • Factors in scoring • Directions to students • Reading vocabulary level of students • Time limits for taking the test • Difficulty of test items • Appropriateness of test items for learning outcomes • The length of the test • The arrangement of items • Whether there are identifiable patterns of answers • Types of assistance given to individual testees • The potential for cheating in any form • Lighting and ventilation of the testing room • Level of noise or disruptions during the time of testing.
The above factors are considered in planning and developing the NEA tests. Other steps taken in the planning of the NEA tests are described in the later paragraphs of this section.

3
1.3 Reliability
Test reliability refers to the consistency of assessment results/scores over time on a population of individuals or groups. If test scores fluctuate widely, the scores are unreliable. Reliability is the degree to which students’ assessment results are similar when:
• They complete the same task(s) on two different occasions • They complete different but equivalent tasks on the same or different occasions • Two or more assessors score (mark) their performance on the same task(s) • The scores obtained by the same individuals are consistent when examined with the
same or equivalent/alternate test forms.
Reliability does not refer to the assessment instrument itself. It is a group characteristic and not an individual one. Similar to validity, it is measured in terms of degree, and the range of a reliability coefficient is from 0.00 to 1.00.
Methods of estimating reliability of assessment results include:
• Test–Retest Reliability (stability of scores) • Alternate/Equivalent Forms Reliability • Split-Half Reliability • Kuder-Richardson Formula 20 (KR 20) (items are of different difficulty levels) • Kuder-Richardson Formula 21 (KR 21) (items are of the same difficulty level) • Coefficient alpha (α) (both dichotomous scored and multiple-scored responses) • Interrater Reliability.
Almost all the factors that affect validity tend to affect reliability of assessment results. They include:
• The characteristics of the test items (e.g., ambiguity, unclear directions) • Test difficulty level • Test length (the longer the test, all things being equal, the higher the reliability) • Time allocated to the test • Subjectivity in scoring • Testing conditions (e.g., lighting, ventilation, and disruptive noise) • Group variability (i.e., homogeneous or heterogeneous).
These factors, either individually or collectively, affect the reliability of any assessment result and are taken into consideration in the planning and development of the NEA.
1.4 Alignment
In order for an assessment to be fair, it must be aligned. Alignment is a match between the assessment instruments and the curriculum, and it is analogous to instrumental or construct validity for the tests. Alignment is important because it is the foundation for credibility on assessment. There are three types of alignments: design, expert review, and document analysis.

4
• Design: The assessments are derived directly from the standards or objectives. • Expert review: Panels review the policy documents and assessments and make a
judgment on their alignment. • Document analysis: The formal documents are reviewed for congruence.
Full alignment of the NEA is essential in order to communicate the full intent and progress on that intent.
In the NEA, the alignment focuses on document analysis, using the curriculum, the former tests, and analytic matrices for rating or categorizing alignment; and then relies upon alignment by design for the development of test items. For purposes of this manual, the focus is content alignment. The criteria are those recommended by the U.S. National Science Foundation.
The items are aligned to the national curriculum (English and mathematics) to provide policy-level information regarding class management and system performance. Each test item is based on an objective of the English and mathematics syllabi.
The NEA is conducted by ASU staff in collaboration with the Regional and District/Municipal Directorates of Education. The 2011 implementation was supported in part by the United States Agency for International Development (USAID) through technical assistance and direct funding support to the Curriculum Research and Development Division.

5
SECTION 2: PLANNING THE NATIONAL EDUCATION ASSESSMENT Test planning is an integral component of an assessment process. To develop a test without a test plan is like constructing a building without a plan. A test without a plan may leave out important aspects. A planned test ensures that the test is representative of the content and skills to be tested—that is, it measures all the domains or profile dimensions.
2.1 Test Format
A variety of test formats have been considered in the selection of an appropriate test format for the NEA in terms of the testees’ (1) developmental level and (2) ability level.
Consequently, the multiple-choice format has been selected, based on the following:
• It has the potential to cover a wide content area of the curriculum. • It can be scored within a relatively short period. • The ultimate aim of the test is for policy formulation; therefore, the scoring must be
objective to give a more accurate assessment of the testees’ performance.
2.2 Assessment Framework
The NEA is based on the assessment framework described in the national teaching syllabi for primary school English and mathematics.1 The conceptual framework for the NEA is based on a three-strand model of the curriculum:
• The intended curriculum (syllabus/textbook requirements) • The implemented curriculum (what is actually taught) • The attained curriculum (what the students learn).
The implemented curriculum may be different from the intended due to factors that may be learner-related, teacher-related, or environmental.
The attained curriculum represents the extent to which the implemented curriculum has succeeded in achieving the curriculum goals. Based on this perspective of the educational process, the NEA aims at assessing the critical knowledge that pupils are expected to acquire and skills they should be able to demonstrate by the end of primary education, and not the entire curriculum. The alignment procedures described above ensure that the tests cover what can be judged as adequate (or not), in terms of minimum competency or mastery required by ALL learners to be successful.
The NEA mathematics and English assessment is organized around two dimensions: (1) a content dimension specifying the domains or subject matter to be assessed within each subject; and (2) a cognitive dimension specifying the domains or thinking processes to be assessed. In the national teaching syllabi for primary school, the latter is also referred to as
1 CRDD. (2001). Teaching syllabus for English: Primary school 1 - 6. Accra: Ministry of Education. CRDD. (2007). Teaching syllabus for English: Primary school 1 - 6. Accra: Ministry of Education. CRDD. (2001). Teaching syllabus for mathematics: Primary school 1 - 6. Accra: Ministry of Education. CRDD. (2007). Teaching syllabus for mathematics: Primary school 1 - 6. Accra: Ministry of Education.

6
the profile dimensions. The teaching syllabi describe the content domains in terms of the specific topic areas to be covered and the objectives within each topic. Each cognitive domain (or profile dimension) is described according to the sets of processing behaviours expected of students as they engage with the subject content.
The mathematics and English curriculum frameworks used at the two levels (Primary 3 and 6) for the NEA have four content domains. In English, the four content domains are:
• Listening • Reading Comprehension • Writing • Usage (Grammatical Structure).
In mathematics, the content domains are:
• Basic Operations • Numbers and Numerals • Measurement • Shapes and Space • Collecting and Handling Data.
Two cognitive domains (or profile dimensions) are redefined for learning the contents of the two subjects. In mathematics these are labelled Knowledge and Understanding (KU) and Application of Knowledge (AK); in English, they are labelled Knowledge and Understanding (KU) and Use of Knowledge (UK). Tables 1 and 2 show the mathematics content and cognitive domains for Primary 3 and 6, while Tables 3 and 4 show the English content and cognitive domains for Primary 3 and 6.

7
Table 1. Mathematics content domains
Primary 3 Primary 6
Basic Operations: basic number facts (the four basic operations on whole numbers; fractions and decimals)
Basic Operations: basic number facts (the four basic operations on whole numbers; fractions and decimals); ratio, proportion, and percent; mappings
Numbers and Numerals: whole numbers; fractions
Numbers and Numerals: whole numbers; fractions, decimals, and percentages
Measurement; Shapes and Space: lines and shapes; congruence, geometric measurements – length; spatial measurement – capacity; mass and time
Measurement; Shapes and Space: lines and angles; 2- and 3-dimensional shapes; congruence, geometric measurements—length, area, volume; spatial measurement; capacity; mass and time; number plane
Collecting and Handling Data: data collection and organisation in tables, data representation in charts, reading data presented in tables
Collecting and Handling Data: data collection and organisation in tables, data representation in charts, reading data presented in tables, probability
Table 2. Mathematics profile dimensions (i.e., cognitive domains)
Primary 3 Primary 6
Knowledge and Understanding (KU): remember, recall, identify, define, describe, list, name, match; state principles, facts, and concepts
Knowledge and Understanding (KU): remember, recall, identify, define, describe, list, name, match; state principles, facts, and concepts
Application of knowledge (AK): explain, summarize, translate, rewrite, paraphrase, give examples, generalize, estimate or predict consequences based upon a trend
Application of knowledge (AK): explain, summarize, translate, rewrite, paraphrase, give examples, generalize, estimate or predict consequences based upon a trend

8
Table 3. English content domains
Primary 3 Primary 6
Listening: recognition of words, phonics work, following directions and instructions, arranging months in sequential order, etc.
Listening: recognition of words, phonics work, following directions and instructions, arranging months in sequential order, etc.
Usage/Grammatical Structure: singular/plural nouns, tenses, subject-verb agreement, prepositions, correct use of English, short-answer forms, ordinals, etc.
Usage/Grammatical Structure: singular/plural nouns, tenses, use of modal auxiliaries, subject-verb agreement, prepositions, correct use of English, short-answer forms, question-and-answer tags, direct and reported speech, etc.
Reading Comprehension: reading and answering questions on short passages, etc.
Reading Comprehension: reading and answering questions on passages, etc.
Writing: punctuation, uppercase and lowercase letters, etc.
Writing: punctuation, letter writing, arranging events in the right order, observing road signs, debate, advertisements, etc.
Table 4. English profile dimensions (i.e. cognitive domains)
Primary 3 Primary 6
Knowledge and Understanding (KU): remember, recall, identify, define, describe, list, name, match; state principles, facts, and concepts
Knowledge and Understanding (KU): remember, recall, identify, define, describe, list, name, match; state principles, facts, and concepts
Use of Knowledge (UK): explain, summarise, translate, rewrite, paraphrase, give examples, generalise, estimate or predict consequences based upon a trend
Use of Knowledge (UK): explain, summarise, translate, rewrite, paraphrase, give examples, generalise, estimate or predict consequences based upon a trend
Even though at both levels (Primary 3 and 6), the assessment frameworks of the teaching syllabi place a great deal of emphasis on the higher profile dimensions (i.e., Application of Knowledge and Use of Knowledge), the teaching objectives stated for achieving these

9
emphasise the opposite.2 Therefore, in the NEA, the emphasis across the cognitive domains is such that the majority of the items assess the Knowledge and Understanding profile dimension in the two subjects.
The NEA assessment frameworks are developed through a national consensus-building process that involves inputs from the TWG, which includes mathematics, English, and measurement experts.
The NEA includes a very extensive test development effort to support the assessment frameworks. We propose that at the Primary 6 level, both the mathematics and English tests have 40 items; at the Primary 3 level, both tests have 30 items.3 All the items are in multiple-choice format. Tables 5 and 6 show an illustrative distribution of items recommended in each mathematics content and cognitive domain, and Tables 7 and 8 show an illustrative distribution of items recommended in each English content and cognitive domain.
The numbers of items designated in these tables are meant to serve as guidelines. The total items in the test, as well as numbers of items per domain, cannot be formally determined until after pilot testing and analyses are completed. Pilot testing will let designers know if the tests fit within the proposed time envelope (45 minutes per subject). Analyses of pilot data will yield insights on whether the test contains sufficient items to assess student skills, or whether more items are needed, or whether the number of test items could be reduced. The assessment of pilot data discussed in Section 4.5 illustrates what assistance psychometric analysis can provide in refining the instrument. In addition, it is recommended that additional items be tested during the pilot. In this way, if the originally planned test items are insufficient or problematic, a second pilot test administration will not be required to assess the additional or replacement items. (Please see the discussion about the pilot test, Section 4.4, for a table presenting the recommended pilot test item numbers).
2 Ghartey-Ampiah, J. (2006). Towards scientific literacy for basic school pupils: Which profile dimensions are emphasised in the Ghanaian basic science curricula? African Journal of Educational Studies in Mathematics and Sciences, 4: 1–14. 3 Note that, as a point of reference, the most recent application of the Southern and Eastern Africa Consortium for Monitoring Educational Quality (SACMEQ) examination included 42 items for the French test and 41 items for the English test.

10
Table 5. Distribution of mathematics items by content domain
Content Domain
Primary 3 Primary 6
Number of Test Items Number of Test Items
1. Basic Operations 20 total: 20 total:
Additiona 5 5
Subtraction 5 5
Multiplication 5 5
Division 5 5
2. Numbers and Numerals 5 7
3. Measurement; Shapes and Space 5 7
4. Collecting and Handling Data 5 7
Total 35 41 aNote that items in each sub-domain should represent a range in difficulty, from below grade-level expectations to above grade-level expectations. For example, the Addition sub-domain could have single-digit, double-digit, and triple-digit problems. This topic is discussed further in Section 4, test development.
Table 6. Distributions of mathematics items by cognitive domain
Cognitive Domain
Primary 3 Primary 6
Percentage of Test Items
Percentage of Test Items
Knowledge and Understanding (KU)
70 65
Application of Knowledge (AK)
30 35
Total 100 100
11
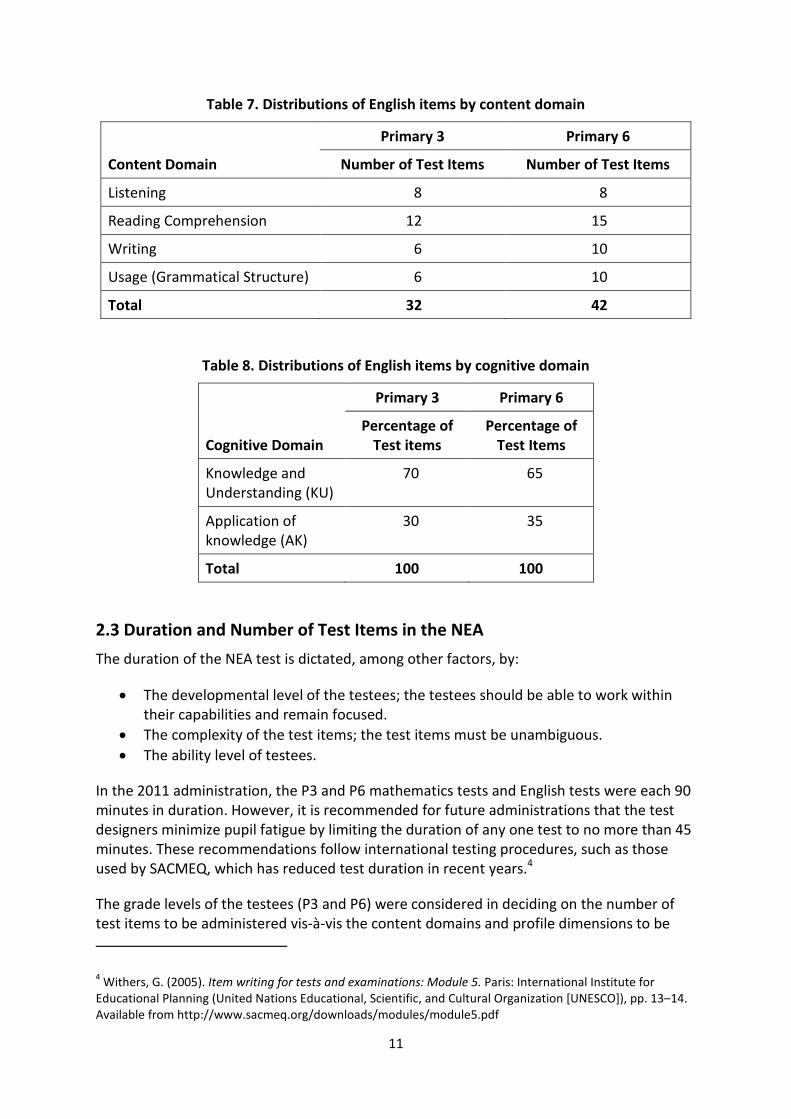
Table 7. Distributions of English items by content domain
Content Domain
Primary 3 Primary 6
Number of Test Items Number of Test Items
Listening 8 8
Reading Comprehension 12 15
Writing 6 10
Usage (Grammatical Structure) 6 10
Total 32 42
Table 8. Distributions of English items by cognitive domain
Cognitive Domain
Primary 3 Primary 6
Percentage of Test items
Percentage of Test Items
Knowledge and Understanding (KU)
70 65
Application of knowledge (AK)
30 35
Total 100 100
2.3 Duration and Number of Test Items in the NEA
The duration of the NEA test is dictated, among other factors, by:
• The developmental level of the testees; the testees should be able to work within their capabilities and remain focused.
• The complexity of the test items; the test items must be unambiguous. • The ability level of testees.
In the 2011 administration, the P3 and P6 mathematics tests and English tests were each 90 minutes in duration. However, it is recommended for future administrations that the test designers minimize pupil fatigue by limiting the duration of any one test to no more than 45 minutes. These recommendations follow international testing procedures, such as those used by SACMEQ, which has reduced test duration in recent years.4
The grade levels of the testees (P3 and P6) were considered in deciding on the number of test items to be administered vis-à-vis the content domains and profile dimensions to be 4 Withers, G. (2005). Item writing for tests and examinations: Module 5. Paris: International Institute for Educational Planning (United Nations Educational, Scientific, and Cultural Organization [UNESCO]), pp. 13–14. Available from http://www.sacmeq.org/downloads/modules/module5.pdf

12
assessed. In 2011, P3 English and P3 mathematics each consisted of 40 test items; P6 English and P6 mathematics comprised 60 test items each. At both grade levels, the English language test forms consisted of four sub-sections. For future administrations, however, recommended numbers of items (as previously shown in Tables 5 through 8) are:
• P3 maths: 35 • P3 English: 32 • P6 maths: 41 • P6 English: 42.
In drafting test items for piloting, it is advised that the number of draft items should be twice the number of items composing the final test paper. This strategy is adopted to replace test items that may be found unsuitable during the item analysis.
2.4 Equivalent Test Forms
Every test for P3 and P6 must have four equivalent test forms in both mathematics and English. The types of questions asked on each form are the same, but the exact content of the questions differs and/or the questions may appear in a different order in each form.

13
SECTION 3: SAMPLING PROCEDURES The instructions in this section are directed to the ASU statisticians who are responsible for determining and preparing the NEA test samples.
3.1 Pre-Sampling: Obtain the List Frame; Initiate and Maintain Close Communication with the Education Management Information System (EMIS) Unit
In Ghana, the EMIS provides the basis from which the NEA random sample is drawn, or the list frame of schools. A list frame is a list containing the population of schools from which a sample of schools will be randomly selected.
The sample selected is only as good as the EMIS list frame of schools. As the statistician, you will be responsible for obtaining the highest quality of information about the schools from which you will select. It is essential to communicate with the EMIS unit at the very beginning of the planning phase of any school-based survey. You should inform the EMIS staff that you will be requesting a list of schools. You will discuss with the EMIS staff what types of schools you are interested in sampling, what school characteristics you would like to see in the list frame, and when you will need the list frame. It is important to be as clear and thorough as possible and to give the EMIS staff enough time to create the list frame. Table 9 provides a guideline to follow to help you communicate to EMIS what important information you will need on the list frame.
Table 9. List of essential (and nonessential) variables which should be on the list frame
Types of Characteristics Explanation
Characteristics That Are Essential to Conduct
the Sample
Characteristics That Are Nice to Have but
Not Essential
Key identifying characteristics
To be able to identify schools in the data, you will need the school name and the school code.
• School Name • School Code
Characteristics involved in defining the population of interest
You want to be able to verify that you have included the desired schools and excluded the schools that are not desired. This will depend on your population of interest, but it is important to know that your list is complete and accurate.
• School Level (Keep the schools that have ‘Primary Schools’)
• School Enrolment (Keep the schools with P3 and P6 enrolment greater than zero)
• School Status (keep the schools that are currently ‘Open’)
Characteristics by which you plan to stratify schools
If you plan to stratify your sample before sampling, you will need the characteristics from which you will stratify.
• Region: The 2011 NEA stratified by the 10 regions plus one stratum for the NALAP pilot schools.

14
Types of Characteristics Explanation
Characteristics That Are Essential to Conduct
the Sample
Characteristics That Are Nice to Have but
Not Essential
Characteristics by which you plan to sort before sampling
Because we will be conducting a systematic random sample, we want to sort the list frame by important demographic characteristics of schools. That way we can be more confident that our random sample of schools will resemble the characteristics of the population.
• School Type (public or private)
• Urban/Rural • District Code • District Name: You
will need to tell the data collectors in which districts the schools are located.
• Mother tongue
3.2 Importance of Clear and Detailed Documentation
If the systematic random sample is to be taken using Microsoft Excel (for additional help, see Appendix A for a glossary of sampling terminology for Excel), it is very important that you clearly and accurately document each step taken to draw the final sample.
When creating the sampling Excel document, first copy and paste the EMIS list frame into the first sheet and label it ‘EMIS Data’ (see Figure 1). This sheet should not be touched afterwards. It should serve as the initial reference point from which you started your work.
Once you have copied and pasted the EMIS list frame into the first sheet, next copy and paste the list frame again into a new sheet. Label this sheet ‘Population’. This sheet is where you will begin to ‘clean’ your list frame so that it will include only schools that are defined in the NEA testing population.
You will also need to create a new sheet in the Excel document and label this sheet ‘Summary’. Here you will explicitly indicate every step taken to draw the sample. This document should be so clear and detailed that a stranger could come and follow your instructions and select the exact sample you drew. You may start the ‘Summary’ section by documenting how many schools were found in the EMIS list frame and by clearly defining the population in cells A1 and A2. Because the NEA population of interest is pupils in P3 and P6, the definition of the population of interest would be ‘All primary schools in Ghana which contain at least ten P3 students and at least ten P6 students’.
Figure 1. Create sheets in sampling document and label them ‘EMIS Data’, ‘Population’, and ‘Summary’

15
3.3 Clean the List Frame
Before you begin sampling schools, you must clean the population list frame by removing double-entered schools, and by removing schools that are not in the study’s population of interest.
First, click on the sheet you labelled ‘Population’. In order to remove the double-entered schools, you must do the following (in the ‘Population’ Sheet):
1. In the ‘Population’ Sheet, create a new column in column A. Label it ‘Exclusions’.
2. In the ‘Population’ Sheet, put the School_Code in Column B and the School_Name in Column C.
3. In the ‘Population’ Sheet, sort by School_Code and School_Name.
4. In the ‘Population’ Sheet, in Column A (‘Exclusions’) Row 2: Type in the formula which will flag with a value of ‘1’ any school that has the same name and same school code as another school. All unique schools will have a value of ‘0’. =IF(AND(B2=B3,C2=C3), 1, 0)
5. In the ‘Population’ Sheet, (before you do anything else), you must copy the ‘Exclusions’ column and ‘Paste Special’ the ‘0’, ‘1’ values into the exact same column. This is very important because if you do not do this before you sort by another variable, you will change and ultimately lose vital information. Here is how to do this:
a. Select the entire column of ‘Exclusions’ by clicking on the top of the column.
b. Right-click on the mouse and select ‘Paste Special’.
c. In the pop-up window, select ‘Values and number formats’, then click ‘OK’.
d. Check to make sure you properly conducted the ‘Paste Special’. Do this by selecting any cell in the ‘Exclude’ column. If the operations bar indicates the cell is ‘0’, ‘1’, then you were successful. If the operations bar still has the formula you typed in, then the ‘Paste Special’ did not work and you must redo all #5 steps (5a through 5d).
6. Create a new sheet in the Excel document and label the sheet ‘Exclusions’.
7. In the ‘Population’ sheet, select the ‘Exclude’ column again, press ‘Control + F’, and search for values equal to ‘1’. When a value of 1 appears, make sure that the information provided is the same. In Figure 2 below, the highlighted schools were flagged as double-entered. Check the rest of the information to make sure the information is the same.
16
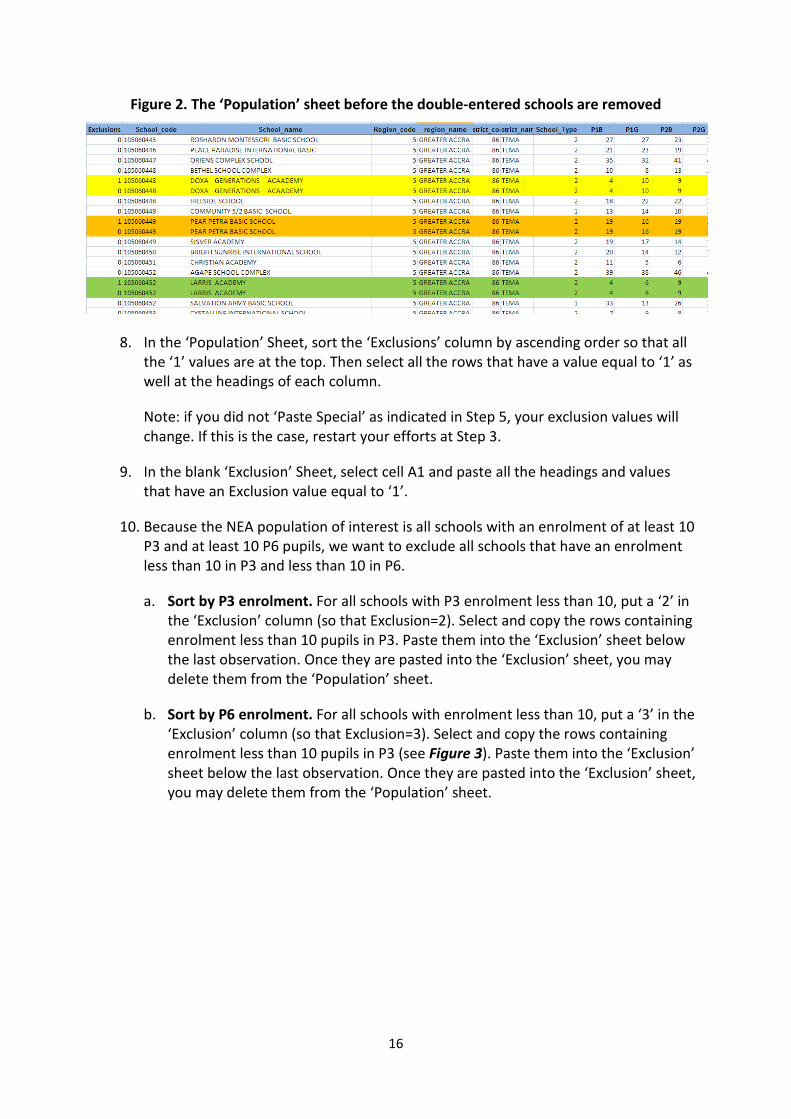
Figure 2. The ‘Population’ sheet before the double-entered schools are removed
8. In the ‘Population’ Sheet, sort the ‘Exclusions’ column by ascending order so that all the ‘1’ values are at the top. Then select all the rows that have a value equal to ‘1’ as well at the headings of each column.
Note: if you did not ‘Paste Special’ as indicated in Step 5, your exclusion values will change. If this is the case, restart your efforts at Step 3.
9. In the blank ‘Exclusion’ Sheet, select cell A1 and paste all the headings and values that have an Exclusion value equal to ‘1’.
10. Because the NEA population of interest is all schools with an enrolment of at least 10 P3 and at least 10 P6 pupils, we want to exclude all schools that have an enrolment less than 10 in P3 and less than 10 in P6.
a. Sort by P3 enrolment. For all schools with P3 enrolment less than 10, put a ‘2’ in the ‘Exclusion’ column (so that Exclusion=2). Select and copy the rows containing enrolment less than 10 pupils in P3. Paste them into the ‘Exclusion’ sheet below the last observation. Once they are pasted into the ‘Exclusion’ sheet, you may delete them from the ‘Population’ sheet.
b. Sort by P6 enrolment. For all schools with enrolment less than 10, put a ‘3’ in the ‘Exclusion’ column (so that Exclusion=3). Select and copy the rows containing enrolment less than 10 pupils in P3 (see Figure 3). Paste them into the ‘Exclusion’ sheet below the last observation. Once they are pasted into the ‘Exclusion’ sheet, you may delete them from the ‘Population’ sheet.

17
Figure 3. Sample of exclusion of schools with P3 enrolment less than 10
11. Depending on the information provided on the list frame for the population of interest, continue excluding schools as necessary by repeating the procedures laid out in Step 10.
12. In the ‘Summary’ sheet, document all the exclusions made by indicating what the exclusion value represents. Indicate the total number of schools in each exclusion. Sum the total number of schools excluded and indicate the final number of schools left in the cleaned population list. Make sure that the total number of schools left in the cleaned sample frame is equal to the total number of schools in the original list frame minus the total number of schools excluded.
At this stage of the sampling process, the ‘Summary’ Sheet (see Figure 4) should contain an explicit definition of the population, the total number of schools in the original list frame, a list of all the exclusions, the total number of excluded schools, and the final number of schools left in the cleaned list frame.
Figure 4. ‘Summary’ sheet indicating exclusions
Population: All primary schools in Ghana which currently contain at least 10 P3 pupils and at least 10 P6 pupils. Number of schools in list frame 17888 Exclusion1: All double-entered schools 10 Exclusion2: All schools with P3 enrolment less than 10 pupils 762 Exclusion3: All schools with P6 enrolment less than 10 pupils 481
Total exclusions 1253
Total schools left in cleaned sample frame 16635
3.4 Sort the List Frame
Because you will be conducting a systematic random sample of schools, you will want to sort the cleaned list frame by important variable values so that you can be sure the sample

18
of schools resembles the population of schools. To do this, first sort by any variables by which you will stratify. (In the NEA 2011 study, the data were stratified by region, so the first sorting was by region.) Next, sort by whatever descriptive variables researchers deem the most important. In the NEA 2011 study, in addition to region, the cleaned list frame was sorted by district, school type, and P6 and P3 enrolment.
In the ‘Summary’ sheet, below the population and exclusions, indicate by what variables you sorted the data (Figure 5).
Figure 5. Sample of sorting framework
3.5 Stratify the List Frame
To stratify a sample means to completely separate the sample before selection. For example, if the NEA sample is to be stratified by region, you will want to separate each region before selecting schools. An additional stratum was created for the NEA 2011 study; this stratum included the schools that were implementing the pilot National Literacy Acceleration Programme (NALAP). Thus, 11 total strata were created (10 regions and 1 ‘NALAP’ stratum).
Once the data are sorted according to the framework specified in the ‘Summary’ sheet (Figure 5 above), you will need to copy and paste all schools from each stratum into a new Excel spreadsheet labelled with the stratum. For example, for a regional stratum, the sheet will be labelled with the name of the region and ‘POP’ next to it (see Figure 6):
1. Create new sheets for every Stratum needed. Label the new sheets ‘<RegionName>_Pop’.
2. Copy and paste all the rows found in ‘Population’ Sheet that contains all the schools in ‘Ashanti’. Copy and paste the rows into the sheet you created and labelled ‘Ashanti_Pop’.
3. Repeat the process for the other 10 regions.
4. Do not delete the observations from the ‘Population’ Sheet.
Figure 6. Sample of regional stratum labels

19
5. In the ‘Summary’ sheet, document the stratification variables and the total number of schools found in each stratum (Figure 7).
Figure 7. Sample documentation of stratification variables
Stratified by: Region Sorted by: Region_Name (A-Z), District_Code (Small-Largea), school type(Small-Large), P6 (Small-Large) and P3 (Small-Large) Region Name Total number of Schools ASHANTI 2567 BRONG AHAFO 1509 CENTRAL 1544 EASTERN 1739 GREATER ACCRA 1466 NORTHERN 1292 UPPER EAST 543 UPPER WEST 422 VOLTA 1267 WESTERN 1600 NALAP pilot schools 41 Grand Total 13990
aCut points for school sizes in this example were small ≤35 pupils; medium 36–70; large >70.
3.6 Sample from the Stratified List Frames
The steps in this section will need to be repeated as many times as there are strata in the list frame. For the 2011 NEA, they were done a total of 11 times because there were 11 strata in the list frame.
1. In the ‘Summary’ sheet, continue to fill in the table (i.e., like Figure 7) with new columns, as shown in Figure 8.
Figure 8. Sample of completed stratification by region
Stratified by: Region Sorted by: Region_Name (A-Z), District_Code (Small-Large), school type (Small-Large), P6 (Small-Large) and P3 (Small-Large) Sample Selection Method: Equal Probability Selection
Region Name
Total Number of Schools
Total Number of Schools to
Be Sampled Jump Random Number
Random Start
Rounded Random
Start ASHANTI 2567 55 46.67273 0.132204 6.170321 6 BRONG AHAFO 1509 55 27.43636 0.72983 20.02388 20 CENTRAL 1544 55 28.07273 0.709797 19.92594 20 EASTERN 1739 55 31.61818 0.650216 20.55865 21 GREATER ACCRA 1466 55 26.65455 0.414234 11.04122 11 NORTHERN 1292 55 23.49091 0.672884 15.80666 16 UPPER EAST 543 55 9.872727 0.238536 2.355001 2 UPPER WEST 422 55 7.672727 0.875039 6.713936 7 VOLTA 1267 55 23.03636 0.915704 21.09449 21 WESTERN 1600 55 29.09091 0.722449 21.0167 21

20
Stratified by: Region Sorted by: Region_Name (A-Z), District_Code (Small-Large), school type (Small-Large), P6 (Small-Large) and P3 (Small-Large) Sample Selection Method: Equal Probability Selection
Region Name
Total Number of Schools
Total Number of Schools to
Be Sampled Jump Random Number
Random Start
Rounded Random
Start NALAP pilot schools
41 30 1.366667 0.814956 1.113773 1
Grand total 13990 580 N/A N/A N/A N/A
a. Total Number of Schools to Be Sampled. The 2011 NEA sampled 55 schools from
each region and 30 schools in the USAID stratum.
b. Jump. The Jump equals the total number of schools divided by the total number of sampled schools in each stratum.
𝑱𝒖𝒎𝒑 =𝑻𝒐𝒕𝒂𝒍 𝑵𝒖𝒎𝒃𝒆𝒓 𝒐𝒇 𝑺𝒄𝒉𝒐𝒐𝒍𝒔
𝑺𝒂𝒎𝒑𝒍𝒆𝒅 𝑵𝒖𝒎𝒃𝒆𝒓 𝒐𝒇 𝑺𝒄𝒉𝒐𝒐𝒍𝒔
c. Random Number. In the cells under ‘Random Number’, type in the following:
=rand(). This will create a random number between zero and one. Once you have put =rand() in the cell, immediately copy and ‘Paste Special’ the value and format.
d. Random Start. The Random Start is the Jump times the Random Number. This will tell you where you will select your first school on the list.
𝑹𝒂𝒏𝒅𝒐𝒎 𝑺𝒕𝒂𝒓𝒕 = 𝑱𝒖𝒎𝒑 × 𝑹𝒂𝒏𝒅𝒐𝒎 𝑵𝒖𝒎𝒃𝒆𝒓
e. Rounded Random Start. Round the Random Start to a whole number.
2. In the ‘Ashanti_Pop’ sheet, create four new columns: Columns A, B, C, D. Label them as follows: Column A =‘Sample’, Column B=‘Select’, Column C=‘Cumulative Number of Schools’, and Column D=’Sample Weight’.
3. In the ‘Ashanti_Pop’ sheet, fill in the ‘Sample Weight’. The sample weight will equal the Jump number because you are selecting schools with equal probability. Therefore, the ‘Sample Weight’ in the ‘Ashanti_Pop’ sheet will have a value of 46.67273.
4. In the ‘Ashanti_Pop’ sheet, fill in the ‘Cumulative Number of Schools’ column. The first school will have a value of ‘1’, the second school will a value of ‘2’, and the numbers will accumulate by a factor of one until you get to the last school on the list, which should have a value of 2984 (which is equal to the total number of schools found in the cleaned list frame of the Ashanti region).

21
5. In the ‘Ashanti_Pop’ sheet, fill in the ‘Sample’ for the first school to be selected in the sample. Do this by scrolling down to where the ‘Cumulative Number of Schools’ has a value of ‘6’. This will be the first sampled school in the Ashanti region.
6. In the ‘Ashanti_Pop’ sheet, fill in the ‘Sample’ for the selected school replacement. The school above the sampled school will get a value of ‘2’ (indicating that it is the first replacement school for the sampled school) and the school below the sampled school will get a value of ‘3’ (indicating that it is the second replacement school for the sampled school).
7. In the ‘Ashanti_Pop’ sheet, fill in the ‘Select’ column. Do this by putting a ‘1’ in the cell for schools that have a ‘Sample’ value of ‘1’, ‘2’, or ‘3’ (see Figure 9).
Figure 9. Sample of coding for selected replacement schools: Select1, School #6
Create the Sample and Selection table for each stratum based on the stratum’s Random Start and Jump number.
8. In the ‘Summary’ sheet, create a new table below the table completed in Step 1 (see Figure 10).
a. The first row will have the name of each stratum.
b. The second row will have the Random Start Number (which is also the ‘Select1’ number) for the specific stratum.
c. The third row will have Select2, the fourth row will have Select3, and so on until you reach Select55 (the number of schools to be selected in Ashanti).
d. Fill in Select2 by typing in ‘=<’RandomStart’ Cell> + <Jump>. In the example found in Figure 10, the following formula can be entered into Select: ‘=B30+$E$15’.
e. Fill in Select3 by typing in ‘=<Selection2> + <Jump>. In the example found in Figure 10, the following formula can be entered into Select3: ‘=B31+$E$15’.
f. Continue doing this until you have filled in through Select55.
To summarize:
• Select1 is the same as the Random Start. • Select2 is the sum of the value of Select1 + the Jump.

22
• Select3 is the sum of the value of Select2 + the Jump. • Select4 is the sum of the value of Select3 + the Jump.
Figure 10. Sample of Summary sheet for selected schools, by region
9. In the ‘Ashanti_Pop’ sheet, finish filling in the ‘Sample’ column and the ‘Select’ column until you have reached Select55.
a. In Figure 10, the second selection is Select2=52.843. Round this number to a whole number (which results in Select2=53). Therefore, in the ‘Ashanti_Pop’ sheet, column ‘Cumulative Number of Schools’, find the school that has a value of ‘53’. This school will get a ‘Sample’ value of ‘1’ and a ‘Select’ value of ‘2’ (this is will be the second school sampled in the Ashanti stratum). The school above the sampled school (‘Cumulative Number of Schools’= 52) will get a ‘Sample’ value of ‘2’ and ‘Select’ value of ‘2’. The school below the sampled schools will get a ‘Sample’ value of ‘3’ and a ‘Select’ value of ‘2’.
b. In Figure 10, the third selection is Select3=99.515781. Round this number to a whole number (which results in Select3=100). Therefore, in the ‘Ashanti_Pop’ sheet, column ‘Cumulative Number of Schools’, find the school that has a value of ‘100’. This school will get a ‘Sample’ value of ‘1’ and a ‘Select’ value of ‘3’ (this
NALAP

23
is will be the third school sampled in the Ashanti stratum). The school above the sampled school (‘Cumulative Number of Schools’= 99) will get a ‘Sample’ value of ‘2’ and ‘Select’ value of ‘3’. The school below the sampled schools will get a ‘Sample’ value of ‘3’ and ‘Select’ value of ‘3’. Figure 11 shows the result. )
Figure 11. Sample of coding for selected and replacement schools: Select3, School #100
c. Continue in this process until you have reached Select55=2526.49774. Round this number to a whole number (which results in Select55=2527). Therefore, in the ‘Ashanti_Pop’ sheet, column ‘Cumulative Number of Schools’, find the school that has a value of ‘2527’. This school will get a ‘Sample’ value of ‘1’ and a Selection value of ‘55’ (this is will be the 55th school sampled in the Ashanti stratum). The school above the sampled school (‘Cumulative Number of Schools’= 2526) will get a ‘Sample’ value of ‘2’ and ‘Select’ value of ‘55’. The school below the sampled school will get a ‘Sample’ value of ‘3’ and a ‘Select’ value of ‘55’.
10. Once you have finished filling in the ‘Sample’ and ‘Select’ columns for Select1 through Select55 in the ‘Ashanti_Pop’ sheet, check that you have reached the end of list. Do this by adding the ‘Jump’ value to the ‘Selection55’ value. In the Ashanti example, the value would be ‘2574.17047’, or a rounded value of ‘2574’. Make sure that if you were to go to the value ‘Cumulative Number of Schools’ equal to ‘2574’, you would be off the list. That is, since the total number of schools in Ashanti is 2567 schools, a value of 2574 would have you ‘Jump’ off the list so you know that your systematic sample has properly covered the list of schools in Ashanti.

24
11. Repeat these steps for Brong Ahafo, Central, Eastern, Greater Accra, Northern, Upper East, Upper West, Volta, Western, and NALAP pilot schools. Note: The NALAP pilot school population is too small to allow for the schools above and below the sampled schools to be replacement schools, so if this is one of the strata chosen for the assessment, do not include ‘Sample’ values of ‘2’ and ‘3’ for this stratum.
3.7 Create the List of Sampled Schools
Once you have finished selecting all the schools in all the strata, it will be time to create a sheet labelled ‘Sample’. This sheet will be what you provide for the field staff so that they may go to the sampled schools to collect the data.
1. Create a new sheet in the Excel document and name it ‘Sample’.
2. Copy and paste the heading of ‘Ashanti_Pop’ into the ‘Sample’ Sheet.
3. In the ‘Ashanti_Pop’ sheet, sort by ‘Sample’.
a. Check to make sure that you have ‘Select’ values 1–55.
b. Copy all 55 schools which have ‘Sample’ equal to ‘1’.
4. Paste the 55 ‘Sample’=1 schools into the ‘Sample’ sheet.
5. in the ‘Ashanti_Pop’ Sheet, do not delete any of the schools. Resort the list by ‘Cumulative Number of Schools’.
6. Repeat Step 3 through Step 5 for each of the strata population sheets (in this example: Brong Ahafo, Central, Eastern, Greater Acrra, Northern, Upper East, Upper West, Volta, Western, and NALAP pilot schools).
7. Once you have finished with all the strata, check to make sure you have 580 schools (refer to Figure 8) in the ‘Sample’ Sheet.
3.8 Post Sample of Schools, Deliver Sample, and Interact with the Field Staff
Once the final sampled schools and the reserve schools have been selected, weighted, and properly documented, you will provide the field staff with the final list of sampled schools.
It is important to note that you will not give the field staff the reserve school list. This could tempt the field staff to choose the easiest of the schools to test. However, you should be easily accessible for the field staff so that they may call you and ask you for a reserve school to replace a specific school. Similar to how you relied on the EMIS unit to provide you with important information, the field staff now will rely on you to provide them with important information: the school name and code of the replacement school (see Table 10). You should communicate to the field staff that there are two replacement schools for each sampled school and the originally sampled school should be replaced only if the school cannot or will not participate in the study. For instance, the sampled school may have recently closed for an indefinite time, or the head teacher may refuse to allow the students

25
to participate. It is your responsibility to make sure the field staff do not replace a school because of reasons not focused on the school. Inappropriate reasons for introducing replacement schools include the school being too far for the field staff to get to, o1r the school being closed for a short period of time when the staff first visited.
Table 10. Information for designating replacement schools
Information the field staff should provide to the statistician
Information the statistician should provide to the field staff
School code School name Region name Detailed reason for why the school needs to be replaced
Replacement school code Replacement school name Region name
To find and document replacement schools in the list frame:
1. Copy the sheet labelled ‘Sample’ into a new Excel document. Save this document as: ‘Sample provided to the Field Staff <Date>.xlsx’. This will be the document you provide for the field staff.
2. If the field staff member needs a reserve school because the sampled school is closed or does not consent to the test, they will need to provide you with the original school code, school name, region name, and reason for not testing the sampled school.
3. Once they provide you with the school code, school name, region name, and reason for not testing the sampled school, look for the stratum population sheet that contains the original school. Search and find the school name and double-check that the school code matches. The school in need of replacement will have a ‘Sample’ value of ‘2’ and a specific selection (‘Select’) value between 1 and 55. Find the school that has the same ‘Select’ value as the school to be replaced and a ‘Sample’ value of ‘2’. This is the specific school’s first replacement. If, for some reason, the replacement school cannot participate, provide the field staff with the name, code, and region of the school having the same ‘Select’ value and a ‘Sample’ value of ‘3’.
4. Update the ‘Sample’ sheet with any replacement schools by removing the school needing to be replaced and inserting the information for the replacement school.
5. Create a new sheet in the document and rename it ‘Replacement Documentation’. Create a heading in the first row. Label them: Column A=Region, Column B=Select, Column C=Replaced School Name, Column D= Replaced School Code, Column E= Replacement School Name, Column F= Replacement School Code, Column G=Reason for Replacement.
6. Document the replaced schools and replacement schools by filling in the ‘Replacement’ sheet according to the column headers mentioned in Step 5.
You are finished with your sampling duties only when the data from all schools have been collected and returned to the data collection centre.

26
SECTION 4: DESIGNING AND DEVELOPING THE NEA TEST Following the test development process, drafted test items are edited, piloted, scored, and item-analysed. Appropriate items are selected, assembled into final tests, and made available for administration. Piloting is carried out to ensure that the test is valid and reliable for the purpose for which it is designed.
4.1 NEA Test Format
As described in other sections of this manual, the NEA is a multiple-choice test designed for P3 and P6 aligned to the national curriculum (English and mathematics) to provide policy-level information regarding class-level achievement and system performance. In this regard, the items constructed for the test must measure the core objectives of the curriculum and the non-test evaluation instruments developed should capture the school context in which learning takes place. Non-test instruments also gather information on pupils’ socio-economic background, teachers’ academic and professional background, attitudinal measures, availability of textbooks, other learning materials, etc.
4.2 Construction of NEA Test Items
The ASU has built up a Technical Working Group consisting of P3 and P6 teachers from public primary schools, other Ghana Education Service educational institutions, subject specialists from ASU, private evaluation consultants, and consultants from the teaching universities. The original TWG was given hands-on training on test item construction. The TWG has been maintained with new members recruited, trained, and tasked to generate test items for the NEA.
Before test items are constructed, the TWG members scrutinize the English and mathematics syllabi to tease out the core objectives for P3 and P6, and use these as the basis for developing the tests. The objectives selected have syllabus reference numbers which should be recorded against each item to ensure that the selected curriculum objectives have all been catered for in the test.
The actual item writing is carried out at this stage, with reference to the test blueprint and the accepted principles and guidelines for constructing (multiple-choice) test items. In general, the item writers use active verbs which reflect the curriculum learning objectives on which the test items are based.
Before new test items are constructed, if it is an assessment goal to compare results to those from previous data collections, it is critical that some items from the previous administration are pulled into the new test instrument. Without these items, there will be no way to compare and confirm that the two tests are similarly measuring the construct of interest. Opinions about the exact number of items that need to be constant across testing occasions vary from expert to expert, but a conservative estimate of at least 20% of test items is recommended. These items must range in difficulty across the domain. That is, replicating only the easiest items will not ensure adequate comparison to the previous test instrument used in data collection.

27
Throughout the item writing and editing process, several key concepts should be considered and continually checked. One such concept is face validity. In any ability-measurement situation, test designers must ensure that items are constructed appropriately to target the ability of interest. For example, student assessments of listening comprehension not only should contain grade-appropriate content, but also must lack irrelevant and distracting items such as etiquette and telling time. These items have no bearing on listening comprehension and, indeed, detract from its measurement. Another key concept is maintaining the appropriate number of items to assess a given skill. The full range of student ability needs to be assessed, without fatiguing participants. The final concept deals with multiple forms and consistency. It is critical that the level of detail in the instructions, the example items to illustrate instructions, and the question formats do not change from one test form to another. Inconsistencies in forms could advantage or disadvantage students and result in misrepresentation of their skill level.
4.2.1 Suggestions for Writing Multiple-Choice Items
The stem of an item should:
1. Be meaningful by itself and present a single, definite task that measures the skill intended.
2. Be brief and clear in content and instruction. 3. Avoid unnecessarily difficult vocabulary. 4. Be grammatical both within itself and in relationship to the choices/alternate
answers/options. 5. Not include material (clues) which automatically determines the correct choice, or
which rules out incorrect choices for the item itself or other items in the scale. 6. Be presented in a positive form. 7. In general, include any words that must otherwise be repeated in each response. 8. Be of an appropriate level of difficulty for the group to be tested. 9. Contain appropriate topics or subject matter for the population of interest (e.g., age
and culturally appropriate).
4.2.2 Item Choices, Alternative Answers, Options, and Responses
The response options should:
1. Be brief and clear. 2. Be parallel in terms of grammar and physical properties with the stem of the item. 3. Not overlap or include each other. 4. Incorporate only one correct answer or clearly the best answer. 5. Have distractors that are plausible and attractive to any examinees who lack the
information or ability tested without being ‘tricky’ representations of the correct answer.
6. Not give away information or clues to the answer. 7. Be appropriate to the item stem. 8. Be positioned randomly. Alternatively, they can be arranged in increasing, decreasing,
or alphabetical order. 9. Be similar in length, format, and terms so they do not distract from, or point to, the
correct response in unintended ways.

28
4.2.3 Ways to Make Distractors Plausible
Distractors should distract the uninformed or misinformed, but they should not result in ‘trick questions’ that mislead the knowledgeable examinees. For every correct choice, writers will need to construct incorrect choices which have some plausibility to examinees with varying degrees of information or misinformation. The general approaches are:
1. Develop incorrect choices on the basis of known common misconceptions and errors which pupils make (e.g., forgetting to convert minutes to hours).
2. Use words that have verbal associations with the item stem (e.g., politician/political). 3. Use distractors that are homogeneous—that is, similar in structure, form, and content
to the correct answer (e.g., all the people listed are famous inventors). 4. Use distractors that are parallel in form and grammatically consistent with the item’s
stem. 5. Make the distractors similar to the correct answer in length, vocabulary, sentence
structure, and complexity of thought.
4.3 Editing of Draft Test Items
Even when the last word in the initial construction of test items is written, the test development process is not over yet. The writers should put away the constructed items for a few days and then go back to them. Invariably there will be something that could have been done better. Thus, the next step after constructing the items is to edit them.
It is an accepted norm in testing to give a newly constructed test to a colleague or to a subject-matter expert in the same field, for editing. This step is done to improve the quality of the test further.
The test items are edited to ensure that the following are not present:
• grammatical and typographical errors • unclear expressions or statements • unclear or inaccurate illustrations • wrong use of words • ambiguity • gender stereotyping in relation to domestic chores, games, etc. • gender insensitivity • lack of ethnic balance in the use of names, places, etc.
All edits should be tracked and verified by at least one external reviewer to provide quality assurance on the typographical edits, ensure the maintenance of the original item intent, and check response options for the presence of a correct answer.
Once the draft items have been edited, some overall, test-level evaluations should be performed.
• Number of items: Are there sufficient items in each domain (e.g., addition, division, geometry, etc.) to assess the full range of student ability, but without having so many items that students are fatigued? There is no absolute rule of thumb for the

29
number of items per domain, but it is recommended that enough items exist for assessors to be confident that the questions represent all student levels of skill within a domain, even at the extremes of high and low ability (i.e., higher and lower than curriculum standards). However, having too many items on a focused domain is also problematic. For example, a test that contains 40 items assessing single-digit addition will fatigue students without providing information on the full range of addition ability. A balance must be struck.
• Test timing: Ensure that the time to complete the test is not longer than is reasonable for the targeted student population. If an able adult takes over an hour to complete it, then a young student will likely find the test too long and fatiguing. Based on comparison with international standardized tests, such as that of the SACMEQ as mentioned in Section 2, it has been suggested that 45 minutes is sufficient for grade 3 pupils.
• Multiple test forms: Similar to the situation with comparing test forms between years, if multiple forms are being employed in a single year, then there must be an overlap of items to ensure that linking and equating can be conducted. In this case as well, a conservative estimate of at least 20% of common test items is recommended, and these items must range in difficulty.
4.4 Piloting of Draft Test and Non-Test Instruments
4.4.1 Background and Goals
For pilot testing, the following categories of schools are purposively selected: low-, medium-, and high-performing schools from the Northern, Middle, and Southern zones of Ghana. Since pilot testing does not take place at the end of an academic year, primary school, grade 4 (P4) and junior high school, level 1 (JHS 1) classes are selected because they are supposed to have completed the P3 and P6 syllabi, respectively.
One goal of pilot testing is to determine how well the test instrument is assessing the students we are interested in learning about. Therefore it is critical to collect data that are as complete as possible from a wide range of students with a sampling of many different skill levels. If the pilot data collection samples only from a single, select group (such as low-skill students), there will be uncertainty about how well the test instrument will be able to assess high-ability students (and even those at the middle range of ability) during the full data collection. In order for the pilot data analysis to correctly evaluate the test instrument, the sample must resemble the full population of interest as much as possible. Ideally for a pilot study, the test team should collect at least 150 cases per grade, of data that are complete (i.e., minimal missing data) and variable (the majority of completed answer sheets should not have responses that are at the extremes of all correct, or all incorrect, but with good variation somewhere in the middle). The following distribution of pilot schools is an example of a pilot sample design created to maximize variability in test results. Again, this variability is needed to ensure that the final test will be properly calibrated (not too difficult and not too easy).
I. Based on the results from the most recent administration of the NEA or School Education Assessment (SEA), choose: • one of the top 3 performing regions (the easiest region to get to)

30
• one of the middle 4 performing regions (the easiest region to get to) • one of the bottom 3 performing regions (the easiest region to get to)
II. Within each of these selected regions, select 4 schools:
• 1 large urban school (large: >70 pupils) • 1 large rural school • 1 small urban school (small: ≤35 pupils) • 1 small rural school
Choose schools that are easy for the data collectors to go to.
III. Within each of the selected small schools test 20 pupils:
• 10 P3 pupils • 10 P6 pupils
IV. Within each of the selected large schools, test 40 pupils:
• 20 P3 pupils • 20 P6 pupils
This will result in a total sample size of 180 P3 students (60 from small schools and 120 from large schools) and 180 P6 students (60 from small schools and 120 from large schools). Sampling 180 students will result in a greater probability of obtaining 150 complete tests per grade.
As mentioned earlier, in order to ensure sufficient piloted test items for the actual fieldwork, it is recommended that additional test items be prepared for the pilot test. Please see Tables 11 and 12 for an illustrative listing of pilot test item numbers.
Table 11. Pilot test distribution of mathematics items, by content domain
Content Domain
Primary 3 Primary 6
Number of Test Items Number of Test Items
1. Basic Operations 28 total: 32 total:
Additiona 7 8
Subtraction 7 8
Multiplication 7 8
Division 7 8
2. Numbers and Numerals 7 9
3. Measurement; Shapes and Space 7 9
4. Collecting and Handling Data 7 9
Total 49 59

31
aNote that items in each sub-domain should represent a range in difficulty, from below grade-level expectations to above grade-level expectations. For example, the Addition sub-domain could have single-digit, double-digit, and triple-digit problems.
Table 12. Pilot test distribution of English items by content domain
Primary 3 Primary 6
Content Domain Number of Test Items Number of Test Items
Listening 8 8
Reading Comprehension 16 18
Writing 8 10
Usage (Grammatical Structure) 8 10
Total 40 46
4.4.2 Pilot Administration
There should be enough copies of the draft tests for each testee to have one. Similarly, there should be enough copies of the Test Administrator’s Manual (see Section 4.8) for the test administrators (TAs). TAs are trained to pilot the test.
The content of the training includes:
• An overview of the NEA • A discussion of the processes and procedures for the test administration • Practice test administration within the peer group (TAs) • Explanation of how to enter pupil identification numbers (ID) and other information
into the scannable answer sheets • Stacking of the test booklets by equivalent test forms • Discussion of the Test Administrator’s Manual.
The ASU sends the pilot test materials to the piloting district education offices. The GES district directorates then forward the test materials to the schools with funding from ASU.
In the classroom, the TAs distribute the test form booklets to the pupils in a serpentine manner. The test administrators follow the guidelines in the Test Administrator’s Manual in administering the tests. At the end of the pilot test, the TAs collect the answer sheets from the pupils in the same order in which they were distributed, for onward dispatch to the ASU for processing.
Depending on the purpose and types of non-test evaluations to be carried out, the TAs distribute these instruments to the pupils or to the head teachers or teachers to complete as required.

32
4.4.2 Pre-scanning, Scanning, and Cleaning of Pilot Test Data
Procedures regarding the pre-scanning, scanning, and cleaning of pilot data may be found in Section 6, which also describes the pilot data analysis and the reasons for particular analyses specific to the pilot data. The statisticians should follow the pre-scanning, scanning, and cleaning instructions found in Section 6 before analysing the pilot test data.
4.5 Item Analysis of Piloted Test Items
Once the pilot test data have been pre-scanned, scanned, and cleaned, and any outliers or other anomalies resolved, it is time to examine the item responses more closely. Some methods look at relationships among items. For example, internal consistency reliability assessments use the Cronbach’s alpha statistic, which is calculated from the correlations between items in a test. This analysis provides information on how well the items on a test relate to one another. An item that shows low correlations with the remaining set may need to be reviewed further for content, or possibly with a different analytic method.
Other analytic methods look at item-level response data to assess test characteristics. Rasch measurement is one such method, and is used to construct additive and objective instrumentation, or to create a ‘ruler’ that can be used to measure student skill level.5 Output from a Rasch model analysis of pilot data can provide statistical information on the item difficulty hierarchy in a test, and that hierarchy can be compared to a theoretical hypothesis about the item difficulty ordering. If an item’s placement in the statistical hierarchy differs from where it was supposed to be theoretically, then that item may need further review and potential revision before the full data collection. Output from the Rasch model analysis also flags items that are producing unexpected responses and may need further review. For example, if the Rasch analytic model estimates that an item is easy, but several high-skill students are not able to respond correctly to that item, it should be examined for content. Perhaps there is a typographical error in the item causing the question to be misleading, or perhaps the correct response is not present in the response options. This item would likely require revision before full data collection.
Finally, output from a Rasch analysis can look at items that are replicating level of effort for students. That is, this output shows items that are not yielding new information in the assessment of student ability, and could potentially be cut from future administrations of the test instrument. However, all items should be assessed according to content prior to cutting. It is possible that two items that show a redundant level of effort actually tap two different skills (e.g., addition and division). If, through the Rasch analysis, a set of items is selected for removal from future administrations of the test instrument, the internal consistency reliability should be reassessed to determine the maintenance of acceptable values. Removing items that the pilot test reveals are truly redundant offers the benefit of reducing the administration duration of the test instrument.
5 Bond, T. G., & Fox, C. M. (2001). Applying the Rasch model: Fundamental measurement in the human sciences (1st ed.). Mahwah, New Jersey: Lawrence Erlbaum.

33
It is also worthwhile to look at the test as a whole while also conducting item-level assessments. The Rasch analysis model allows the placement of persons and items on the same ‘ruler’. Therefore, the test’s targeting, or relationship to the overall skill of the students, can be assessed. If the majority of the items are too easy or too difficult for the students being assessed, then the complexity of the test may need to be re-evaluated.
Several methods can be used in conjunction to determine if the draft test instrument is performing as expected, or if changes need to be made before full data collection. Each analysis provides a different look at the pilot data, and a mixed-methods analysis is recommended to provide a well-rounded evaluation of the test instrument.
Finally, measuring how long the test takes to complete is an important component of the pilot test analysis. As stated previously, test administrators must be sure to record the tests’ start and end times.
4.6 Development and Formatting of Test Papers
Using the content domains of each subject, the test items are examined and selected to compose test papers for each of the subjects for P6 and P3 respectively. The typist formats the four equivalent test forms for each subject so that each test paper looks like the others.
4.7 Non-Test Evaluation Instruments
Non-test evaluation instruments are those tools for collecting data about the context of learning in schools. They include observation tools, questionnaires, checklists, inventories, rating scales, interview schedules, attitudinal measures, etc.
The contents of these instruments are determined by factors influencing teaching and learning in schools. Data from non-test evaluation instruments are coupled with test data to determine the relationships existing between the factors influencing education delivery and pupils’ achievements. The construction of any of these instruments, as required, is done simultaneously with the development of the NEA tests, if not earlier.
4.8 Test Administrator’s Manual
4.8.1 Purpose and Uses of the Manual
The Test Administrator’s Manual is an integral and essential part of the assessment process. It explains the content of the examination, the various tasks the testees are to perform, and how the responses to the questions are to be indicated. The manual should specify the time allowed for each test. If all TAs follow the manual scrupulously, it ensures the uniformity of administration of the test and adds to the credibility of the results that are eventually obtained.
The directions to be read by the test administrator and possibly explained to the testees are indented in the manual, while instructions to the test administrator are not.
Example items are used in the manual to illustrate how to search through the alternative responses, choose the correct (or best) response, and shade the selected response on the answer sheet. The transition from test booklet to answer sheet may be strange for most of

34
the testees, hence, the need to familiarize them with the process before they begin answering the questions.
The example items also provide adequate explanations of the task posed to the testees to enable them work out the needed solutions. It may not be necessary for the test administrator, especially in P6 classrooms, to work through all the example items in the manual with the testees.
The manual should be extensively discussed at the workshop for the training of TAs and must be used for peer administration of the NEA test during practice sessions. It is necessary, therefore, that the manual be ready before the training workshop.
4.8.2 Finalising the Test Administrator’s Manual
Like the test items, the draft manual should be subjected to rigorous editing, which should be done by a person or persons who are knowledgeable in the area of testing. The editing will look at the suitability of the language to the level of the testees, technical inaccuracies, and typographical and other errors.
TAs will use the manual at the training workshops, when they are piloting the NEA test items, and at the general administration of the NEA test. The findings of the TAs and their comments should be used for reviewing and fine-tuning the manual. It is important, therefore, that the planning and development of the manual be done long before the major training workshop for test administrators begins.

35
SECTION 5: ADMINISTRATIVE PROCEDURES The administrative procedures involved in NEA administration include:
1. Preparing a budget 2. Writing letters to district and regional education directorates to inform them about the
impending NEA and to collect enrolment data for sampled schools 3. Developing an implementation programme 4. Administering the test 5. Reporting results.
5.1 Budgeting
The activities to be covered by the NEA budget are shown in Table 13. It should be noted that budget lines should be created for each activity to ensure availability of funds for the activity.
Table 13. Budgeted activities for NEA testing
1. NEA preparatory activities: Test development
i. Construction of new test items ii. Piloting of new test items iii. Reviewing and finalisation of piloted tests
2. Stocktaking of old test materials
i. Number of security bags ii. Padlocks for security bags
3. Communication: Letters to regions and districts informing them about the NEA and requesting information on sampled schools.
i. Postage (Expedited Mail Services [EMS]) ii. Telephone iii. Internet
4. Procurement of scannable answer sheets 5. Procurement of stationery items 6. Training workshop for test administrators 7. Printing of NEA question booklets 8. Allocation of test materials to schools 9. Packaging and packing of test security bags 10. Transport of security bags to regions
i. Off-loading and re-loading of test materials at regional centres 11. Collection of test materials from regional depots by district personnel 12. Administration of NEA

36
13. Monitoring of NEA i. National ii. Regional iii. District
14. Checking and collection of security bags from regional depots 15. Servicing of computers, photocopiers, and printers 16. Servicing of optical scanners 17. Allowances to hire extra hands for preparing answer sheets for scanning (activities 8 and 9) 18. Writing of NEA reports
i. National ii. Regional
19. Printing of NEA reports
i. National ii. Regional
20. Dissemination of NEA findings
i. National ii. Regional iii. Newspaper publications iv. Posters and flyers
21. Warehousing of test materials at GES warehouse at Tema
It is recommended that the first activity, NEA preparatory activities, take place in the year preceding the year in which the NEA is conducted, to reduce time pressures in the administration of the test. Care must be taken to budget for all the activities involved in the administration of the NEA.
Beyond the biennial testing process, however, ongoing efforts should be made to establish an item bank. Completely restarting the first activity (NEA preparatory activity) for every biennial administration is not cost-effective. It is suggested that the time allotted for test development be extended so that more items can be generated. Although the up-front costs would be higher, in the end, item-banking would cut the cost of testing.
5.2 NEA Implementation Programme
An implementation programme is developed in which the activities involved in the administration of the NEA are written with timelines, budget, and allocation of responsibilities to the various participating agencies. Since the NEA is time-bound, observing the timelines of the activities is very crucial in the execution of the NEA programme to ensure the validity, reliability, and usefulness of the results to stakeholders.
5.3 Procurement of Test Materials
Requests for NEA materials such as answer sheets, stationery, printing of test booklets, and the Test Administrator’s Manual, as well as requests for equipment repair and scanner

37
maintenance, are sent to the Director, Logistics and Supply Division, for procurement. (See illustrative list in Table 14.) The Logistics and Supply Division applies GES procurement procedures for purchasing the materials for ASU.
Table 14. Stationery and other materials to be procured for NEA
A4 copier paper Erasers Stapler Bag envelopes Hard covers Staples (24/6) 2B pencils Ink for Risograph Toner for LaserJet Blue pens Markers (indelible sq. tip) Toner for photocopier Brown envelopes (A4 size) Masking tape Twine Brown paper Repair of office equipment White correction fluid Cello tape (1”) Rubber bands White self-adhesive Cello tape (2”) Sharpeners
5.4 Printing of Test Items
To determine the number of test booklets to print for each test form, the number of pupils taking the test is divided by the number of test forms plus extra copies determined by the overage factor. The overage factor is the percentage of extra copies that needs to be printed to cover unexpected shortages (e.g., from misprinted booklets). For NEA 2011, an overage factor of 20% was used.
The printing of the test items is given on contract immediately after the items are finalized and the sampling is done, preferably by the middle of February of the testing year. Scannable answer sheets and other logistics are also procured alongside the printing of the test items. An overage factor should be applied to all items.
5.5 Allocation and Packaging of Test Materials
5.5.1 Overview of Allocating Materials to Schools
Packing of test materials should be organized such that adequate test materials are received at the test schools in a timely manner. The coordinators should organize the test materials so that it is convenient for the test administrators to transport the materials, administer the tests, and secure the materials while at the schools.
To avoid misallocation of test materials between schools, it is recommended that only the test materials from one school be packed into a single security bag. In other words, no two schools should be permitted to share a single security bag.
For schools that have higher enrolments, the recommendation is to pack test materials in two separate security bags by grade, if the number of students in either grade exceeds 69. The goal is to avoid overloading the security bags with materials and to ease the burden of transporting and distributing the materials for test administrators.
As previously explained in Section 5.4, an overage factor should be applied to most items. Extra supplies of test materials are used to cover unexpected shortages, such as misprinted booklets.

38
In general, class enrolment figures, plus the overage factor, should be used to determine the number of test materials allocated to schools.
5.5.2 Steps for Allocating Materials
1. Create Test Material Allocation Forms (TMAFs). a. Complete/fill in a TMAF for each school. (See Appendix B for an example of a
blank TMAF.) b. Use a software application, such as MS Excel, to calculate the quantity of
materials needed to allocate to schools. After the quantity is calculated, use mail-merge to populate the TMAFs with the necessary information.
c. Print at least three copies (if possible) of the TMAF for each school. All three copies can be used as guides to allocate test materials during the packing process: One copy will later be used by the Regional Officer to check the number of test materials sent to the region; a second copy will be used by the District Officer to check the number and type of test materials sent to the district and schools; and a third copy can remain at the ASU office as a record of the quantity and type of materials sent to the school. This third copy can also be used to assist in checking test materials when they are sent back to the ASU offices after test administration.
2. Order test materials from the vendors who can supply these materials. Start this activity early enough that vendors have time to find the correct quantity, quality, and type of materials.
3. Evaluate the condition of the test security bags already in hand. Some bags may have been damaged during the last round of use. It may be necessary to repair the bags and/or contract with a tailor to make new bags. Bags may also need to be cleaned.
4. Create labels: If possible, create the following printed labels: a. Test security bag label that has the region name, district name, school name,
school code, and school grade (if school has high enrolment numbers). The label can be printed on paper, such as manila paper. If possible, use different coloured paper for each region’s labels. This will help in organizing security bags during the packing, transportation, and distribution process. Note that it is best to laminate the label to increase its durability. To attach the labels to the test security bags, perforate the label and create one small hole using a paper punch. Then use twine to attach the label securely to the test security bags.
b. Test security bag key envelope label that contains region name, district name, school name, school code and school grade (if school has high enrolment numbers).
c. Answer sheet envelope labels that contain region name, district name, school name, school code, school grade, and test subject. Create an answer sheet envelope label for each test subject and grade. In addition, it is best to create a spare envelope label that does not indicate test subject or grade. This label will be placed on the spare answer sheet envelope sent to schools.
d. Writing materials label that contains region name, district name, school name, school code, and school grade.

39
e. District materials envelope label that contains the region and district name.
5.6 Packaging and Transporting Test Materials to Regional Centres
Find a site that is convenient for packing activities. The site should preferably be a large hall and include a sufficient number of tables and chairs to accommodate those packaging the materials as well as all the materials. A hall large enough to comfortably accommodate 25 tables that are 1 meter x 2.5 meters in size should be identified and reserved for the packaging activity. Lay out and then correctly assemble the materials. There should be enough space so that all test security bags from at least one region (and preferably two regions) can be laid out individually.
5.6.1 Test Materials Assembly Steps
1. Collate. If the test booklets are not already collated, collate test booklets so that each of the equivalent forms is arranged consecutively for the booklets, e.g., for P3 maths test booklets, arrange the forms as Form 1, Form 2, Form 3, and Form 4. Create bundles of test booklets with the forms arranged in this manner for each test subject.
2. Count. Using the TMAFs, count the number of test booklets needed for each test subject and grade. Then use twine to hold this bundle of test booklets together. Repeat the steps above for each grade, test subject, and school.
3. Assemble other test-taking materials. Using the TMAFs, count the number of writing materials, pencils, erasers, sharpeners, and blank paper needed for each grade. If these materials cannot fit into an envelope, use brown paper to bundle them together. Attach the writing materials label to this package.
4. Attach security label. Attach the test security label to the test security bags with twine.
5. Assemble envelopes and labels. Attach the test security bag key envelope, answer sheet envelope, and district materials envelope labels to their respective envelopes (and the writing materials envelope, if it is decided to use an envelope to hold the writing materials).
6. Assemble answer sheets. Using the TMAFs, pull out the number of answer sheets needed for each grade, test subject, and school. If needed, record the answer sheet identification number—a six-digit number located on the upper right corner—of the first and last answer sheet, for each grade and test subject on the TMAFs. Place this bundle between two hard covers and then secure the bundle using a rubber band. Lastly, place the bundle in the answer sheet envelope whose label identifies the contents in the bundle. For example: P3 English answer sheets should be bundled and placed in the envelope labelled P3 for that school. Remember that there is an envelope for each grade and test subject. Repeat the steps above for each grade, test subject and school.
5.6.2 Test Materials Packaging Steps
1. Working region by region and using the TMAFs, lay each school’s test security bag on the ground. Remember that some schools may need more than one bag, depending on their enrolment numbers. If possible, keep the bags grouped by district.

40
2. Place the assembled materials for each school, answer sheets in their envelopes, test booklets, writing materials, and packaging materials for test administrators (brown paper and cello tape) on top of the test security bags.
3. Using the TMAFs, review and check that all the test materials needed for each school have been placed on top of the security bag. If all the materials are present, then put the materials inside the bags and place one copy of the TMAF on top of the contents of the bag.
4. Use padlocks to hold the top of the bags together and secure the bag. 5. Place the padlock key inside the key envelope labelled for each bag, and then staple
the envelope together. 6. Place the key envelope and one copy of the TMAF for each school in an envelope
addressed to the District Director of Education. Seal the envelope. 7. Load the security bags onto trucks for hauling to the regional offices. 8. Give the district envelopes to the driver of the truck for delivery to the respective
Regional EMIS Coordinator. 9. Repeat the steps above for all regions.
5.6.3 Receipt of Test Materials at Regional Offices
Steps: 1. The Regional NEA/SEA Coordinators use the TMAFs to cross-check the quantity of
materials sent to the region. 2. After receiving the test materials, the Regional NEA/SEA Coordinators invite the
District Directors or representatives (Assistant Director, Supervision) for collection.
5.6.4 Collection of Test Materials from Regional Offices
The District Assistant Director, Supervision, is responsible for the following: 1. Checking security bags at the regional offices by comparing the test materials in the
bags to the information on the TMAFs. 2. Collecting the security bags from regional offices and sending them to the district
offices. 3. Distributing security bags to test administrators at least three days before the test
administration date. 4. Returning completed answer sheets and all other test materials to the regional
offices.
5.7 Roles and Responsibilities of Directors of Education and Circuit Supervisors
In administering the NEA, national, regional, district, and school-level personnel play key roles. As a reminder, theses roles are described here and also sent to the regions, districts, circuits, and schools.
5.7.1 Regional Education Office
Staff at the Regional Education Office will receive the security bags, pack them by district, and inform the district offices about the arrival and collection of the bags.

41
5.7.2 District Education Office
The District Director of Education is responsible for the satisfactory administration of the NEA test in all P3 and P6 classes in his/her district and will:
1. Provide enrolment of sample schools and classes by circuit and sex. 2. Provide names of circuits and Circuit Supervisors in the district. 3. Ensure the security of test materials during the distribution of materials, test
administration, and monitoring of tests throughout the district. 4. Pay ‘approved’ allowances that are due to test administrators. 5. Ensure that district, school, pupil IDs, and other relevant information are properly
shaded on the answer sheets. 6. Ensure timely submission of district-level reports, used materials, and unused NEA
test materials to the Regional Director of Education.
5.7.3 Circuit Supervisors
The Circuit Supervisor who is trained and posted as a test administrator will administer the NEA test in the school to which s/he is posted. S/he will fill in the regional, district, school, and pupils’ IDs on the answer sheets.
5.7.4 School Personnel
The head teacher will:
1. Prepare the classrooms for the test 2. Give class registers to the TAs 3. Ensure that all pupils are present on the day of the test.
5.8 Administration of NEA and Monitoring
The credibility of the NEA test results, to a large extent, hinges on the calibre of those who administer the test, the level and quality of training they are given, their adherence to the requirements of the Test Administrator’s Manual, and a uniform administration of the test. A large-scale testing such as the NEA requires a large number of test administrators. Experience has shown that assembling very large numbers of people in one place for a training programme for this type of effort is not effective. It is best to have groups of no more than 120 at a time to make the number of participants controllable and the training more effective. Thus, regional-based training is highly recommended by ASU.
5.8.1 Selection of Test Administrators
For security reasons, test administrators are not posted to the circuits where they work. It is recommended that the coordinators set up a simple form to track the posting of test administrators to sampled schools.
5.8.2 Trainers of Test Administrators
ASU has a cadre of trainers of test administrators for the NEA. Nevertheless, as the programme expands and some trained test administrators either retire or are moved on to other schedules, many more test administrators will have to be recruited and given

42
adequate training alongside their colleagues who, from time to time, will need to be updated.
5.8.3 Test Administration Training Programme
The training programme should be planned and designed in advance of the actual training to allow more time for those concerned to prepare, as well as for the necessary materials such as scannable answer sheets, the Test Administrator’s Manual, coded school forms, test administrator posting forms, and other items to be procured.
The test administration training programme should include the following:
1. Overview of the NEA 2. Roles and responsibilities of Directors of Education at the national (headquarters),
regional, and district levels, Circuit Supervisors/test administrators 3. Ensuring security of test materials 4. Discussion of Test Administrator’s Manual 5. Pre-coding of scannable answer sheets and other test materials 6. Post-test administration activities: Preparing test materials for retrieval at the
appropriate time and place 7. Practice administration of NEA test in peer groups 8. Group reporting of practice administration at plenary sessions 9. Confirmation/updating of sample school enrolments 10. Assignment of test administrators to sampled schools.
5.8.4 Registration of Participants at the Training
At the training venue, participants should be registered on a regional and district basis to facilitate workshop report compilation.
5.8.5 Selecting the Date for Administering the NEA Tests
In selecting the date for administering the NEA tests in the sample schools, care should be taken to ensure that the day does not coincide with any public activity in which the schools will be involved.
Usually the date selected for testing is near the end of the school year, about the last week of the third term, to enable the P3 and P6 sample schools to ‘complete’ the core content of their English and mathematics syllabi. These safeguards notwithstanding, some schools have complained in the past that the administration of the test disrupted their end-of-term activities, e.g., the end-of-term test. A compromise could be to administer the NEA one week before the end of the school year. Whatever the case, the date should be set early enough to give the schools time to prepare for it.
Materials for the test should reach the test administrators long enough ahead of time for the testing to begin on schedule. Test administrators should administer the test according to guidelines in the Test Administrator’s Manual.

43
5.8.6 Monitoring
Monitoring is an integral and essential part of the testing process and should be treated as such. The NEA test is administered in a large number of schools scattered all over Ghana and requires the use of an equally large number of monitors in order to make monitoring effective. The district directorates monitor the test in their districts; additionally, regional and national officers may assist with monitoring activities.
The training of monitors should be well organized at the district level by trained test administrators. A Test Monitor’s Manual is made available to all monitors with instructions to report to ASU indicating their observations and findings from their trips. In this way, monitoring will be helping to ensure that the testing is done well and effectively and that incidences of exam malpractice are curtailed. Additionally, it is recommended that each school be monitored and that larger schools have at least two monitors assigned.

44
SECTION 6: HANDLING OF COMPLETED TEST MATERIALS
6.1 Retrieval of Security Bags
Shortly after the NEA administration, the security bags are sent from the districts to the regional offices. Officers from ASU office go to the regional offices to retrieve the security bags. At the regional office, ASU officers or their representatives open each security bag and check the content using a checklist or the Test Material Allocation Form. After these checks, the bags are loaded onto vehicles and sent to ASU office in Accra for further processing.
6.2 Receipting Process
This section describes the recommended process and procedures for receipting answer sheets, class lists, monitoring forms, and any other forms. The process can be adjusted if changes are made to the test materials or test procedures in any round of NEA tests.
It is recommended that an Excel spreadsheet or other similar program be used to document these steps. It is also recommended that the data processing activities outlined below be carried out by region, with the responsible person completing each region’s activities before moving on to the next. In addition, within the regions, only one school should be reviewed, receipted, or scanned at a time. Organizing the work in this way will control errors at every stage.
If an Excel spreadsheet is used, it is recommended that columns that represent different activities or information be shaded in different colours. The first few columns should identify the school name, school code, region, and district for each school in the sample or region. Each school should be listed on a separate line and schools should be grouped by district.
The steps in the receipting process are:
1. Confirm that the school name and school ID code on each answer sheet envelope match the school name and school code in the Excel spreadsheet. This step is important, as some answer sheets may not have been returned from the district in the labelled envelope that was provided. If the school name or school code is incorrect on the answer sheet envelope, write the correct school name/code on the envelope prior to receipting.
2. Answer sheets: Confirm that all answer sheet envelopes have been received, by placing a checkmark against each grade and subject box (in the Excel spreadsheet) to indicate which answer sheet envelopes are present. Note that it may be necessary to break the envelope seal to confirm that each subject and grade answer sheet has been received. If no answer sheets were received, enter ‘0’ in the check box.
3. Class lists: Record the number of students for each school by grade. Note that there may be more than one class list per grade. If that is the case, sum and record the total number of students by grade obtained from two or more lists. If no class lists were received, write ‘0’ in the check box.

45
4. Monitoring forms: Record the total number of monitoring forms received per school. If monitoring forms were included in the materials received back from the districts, record the number of forms present. For example, if there were 4 monitoring forms for school A, enter ‘4’ in the monitoring form check box on the receipt form. If no monitoring forms were received, enter ‘0’ in the check box.
5. Finally, the staff member receipting the materials should place a checkmark and their initials on the upper right-hand corner of each answer sheet envelope, class list, and monitoring form. This checkmark can be used as an added confirmation that the answer sheet envelope, class list, and monitoring form have been recorded as ‘received’ in the spreadsheet.
6.3 Storage
Answer sheets should remain in the answer sheet envelopes and stored in a secure location. All the envelopes for each school should be grouped and stored together. Answer sheets should be arranged by region, district, and school within the bookcases. If possible, a hard cover should be placed between districts to denote a new district.
Class lists for each school also should be stored in a secure location. All class lists should be filed by region, district, and school. These class lists should be stored securely until the information collected has been entered into a database. Prior to storing class lists, check to make sure that the school name and grade are present and legible on each list. If school name is not legible, re-write the school name on the class list.
Similarly, monitoring forms from each school should be stored in a secure location. All monitoring forms should be filed by region, district and school. These monitoring forms should be stored securely until the information collected on the forms has been entered into a database.
6.4 Management of Missing Items
It is important to identify any missing items.
1. Using the spreadsheet, review the answer sheet and class lists columns for missing items. For each school, missing items will be identified by a value of ‘0’ in these columns.
2. In a separate column, record the date of the first follow-up attempt with the region, district, or school personnel to retrieve missing items.
3. In another column, record any information provided and action taken to retrieve the missing item. If needed, use a separate column to record the final outcome of follow-up.
6.5 Pre-Scanning and Editing (Answer Sheets)
All answer sheets need to be reviewed to identify potential issues such as those outlined below. It is recommended that all identified issues be corrected and edited as explained. Remember, too, that it is recommended to review and edit one school at a time. Finally, the review and editing process should be supervised closely and frequently.
46
6.5.1 Completely Blank Answer Sheets
Remove any answer sheets that are completely blank from each answer sheet envelope and set them aside.
6.5.2 Partially Blank Answer Sheets
These are answer sheets that appear to be partially completed (that is, pupil’s name, gender, or subject is written and/or only some of the answers have been shaded). School name, class, subject code, etc., may need to be shaded and should follow the same directions as for ‘errors in top part of answer sheet’ (see Section 6.5.3). Note that all partially blank answer sheets should be scanned.
6.5.3 Errors in Top Part of Answer Sheet
Pupils may have made errors while completing answer sheets. Potential errors in the top part of the answer sheet include: pupil name, school name, sex, subject, test form, and class. They should be handled as follows:
• Pupil name: If the pupil name is not on the answer sheet, leave it blank. • School name: If the school name is missing, write in the school name that appears on
the other answer sheets in the answer sheet envelope. Use a 2B pencil only. • Date: If the date was not filled in on the answer sheet, leave it blank. • Sex: If the sex is missing, determine the appropriate classification using the pupil’s
name and shade the corresponding oval circle. For example, Anne is a female name. Therefore, if the pupil’s first name is Anne, you would shade the oval circle corresponding to ‘female’. If you cannot easily determine the gender from the name, leave this line blank.
• Class: If the class is missing, check to find out which class appears on the other answer sheets in the answer sheet envelope. Shade the corresponding oval circle for ‘Class’.
• Subject code: If the subject code is missing, check to find out which subject code appears on the other answer sheets in the answer sheet envelope. Typically, green answer sheets are used for the English tests while pink answer sheets are used for the maths test. Shade the corresponding oval circle for ‘Subject code’.
• Test form: If the test form is missing, leave this line blank.
6.5.4 Errors in Shading Answers
Pupils may have shaded answers incorrectly. Errors in correctly shading test questions should be handled as follows:
• Lightly shaded answers: If the answer to a test question has been shaded too lightly, darken the shading using a 2B pencil so that the scanner can read the response accurately.
• Partially erased answers: If it is clear that the pupil meant to erase a response to a test question but the response was not fully erased, you should completely erase the response. Only a clean eraser should be used for this task.
• Other marks: The sensitivity of the scanner is such that it may pick up other marks surrounding the responses and thus record an incorrect response. To the extent
47
possible, completely erase unnecessary marks that appear near or around the test questions or response circles.
6.5.5 Damaged Answer Sheets
Some answer sheets may have been returned in a manner that makes them difficult to scan. For example, the answer sheet is folded, crinkled, torn, or mishandled in some other way. The information filled in on these damaged answer sheets will need to be transferred to a new answer sheet, as follows:
• If extra blank answer sheets for that same subject and from the same school you are editing were returned with the completed answer sheets, please use these answer sheets.
• If no blank answer sheets from this school are available, use any available blank answer sheet.
• Transfer all the information from the top part of the answer sheet and responses to test questions from the damaged answer sheet onto a blank answer sheet. Use a 2B pencil.
• Preferably, a second individual should check and confirm that the information on the damaged answer sheet has been recorded accurately on the newly completed answer sheet.
After reviewing and editing all the answer sheets in a given answer sheet envelope, put your initials and the date of the review/edit on the top left corner of the answer sheet envelope. Start a pile of answer sheet envelopes that have been reviewed and edited and are awaiting scanning. Remember to keep all answer sheet envelopes placed arranged by school, district, and region.
6.6 Scanning Process (Answer Sheets)
The scanning process is done using an optical scanner. For the 2011 administration, ASU owned series OpScan 8 scanners, along with the Optical Scanner function within Scan Tools Plus, which is commercial software. However, if an alternative high-quality scanner is more readily available in Ghana and can be serviced in Ghana, that would be preferable.
It is recommended that scanning begin when the answer sheets for a sufficient number of schools have completed the pre-scanning process in Section 6.5.
To maintain an efficient process flow, at least 50 completely pre-scanned schools should remain as backlog so there is no break between pre-editing and scanning. All ASU staff should work on editing and reviewing the answer sheets in order to maintain this flow.
Once there is a sufficient backlog of pre-scanned schools, the scanning process can begin. Two or more staff should continue with editing until all the editing has been completed. This will ensure that there is a constant supply of edited forms ready for editing. The scanners work quite quickly and this is why having a backlog will be important.
The operator (i.e., the individual scanning the answer sheets) needs to enter the school code (nine-digit number) into the scanning application, before feeding the scanner with the answer sheets. This is the only link that matches the scanned data with the school.

48
Therefore it is very important that only one school is scanned at a time. In addition, the complete contents of each answer sheet envelope (e.g., P3 maths or P3 English) should be scanned before the operator moves on to the next envelope.
Scanning should proceed as follows:
1. Confirm that the school name and school code on each answer sheet envelope match the school name and school code in the Excel spreadsheet. As with the receipting process, this step is important, as some answer sheets may not have been returned from the district in the labelled envelope that was provided. If the school name or school code is incorrect on the answer sheet envelope, write the correct school name/code on the envelope before scanning.
2. Note that you must enter the individual school ID code before scanning that particular school’s answer sheets. The scanner will print the school ID code on the scanned answer sheets.
3. After the first answer sheet from the school has been scanned, carefully ensure that the school ID code printed by the scanner on the answer sheet matches the school ID code on the answer sheet envelope. If the school ID code has been correctly entered, then proceed by scanning all the answer sheets (English, maths, and listening tests) for that school. If the entered school ID code is incorrect, then cancel the entry, re-enter the ID code, check the ID code and, if correct, proceed with scanning the remaining answer sheets for that school.
4. Place a checkmark in the Excel spreadsheet (or other documenting system) to indicate that scanning for that school by grade and subject has been completed.
5. As soon as the scan for a school has been completed, the answer sheets for that particular school should be filed/stored in the secure filing cabinets, rubber-banded by region, district, and school. Do not put the answer sheets back into the school envelopes. Make sure that the answer sheets remain sorted by grade, class, and subject, with supporting hard covers. Cut the school label from one of the envelopes for that school and paper clip it to the hard covers prior to filing.
6.7 Data Cleaning
For any data collection effort such as the NEA, the data that are entered electronically are likely to contain errors of various types. For example, some fields may contradict other fields, some data may be missing or mislabelled, or there may be typographical errors (e.g., in the name of a school).
Before any analysis of the results begins, for either the pilot test or the full administration, it is critical to complete a data-cleaning step to resolve as many of the errors as possible, and to remove data that cannot be cleaned. As stated earlier, the 2011 NEA contained a total of four tests (P3 maths, P3 English, P6 maths, and P6 English); and for each test, there were four different forms. Therefore, there were a total of 16 different tests. In order to

49
properly match up each specific test with the correct answer sheet, every single test form must have a filled in:
1. Grade level (3 or 6)
2. Subject (1 for maths, 2 for English)
3. Form number (1, 2, 3, 4).
If one or more of these fields are missing (see Figure 12), the answer key cannot be linked to the test form and thus cannot be corrected, so it must be marked as ‘Incomplete’.
The idea behind the data cleaning is to find tests that have missing values for grade level, subject, or form number, and to try to fill in the missing value so that the test form may be considered complete. If there is any doubt whatsoever about what the missing value should be, leave the test form alone. That is, leave it as an ‘Incomplete’.
For the 2011 NEA, tests were scanned by school and an Excel data file was created. As the first test was read into the scanner, the scanner would do two things: it would print a ‘001’ on the test form and code a value ‘001’ into the school’s Excel data file. The second test for the school would receive a ‘002’ on the answer form, and ‘002’ code in the school’s Excel data file. This allowed for each paper test form to be linked to the electronic version in the Excel file. The scanner would continue sequentially labelling the test forms and coding the tests into the Excel data file until all the tests for that school were scanned.
By opening the school’s Excel data file, you can see if there are any missing values for Class, Subject, or Test Form.
Class. If there are missing values for any test forms, look at the variable called ‘SERIAL’. For instance, suppose that after scanning of all the test forms for school xxxx20014, the 6th test scanned (SERIAL=006) is missing ‘Class’ and the 12th test scanned is missing ‘Subject’. In order to determine if the missing values can be filled in, you will need to return to the paper test forms. Because the editors were instructed to organize every school’s test forms by grade and by subject, it should be easy to fill in the missing class and subject. By picking up the paper test form with a ‘006’ printed on it for school xxxx20014, you can check to see if it is located in a group of P3 tests or P6 tests. In our sample case, it turns out that the test form is in a group of P6 tests. By double-checking that the paper answer sheet has attempted questions that are numbered between 41 and 60 (that is, if the maximum number of P6 responses is the same as for the 2011 NEA), you can be more certain that it was a P6 test, and the missing value can be replaced with a ‘6’.
Subject. In this example, the paper answer sheet for the 12th answer form scanned reveals that ‘Subject’ is missing. Again, check the paper-based form for school xxxx20014 that has serial number ‘012’ written on it. In this example, you find it in a group that has Subject equal to ‘2’, meaning it is an English exam. Double-check that the answer sheet is pink (indicating that it is for English). If it is pink, then it represents an English exam, so the missing value under ‘Subject’ for serial ‘012’ should be ‘2’ for ‘English’.

50
Test form. Please note, if the ‘Test Form’ number is missing, you most likely will not be able to assign the appropriate value to the answer sheet. It is best to leave these alone and keep the test form as missing.
Figure 12. Sample of missing values for ‘Class’ and ‘Subject’
Check the data file for missing Class, Subject, and Test Form. If one or more of these values are missing, then try to fill in the number. Only do this if you are absolutely certain you have the correct number after you have double-checked with the paper-based answer sheet. If the Test Form code is missing, it is most likely best to keep it missing and keep the test form as incomplete.
Finally, for the pilot test in particular but also for the full NEA administration, it is advisable to generate descriptive statistics (such as frequency, mean values for item difficulty and student ability, and variance) and examine them for outliers and other anomalies.
After cleaning, the data are ready for analysis, as explained in Section 7.

51
{9/¢Lhb 7Υ STATISTICAL ANALYSIS OF DATA Administering the NEA and determining the pupils’ scores are only the first and middle stages of the process. The final stage involves compiling the data, carrying out a statistical analysis to determine what overall ‘story’ the data tell about pupils’ performance, and then reporting the story of the findings to stakeholders (as described in Section 8).
This section of the manual describes a process for framing and completing the statistical analysis. As such, it assumes a moderate to high level of knowledge about statistics and analytical software. It addresses the following topics:
1. Data analysis: Why is it important?
2. General education assessment framework
3. Research questions or policy issues
4. Indicators calculation from EMIS data
5. Analysing items
6. Calculating final scores
7. Sample design
8. Sample size
9. Application of sampling weights
10. One-way frequencies
11. Two-way frequencies
12. Regression and logistics models
13. How to interpret these results
14. Teachers’ practice, the unknown parameter
7.1 Data Analysis: Why Is It Important?
Data analysis makes it possible to:
• Estimate pupils’ competencies in P3 and P6 at the national and regional levels • Measure the precision of our estimates • Look for factors associated with higher learning outcomes • Report data to policy makers.
In the end, data analysis is a tool for improving learning outcomes.
7.2 General Education Assessment Framework
In an effort to improve pupils’ learning, it is possible to identify variables that have an impact on test scores. Variables are generally split into two categories:
• Contextual or demographic variables that go beyond the scope of education interventions, such as pupils’ socio-economic status, age, household living conditions, and location (rural/urban); and

52
• Policy variables in which the education system can intervene: teacher-training, class size, textbooks.
The most comprehensive data framework available to measure these variables is an observation and interview tool called the Snapshot of School Management Effectiveness (SSME), developed by RTI International. See Figure 13 for a graphic representation of the information that the SSME collects. More information about the SSME—including a frequently asked questions (FAQ) document, instruments, and reports from various implementations—can be found on the EdData II project website at www.eddataglobal.org under the School Management tab.
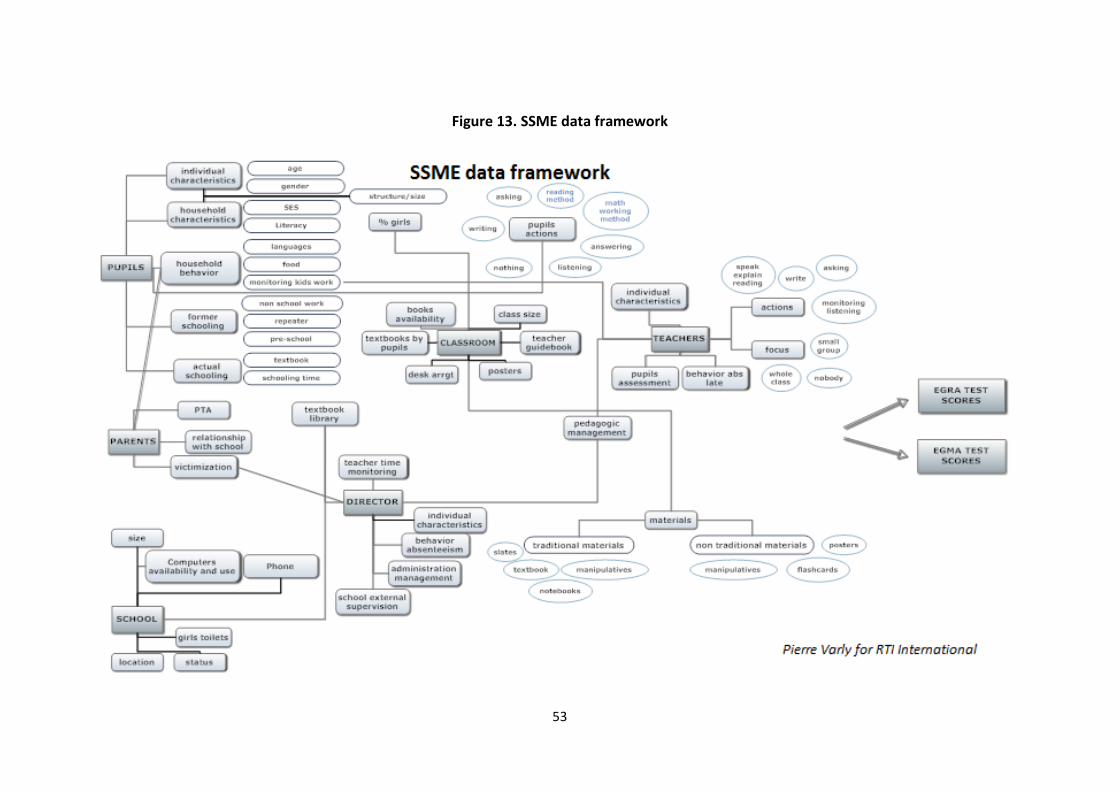
53
Figure 13. SSME data framework

54
7.3 Research Questions or Policy Issues
The framework for the data analysis can be established by determining which research questions or policy issues would be most important, and most understandable, for a general audience. For instance:
• Does teacher-training improve learning outcomes? • Are large classes linked to poor performance? • Do girls perform less successfully in maths?
Once the list of research questions has been established, the next step is to create the right variables and use the right method to answer the questions. Data limitations must be presented clearly, and any proxy indicators should be identified.
Table 15 contains a set of questions that were listed by the ASU and CRDD team by order of priority for the 2011 NEA administration. Questions without priority numbers were added by consultants as important factors that have been identified by the literature but that are not Ghana-specific.
Table 15. Policy issues framework
Priority Research Question
EMIS data
available? Proxy
available? Indicator
Teaching and learning environment
3 What is the effect of pupil-teacher ratio on test scores?
Number of pupils per classroom teachers
4 Do pupils in large classes have lower results?
Pupil-teacher ratio above 70
6 Do pupils in multi-grade classes experience lower learning outcomes?
School has at least one multi-grade classroom
9 Do school feeding programs improve attendance, retention, and learning?
School has school feeding program
15
What is the impact of the use of national language and/or English as the medium of instruction, depending on the level (grade)?
Languages used
16 Does the proximity of schools (to pupils’ homes) affect learning?
Only rural schools are classified as remote. ‘Remote’ means at least 10 km from the district office, head house, or next primary school

55
Priority Research Question
EMIS data
available? Proxy
available? Indicator
20
What is the difference in performance between rural/urban/public/private schools?
Type of school
School facilities
Existence/number of items (water, functioning electricity, toilets)
Teacher characteristics and practice
1 Do pupils of trained teachers perform better than pupils of untrained teachers?
Percentage of trained (qualified) teachers among classroom teachers
5 Does more time on task result in higher learning?
Pupils who attended school in November/enrolment
7 Is the frequency of formative assessment associated with higher learning?
10 Does the teacher’s instructional attitude toward pupils affect learning?
11 Does group work improve learning?
12
Do pupils whose teachers use a child-centered approach have better results than those whose teachers use a frontal approach?
19
Does the adaptation of teaching methods to pupils’ learning styles lead to better results?
22 Do pupils of teachers with higher academic qualifications have better results?
Junior high, senior high, or above
23 Does teaching content (domains) affect learning?
24 Do pupils of teachers with in-service training have better results?
Frequency of the delivery of in-service training

56
Priority Research Question
EMIS data
available? Proxy
available? Indicator
Teaching and learning materials/resources
2 Do textbooks/teacher guidebooks improve pupils’ learning?
Textbook-pupil ratio; at least one teacher guidebook in school
8
Does the use of information and communication technology (ICT) improve learning?
Amount and type of equipment in the school (does not necessarily reflect use of ICT in the classroom)
What is the effect of capitation grants on learning, retention?
(potential proxies
have too many
missing values)
Does access to library books improve learning?
Library book-to-pupil ratio
Community involvement
13 Does parental involvement in pupils’ learning improve performance?
14
Do schools where communities are involved (financing, monitoring, material support…) have better performance?
Existence of school management committee (SMC); frequency of SMC meetings
School management
17 How does the head teacher’s leadership affect learning?
18
How does the school climate (teacher collaboration, working relationship, discipline) affect learning?
Does register-keeping affect learning?
Number and type of registers
Does a school performance improvement plan affect learning?

57
Priority Research Question
EMIS data
available? Proxy
available? Indicator Enrolment
Is there a relationship between dropout rates and learning outcomes?
Is there a relationship between transfer to rates and learning outcomes?
Is there a relationship between transfer from rates and learning outcomes?
7.4 Indicators Calculation from EMIS Data
In most surveys, new data are collected through questionnaires. However, sometimes these survey data can be supplemented by information already collected at the school level and entered into an education management information system.
Indicators that can be calculated using data from Ghana’s national EMIS include the following (see also Figure 14).
School location
• Region • District • Urban/rural
Teacher data
• % teachers having senior education • % female teachers • % trained teachers • Pupil-teacher ratio
Enrolment
• Dropout rates • Attendance rates
School data
• School resources – Library – Textbooks – Electricity
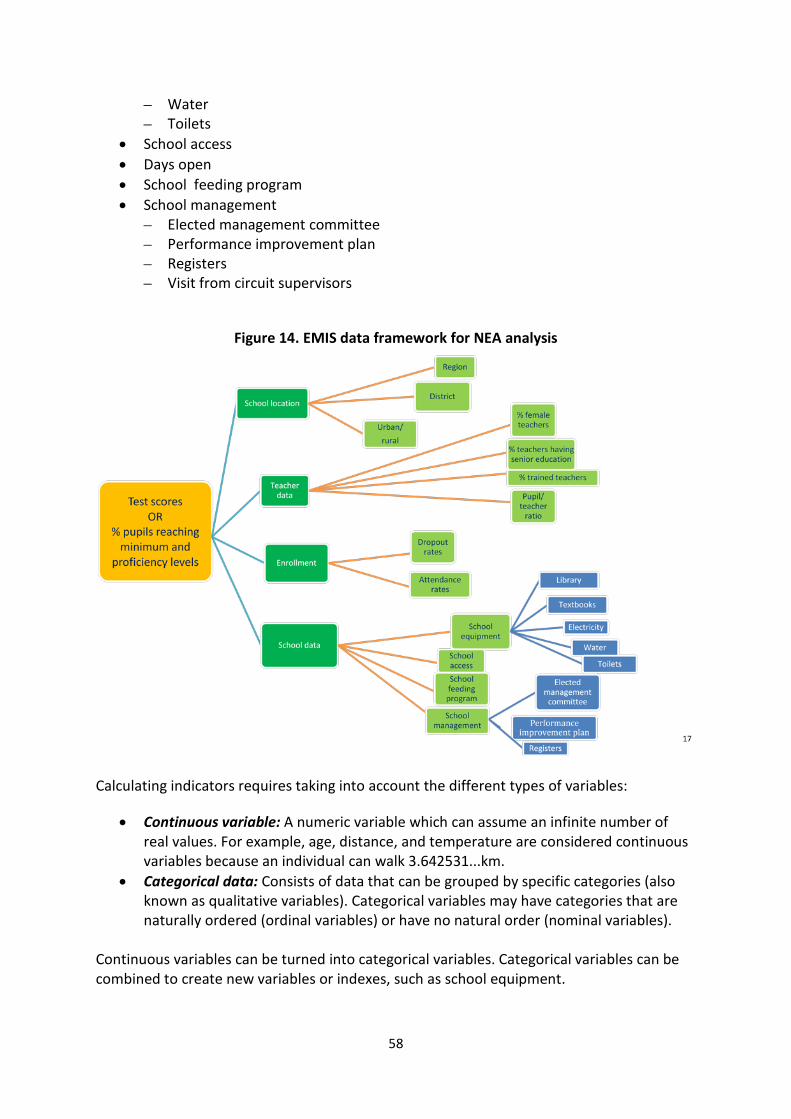
58
– Water – Toilets
• School access • Days open • School feeding program • School management
– Elected management committee – Performance improvement plan – Registers – Visit from circuit supervisors
Figure 14. EMIS data framework for NEA analysis
Calculating indicators requires taking into account the different types of variables:
• Continuous variable: A numeric variable which can assume an infinite number of real values. For example, age, distance, and temperature are considered continuous variables because an individual can walk 3.642531...km.
• Categorical data: Consists of data that can be grouped by specific categories (also known as qualitative variables). Categorical variables may have categories that are naturally ordered (ordinal variables) or have no natural order (nominal variables).
Continuous variables can be turned into categorical variables. Categorical variables can be combined to create new variables or indexes, such as school equipment.

59
These variable combinations can be performed using the different SPSS statistical software operators, such as:
• + – • * / • & | (and or) • if • < > • ~= (different)
In most statistical software, Boolean or logical variables can be created, taking the value 1 if the condition is true and 0 if the condition is false. For example, the following SPSS command creates an index of school facilities that is calculated for urban schools only.
IF (urban = 1) equip_index=water +smc+ funct_elect. EXECUTE.
7.5 Analysing Items
Test validity or reliability can be addressed from different points of view:
• Content or construct validity: Do tests measure what we expected to capture? • Apparent validity: Is the test socially accepted, i.e., reflects the type of exercises
given by teachers? • Internal consistency or validity: Does the test measure one general aptitude or is it
unidimensional (Cronbach’s alpha)? • External validity: When you compare the results of the test at pupil or school level
with the results of exams or other skills measurement, is there a correlation? In order to select the items that must be included in the final score, and to check for the equivalence of the different forms of the test, psychometric indicators can be calculated, such as:
• Cronbach’s alpha (to be ‘reliable,’ must be between 0.7 and 0.9) • Biserial point or item test correlation (above 0.2) • Difficulty index or success rate (not below 0.1 and not above 0.9) • Check of indicators’ value across forms.
You can eliminate some items from score calculation to keep the test balanced (domains repartition). However, you must take care not to withdraw an entire set of items measuring one domain; or if you do so, you should clearly document this in a report.
If an item is negatively correlated with the global score (or rest of the items), this item is divergent, meaning either it has a problematic formulation or it measures something different from the rest of the items.
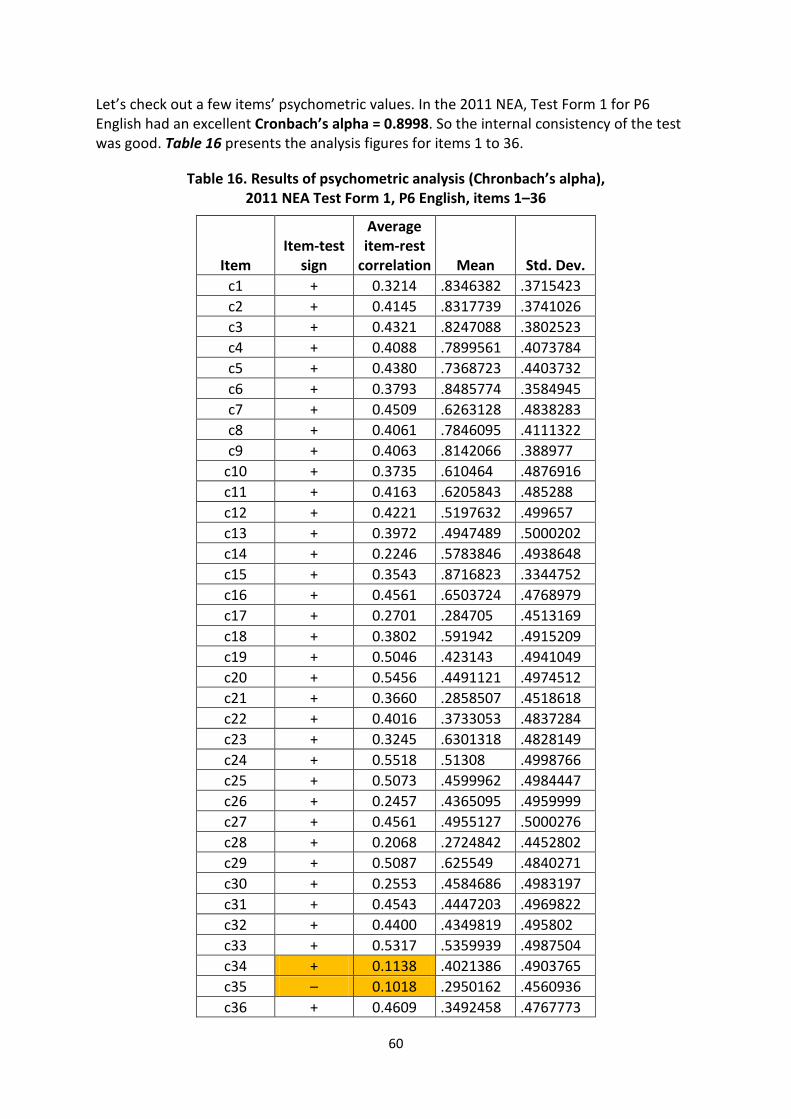
60
Let’s check out a few items’ psychometric values. In the 2011 NEA, Test Form 1 for P6 English had an excellent Cronbach’s alpha = 0.8998. So the internal consistency of the test was good. Table 16 presents the analysis figures for items 1 to 36.
Table 16. Results of psychometric analysis (Chronbach’s alpha), 2011 NEA Test Form 1, P6 English, items 1–36
Item Item-test
sign
Average item-rest
correlation Mean Std. Dev. c1 + 0.3214 .8346382 .3715423 c2 + 0.4145 .8317739 .3741026 c3 + 0.4321 .8247088 .3802523 c4 + 0.4088 .7899561 .4073784 c5 + 0.4380 .7368723 .4403732 c6 + 0.3793 .8485774 .3584945 c7 + 0.4509 .6263128 .4838283 c8 + 0.4061 .7846095 .4111322 c9 + 0.4063 .8142066 .388977
c10 + 0.3735 .610464 .4876916 c11 + 0.4163 .6205843 .485288 c12 + 0.4221 .5197632 .499657 c13 + 0.3972 .4947489 .5000202 c14 + 0.2246 .5783846 .4938648 c15 + 0.3543 .8716823 .3344752 c16 + 0.4561 .6503724 .4768979 c17 + 0.2701 .284705 .4513169 c18 + 0.3802 .591942 .4915209 c19 + 0.5046 .423143 .4941049 c20 + 0.5456 .4491121 .4974512 c21 + 0.3660 .2858507 .4518618 c22 + 0.4016 .3733053 .4837284 c23 + 0.3245 .6301318 .4828149 c24 + 0.5518 .51308 .4998766 c25 + 0.5073 .4599962 .4984447 c26 + 0.2457 .4365095 .4959999 c27 + 0.4561 .4955127 .5000276 c28 + 0.2068 .2724842 .4452802 c29 + 0.5087 .625549 .4840271 c30 + 0.2553 .4584686 .4983197 c31 + 0.4543 .4447203 .4969822 c32 + 0.4400 .4349819 .495802 c33 + 0.5317 .5359939 .4987504 c34 + 0.1138 .4021386 .4903765 c35 – 0.1018 .2950162 .4560936 c36 + 0.4609 .3492458 .4767773

61
Items 34 and 35 had low item-test correlation. Those questions tested pupils on idiomatic expressions, which can be seen as a different language skill than the rest of the items.
Using Stata software, the command for Cronbach’s alpha and item-test correlation calculation is: alpha c1-c60, std item
Where c1-c60 is the set of variables Using SPSS, the command is: RELIABILITY /VARIABLES=c1 –c60
Figures 15a through 15d are graphs of item difficulty indices showing that across the grades and subjects shown, the success rate decreased as the test progressed, with the most difficult items being placed at the beginning of the test; and that no item difficulty was above 0.9 or under 0.1.
Figure 15a. P3 English Form 1: Item difficulty index
0
0.1
0.2
0.3
0.4
0.5
0.6
0.7
0.8
0.9
1 3 5 7 9 11 13 15 17 19 21 23 25 27 29 31 33 35 37 39
Prop
ortio
nCo
rrec
t
Question Number
P3 English Form1

62
Figure 15b. P6 English Form 1: Item difficulty index
Figure 15c. P3 mathematics Form 1: Item difficulty index
0
0.1
0.2
0.3
0.4
0.5
0.6
0.7
0.8
0.9
1
1 3 5 7 9 11 13 15 17 19 21 23 25 27 29 31 33 35 37 39 41 43 45 47 49 51 53 55 57 59
Prop
ortio
nCo
rrec
t
Question Number
P6 English Form1
0
0.1
0.2
0.3
0.4
0.5
0.6
0.7
1 3 5 7 9 11 13 15 17 19 21 23 25 27 29 31 33 35 37 39
Prop
ortio
nCo
rrec
t
Question Number
P3 Math Form1
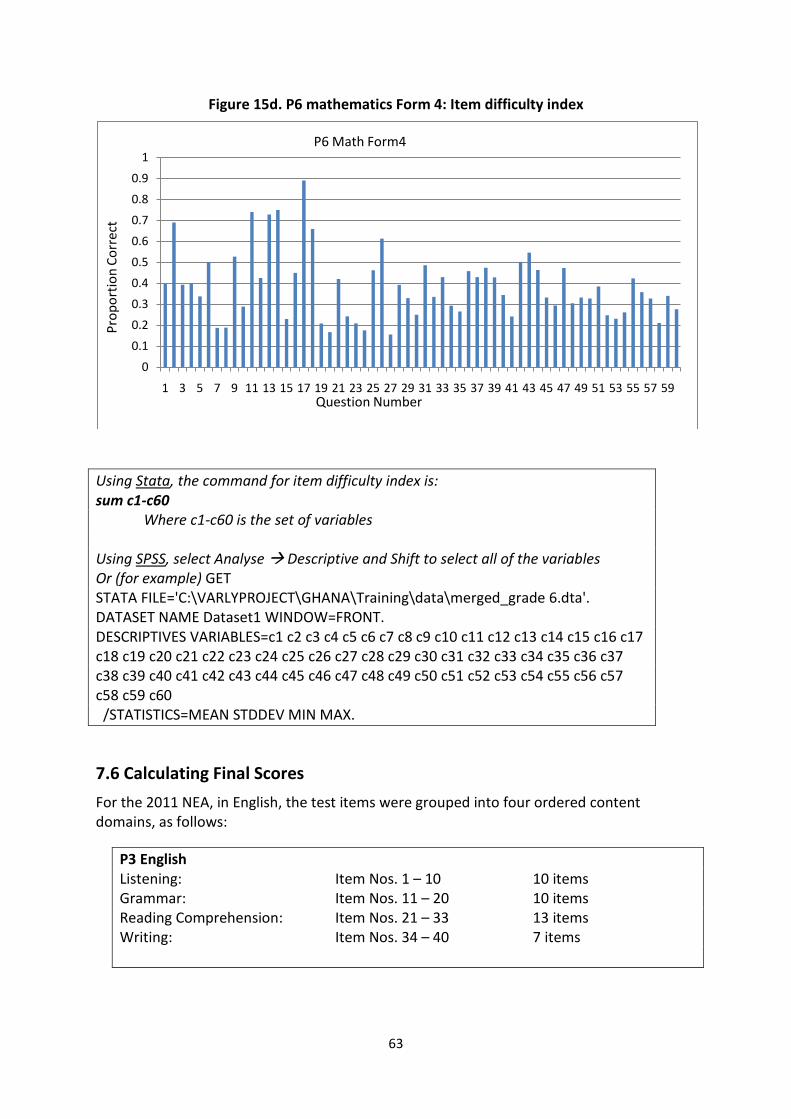
63
Figure 15d. P6 mathematics Form 4: Item difficulty index
Using Stata, the command for item difficulty index is: sum c1-c60
Where c1-c60 is the set of variables
Using SPSS, select Analyse Descriptive and Shift to select all of the variables Or (for example) GET STATA FILE='C:\VARLYPROJECT\GHANA\Training\data\merged_grade 6.dta'. DATASET NAME Dataset1 WINDOW=FRONT. DESCRIPTIVES VARIABLES=c1 c2 c3 c4 c5 c6 c7 c8 c9 c10 c11 c12 c13 c14 c15 c16 c17 c18 c19 c20 c21 c22 c23 c24 c25 c26 c27 c28 c29 c30 c31 c32 c33 c34 c35 c36 c37 c38 c39 c40 c41 c42 c43 c44 c45 c46 c47 c48 c49 c50 c51 c52 c53 c54 c55 c56 c57 c58 c59 c60 /STATISTICS=MEAN STDDEV MIN MAX.
7.6 Calculating Final Scores
For the 2011 NEA, in English, the test items were grouped into four ordered content domains, as follows:
P3 English Listening: Item Nos. 1 – 10 10 items Grammar: Item Nos. 11 – 20 10 items Reading Comprehension: Item Nos. 21 – 33 13 items Writing: Item Nos. 34 – 40 7 items
0
0.1
0.2
0.3
0.4
0.5
0.6
0.7
0.8
0.9
1
1 3 5 7 9 11 13 15 17 19 21 23 25 27 29 31 33 35 37 39 41 43 45 47 49 51 53 55 57 59
Prop
ortio
nCo
rrec
t
Question Number
P6 Math Form4
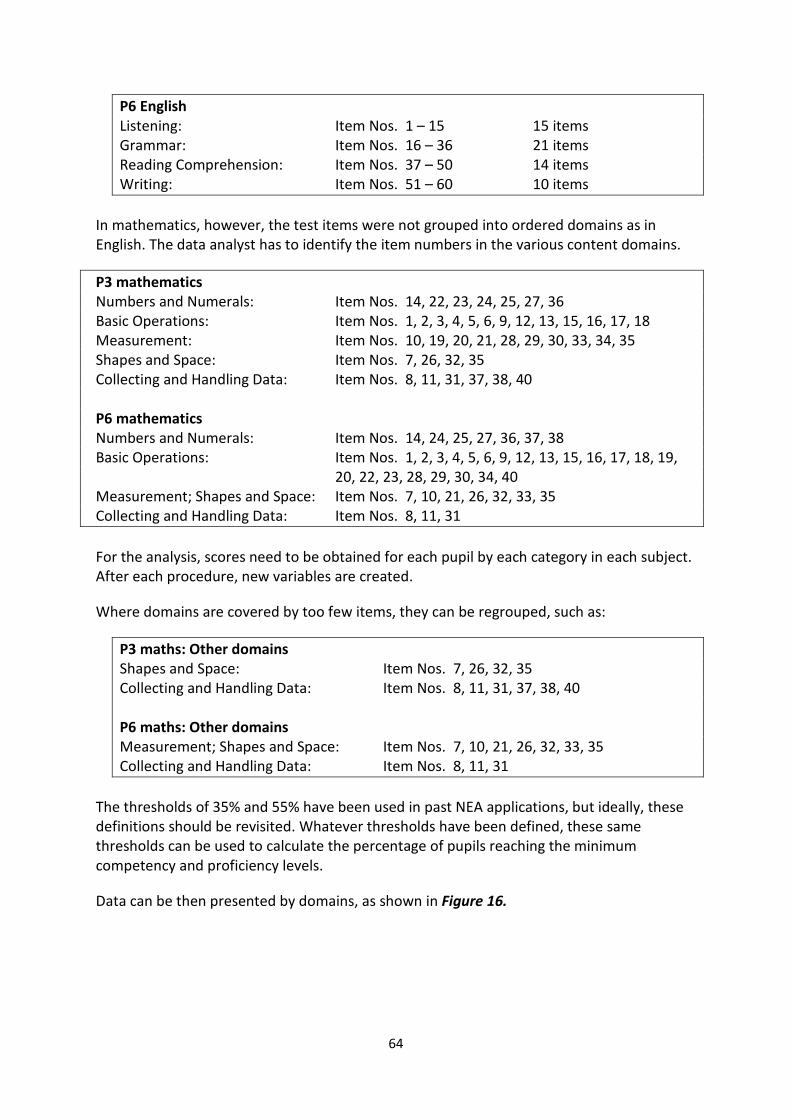
64
P6 English Listening: Item Nos. 1 – 15 15 items Grammar: Item Nos. 16 – 36 21 items Reading Comprehension: Item Nos. 37 – 50 14 items Writing: Item Nos. 51 – 60 10 items
In mathematics, however, the test items were not grouped into ordered domains as in English. The data analyst has to identify the item numbers in the various content domains.
P3 mathematics Numbers and Numerals: Item Nos. 14, 22, 23, 24, 25, 27, 36 Basic Operations: Item Nos. 1, 2, 3, 4, 5, 6, 9, 12, 13, 15, 16, 17, 18 Measurement: Item Nos. 10, 19, 20, 21, 28, 29, 30, 33, 34, 35 Shapes and Space: Item Nos. 7, 26, 32, 35 Collecting and Handling Data: Item Nos. 8, 11, 31, 37, 38, 40 P6 mathematics Numbers and Numerals: Item Nos. 14, 24, 25, 27, 36, 37, 38 Basic Operations: Item Nos. 1, 2, 3, 4, 5, 6, 9, 12, 13, 15, 16, 17, 18, 19,
20, 22, 23, 28, 29, 30, 34, 40 Measurement; Shapes and Space: Item Nos. 7, 10, 21, 26, 32, 33, 35 Collecting and Handling Data: Item Nos. 8, 11, 31
For the analysis, scores need to be obtained for each pupil by each category in each subject. After each procedure, new variables are created.
Where domains are covered by too few items, they can be regrouped, such as:
P3 maths: Other domains Shapes and Space: Item Nos. 7, 26, 32, 35 Collecting and Handling Data: Item Nos. 8, 11, 31, 37, 38, 40 P6 maths: Other domains Measurement; Shapes and Space: Item Nos. 7, 10, 21, 26, 32, 33, 35 Collecting and Handling Data: Item Nos. 8, 11, 31
The thresholds of 35% and 55% have been used in past NEA applications, but ideally, these definitions should be revisited. Whatever thresholds have been defined, these same thresholds can be used to calculate the percentage of pupils reaching the minimum competency and proficiency levels.
Data can be then presented by domains, as shown in Figure 16.

65
Figure 16. Sample: Percentage of P6 pupils reaching minimum competency and proficiency in mathematics
In order to calculate scores, you must compute every item response.
In this example (Table 17), the right answers for questions 27, 28, and 29 are, respectively, a, c, and b. So if a pupil’s answer is ‘a’ to question 27, his/her score will be 1; otherwise 0.
Table 17. Sample of item response computation for three test items (27 through 29)
1 2 3 4 5 6 7 8 9
A answer27 score27 answer28 score28 answer29 score29 score minimum
level B b 0 c 1 c 0 1 1 C b 0 a 0 a 0 0 0 D a 1 c 1 c 0 2 1 E a 1 a 0 a 0 1 1 F a 1 d 0 b 1 2 1 G d 0 c 1 b 1 2 1 H b 0 d 0 d 0 0 0 I b 0 b 0 d 0 0 0 J a 1 a 0 c 0 1 1 K c 0 c 1 b 1 2 1
1.1 70.00% Using Excel, this is calculated as follows: =IF(B2=’a’,1,0).
Copy and paste your formula to the bottom of the column.
Copy and paste the formula to cell B4, and update the ‘a’ in the formula with a ‘c’.
To calculate the score, create the variable score: =score27+score28+score29.
56.2%
67.1%
55.7%
32.8%
17.6% 19.0%
Numbers Operations Others
Grade 6 maths
Minimum level
Proficiency level
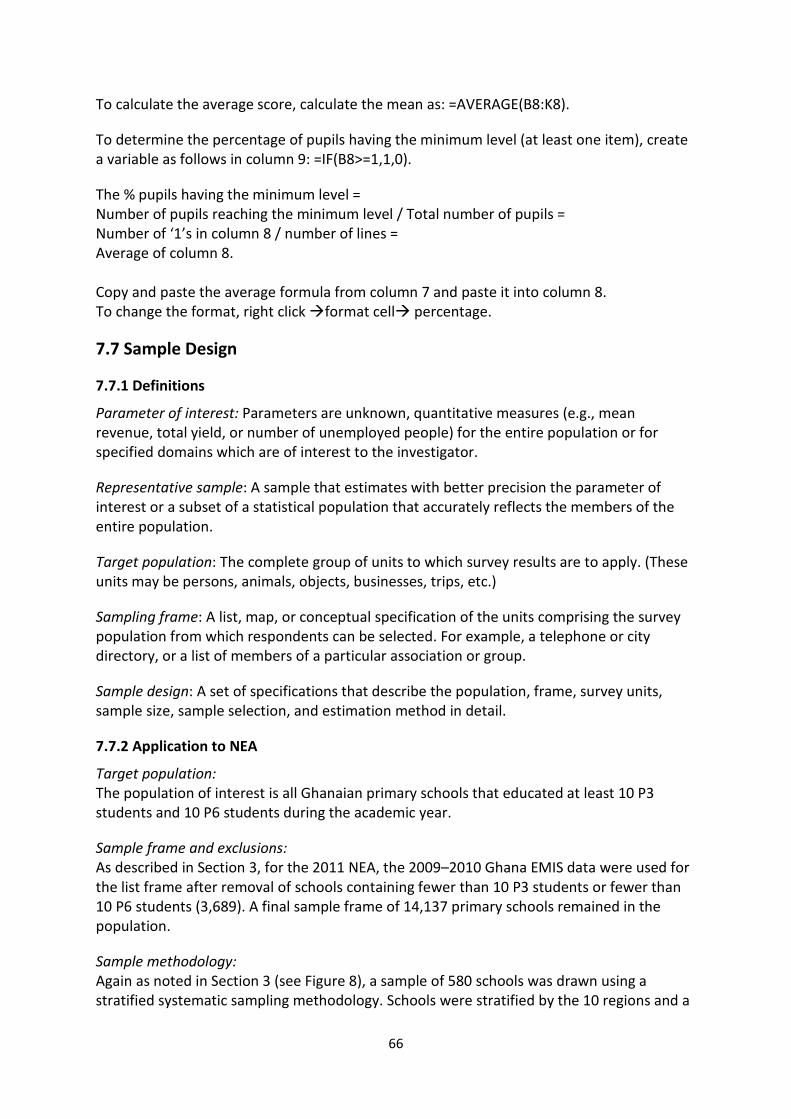
66
To calculate the average score, calculate the mean as: =AVERAGE(B8:K8).
To determine the percentage of pupils having the minimum level (at least one item), create a variable as follows in column 9: =IF(B8>=1,1,0).
The % pupils having the minimum level = Number of pupils reaching the minimum level / Total number of pupils = Number of ‘1’s in column 8 / number of lines = Average of column 8. Copy and paste the average formula from column 7 and paste it into column 8. To change the format, right click format cell percentage.
7.7 Sample Design
7.7.1 Definitions
Parameter of interest: Parameters are unknown, quantitative measures (e.g., mean revenue, total yield, or number of unemployed people) for the entire population or for specified domains which are of interest to the investigator.
Representative sample: A sample that estimates with better precision the parameter of interest or a subset of a statistical population that accurately reflects the members of the entire population.
Target population: The complete group of units to which survey results are to apply. (These units may be persons, animals, objects, businesses, trips, etc.)
Sampling frame: A list, map, or conceptual specification of the units comprising the survey population from which respondents can be selected. For example, a telephone or city directory, or a list of members of a particular association or group.
Sample design: A set of specifications that describe the population, frame, survey units, sample size, sample selection, and estimation method in detail.
7.7.2 Application to NEA
Target population: The population of interest is all Ghanaian primary schools that educated at least 10 P3 students and 10 P6 students during the academic year.
Sample frame and exclusions: As described in Section 3, for the 2011 NEA, the 2009–2010 Ghana EMIS data were used for the list frame after removal of schools containing fewer than 10 P3 students or fewer than 10 P6 students (3,689). A final sample frame of 14,137 primary schools remained in the population.
Sample methodology: Again as noted in Section 3 (see Figure 8), a sample of 580 schools was drawn using a stratified systematic sampling methodology. Schools were stratified by the 10 regions and a

67
separate stratum was created for the NALAP pilot schools, for a total of 11 strata. Fifty-five (55) schools were randomly selected in each stratum + 30 NALAP pilot schools.
For each selected school, all P3 and P6 students present on the day of testing were automatically chosen to participate unless there were more than 200 students in a class.
7.8 Sample Size
The test score variance can be differentiated by between-school and within-school varia-tion. This is measured through the intraclass correlation coefficient or rate of homogeneity rho or ρ. For a given number of pupils (from 10 to 20 pupils in major international surveys in Africa) and for a given rho and error size, statistical tables give the number of schools to achieve, which will provide the necessary sample size.
Example: If ρ = 0.5 and there are 20 pupils to sample per school, the number of schools must be 210.
The sample size does not depend on the number of schools in the country. As noted in Section 3, the sample size for the 2011 NEA was 580 schools and all pupils were selected in each school. The Ghana NEA sample should give reliable estimates of test scores and other variables, as well as estimation by region.
7.9 Application of Sampling Weights
The application of sampling weights yields a better estimate of the different indicators.
To calculate reliable estimates of test scores (see Table 18), we must correctly calculate the different indicator values (means or proportion).
• Simple mean is calculated as: (x1+x2+…xn)/n • Weighted mean is calculated as : (w1.x1+w2.x2+…wn.xn)/(Σw)
Where w is weight and where each individual has its own weight Weights are calculated at the school level using four variables:
• Number of selected schools in a region (strata) • Total number of schools in a region • Pupils enrolled by school • Tests attempted and completed by school
The more schools a region has and the more pupils a school has, the higher the weight is.
The exact formula for a stratified systematic sampling is:
Sample weights:
𝑊𝑡𝑆𝑎𝑚𝑝𝑙𝑒 =𝑇𝑜𝑡𝑎𝑙 𝑆𝑐ℎ𝑜𝑜𝑙𝑠(𝑏𝑦 𝑅𝑒𝑔𝑖𝑜𝑛)
𝑆𝑎𝑚𝑝𝑙𝑒𝑑 𝑆𝑐ℎ𝑜𝑜𝑙𝑠 (𝑏𝑦 𝑅𝑒𝑔𝑖𝑜𝑛)
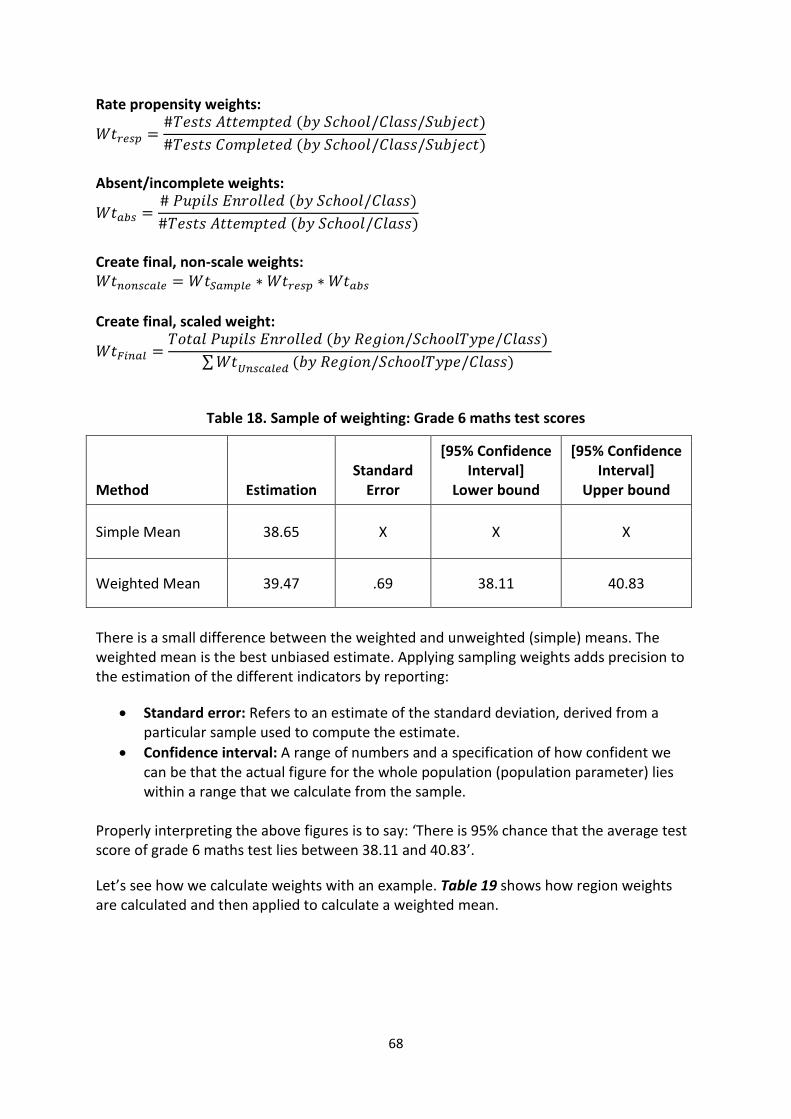
68
Rate propensity weights:
𝑊𝑡𝑟𝑒𝑠𝑝 =#𝑇𝑒𝑠𝑡𝑠 𝐴𝑡𝑡𝑒𝑚𝑝𝑡𝑒𝑑 (𝑏𝑦 𝑆𝑐ℎ𝑜𝑜𝑙/𝐶𝑙𝑎𝑠𝑠/𝑆𝑢𝑏𝑗𝑒𝑐𝑡)#𝑇𝑒𝑠𝑡𝑠 𝐶𝑜𝑚𝑝𝑙𝑒𝑡𝑒𝑑 (𝑏𝑦 𝑆𝑐ℎ𝑜𝑜𝑙/𝐶𝑙𝑎𝑠𝑠/𝑆𝑢𝑏𝑗𝑒𝑐𝑡)
Absent/incomplete weights:
𝑊𝑡𝑎𝑏𝑠 =# 𝑃𝑢𝑝𝑖𝑙𝑠 𝐸𝑛𝑟𝑜𝑙𝑙𝑒𝑑 (𝑏𝑦 𝑆𝑐ℎ𝑜𝑜𝑙/𝐶𝑙𝑎𝑠𝑠)#𝑇𝑒𝑠𝑡𝑠 𝐴𝑡𝑡𝑒𝑚𝑝𝑡𝑒𝑑 (𝑏𝑦 𝑆𝑐ℎ𝑜𝑜𝑙/𝐶𝑙𝑎𝑠𝑠)
Create final, non-scale weights: 𝑊𝑡𝑛𝑜𝑛𝑠𝑐𝑎𝑙𝑒 = 𝑊𝑡𝑆𝑎𝑚𝑝𝑙𝑒 ∗ 𝑊𝑡𝑟𝑒𝑠𝑝 ∗ 𝑊𝑡𝑎𝑏𝑠 Create final, scaled weight:
𝑊𝑡𝐹𝑖𝑛𝑎𝑙 =𝑇𝑜𝑡𝑎𝑙 𝑃𝑢𝑝𝑖𝑙𝑠 𝐸𝑛𝑟𝑜𝑙𝑙𝑒𝑑 (𝑏𝑦 𝑅𝑒𝑔𝑖𝑜𝑛/𝑆𝑐ℎ𝑜𝑜𝑙𝑇𝑦𝑝𝑒/𝐶𝑙𝑎𝑠𝑠)
∑𝑊𝑡𝑈𝑛𝑠𝑐𝑎𝑙𝑒𝑑 (𝑏𝑦 𝑅𝑒𝑔𝑖𝑜𝑛/𝑆𝑐ℎ𝑜𝑜𝑙𝑇𝑦𝑝𝑒/𝐶𝑙𝑎𝑠𝑠)
Table 18. Sample of weighting: Grade 6 maths test scores
Method Estimation Standard
Error
[95% Confidence Interval]
Lower bound
[95% Confidence Interval]
Upper bound
Simple Mean 38.65 X X X
Weighted Mean 39.47 .69 38.11 40.83
There is a small difference between the weighted and unweighted (simple) means. The weighted mean is the best unbiased estimate. Applying sampling weights adds precision to the estimation of the different indicators by reporting:
• Standard error: Refers to an estimate of the standard deviation, derived from a particular sample used to compute the estimate.
• Confidence interval: A range of numbers and a specification of how confident we can be that the actual figure for the whole population (population parameter) lies within a range that we calculate from the sample.
Properly interpreting the above figures is to say: ‘There is 95% chance that the average test score of grade 6 maths test lies between 38.11 and 40.83’.
Let’s see how we calculate weights with an example. Table 19 shows how region weights are calculated and then applied to calculate a weighted mean.

69
Table 19. Illustration of calculation of weights
Number of schools in the region
Number of schools in
the sample Region weight Average
score Weighted score A B C D E
2598 55 47.2 41.9 1979.8 1517 55 27.6 37.3 1028.8 1559 55 28.3 37.0 1050.0 1767 55 32.1 38.9 1250.5 1456 55 26.5 50.2 1328.5 544 55 9.9 31.8 314.2 544 55 9.9 35.9 355.4 427 55 7.8 35.7 277.0
1291 55 23.5 36.7 861.5 1621 55 29.5 39.9 1176.2
13324 550 Σw=242,3 38.5 Σs=9622.1
39.7
Region weights (C) are calculated as: Number of schools in the region (A) / Number schools in the sample (B) We multiply the region’s average test score (D) by the weight (C) to obtain the weighted scores (E).
We sum the weighted scores (Σs) at the bottom of the last column (E) and we divide by the sum of region weights (Σw) at the bottom of column (C) to obtain the weighted average score: Σs/ Σw= 9622.1/242.3 = 39.7.
This is a schematic representation of the calculation of a weighted mean, but we can keep in mind this procedure to also apply to schools.
7.10 One-Way Frequencies
In the case of a continuous variable, such as test score, you can calculate the mean or examine the distribution through a histogram (Figure 17).
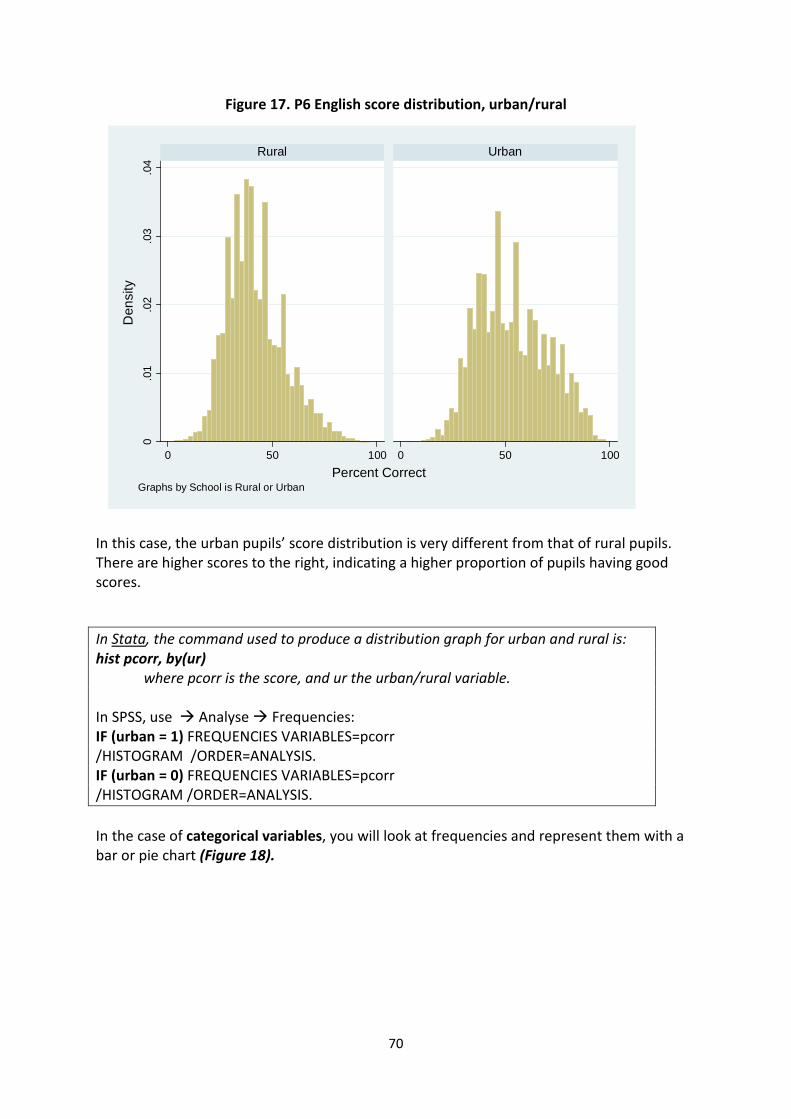
70
Figure 17. P6 English score distribution, urban/rural
In this case, the urban pupils’ score distribution is very different from that of rural pupils. There are higher scores to the right, indicating a higher proportion of pupils having good scores.
In Stata, the command used to produce a distribution graph for urban and rural is: hist pcorr, by(ur)
where pcorr is the score, and ur the urban/rural variable.
In SPSS, use Analyse Frequencies: IF (urban = 1) FREQUENCIES VARIABLES=pcorr /HISTOGRAM /ORDER=ANALYSIS. IF (urban = 0) FREQUENCIES VARIABLES=pcorr /HISTOGRAM /ORDER=ANALYSIS. In the case of categorical variables, you will look at frequencies and represent them with a bar or pie chart (Figure 18).
0.0
1.0
2.0
3.0
4
0 50 100 0 50 100
Rural Urban
Den
sity
Percent CorrectGraphs by School is Rural or Urban

71
Figure 18. Excel presentations: Categorical variables
Variable Estimate Standard
Error
Confidence Interval
Lower bound
Upper bound
Below minimum competencya 47.4 1.19 45.1 49.7 Between minimum competency and proficiency 34.4 0.64 33.2 35.7 Above proficiency 18.2 1.25 15.9 20.8
a Calculations based on the 2011 definitions of ≥35% score = minimum competency and ≥55% score = proficiency.
47.4
34.4
18.2 Below Minimal Competency
Between Minimal Competency and Proficiency
Above Proficiency
47.4
34.4
18.2
0 10 20 30 40 50
Below Minimal Competency
Between Minimal Competency and Proficiency
Above Proficiency
Below Minimum Competency
Between Minimum Competency and Proficiency
Between Minimum Competency and Proficiency
Below Minimum Competency

72
7.11 Two-Way Frequencies
You will adapt the tools used according to the type of the variables you want to compare and analyse:
Continuous Categorical
Continuous Correlation Scatter plot
Mean by categories Bar chart Box plot
Categorical Mean by categories Bar chart and box plot
Table
For example, if you are examining the relationship between two continuous variables, you can use a correlation coefficient or graphical representation in a scatter plot like Figure 19.
Figure 19. Comparison of two continuous variables: Scatter plot, relationship between textbooks-per-pupil ratio in English and maths
In this example, there is a clear relationship between the ratio of maths textbooks to pupils on the x axis, and the ratio of English textbooks to pupils on the y axis. This relationship can be visualised though the diagonal red line. The correlation coefficient is 0.53.
0.2
.4.6
.8E
NG
LIS
H te
xtbo
oks
per p
upil
ratio
0 .5 1 1.5 2 2.5MATHS Text Books per pupil ratio
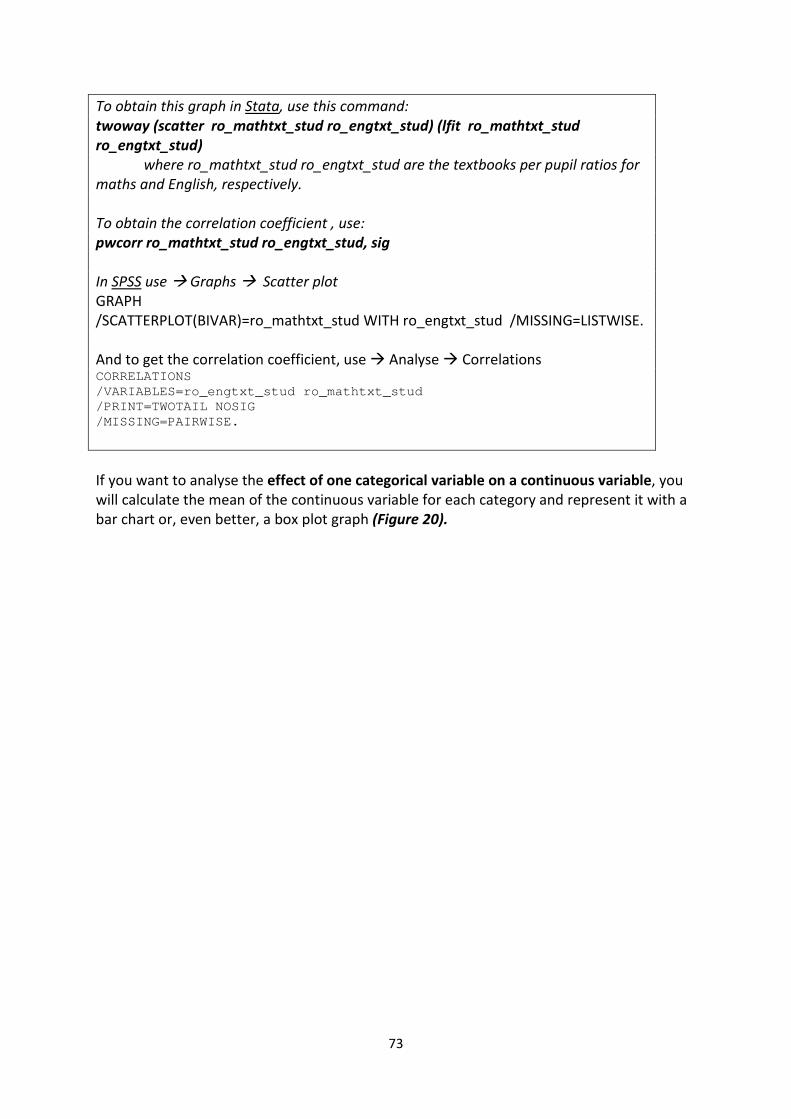
73
To obtain this graph in Stata, use this command: twoway (scatter ro_mathtxt_stud ro_engtxt_stud) (lfit ro_mathtxt_stud ro_engtxt_stud)
where ro_mathtxt_stud ro_engtxt_stud are the textbooks per pupil ratios for maths and English, respectively. To obtain the correlation coefficient , use: pwcorr ro_mathtxt_stud ro_engtxt_stud, sig In SPSS use Graphs Scatter plot GRAPH /SCATTERPLOT(BIVAR)=ro_mathtxt_stud WITH ro_engtxt_stud /MISSING=LISTWISE. And to get the correlation coefficient, use Analyse Correlations CORRELATIONS /VARIABLES=ro_engtxt_stud ro_mathtxt_stud /PRINT=TWOTAIL NOSIG /MISSING=PAIRWISE. If you want to analyse the effect of one categorical variable on a continuous variable, you will calculate the mean of the continuous variable for each category and represent it with a bar chart or, even better, a box plot graph (Figure 20).

74
Figure 20. Comparison of one categorical and one continuous variable: Box plot, P6 English score by region
Figure 20 shows that two regions outperform, while three regions underperform.
The box plot describes the mean and the dispersion of the variable. The horizontal line in each box represents the mean while the bottom of the box is the first quartile (25%) and the top of the box the third quartile (75%). For the first region on the left, 50% of the pupils’ scores lie between the box boundaries (40 and 65).
To obtain this graph in Stata, use: graph box pcorr, over(region_name) In SPSS use Graph Boxplot EXAMINE VARIABLES=pcorr BY region_name /PLOT=BOXPLOT /STATISTICS=NONE /NOTOTAL. In the example in Table 20, pupils in schools having computers (mean 50.33) seem to have better results than those in schools without (mean 43.98).
020
4060
8010
0P
erce
nt C
orre
ct
ASHANTI BRONG AHAFO CENTRAL EASTERN GREATER ACCRA NORTHERN UPPER EAST UPPER WEST VOLTA WESTERN

75
Table 20. Comparison of two continuous variables: P6 average test score by numbers of ICT equipment in the school
Variable No. of
Observations Mean Std. Err. [95% Conf. Interval]
No ICT 13,078 43.98421 .5486829 42.90605 45.06238
Computer 3,220 50.33519 1.252782 47.87347 52.79691
Computer and printers 921 61.29954 6.242347 49.03331 73.56577 To obtain this table in Stata: The following code has to be run while you are connected to the Internet. It will download more memory to your Stata program. set memory 500m, permanently update executable, force The following Code will declare how the sample was selected: use ‘<Data location>\<File Name>.dta’, clear svyset school_code [pw=wt_final_pop], strata(region_code2) fpc(tot_schools_reg) || _n , strata(classsubject) fpc(tot_students_class) singleunit(scaled) The following code will calculate the mean of ‘PCORR’ over sub population of ‘ICT-Equipment’: svy : mean pcorr, over(ict_equipment) To obtain this table in SPSS : Analysis Preparation Wizard: the following code will declare how the sample was selected: CSPLAN ANALYSIS /PLAN FILE='<Folder Location>\Performance_Data Analysis in SPSS.csaplan' /PLANVARS ANALYSISWEIGHT=Wt_final_pop /PRINT PLAN /DESIGN STAGELABEL='Stage1: Sample Schools' STRATA=Region_Code2 CLUSTER=school_Code_num /ESTIMATOR TYPE=EQUAL_WOR /POPSIZE VARIABLE=Tot_Schools_reg /DESIGN STAGELABEL='Stage2' STRATA=ClassSubject /ESTIMATOR TYPE=EQUAL_WOR /POPSIZE VARIABLE=Tot_Students_Class. The following code will calculate the mean of ‘PCORR’ over sub population of ‘ICT-Equipment’ * Complex Samples Descriptives. CSDESCRIPTIVES

76
/PLAN FILE='<Folder Location>\TestScores_Data Analysis in SPSS.csaplan' /SUMMARY VARIABLES= ict_equipment /SUBPOP TABLE=ClassSubject DISPLAY=LAYERED /MEAN /STATISTICS SE /MISSING SCOPE=ANALYSIS CLASSMISSING=EXCLUDE. As discussed before, the ICT equipment index is a proxy indicator of ICT use by pupils, as ICT equipment can be used for administrative rather than for learning purposes. Moreover, ICT equipment can sometimes be present only in urban schools. Therefore, behind the ICT equipment effect, there is probably an urban effect. So you might want to check the ICT vs. the urban variable, which are two categorical variables (Table 21).
Table 21. Comparison of two categorical variables: Rural/urban schools and ICT equipment
Rural Urban No ICT 74.71% 25.29% Computer 50.59% 49.41% Computer and printers 24.10% 75.90%
Schools without any ICT equipment are 74.71% rural and 25.29% urban.
To obtain this table in Stata, use: tab2 ict_equipment ur, row nofreq the option row indicates you want percentage by column and nofreq option is used not o produce raw data To obtain this table in SPSS, use Analyse Table * Tabuler. CTABLES /VLABELS VARIABLES=ict_equipment ur DISPLAY=LABEL /TABLE ict_equipment [C][COUNT F40.0] BY ur [C] /CATEGORIES VARIABLES=ict_equipment ORDER=A KEY=VALUE EMPTY=EXCLUDE /CATEGORIES VARIABLES=ur ORDER=A KEY=VALUE EMPTY=INCLUDE. Another way of dealing with effects of categorical variables on the score is by doing a test on subsamples (Figure 21):

77
Figure 21. Comparison of two categorical subsample variables: Average scores of urban schools vs. rural schools
Two-sample t test with unequal variances ------------------------------------------------------------------------------ Group | Obs Mean Std. Err. Std. Dev. [95% Conf. Interval] ---------+-------------------------------------------------------------------- Rural | 11622 42.07886 .1262429 13.60967 41.8314 42.32631 Urban | 5597 53.47563 .2252357 16.85058 53.03408 53.91718 ---------+-------------------------------------------------------------------- combined | 17219 45.78335 .1194764 15.67783 45.54917 46.01754 ---------+-------------------------------------------------------------------- diff | -11.39677 .2582023 -11.90291 -10.89064 ------------------------------------------------------------------------------ diff = mean(Rural) - mean(Urban) t = -44.1389 Ho: diff = 0 Satterthwaite's degrees of freedom = 9225.81 Ha: diff < 0 Ha: diff != 0 Ha: diff > 0 Pr(T < t) = 0.0000 Pr(|T| > |t|) = 0.0000 Pr(T > t) = 1.0000 The above test compares the rural schools’ average (42.07) with that of the urban schools (53.47) and concludes there is a significant difference between these two types of schools.
To run this test in Stata, use: ttest pcorr, by(ur) unequal Where unequal option specifies that the two sub sample have different variance In SPSS, use Analyse Compare means Two independent samples T-TEST GROUPS=ur(1 0) /MISSING=ANALYSIS /VARIABLES=pcorr /CRITERIA=CI(.95).
7.12 Regression and Logistics Models
Many education variables have strong correlations. For instance, trained teachers are often more attracted to capital cities, and private schools have lower class sizes and more textbooks. So if the private schools have better results than public schools, is it a class size effect, a pupil-teacher ratio effect, or a management effect?
To answer that question, regression and logistics models can be used to model the relationship between test scores or percentage of pupils reaching minimum level and school factors all together.
These models can be schematically described as:
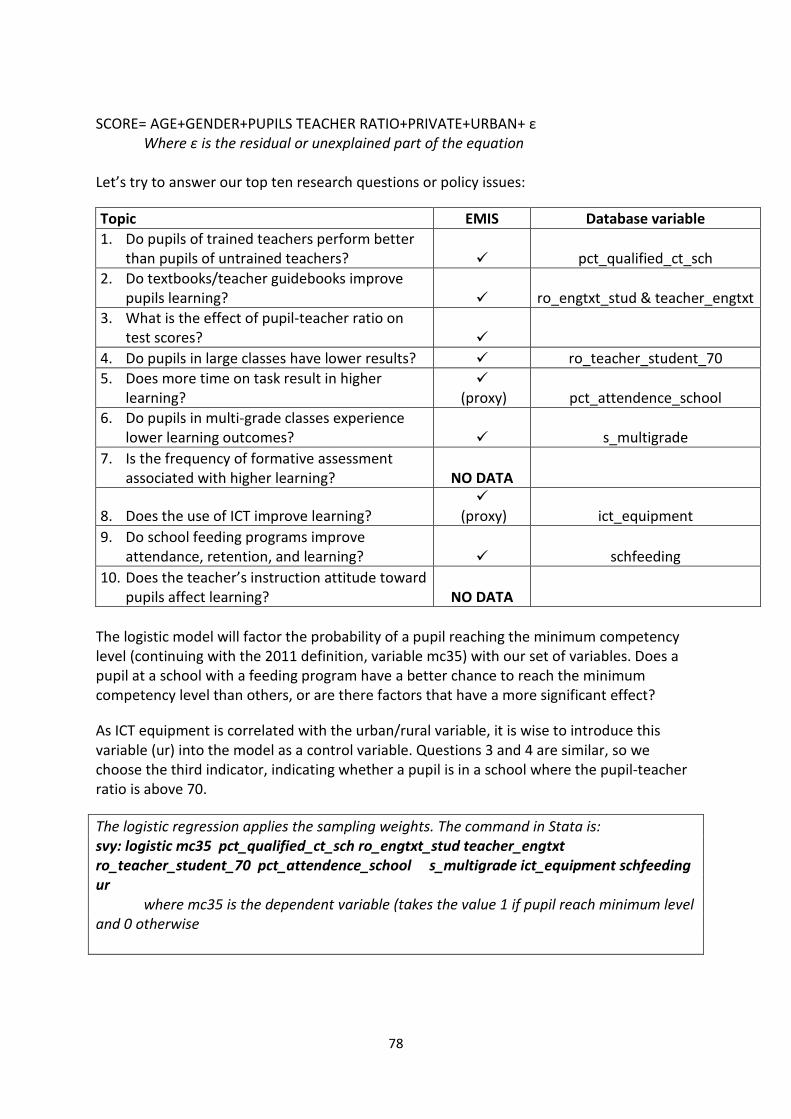
78
SCORE= AGE+GENDER+PUPILS TEACHER RATIO+PRIVATE+URBAN+ ε
Where ε is the residual or unexplained part of the equation Let’s try to answer our top ten research questions or policy issues:
Topic EMIS Database variable 1. Do pupils of trained teachers perform better
than pupils of untrained teachers? pct_qualified_ct_sch 2. Do textbooks/teacher guidebooks improve
pupils learning? ro_engtxt_stud & teacher_engtxt 3. What is the effect of pupil-teacher ratio on
test scores? 4. Do pupils in large classes have lower results? ro_teacher_student_70
5. Does more time on task result in higher learning?
(proxy) pct_attendence_school
6. Do pupils in multi-grade classes experience lower learning outcomes? s_multigrade
7. Is the frequency of formative assessment associated with higher learning? NO DATA
8. Does the use of ICT improve learning?
(proxy) ict_equipment
9. Do school feeding programs improve attendance, retention, and learning? schfeeding
10. Does the teacher’s instruction attitude toward pupils affect learning? NO DATA
The logistic model will factor the probability of a pupil reaching the minimum competency level (continuing with the 2011 definition, variable mc35) with our set of variables. Does a pupil at a school with a feeding program have a better chance to reach the minimum competency level than others, or are there factors that have a more significant effect?
As ICT equipment is correlated with the urban/rural variable, it is wise to introduce this variable (ur) into the model as a control variable. Questions 3 and 4 are similar, so we choose the third indicator, indicating whether a pupil is in a school where the pupil-teacher ratio is above 70.
The logistic regression applies the sampling weights. The command in Stata is: svy: logistic mc35 pct_qualified_ct_sch ro_engtxt_stud teacher_engtxt ro_teacher_student_70 pct_attendence_school s_multigrade ict_equipment schfeeding ur where mc35 is the dependent variable (takes the value 1 if pupil reach minimum level and 0 otherwise

79
In SPSS use, Regression Binary logistic LOGISTIC REGRESSION VARIABLES mc35 /METHOD=ENTER ro_chair_student pct_qualified_ct_sch ro_engtxt_stud teacher_engtxt ro_teacher_student_70 pct_attendence_school s_multigrade ict_equipment schfeeding ur /CRITERIA=PIN(.05) POUT(.10) ITERATE(20) CUT(.5). Stata output: Survey: Logistic regression Number of strata = 12 Number of obs = 15746 Number of PSUs = 438 Population size = 194869.02 Design df = 426 F(9, 418) = 14.70 Prob > F = 000
mc35 Odds Ratio Std. Err. T P>t
[95% Conf. Interval]
pct_qualif~h 2.403438 .4344377 4.85 0.000 1.684745 3.428718 ro_engtxt_~d 2.235596 .9770407 1.84 0.066 .9469473 5.277895 teacher_en~t .9372047 .1405338 -0.43 0.666 .6979642 1.258449 ro_teache~70 1.002207 .1898223 0.01 0.991 .6906802 1.454246 pct_attend~l .9951093 .0144541 -0.34 0.736 .9671008 1.023929 s_multigrade .6618418 .1225337 -2.23 0.026 .4599528 .9523467 ict_equipm~t 1.590993 .1939951 3.81 0.000 1.251938 2.021873 Schfeeding 1.071531 .1584329 0.47 0.641 .8012913 1.432911 urban 2.108886 .2836346 5.55 0.000 1.618992 2.747019
7.13 How Should We Interpret These Results?
Five variables are coming out as significant factors where the p-value (P>t) is less than 0.1 (shaded and in bold).
• The percentage of trained teachers in a classroom • The pupil-textbook ratio • The school has multigrade classrooms • The school has ICT equipment • The school is in an urban area
The model estimates the odds ratio as 0.66 for multi-grade classroom. This means that the chance that a pupil will reach the minimum competency level when in a multi-grade school is 66% of the chance of a pupil reaching minimum competency when NOT being in a multi-grade school. Or to take into account sample design, between 45% and 95% chance.
ICT equipment does increase the chance for a pupil to reach minimum competency level. A pupil in an urban school has twice (2.108886) the chance of a rural pupil to reach minimum competency level.
Odds ratio urban/rural= Chance to reach minimum competency when urban / Chance to reach minimum competency when rural

80
If Odds Ratio = 2 then an urban pupil has twice the chance to reach minimum competency level than a rural pupil. Great caution must be taken before making final statements. For instance, this model does not account for the public/private variable, which has a large impact on scores. A meticulous modeling process must take place to identify factors having a real impact on test scores.
7.14 Teachers’ Practice, the Unknown Parameter
In recent years, many research and evaluation projects have identified common patterns of factors influencing learning outcomes. The teaching practice in the classroom and effective time on task have been given considerable attention as factors of performance, along with more traditional inputs such as textbook availability, good learning conditions, manageable class size, and teachers’ training.
It is important here to focus on the different levels of curricula as a framework describing the processes that transform the pedagogical intentions of the syllabus into effective learning in the classroom. This process includes teachers’ practice, something that is rarely measured in education surveys.
Curriculum seen in a broader sense than what the syllabus requires is described in three levels (see Table 22), as follows (Houang, 2007):
Table 22. Illustrative curricular framework
Curricular level Definition Type of data/document
Official (or intended) Curriculum
This is reflected in official documents articulating national policies and societal visions, educational planning, and official or politically sanctioned educational objectives.
Syllabus, textbooks, official timetable
Implemented Curricula
At the level of teacher and classroom activity, curriculum is considered as implemented intentions and objectives.
Lesson content, types of exercises given in class, evaluations by teachers, exercise books
Attained curricula
The result of what takes place in classrooms. Academic achievement and student belief measures document part of these student attainments.
Pupil test scores, evaluations, and exams
The implemented curricula or effective teaching practices can be measured through a variety of methods:

81
• Interviews/questionnaires • Review of exercise books • Collection of exercises • Classroom observations • Submitting items to the judgment of teachers.
Classroom observations have emerged as one cost-efficient method yielding reliable information about what is taking place at a point in time (snapshot). This approach can be used along with other methods aiming at collecting information on teaching content and distribution by domains and cognitive abilities during the school year.

82
SECTION 8: REPORTING OF RESULTS Disseminating NEA results is very important if the test is to influence societal attitudes towards basic education. NEA results should stimulate policy makers, stakeholders, and the general public to take action to improve the performance of the education system. The NEA results should be given the widest possible publicity and discussion.
At the beginning of the NEA preparation process, the GES and ASU will establish the team of education analysts who will be responsible for writing up the results. Its members collectively should be knowledgeable about all aspects of the NEA—including prior assessments, administrative and logistical issues, item development, sampling procedures, training events, data entry issues, and statistical analysis. These writers will be expected to draft a complete findings report as well as shorter summaries and presentations for some specific audiences (discussed below).
8.1 Target Audience and Report Formats
The various NEA stakeholders include educational policy makers, educational managers, administrators, teachers, school management committees and parent-teacher associations, and the general public. Each stakeholder has certain interests which should be taken into consideration when the NEA results are being disseminated.
A full findings report should include an executive summary, as well as sections detailing the background of the NEA and educational context in Ghana, the methodology, a description of the results, a discussion of factors related to learning outcomes, recommendations based on the results, and a discussion of limitations encountered during the testing process that should be addressed in future implementations. Finally, a series of annexes to the findings report should provide even greater detail on topics such as sampling, scores, item-level analysis, and other statistical processes that will be of interest to a subset of the report’s audience.
The executive summary should be a concise synopsis of the main points of the findings report but with less detail. For general audiences, the executive summary can be extracted from the report and distributed as an independent document.
Below, see the detailed outline of the 2011 NEA Findings Report followed by an outline of the executive summary. These should be used as guides for future findings reports.
8.2 Contents of the NEA Findings Report
List of Figures List of Tables Abbreviations Acknowledgments Executive Summary 1. Background: Purpose and Objectives of the National Education Assessment
1.1 Education Spending 1.2 Access, Enrolment, and Retention Rates 1.3 Teachers

83
1.4 Equity Issues 1.5 Background of the NEA and EMIS Data Collection
2. Methodology 2.1 Content of the NEA 2.2 Sample Design
2.2.1 Population 2.2.2 Sample Methodology 2.2.3 Enrolment Updates and Replacement Schools
2.3 Sample Description: Expected vs. Obtained Schools and Test Forms 2.4 Training and Preparation of Test Materials
2.4.1 Training the Trainers 2.4.2 Training the Test Administrators and Monitors 2.4.3 Preparing and Packaging Test Materials
2.5 Data Collection 2.5.1 Test Administration 2.5.2 Editing, Scanning, and Electronic Data Sets
2.6 Data Processing 2.6.1 NEA Test Achievement Data 2.6.2 EMIS Data 2.6.3 Application of Analysis Weights
3. NEA Results 3.1 Achievement Cut Points: Minimum Competency and Proficiency 3.2 Scores and Achievements 3.3 Time Series Analysis 3.4 Results by Subject Domain
3.4.1 English Results by Domain 3.4.2 Maths Results by Domain
3.5 Achievements by Urban/Rural Location, School Type, and Region 4. Factors Related to Learning Outcomes
4.1 Brief Literature Review of Factors Affecting Learning Outcomes in the African Context
4.2 Demographics and Contextual Variables 4.2.1 Gender Effects 4.2.2 School Type and Location 4.2.3 Health Conditions and Mortality 4.2.4 Other Demographic Variables
4.3 Teaching and Learning Environment 4.4 Teaching and Learning Materials and Resources 4.5 School Management and Community Involvement 4.6 Teacher Characteristics and Practices
5. Recommendations Based on NEA Findings 5.1 Resource Allocation 5.2 Teacher Training 5.3 School Management 5.4 Logistics of Test Administration

84
6. Limitations and Recommendations for Future NEA Tests 6.1 Test Forms and Instrumentation 6.2 Suggested Revisions to NEA Test Content 6.3 Suggested Supplements to EMIS Information: Surveys and Classroom
Observations
Annex A: Population Size and Sample Weighting Annex B: Numbers of Test Administrator and Monitor Trainees Annex C: Use of EMIS Data During NEA Data Analysis Annex D: Additional Scores and Mean Scores with Confidence Intervals for Student
Performance in Maths and English Annex E: Students’ Probability of Achieving Minimum Competency and Proficiency
Scores Annex F: Explanation of Trend Data Requirements Annex G: Item-Level Evaluation Primer: How to Read Outputs of the Rasch Model Annex H: Logistic Regressions Adjusted for Demographic Variables
8.3 Contents of the Executive Summary
As was stated above, the executive summary should contain the main points of the findings report, and should be able to stand on its own for general audiences.
NEA Report Background Test Results
English Results by Domain Math Results by Domain Results by Gender Results by School Type Results by School Location
Factors Associated with Student Performance Recommendations Based on NEA Findings
8.4 Dissemination of NEA Results
In order for the NEA results to have an impact and stimulate action from communities, the result must be widely disseminated. Potential modes of disseminating the NEA results include seminars delivered to policy makers, education managers, and administrators; regional and district meetings; summaries and media releases for newspapers, radio, or television; flyers; and the Ministry of Education website.
Finally, if the Ghana Education Service chooses to collect data that are representative at the district level, separate executive summaries of the district-level data should be prepared and disseminated to each affected district.

85
Appendix A. Vocabulary Sheet: Statistical Sampling, Weighting, and Documentation
NEA 2011
Excel Vocabulary
Columns: Letter-named divisions running up and down an Excel spreadsheet.
Row: Numbered divisions running right and left of an Excel spreadsheet.
Cells: Individual boxes created by columns and rows. Cells contain specific data values or other information.
Spreadsheet: A grid of cells arranged in numbered rows and letter-named columns. They can be used to organize data or to provide information such as a summary.
Data spreadsheet: Grid of cells arranged in numbered rows and letter-named columns used to organize data. Data spreadsheet must follow a specific format, where rows are individual items and columns are specific characteristics of the items. For the NEA, a data spreadsheet could be many things. Some examples include: the list of all primary schools with specific data about each school; or a list of only the sampled primary schools with specific data about each school.
Non-data spreadsheet: Grid of cells arranged in numbered rows and letter-named columns used to provide non-data information (such as a summary). It does not follow the data spreadsheet format.
Sampling and Weighting Dictionary
Population: All people or items that we wish to learn more about. For the NEA, the population of interest is all primary schools in Ghana with an enrolment of at least ten P3 and at least 10 P6 pupils.
Sample: The procedure for collecting information about a subset of a given population. The NEA requires sampling of primary schools.
Sample list frame (sample frame): A list containing the entire population that we want to sample. For the NEA, the sample frame contains all primary schools that have at least 10 P3 and at least 10 P6 students.
Stratify: The procedure of separating a population by a specific characteristic before sampling from all of the values found in the specific characteristic. The sample must contain all values of the specific characteristics. For the NEA, we might stratify schools by school type (private school and public schools) before sampling a specific number of primary schools and public schools.
Cluster: A sampled item that contains a smaller level of items of interest. For the NEA, our items of interest might be P3 and P6 students. Our clusters are then primary schools which P3 and P6 students attend.

86
Sample weighting: The act of assigning a value (typically larger than one) to all sampled items to account for unequal sampling process. A sampled item takes the inverse of the probability of selecting that item. The NEA analysis weights schools.

87
Appendix B. NEA Test Material Allocation Form (TMAF)
Region: ___________________________________________ District: ___________________________________________
School Name: ___________________________ School Code: ______________________________________ Security Bags: ______________________________________ Padlock: __________________________________________ Padlock Keys and Envelope: __________________________ P3: Students # P6: Students # Other Items # English Test Booklet English Test Booklet Cello Tape 1
Math Test Booklet Math Test Booklet Spare Answer Sheet Envelope 1
Listening Test Booklet Listening Test Booklet Test Monitoring Forms
Listening Test Txt 2 Listening Test Txt 2
Math Answer Sheets Math Answer Sheets
English Answer Sheets English Answer Sheets
Math Answer Sheet Envelope Math Answer Sheet Envelope
English Answer Sheet Envelope English Answer Sheet Envelope
Cardboard Covers 8 Cardboard Covers 8
Pencils Pencils
Erasers Erasers
Sharpeners Sharpeners
Blank Papers Blank Papers
Writing Material Envelopes Writing Material Envelope
Rubber Bands 10 Rubber Bands 10 Brown Paper Brown Paper