functional and structural genomics study of singapore ... · as early as 1898, friedrich loeffler...
TRANSCRIPT

FUNCTIONAL AND STRUCTURAL GENOMICS
STUDY OF SINGAPORE GROUPER IRIDOVIRUS
CHEN LI MING
(B.SC., XIAMEN UNIVERSITY)
A THESIS SUBMITTED FOR
THE DEGREE OF DOCTOR OF PHILOSOPHY
DEPARTMENT OF BIOLOGICAL SCIENCES
NATIONAL UNIVERSITY OF SINGAPORE
2008

I
Acknowledgements
First of all, I would like to thank my supervisor, Professor Hew Choy Leong,
for giving me the opportunity to pursue my PhD study and for his guidance,
and mentorship.
Second, I would like to thank Dr Lance Miller for the discussion on the chip
set-up. I also appreciate Dr Jin Hua Han for helpful discussions on the data
analysis. I also appreciate Dr. Jayaraman Sivaraman for his advice on
crystallization, Dr. Song Jianxing and Dr. Yang Daiwen for their advices on
NMR. I thank Dr. Lin Qingsong for his advice on iTRAQ and proteome related
works. I thank Dr. Gong Zhiyuan for his advice on transgenetic fish studies.
Third, I appreciate the Genomic Institute of Singapore for the provision of the
facilities for DNA microarray and real-time RT-PCR work. I am grateful for Kun
Yan's assistance with chip spotting. I thank Dr Zhen Jun Li for her advice on
the molecular biological techniques. I thank Dr Yan Liu for his useful
suggestions and kind helps on the structural study of my project. I thank Mr.
Wang Fan for his suggestions on my project.
Finally, I would like to thank my other lab mates: Dr. Song Wenjun, Dr. Wu
Jinlu, Dr. Tang Xuhua, Ms Chen Jing, and Ms Tran Bich Ngoc for their
valuable discussion and friendship.

II
Summary
Singapore grouper iridovirus (SGIV), an iridovirus in the genus Ranavirus, is a major
pathogen that results in significant economic losses in grouper aquaculture. In this
thesis, first, we report the temporal and differential gene expression of SGIV using
SGIV viral DNA microarray; Second, we report the first proteomics study of grouper
embryonic cells (GEC) infected by Singapore grouper iridovirus (SGIV) to take an
insight into the interaction of SGIV and its host cell at proteome scale by iTRAQ;
third, we report that a novel viral coding protein ORF158L is involved in the
regulation of host histone H3 K79 methylation; finally, we report the structural study
of ORF158L. Our work provides important insights into the pathogenesis of
iridoviruses.
III
Table of Contents
Acknowledgements………………………………………………… …..I
Summary………………………………………………………………………II
Table of Contents………………………………………………….…………III
List of Tables………………………………………………………………….VIII
List of Figures………………………………………………………………....IX
Chapter 1 Introduction & Literature Review……………………………..1
1.1 Overview……………………………………………………………………..2
1.2 Introduction of Iridovirus…………………………………………………..2
1.3 Introduction of Singapore grouper iridovirus (SGIV)…………………....2
1.4 Transcriptional regulation & Replication cycle of the iridovirus………..3
1.5 Functional genomics………………………………………………………. .5
1.5.1 Introduction of Functional genomics………………………………...5
1.5.2 Gene expression profile and differential gene expression of the
iridovirus……………………………………………………………………..5
1.5.3 Functional genomic studies at proteomic scale by using iTRAQ…..7
1.6 Structural genomics………………………………………………………...10
1.6.1 Introduction of Structural genomics………………………………...10
1.6.2 NMR spectroscopy………………………………………………….…10
1.6.3 X-Ray crystallography……………………………………………......11
1.7 Scope of thesis……………………………………………………………….12

IV
Chapter 2 An investigation of temporal and differential gene expression
of Singapore grouper iridovirus by DNA microarray……………….….16
2.1 Summary………………………………………………………………….....17
2.2 Introduction………………………………………………………………....18
2.3 Materials and Methods……………………………………………………..20
2.3.1 Cell lines……………………………………………………………….20
2.3.2 Positive controls for the SGIV DNA microarray…………………....20
2.3.3 Preparation of amplicons for the SGIV DNA microarray………….20
2.3.4 Virus infection and CHX and aphidicoline treatments………….…21
2.3.5 Total RNA preparation, reverse transcription and labeling….…...21
2.3.6 Real-time PCR………………………………………………….……..22
2.4 Results…………………………………………………………………….….23
2.4.1 Viral microarray for grouper iridovirus………………………….…23
2.4.2 Temporal gene-expression analysis of the SGIV genome……..……23
2.4.3 SGIV viral gene expression with different concentrations of
CHX…………………………………………………………………….……24
2.4.4 SGIV viral gene expression with aphidicoline treatment…….…….24
2.5 Discussions …………………………………………………………….……27
Chapter 3 iTRAQ study of Grouper embryonic cells infected by
Singapore grouper Iridovirus: an insight into the Singapore grouper
iridovirus and host cell interaction……………………………….…....45
3.1 Summary……………………………………………………………….……46
3.2 Introduction………………………………………………………………....47
3.3 Materials and Methods……………………………………………………..47
3.3.1 Cell and virus infection……………………………………………….47

V
3.3.2 iTRAQ Labeling and Two Dimensional (2D) LC-MALDI MS….…47
3.3.3 RT PCR………………………………………………………….….….49
3.3.4 Western blotting………………………………………………….……49
3.4 Results………………………………………………………………….….…50
3.4.1 Identification of viral proteins by using iTRAQ………………….…50
3.4.2 Identification of differential expression host proteins by using
iTRAQ………………………………………………………………….……50
3.4.3 RT-PCR and western blot analysis of the viral proteins…………...51
3.4.4 Up regulation of host Histone H3 Lysine 79 (K79) methylation upon
SGIV infection……………………………………………………….……..52
3.5 Discussions ……………………………………………………………...….53
Chapter 4 A novel SGIV coding protein ORF158L is involved in the
regulation of K79 methylation of histione H3……………………....…81
4.1 Summary……………………………………………………………….……82
4.2 Introduction…………………………………………………………….……82
4.3 Materials and Methods………………………………………………….…..82
4.3.1 Cell and virus infection……………………………………….…….…82
4.3.2 Antibodies……………………………………………………….……..82
4.3.3 Knockdown of ORF158L……………………………………….……..83
4.3.4 Electron Microscopy……………………………………………….….83
4.3.5 DNA Microarray and Real Time RT PCR…………………….…….83
4.3.6 Immunofluorescence …………………………………………….……83
4.4 Results……………………………………………………………………85
4.4.1 Western blot against ORF158L………………………………………85
4.4.2 Knockdown of ORF158L……………………………………………..85

VI
4.4.3 DNA Microarray and Real time RT-PCR investigation of
transcriptsomes of viral genes when ORF158L was knocked down….….85
4.4.4 Subcellular localization of ORF158L and ORF158L & Histone H3
colocalization………………………………………………………………...86
4.4.5 iTRAQ study the effect of knockdown ORF158L at proteome
scale..................................................................................................................86
4.4.6 ORF158L involved in Histone H3 lysine 79 (K79) methylation
regulation…………………………………………………………………….86
4.5 Discussions…………………………………………………………………...88
Chapter 5 Structural study of ORF158L…………………………….97
5.1 Summary & Introduction……………………………………………………98
5.2 Materials and Methods………………………………………………………99
5.2.1 Construction of the expression plasmid…………………………….…99
5.2.2 Expression and purification of ORF158L…………………………..…99
5.2.3 Mass spectrometry analysis………………………………………….…99
5.2.4 Dynamic light scattering (DLS) study……………………………….…99
5.2.5 Circular dichroism (CD) study…………………………………………99
5.2.6 NMR sample preparation……………………………………………...100
5.2.7 NMR Experiments and data process. …………………………...........100
5.2.8 SeMet ORF158L preparation………………………………………….100
5.2.9 Crystallization …………………….……………………………………100
5.2.10 Data collection, structure solution and refinement..…………...........101
5.2.11 Expression and purification of histone H3 and H4 complex…….…102
5.2.11 Surface Plasmon Resonance (SPR)……………………………...........102
5.3 Results…………………………………………………………………………103

VII
5.3.1 Protein purification profiles of ORF158L ……………………………103
5.3.2 Mass spectrometry analysis……………………………………………103
5.3.3 Dynamic light scattering (DLS) study…………………………………103
5.3.4 Circular dichroism study…………………………………………….…103
5.3.5 1D NMR……………………………………………………………....…104
5.3.6 1H-15N HSQC study of ORF158L………………………………..........104
5.3.7 Overall Structure of ORF158L…………………………………………105
5.3.8 Sequence and structural homology….…………………………………106
5.3.9 Putative Histone binding region….…………………………………….106
Chapter 6 Achievements & Future experiments…………………...119
6.1 Achievements……………………………………………………………….…120
6.2 Future experiments……………………………………………………………120
References………………………………………………………………………….122

VIII
List of Tables
Table 2.1. Kinetic class of SGIV ORF expression. …………………………...31
Table 2.2 SGIV primers………………………………………………...............36
Table 2.3. Partial cDNA sequences of β-actin and GAPDH…………….........39
Table 2.4. Primers for Real time PCR………………………………………....40
Table 2.5. SGIV genes with temporal expression on array………………..…41
Table 3.1. 38 viral proteins were consistent with those that were reported…60
Table 3.2. 11 viral proteins were newly identified and first reported………...62
Table 3.3. 12 host proteins were up-regulated during SGIV infection………..63
Table 3.4. 5 host proteins were down-regulated during SGIV infection…..…..64
Table 3.5. GEC host proteins identified from iTRAQ analysis………………..65
Table 3.6 Primers for the 11 newly identified viral proteins…………………..80
Table 5.1 Data collection and refinement statistics of ORF158L……………..118

IX
List of Figures
Figure 1.1 The diagram of iridovirus replication cycle……………………....13
Figure 1.2 The chemical structure of iTRAQ reagent……………………..…14
Figure 1.3 Workflows of iTRAQ experiments………………………………...15
Figure 2.1. Hierarchical clustering gene tree of SGIV temporal gene expression
data……………………………………………………………………………….32
Figure 2.2. Validation DNA microarray result with real time RT-PCR…….33
Figure 2.3. Effect of CHX treatment on SGIV gene expression…………….34
Figure 2.4. SGIV gene expression profiles with aphidicoline treatment……35
Figure 3.1 Full length amplification of 11 novel genes of SGIV via RT-
PCR………………………………………………………………………………57
Figure 3.2 Presence of SGIV proteins expressed by ORF018R, 026R, 093L and 2
newly identified proteins encoded by ORF135L and 140R…………………..58
Figure 3.3 Histone H3 K79 methylation analysis of SGIV-infected GECs
compared to mock SGIV-infected GECs by western blot……………………59
Figure 4.1 Identification and knockdown of ORF158L in cell culture………90
Figure 4.2 Comparison of transcriptional profiles of SGIV with and without
ORF158L knock down…………………………………………………………..91
Figure 4.3 Subcellular localization of ORF158L………………………………92

X
Figure 4.4. The co localization study between ORF158L and histone H3…...93
Figure 4.5. iTRAQ study of ORF158L knockdown effects to histone H3……94
Figure 4.6. Western blot validation of histone H3 modification………………95
Figure 4.7. iTRAQ study of ORF158L knockdown effects in SGIV-infected
GECs………………………………………………………………………………96
Figure 5.1 Purification of ORF158L…………………………………………..107
Figure 5.2 Molecular weight determination by MS……………………….…108
Figure 5.3 DLS result of ORF158L……………………………………….…..109
Figure 5.4 CD results of ORF158L…………………………………………....109
Figure 5.5 Characterization of protein structures by one-dimensional NMR
spectroscopy…………………………………………………………………….111
Figure 5.6 Characterization of protein structures by two-dimensional NMR
spectroscopy……………………………………………………….……………112
Figure 5.7 Crystal picture of SeMET ORF158L………………….………….113
Figure 5.8 Purification of histone H3 & H4 complex………………….…….114
Figure 5.8 Structure of ORF158L and models of ORF158L and histones
complex …………………………………..…………………………….………115
Figure 5.9 Structure comparison and functional implication………….…....116
Figure 5.10 SPR study of ORF158L binding to histone H3 & H4 complex..117

1
Chapter One
Introduction & Literature Review

2
1.1 Overview
As early as 1898, Friedrich Loeffler and Paul Frosch raised the first clue on the nature
of virus by demonstrating that the cause of the foot-and-mouth disease in livestock
was an infectious particle smaller than any known bacteria. Later on, people found
that viruses had protein coats named virus capsids and genomic contents inside the
virus. The materials for storage of the genomic information of the virus could be
either DNA or RNA. Based on the materials of the genomic content of the viruses, the
viruses can be classified into two major groups, i.e. DNA viruses and RNA viruses.
Viruses are further classified into single-stranded DNA (ssDNA), single-stranded
RNA (ssRNA) viruses and double-stranded DNA (dsDNA) viruses. The dsDNA
viruses are further classified into more than 20 families.
1.2 Introduction of Iridovirus
The Iridoviridae Family is one member of the DNA virus families. Iridoviruses are
large cytoplasmic DNA viruses and infect either insects or vertebrates. In 1954, the
first iridovirus was discovered by Smith and Xeros (Smith and Xeros, 1954). To date,
more than 100 iridoviruses belonging to the four genera of the iridovirus family have
been isolated. The four genera of the iridovirus family are Iridovirus, Chloriridovirus
and, Lymphocystivirus and Ranavirus (Chinchar et al., 2005).
1.3 Introduction of Singapore grouper iridovirus (SGIV)
In 1994, a novel member of Ranavirus, Singapore grouper iridovirus (SGIV), causing
significant economic losses in Singapore marine net cage farm was reported (Chua et
al., 1994). In 1998, SGIV was isolated from brown groupers (Qin et al., 2001). In
2004, the genomic DNA of SGIV was sequenced and 162 open reading frames (ORFs)
were predicted based on genomic sequence (Song et al., 2004). Until 2006, a total of

3
61 SGIV structural proteins had been identified by using proteomics methods (Song et
al., 2004; Song et al., 2006).
1.4 Transcriptional regulation and replication cycle of iridovirus
Transcriptional regulation of viral gene expression is one of the important subjects in
viral research. In 2001, the gene expression of Chilo iridescent virus (CIV), was
investigated and 137 viral transcripts were detected (D’Costa et al., 2001). Two years
later, Costa and coworkers further investigated the transcriptional mapping of the CIV
and found that 90 percent of the CIV genome encoding genes were transcripted
(D’Costa et al., 2004 ). The transcriptional program of CIV was studied by Costa and
coworkers using traditional methods, such as Northern blot (D’Costa et al., 2001;
D’Costa et al., 2004 ). Compared to Northern blot, the DNA microarray technology is
a newly emerging high through put methodology. DNA microarray can be used to
investigate hundreds, even thousands of genes simultaneously. Therefore, DNA
microarray can provide a better understanding of viral transcriptional programs. DNA
microarray has been widely used in viral gene transcriptional studies in the past
decade. Recently, in 2005, Lua and coworkers applied DNA microarray technology to
reveal the transcriptional programs of red sea beam iridovirus (RSIV) by monitoring
92 putative ORFs simultaneously (Lua et al., 2005 ). In 2007, similar work was
reported on the transcriptional profile of RSIV using DNA microarray and found that
97-99% of the RSIV ORFs were expressed (Lua et al., 2007). However, the gene
expression and transcriptional program of SGIV has not been investigated either by
Northern blot or DNA microarray. The study of the transcriptional profile of SGIV
may provide a profound insight into the replication and pathogenesis of the iridovirus
family.

4
The replication cycle of the iridovirus is very complicated and not fully understood.
Murti and coworkers proposed a model to elucidate the replication cycle of the
iridovirues(Murti et al., 1985). The first step of the replication cycle of iridovirus
particles is that iridovirus particles attach to the plasma membranes of host cells. After
attaching to membrane, the viral particles enter the host cells by phagocytosis (the
cellular process by which cell membrane engulfs solid particles to form an internal
phagosome.). Subsequent to the entry, the iridovirus particles are delivered to the
lysosomes of host cells, and they are uncoated inside the lysosomes. As a result, the
genome of iridoviruses is released. The released iridovirus genome is transported to
the host nucleus and the first stage of iridovirus genome replication is initiated. At the
same time, the iridovirus immediate early genes are transcribed, and the iridovirus
genome is transported to the cytoplasm of the cell and the iridovirus commences its
second stage genome replication in the cytoplasm. Besides, the early and late genes of
the iridoviruse are transcripted and translated. The genomes and structural proteins of
the iridoviruse begin to assemble to form new iridoviruses, and are released from the
host cells. The virus is now ready to initiate new replication cycles (Figure 1.1) (Murti
et al., 1985).

5
1.5 Functional genomics
1.5.1 Introduction of Functional genomics
Genomic projects, such as genome sequencing projects, have produced a vast wealth
of data. Functional genomics is a field of molecular biology that attempts to describe
large scale gene/protein functions and interactions by using the data produced by
genomic projects. Functional genomics focuses on the dynamic aspects such as gene
transcription, translation, and protein-protein interactions.
1.5.2 Gene expression profile and differential gene expression of the iridovirus
In the iridovirus replication cycle, the iridovirus genes are differentially expressed
(Williams, 1996). On one hand, some iridovirus genes are expressed at the first stage
of iridovirus genome replication in the nucleus of host cells. On the other hand, some
genes are expressed after the first stage of iridovirus genome replication. According to
the differential gene expression of iridoviruses, the iridoviruses genes are divided into
three groups: the immediate early genes, the early genes and the late genes. The
immediate early genes are expressed immediately after the primary infection, and
these genes encode proteins which play important roles in the trans-activation of
iridoviruses. Following the expression of the immediate early genes, the early genes
are expressed, and they encode proteins which play important roles in the iridovirus
genome replication. After the onset of the iridovirus genome replication, the late
genes are expressed, and they encode structural proteins of iridovirus particles. Given
the different functions of the three groups of iridovirus genes, the study on the
temporal and differential gene expression of iridoviruses can provide important
information on the pathogenesis mechanism of iridoviruses.
The gene expression profile and differential gene expression of iridoviruses are poorly
studied. In 2001, D’ Coasta and coworkers studied the differential gene expression of

6
Chilo iridescent virus (D’Costa et al., 2001). They reported 137 detectable transcripts ,
and classified these 137 transcripts into 3 groups: 38 immediate-early gene transcripts,
34 early gene transcripts and 65 late gene transcripts. Three years later, D’ Coasta and
coworkers further reported that more than 90 percent of the Chilo iridescent virus
genome was transcriptional active (D’Costa et al., 2004). The differential gene
expression of Chilo iridescent virus was studied by using the Northern blot (D’Costa
et al., 2001; D’Costa et al., 2004 ). The Northern blot can only study one gene per
time, and it is a low-throughput method used in gene expression studies. Compared to
Northern blot, DNA microarray is a newly emerging high-throughput technology.
DNA microarray can be used to study hundreds, even thousands, of genes
simultaneously. DNA microarray was used to study differential gene expression of 87
genes of the red sea beam iridovirus in grunt fin cells in 2005 (Lua et al., 2005). By
using DNA microarray, Lua and coworkers reported that as early as 3 hour
postinfection, some genes of the red sea beam iridovirus commenced expression.
After 8 hour postinfection, a rapid escalation of gene expression of the red sea beam
iridovirus was described. Furthermore, the gene expression of red sea beam iridovirus
was differentiated by using a de novo protein synthesis inhibitor (cycloheximide) and
a viral DNA replication inhibitor (phosphonoacetic acid). The differential gene
expression of the red sea beam iridovirus revealed that the 87 RSIV transcripts were 9
immediate-early gene transcripts, 40 early gene transcripts and 38 late gene transcripts.
In addition, in 2007, Lua and coworkers reported the gene expression profiles of the
red sea beam iridovirus in infected fish (Lua et al., 2007). Although RSIV transcripts
had been investigated by DNA microarray, many redundant data entries were
included. Additionally, the genomic sequence of RSIV can not be found in the NCBI
database. From the literature (Lua et al. 2005; Lua et al., 2007), we can only identify

7
around 10 unique conserved ORFs between RSIV and SGIV based on the functional
description of viral ORFs. Based on the limited descriptions about RSIV from the
Lua's paper, the RSIV could be similar to Rock bream iridovirus (RBIV) which is a
member of the Megalocytivirus genus, while SGIV is a member of Ranavirus.
Besides the 26 iridoviridae core genes, which are conserved among iridovirus, only
two other ORFs in Megalocytivirus have orthologs in Ranavirus (Eaton et al., 2007).
Thus, it would be valuable to investigate the gene expression profile as well as
differential gene expression of SGIV.
1.5.3 Functional genomics studies at proteomics scale by using iTRAQ
Functional genomics studies provide information, which should be useful to
understand complex biological systems. These studies, quite often, involve
differential comparison of expression with reference to a control state. Although tools
like nucleic acid microarrays are widely used to perform the differential comparison
of expression in gene transcriptional levels, these tools do not directly give indications
in the gene translational levels. Differences in gene expression do not necessarily
correspond directly to differences in protein expression, due to the following
arguments: I) Expression of proteins is regulated by the combination of transcription
rates and mRNA degradation rates, and is not evidently obvious from mRNA levels;
II) The protein concentrations are not always consistent with mRNA concentrations;
III) Many differential effects on proteins themselves come from post-translational
modifications such as phosphorylation or glycosylation, and these effects cannot be
measured or identified by looking at the mRNA levels (Zieske, 2006). More
importantly, compared to nucleic acid expression, proteins are effector molecules. As
a result, the investigation of differential expression at protein levels will contribute to
a better understanding of biological systems.

8
There are several technologies used to assess more accurately protein levels between
different biological states. I ) 2D-gel: In the 2D-gel technique, differentially expressed
spots are excised and analyzed by mass spectrometry (MS). The disadvantages of 2D-
gel technique are: ① Not all types of proteins are amenable to gels; ② The dynamic
range is somewhat limited; ③The low-abundance proteins are difficult to identify; ④
The resolution is restricted; ⑤ The throughput is relatively low. II ) chip-based MS:
the chip-based MS approaches have a relatively higher throughput, but the actual
identification of the proteins of interest is time-consuming, often relying on off-line
techniques to purify the potential marker(s) implied by the qualitative information
from the MS analyses. III ) Chromatographic approaches: Chromatographic
approaches are subject to diminished sample throughput as well as reproducibility
between samples and replicates. IV ) ICAT: The ICAT stands for Isotope Coded
Affinity Tags (Gygi et al., 1999). In this approach, two samples are labeled with
chemically identical tags that differ only in isotopic composition (heavy and light
pairs) and contain a thiol-reactive group (which covalently links to cysteine residues)
and a biotin moiety. The limitations of ICAT are: ① The ICAT reagents can only be
used to analyze protein peptides that contain a cysteine residue; As a result, many
important proteins, including those with post-translational modifications, are
overlooked by this technique; ② The ICAT can only be used to compare only two
samples. V ) SILAC, which stands for Stable Isotope Labeling by Amino Acids in
Cell Culture (Ong et al., 2002). This method incorporates isotopic labels into proteins
via metabolic labeling in the cell culture itself, rather than using a covalently linked
tag. Thus, cell samples to be compared are grown separately in media containing
either a heavy or light form of an essential amino acid (e.g. one that cannot be
synthesized by the cell). The advantages of SILAC are that it has a higher fidelity than

9
ICAT (incorporating nearly 100% efficiency) and does not require multiple chemical
processing and purification steps, thus ensuring that the samples to be compared have
been subjected to similar conditions throughout the experiment. This approach,
however, requires viable active cell lines to allow for the incorporation of the
respective heavy/light amino acids into the protein samples, and may not always be
available for all experimental samples.
Despite the broad range of biological questions that the above approaches have
successfully addressed, there is still a need for additional technologies that can carry
out global peptide labeling, retention of post-translational modification (PTM)
information, and simultaneous multiplexed (more than two samples) analyses. iTRAQ,
a new technique stands for Isobaric Tags for Relative and Absolute Quantitation, was
firstly developed by Darryl Pappin and colleagues at Applied Biosystems in 2004
(Ross et al., 2004), and can be used to label four samples simultaneously . This
unique approach labels samples with four independent reagents of the same mass that,
upon fragmentation in MS/MS, give rise to four unique reporter ions (m/z =114–117)
that are subsequently used to quantify the four different samples, respectively. To
date, iTRAQ can label samples with eight independent reagents of the same mass that,
upon fragmentation in MS/MS, give rise to eight unique reporter ions (m/z=113-121)
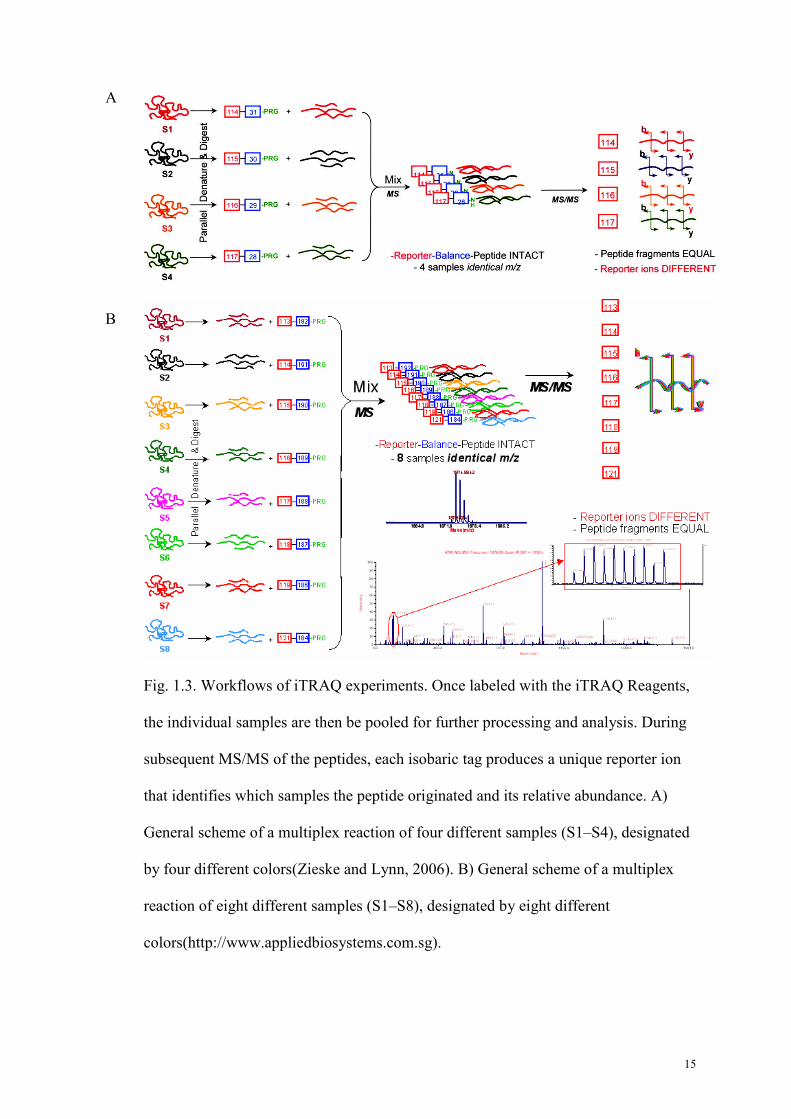
that are subsequently used to quantify the eight different samples. Figure 1.2 shows
the chemical design of iTRAQ reagents. Figure 1.3 shows the workflow of iTRAQ
experiments to investigate differential protein expression among samples. The amine
specificity of these reagents makes most peptides in a sample amenable to this
labeling strategy with no loss of information even from samples involving post-
translational modifications, such as the scrutiny of signal transduction pathways that
often involve phosphorylation. In addition, the multiplexing capacity of these reagents

10
allows for information replication within certain LC-MS/MS experimental regimes,
providing additional statistical validation within any given experiment.
1.6 Structural genomics
1.6.1 Introduction of structural genomics
Structural genomics is the determination of the three dimensional structures of all
proteins of a given organism, by experimental methods such as X-ray crystallography,
NMR spectroscopy or computational approaches such as homology modeling. The
complete sequencing of several genomes has provided us the protein repertories of
diverse organisms from all kingdoms (Green, 2001; Aparicio et al., 2002; Marsden et
al., 2006.). The challenge of understanding these gene products has led to the
development of functional genomics methods, which collectively aim to annotate the
raw sequence with biological understanding (Brenner, 2001). Structural genomics is
one such approach, with a unique promise to reveal the molecular function of protein
domains (Ashburner et al., 2000).
1.6.2 NMR spectroscopy
Nuclear magnetic resonance (NMR), which is a physical phenomenon based upon the
quantum mechanical magnetic properties of an atom's nucleus, also commonly refers
to the methods that exploit nuclear magnetic resonance to study molecules. In 1938,
Isidor Rabi first described and measured the nuclear magnetic resonance in molecular
beams (Rabi et al., 1938). Eight years later, in 1946, Felix Bloch and Edward Mills
Purcell refined the technique for use on liquids and solids (Bloch et al., 1946; Purcell
et al., 1946), for which they shared the Nobel Prize in physics in 1952. In 1953,
Overhauser defined the concept of nuclear overharser effect (NOEs) as the basis for
structural determination by NMR (Overhauser, 1953). Three decades later, in 1985,
the first solution-state protein structure was reported by applying the NMR in solving

11
protein structure (Williamson et al., 1985). Since then, NMR has become an
alternative method to X-ray crystallography for the structural determination of small
to medium sized proteins (<25kDa) in aqueous or micellar solutions. In recent years,
an impressive number of advances in biomolecular NMR spectroscopy have been
reported (Wider and Wüthrich, 1999; Fiaux et al., 2002; Fernandez and Wider, 2003).
NMR has emerged as a powerful probe for the study of protein structure (Clore and
Gronenborn, 1991; Sattler et al., 1999; Bax, 2003) and dynamics (Ishima and Torchia,
2000; Bruschweiler, 2003). In particular, studies of proteins with molecular mass on
the order of 100 kDa are now possible at a level of detail that was previously reserved
for much smaller systems (Kay, 2005). In general, the main procedures of structure
determination by NMR are sample preparation, data acquisition, data processing, data
assignments and structural calculations.
1.6.3 X-Ray crystallography
X-ray crystallography is the science of determining the arrangement of atoms within a
crystal from the manner in which a beam of X-rays is scattered by the electrons within
the crystal. The method produces a three-dimensional density of electrons within the
crystal, from which the mean atomic positions, their chemical bonds, their disorder
and much other information can be derived. By definition, a crystal is a solid in which
a desired minimum volume containing particular arrangement of atoms (its unit cell)
is repeated indefinitely along three principal directions known as the basis (or lattice)
vectors.
Three dimensional protein structures at atomic level can be determined by X-ray
crystallography. Growth of single well-defined diffracting crystal forms the basic and
essential prerequisite for X-ray crystallography to determine protein structures (Blow,
2002). The bottleneck to structure determination by X-ray crystallography is the

12
generation of high quality crystals (Chayen, 2004). In the late 1950’s, crystal
structures of proteins began to be solved, beginning with the structure of sperm whale
myoglobin by Max Perutz and Sir John Cowdery Kendrew, for which they were
awarded the Nobel Prize in Chemistry in 1962 (Kendrew et al., 1958). To date,
~39000 crystal structures of proteins have been determined by X-ray crystallography
(http://www.rcsb.org/pdb/statistics/holdings.do). For comparison, the nearest
competing method, NMR spectroscopy has produced roughly 6000 structures
(http://www.rcsb.org/pdb/statistics/holdings.do). X-ray crystallography is now used
routinely by scientists to determine how a pharmaceutical compound interacts with its
protein target and what changes might be advisable to improve it (Scapin, 2006).
1.7 Scope of thesis
In this thesis, we will present
1) The study of temporal and differential gene expression of SGIV using DNA
microarray.
2) The proteomics study of grouper embryonic cells infected by SGIV using iTRAQ.
3) The functional study of ORF158L, a novel protein coded by SGIV genome.
4) The structural study of ORF158L using NMR and X-ray crystallography.

13
Figure. 1.1 The diagram of iridovirus replication cycle.

14
Figure 1.2. The chemical structure of an iTRAQ reagent. A) Design of the iTRAQ
reagents-4plex consists of a charged reporter group, a peptide reactive group, and a
neutral balance portion to maintain an overall mass of 145 (Zieske and Lynn, 2006). B)
Design of the iTRAQ Reagents - 8plex consists of a charged reporter group, a peptide
reactive group, and a neutral balance portion to maintain an overall mass of 305
(http://www.appliedbiosystems.com.sg). (Isobaric, by definition, implies that any two
or more species have the same atomic mass but different arrangements.)
A
B
15
Fig. 1.3. Workflows of iTRAQ experiments. Once labeled with the iTRAQ Reagents,
the individual samples are then be pooled for further processing and analysis. During
subsequent MS/MS of the peptides, each isobaric tag produces a unique reporter ion
that identifies which samples the peptide originated and its relative abundance. A)
General scheme of a multiplex reaction of four different samples (S1–S4), designated
by four different colors(Zieske and Lynn, 2006). B) General scheme of a multiplex
reaction of eight different samples (S1–S8), designated by eight different
colors(http://www.appliedbiosystems.com.sg).
B
A

16
Chapter Two
An investigation of temporal and differential
gene expression of Singapore grouper
iridovirus by DNA microarray
Published:
Chen et al. 2006. Temporal and differential gene expression of Singapore grouper
iridovirus. J Gen Virol. 87:2907-15.

17
2.1 Summary
Singapore grouper iridovirus (SGIV), an iridovirus in the genus Ranavirus, is a major
pathogen that results in significant economic losses in grouper aquaculture. To
investigate further its infective mechanisms, for the first time, a viral DNA microarray
was generated for the SGIV genome to measure the expression of its predicted open
reading frames simultaneously in vitro. By using the viral DNA microarray, the
temporal gene expression of SGIV was characterized and the DNA microarray data
were consistent with the results of real-time RT-PCR studies. Furthermore, different-
stage viral genes (i.e. immediate-early, early and late genes) of SGIV were uncovered
by combining drug treatments and DNA microarray studies. These results should offer
important insights into the replication and pathogenesis of iridoviruses.

18
2.2 Introduction
Singapore grouper iridovirus (SGIV) (Chinchar et al., 2005; Williams et al., 2005;
Song et al., 2004), a novel iridovirus of the genus Ranavirus, is a large, icosahedral,
cytoplasmic DNA virus. The virus, which causes sleepy grouper disease (SGD), has
resulted in significant economic losses in marine net-cage farms in Singapore. It was
isolated successfully in 1998 from diseased brown-spotted grouper, Epinephelus
tauvina (Chua et al., 1994; Qin et al., 2001). The entire SGIV genome consists of
140,131 bp, and 162 open reading frames (ORFs), encoding polypeptides varying
from 41 to 1268 aa, were predicted from the sense and antisense DNA strands (Song
et al., 2004). These viruses are causative pathogens of serious systematic diseases in
farms of both feral and cultured groupers. So far, genomic sequences of two grouper
iridoviruses have been published: SGIV (Song et al., 2004)and grouper iridovirus
(GIV) (Tsai et al., 2005), with whole-genomic sequence similarity of >90 %. Willis et
al. (1977) designated 10 ‘early’ RNAs (of 47 mRNAs), expressed from 1 to 1.5 h after
frog virus 3 (FV-3) infection of fathead minnow cells by using isotopic labelling of
virus-specific RNA. The RNA transcriptional map of the Wiseana iridescent virus
(WIV) has been studied by using a combination of [35S]methionine pulse-labelling
and Northern blotting with WIV DNA probes (McMillan and Kalmakoff, 1994).
Similarly, the transcriptional map and temporal cascade of Chilo iridescent virus (CIV)
have been studied by carrying out Northern analyses with several putative CIV gene-
specific probes (D’Costa et al., 2001 ; D’Costa et al., 2004). However, at present, the
transcriptional program of viral genes in SGIV is still unclear. DNA microarrays
provide a potential tool for the simultaneous measurement of gene expression in all of
these viral genes. In this study, we constructed, for the first time, a viral DNA
microarray covering 127 predicted ORFs of the SGIV genome. By using this SGIV

19
DNA microarray, the transcriptional program of SGIV was uncovered. The temporal
expression of SGIV genes was further confirmed by real-time RT-PCR. By using
cycloheximide (CHX) and aphidicoline as inhibitors, the immediate-early (IE), early
(E) and late (L) viral genes were characterized.

20
2.3 Materials and methods
2.3.1 Cell lines.
Grouper embryonic (GE) cells from the brown-spotted grouper E. tauvina (Chew et
al., 1994) were cultured in Eagle's minimum essential medium containing 10 % fetal
bovine serum, 0.116 M NaCl, 100 IU penicillin G ml–1 and 100 µl streptomycin
sulfate ml–1. Culture media were equilibrated with HEPES to a final concentration of
5 mM and adjusted to pH 7.4 with NaHCO3.
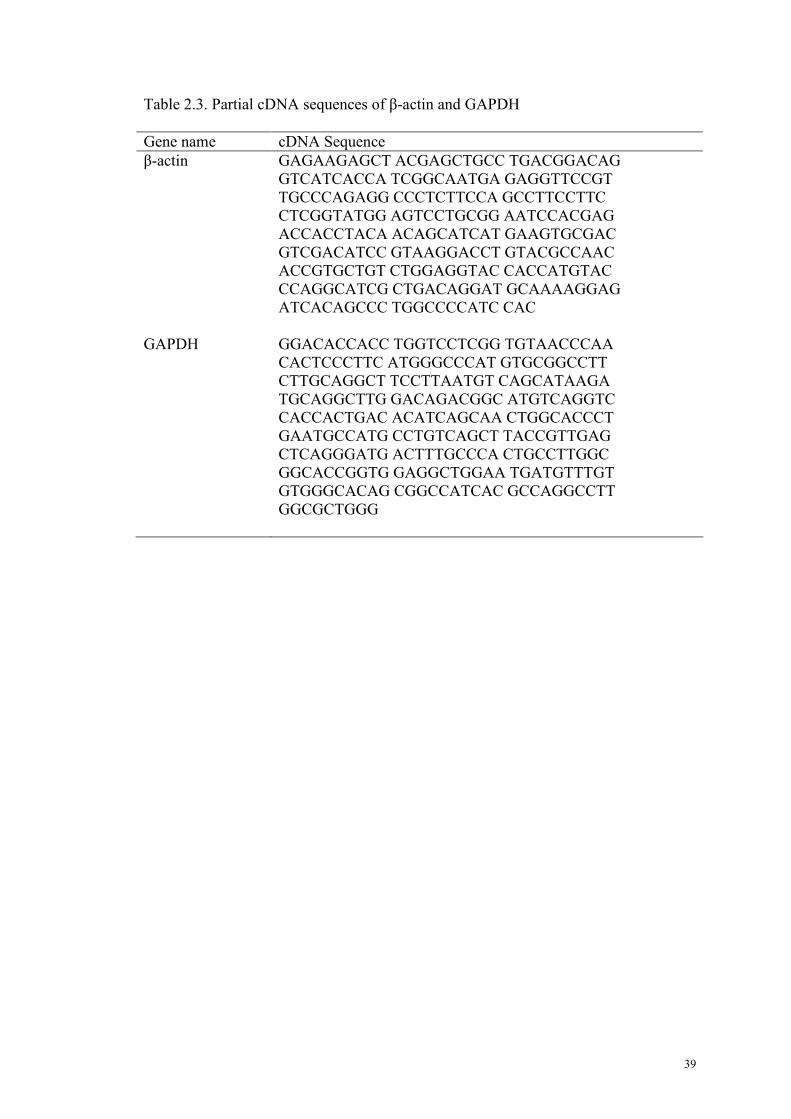
2.3.2 Positive controls for the SGIV DNA microarray.
Given that there is no grouper cDNA library available, we partially sequenced cDNAs
of β-actin and glyceraldehyde-3-phosphate dehydrogenase (GAPDH) from the GE
cells and designed unique amplicons for β-actin and GAPDH in the SGIV DNA
microarray as positive controls. The partial cDNA sequences of grouper β-actin and
GAPDH are shown in Table 2.3. β-Actin was also used for data normalization.
2.3.3 Preparation of amplicons for the SGIV DNA microarray.
One hundred and sixty-two SGIV ORFs were predicted on the basis of the published
SGIV sequence (Song et al., 2004). Two rounds of PCR were used to generate the
amplicons for the microarray. In the first round, specific primers with sizes ranging
from 18 to 22 bp were generated on the basis of the SGIV full-length genome [8 bp
universal sequences (TGACCATG), added to the 5' terminal of the forward primers,
were designed (Table 2.2). The amplicon sizes varied from 200 to 400 bp. Amplicons
whose BLAST scores against other ORFs exceeded 400 were excluded. The genomic
DNA of SGIV was used as template in the first round of PCR. In the second round,
the DNA fragments from the first round were used as template and 5'-amino-modified
universal primer 5'-GCTGAACAGCTATGACCATG-3' and ORF-specific reverse
primer were applied. AmpliTaq DNA Polymerase (Applied Biosystems) was used in

21
both rounds of PCR. Each PCR fragment was confirmed to be a single band and of
the correct size by running on a 2 % agarose gel (data not shown). The final 129
amplicons, representing 127 viral ORFs and two host housekeeping genes, β-actin and
GAPDH (purified with a QIAquick 96 PCR Purification Kit; Qiagen), were spotted
onto lysine-coated slides in duplicate.
2.3.4 Virus infection and CHX and aphidicoline treatments.
GE cells were mock-infected or infected with SGIV at an m.o.i. of 3 p.f.u. per cell. To
investigate the temporal expression of viral genes, total RNA was harvested from
mock-infected and SGIV-infected GE cells at 0, 1, 4, 8, 16, 32, 48, 72 and 96 h post-
infection (p.i.). CHX, a protein synthesis inhibitor that prevents de novo protein
synthesis by preventing translation, was used to study the transcription of viral IE
genes. To assess IE gene transcription, SGIV mock-infected and SGIV-infected
cultures were treated with different concentrations of CHX (50, 100, 200 or
500 µg/ml) 1 h before infection. Aphidicoline is a specific inhibitor of DNA
polymerase α. In the presence of aphidicoline, viral DNA replication is inhibited.
Given that the L genes were expressed after viral DNA replication, the expression of
L viral genes would be downregulated compared with those without aphidicoline
treatment. To examine the viral E genes, the transcriptomes from the cultures with
aphidicoline treatment and SGIV-infected at 3 p.f.u. per cell were compared with
those from the culture with mock aphidicoline treatment and SGIV-infected at 3 p.f.u.
per cell. In the aphidicoline treatment, aphidicoline at a final concentration of
30 µg ml–1 was added to the culture 1 h prior to SGIV infection.
2.3.5 Total RNA preparation, reverse transcription and labelling.
Total RNA was extracted and purified by using a Qiagen RNeasy Mini Kit. RNAsin
(10 units; Promega), 100 units DNase I and 10 µl enzyme buffer 3 (Roche) were

22
added to the total RNA solution, mixed well and incubated at room temperature for
20 min. The RNA samples were later purified with a Qiagen RNeasy column and
stored at –70 °C. For reverse-transcription reactions, 10 mM dATP, 10 mM dGTP,
10 mM dCTP, 2 mM dTTP (Invitrogen) and 8 mM aa-dUTP (Ambion) were used. For
each reverse-transcription reaction, 10 µg total RNA was reverse-transcribed by using
PowerScript Reverse Transcriptase (BD Clontech) with random primers [d(N)6,
0.5 µg/µl] (Life Technologies). After reverse transcription, the unused aa-dUTPs were
removed with Microcon YM-30 columns (Amicon). The cDNAs were coupled with
mono-functional NHS-ester Cy dyes (Amersham Biosciences). After removing
unincorporated/quenched Cy dyes with a QIAquick PCR purification kit (Qiagen), the
mixtures were hybridized to the SGIV DNA chip by using the MAUI hybridization
system (BioMicro Systems) and incubated overnight at 42 °C. The hybridizations
were repeated on duplicate arrays with independently prepared RNA. The data
obtained from the different arrays were consistent. The mean correlation coefficient of
127 viral elements of duplicates was 0.9865. The mean correlation coefficient of 127
viral elements between repeats was 0.9750.
2.3.6 Real-time PCR.
In order to validate the DNA microarray data, semi-quantitative real-time RT-PCR
was applied and β-actin was used as the control. The specific primers for real-time
RT-PCR were checked after PCR and showed a single, specific band after running on
2 % agarose gel. Information on the real-time PCR primers is provided in Table 2.4,
available in the JGV Online website. The total RNA samples were reverse-transcribed
using PowerScript Reverse Transcriptase (BD Clontech) with random primers [d(N)6,
0.5 µg µl–1]. cDNA (50 ng) was subsequently subjected to real-time PCR by using a
QuantiTect SYBR Green PCR kit (Qiagen) in the Lightcycler 2.0 system (Roche).

23
The real-time data were collected and analysed with the 2–∆∆CT method (Livak and
Schmittgen, 2001).

24
2.4 Results
2.4.1 Viral microarray for grouper iridovirus
To date, two grouper iridovirus genomes have been sequenced completely (Song et al.,
2004; Tsai et al., 2005). The specificity of the arrays was validated with cDNA probes
prepared from mock-infected and SGIV-infected GE cells. The cDNA probes from
uninfected cells detected only β-actin and GAPDH, while cDNA probes from infected
cells detected all SGIV DNA targets, as well as β-actin and GAPDH (data not shown).
2.4.2 Temporal gene-expression analysis of the SGIV genome
Total RNA was harvested from mock-infected cells and SGIV-infected cells at 0, 1, 4,
8, 16, 32, 48, 72 and 96 h p.i.
Of the 127 viral elements on the SGIV array, 16 (13 %) of the 127 investigated viral
ORFs commenced expression at 1 h p.i., 106 (83 %) commenced expression at 4 h p.i.
and five (4 %) ORFs commenced expression at 8 h p.i. (Table 2.5).
In our viral DNA microarray, 68 (53.5 %), 43 (34 %), two (1.5 %) and 14 (11 %) of
the 127 investigated viral ORFs were detected to reach maximum expression at 32, 48,
72 and 96 h p.i., respectively (Table 2.5).
Hierarchical clustering, in which the expression of each gene at every time point was
compared and grouped according to the similarity in gene-expression profiles, was
applied to examine the relationship between the genes and their expression patterns. A
coloured mosaic matrix, in which each column represents a time point and each row
indicates the expression pattern of a single ORF, was used to feature the temporal
viral gene-expression data generated from our viral DNA microarray. The ordered and
varied patterns of viral gene expression are illustrated in (Figure 2.1).
In order to validate the DNA microarray results, semi-quantitative real-time RT-PCR
was carried out separately to investigate the expression profile of one IE viral gene

25
(ORF086R), one E viral gene (ORF006R) and one L viral gene (ORF072R – major
capsid protein), with β-actin as controls. The results of real-time RT-PCR were
consistent with the DNA microarray data (Figure 2.2A–C). The consistency between
the real-time RT-PCR and viral DNA microarray data supports the general
applicability and utility of our array approach.
2.4.3 SGIV viral gene expression with different concentrations of CHX
We used the DNA microarrays to compare the gene expression of SGIV-infected GE
cells with that of mock-infected GE cells, both under CHX treatment. The normalized
data show that SGIV gene expression decreased with increasing concentration of
CHX (Figure 2.3A–D). This phenomenon suggests that the expression of SGIV viral
genes does indeed depend on the presence of one or more viral proteins. When the
viral gene expression was analysed in the presence of 500 µg CHX ml–1, we found
that 41 (32.3 %) ORFs displayed a 1.3-fold upregulation (listed in Table 2.1). These
41 ORFs were not sensitive to CHX treatment and were considered as strong IE gene
candidates (Table 2.1). As expected, the two putative IE genes, namely ORF086R and
ORF162L, were included in this candidate IE gene list (Table 2.1).
2.4.4 SGIV viral gene expression with aphidicoline treatment
In order to classify the remaining SGIV viral genes (except for the SGIV IE gene
candidates) into E and L genes, aphidicoline treatment was carried out together with
the simultaneous analysis of all viral transcriptomes. In this study, we compared the
transcriptomes of SGIV-infected cultures with aphidicoline treatment against those of
SGIV-infected cultures mock-treated with aphidicoline across time. We found that
several genes were upregulated (fold >1) and a number of viral genes showed down
regulation (fold <1) (Figure 2.4A-D). Viral genes that consistently displayed twofold
down regulation from 16 to 48 h p.i. with aphidicoline treatment were considered to

26
be L gene candidates. After analyzing the aphidicoline treatment across time, we
found that 50 (38.1 %) ORFs consistently displayed twofold down regulation and
were considered to be candidates for viral L genes (Table 2.1).
27
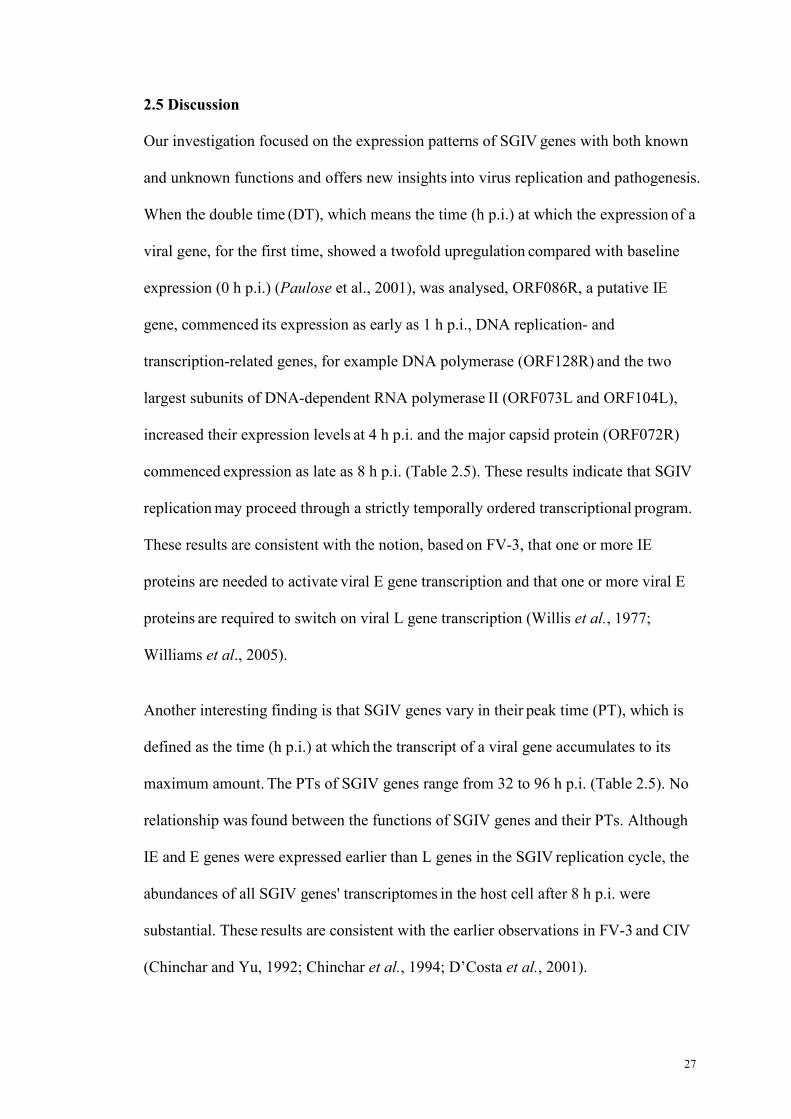
2.5 Discussion
Our investigation focused on the expression patterns of SGIV genes with both known
and unknown functions and offers new insights into virus replication and pathogenesis.
When the double time (DT), which means the time (h p.i.) at which the expression of a
viral gene, for the first time, showed a twofold upregulation compared with baseline
expression (0 h p.i.) (Paulose et al., 2001), was analysed, ORF086R, a putative IE
gene, commenced its expression as early as 1 h p.i., DNA replication- and
transcription-related genes, for example DNA polymerase (ORF128R) and the two
largest subunits of DNA-dependent RNA polymerase II (ORF073L and ORF104L),
increased their expression levels at 4 h p.i. and the major capsid protein (ORF072R)
commenced expression as late as 8 h p.i. (Table 2.5). These results indicate that SGIV
replication may proceed through a strictly temporally ordered transcriptional program.
These results are consistent with the notion, based on FV-3, that one or more IE
proteins are needed to activate viral E gene transcription and that one or more viral E
proteins are required to switch on viral L gene transcription (Willis et al., 1977;
Williams et al., 2005).
Another interesting finding is that SGIV genes vary in their peak time (PT), which is
defined as the time (h p.i.) at which the transcript of a viral gene accumulates to its
maximum amount. The PTs of SGIV genes range from 32 to 96 h p.i. (Table 2.5). No
relationship was found between the functions of SGIV genes and their PTs. Although
IE and E genes were expressed earlier than L genes in the SGIV replication cycle, the
abundances of all SGIV genes' transcriptomes in the host cell after 8 h p.i. were
substantial. These results are consistent with the earlier observations in FV-3 and CIV
(Chinchar and Yu, 1992; Chinchar et al., 1994; D’Costa et al., 2001).

28
When the gene tree was analysed, some of the viral ORFs encoding viral structural
proteins clustered together at the top of the gene tree. These include ORF072R,
encoding the viral major capsid protein, ORF019R, encoding a myristylated
membrane protein, ORF141R, encoding a glycoprotein, and another two ORFs,
ORF009L and ORF007L, encoding two proteins of unknown function that have been
identified from the mature viral particles by mass spectrometry (Song et al., 2006).
The clustering gene tree also shows a tendency for genes with similar functions, such
as ORF029L and ORF131R, both of which encode homologues of the Ig-like domain,
to be clustered together, despite being located apart from each other in the viral
genome. In the SGIV genome, a number of viral genes are novel and their function is
unknown. It has been reported that the co-expression of genes of known function with
novel genes may provide a relatively simple means to postulate the functions of these
poorly characterized ones (Eisen et al., 1998).
It has been reported that the IE, E and L transcripts of FV-3 were synthesized in three
coordinated phases (Willis et al., 1977.; Willis and Granoff, 1978). Similarly, SGIV
genes can be classified as IE genes, E genes and L genes. CHX-insensitive SGIV
genes are suggested to be IE genes. Aphidicoline-sensitive SGIV genes are suggested
to be L genes. When combining the results of CHX and aphidicoline treatments, the
127 SGIV elements on the microarray included 28 (22.1 %) IE genes, 49 (38.6 %) E
genes, 37 (29.1 %) L genes and 13 (10.2 %) unclassified genes (Table 2.1).
Early viral transcripts contain IE and E viral genes. It has been proposed that E
transcripts in FV-3 encode regulatory proteins and key catalytic enzymes (Goorha et
al., 1978; Goorha, 1982; Williams et al., 2005). Similar observations were made for
SGIV. SGIV E transcripts contain replication-related genes, e.g. DNA polymerase

29
(ORF128R), as well as transcription-related genes, such as the second-largest subunit
of DNA-directed RNA polymerase II (ORF073L).
Although combining DNA microarrays and drug treatments can provide a wealth of
information concerning the expression profile of different viral genes, the approach
has some inherent limitations. For example, in the list of unclassified ORFs,
ORF019R and ORF141L, which encode two structural proteins (a myristylated
membrane protein and a glycoprotein, respectively), are insensitive to the CHX
treatments, even at high concentrations (500 µg ml–1) and ORF146L, encoding
NTPase/helicase, shows a high sensitivity to the aphidicoline treatment. The possible
mechanisms behind drug sensitivity or resistance of these unclassified SGIV genes
need further investigation.
When investigating the temporal expression of different-stage genes, we found that
the IE genes commenced expression between 1 and 4 h p.i., most of the E genes
commenced expression at 4 h p.i. and most of the L genes commenced expression
between 4 and 8 h p.i. The expression of three of the E genes (ORFs 83R, 099R and
111R) and seven of the L genes (ORFs 008L, 010L, 021L, 055R, 089L, 116R and
154R) was found to increase as early as 1 h p.i. The functions of these viral E and L
genes are still unknown.
We also found several interesting phenomena in SGIV. First, ORF030L, which was
predicted to be a virus tegument protein (a structural protein), showed insensitivity to
both CHX and aphidicoline. ORF030L might have other functions besides being a
tegument protein of SGIV. Second, the SGIV genome contained: (i) ORF144R,
encoding a homologue of the FGF (fibroblast growth factor) 22 of rat, a major active
species of presynaptic organizing molecule (Umemori et al., 2004), (ii) ORF145R,

30
encoding a homologue of the mouse FGF 10, which is related closely to FGF 22
(Tagashira et al., 1997; Okazaki et al., 2002; Strausberg et al., 2002; Umemori et al.,
2004). FGF 22 and FGF 10 play important roles in presynaptic differentiation
(Umemori et al., 2004). Expression of FGF homologues by SGIV may play an
important role in forming the clinical symptoms of SGIV-infected groupers.
Although it has been reported that SGIV is an enveloped virus that enters cells by
endocytosis to start the viral infection cycle and buds from the plasma membrane in
the late infection phage (Qin et al., 2001), little is known about the processes that
occur during SGIV infection. By combining the results of SGIV temporal gene-
expression profiles and different-stage viral genes, the patterns of different-stage viral
gene expression are uncovered. Our results should provide new insights into the
processes of the SGIV-infected cascade and the pathogenesis and replication
strategies of SGIV. Our SGIV DNA microarrays coupled with global biochemical and
genetic strategies might greatly accelerate the functional analysis of a number of
functionally unknown genes in the SGIV genome. Given that most ORFs from GIV,
as well as a number of ORFs from other iridovirus genomes, such as Ambystoma
tigrinum virus (Jancovich et al., 2003), Chilo iridescent virus (Jakob et al., 2001),
Infectious spleen and kidney necrosis virus (He et al., 2001), Lymphocystis disease
virus 1 (Tidona and Darai, 1997), orange-spotted grouper iridovirus (Lu et al., 2005)
and tiger frog virus (He et al., 2002), are homologous to those of SGIV (Lu et al.,
2005; Tsai et al., 2005; Song et al., 2004), our results should also be valuable to
research on these viruses.

31
Table 2.1. K
inetic class of SGIV
ORF exp
ression.
ORF
CHX treatment
Aph
idicolin
e treatm
ent
Class
ORF
CHX treatment
Aph
idicolin
e treatm
ent
Class
ORF
CHX treatment
Aph
idicolin
e treatm
ent
Class
ORF001L
E/L
IE/E
E
ORF057L
E/L
L
L
ORF114L
E/L
L
L
ORF003R
E/L
IE/E
E
ORF059L
E/L
L
L
ORF116R
E/L
L
L
ORF004L
IE
IE/E
IE
ORF060R
E/L
IE/E
E
ORF118R
E/L
L
L
ORF005L
IE
IE/E
IE
ORF061R
E/L
L
L
ORF119R
E/L
IE/E
E
ORF006R
E/L
IE/E
E
ORF064R
E/L
L
L
ORF120L
IE
L
? ORF007L
E/L
L
L
ORF065R
IE
IE/E
IE
ORF121R
IE
IE/E
IE
ORF008L
E/L
L
L
ORF066R
IE
IE/E
IE
ORF122L
E/L
IE/E
E
ORF009L
E/L
L
L
ORF067L
IE
IE/E
IE
ORF123L
E/L
IE/E
E
ORF010L
E/L
L
L
ORF068L
E/L
L
L
ORF124R
E/L
IE/E
E
ORF012L
E/L
L
L
ORF069L
E/L
L
L
ORF125R
IE
IE/E
IE
ORF014L
E/L
L
L
ORF070R
E/L
L
L
ORF126R
IE
L
? ORF016L
E/L
IE/E
E
ORF071R
IE
IE/E
IE
ORF127R
E/L
L
L
ORF018R
E/L
L
L
ORF072R
E/L
L
L
ORF128R
E/L
IE/E
E
ORF019R
IE
L
? ORF073L
E/L
IE/E
E
ORF131R
E/L
IE/E
E
ORF020L
IE
L
? ORF075R
E/L
L
L
ORF132R
IE
IE/E
IE
ORF021L
E/L
L
L
ORF076L
E/L
IE/E
E
ORF133R
IE
IE/E
IE
ORF024L
IE
IE/E
IE
ORF077L
IE
IE/E
IE
ORF134L
E/L
IE/E
E
ORF025L
E/L
L
L
ORF078L
E/L
IE/E
E
ORF135L
E/L
IE/E
E
ORF026R
E/L
L
L
ORF081L
E/L
IE/E
E
ORF136R
IE
IE/E
IE
ORF029L
IE
IE/E
IE
ORF082L
E/L
IE/E
E
ORF137R
IE
IE/E
IE
ORF030L
IE
IE/E
IE
ORF083R
E/L
IE/E
E
ORF139R
IE
IE/E
IE
ORF031L
IE
IE/E
IE
ORF084L
E/L
L
L
ORF140R
E/L
L
L
ORF033L
E/L
IE/E
E
ORF085R
E/L
IE/E
E
ORF141R
IE
L
? ORF034L
E/L
IE/E
E
ORF086R
IE
IE/E
IE
ORF143L
IE
L
? ORF035L
E/L
IE/E
E
ORF087R
IE
IE/E
IE
ORF144R
E/L
IE/E
E
ORF036L
E/L
IE/E
E
ORF088L
E/L
L
L
ORF145R
E/L
IE/E
E
ORF037L
E/L
IE/E
E
ORF089L
E/L
L
L
ORF146L
IE
L
? ORF038L
E/L
L
L
ORF090L
E/L
L
L
ORF147L
IE
IE/E
IE
ORF039L
E/L
L
L
ORF091L
E/L
IE/E
E
ORF148R
E/L
IE/E
E
ORF041L
IE
IE/E
IE
ORF092L
IE
L
? ORF149R
IE
IE/E
IE
ORF042R
E/L
IE/E
E
ORF093L
E/L
L
L
ORF150L
E/L
IE/E
E
ORF043R
E/L
IE/E
E
ORF096R
E/L
IE/E
E
ORF151L
E/L
IE/E
E
ORF045L
E/L
L
L
ORF097L
E/L
L
L
ORF152R
E/L
IE/E
E
ORF046L
E/L
L
L
ORF098R
IE
L
? ORF154R
E/L
L
L
ORF047L
E/L
IE/E
E
ORF099R
E/L
IE/E
E
ORF155R
IE
L
? ORF048L
IE
IE/E
IE
ORF101R
E/L
IE/E
E
ORF156L
IE
L
? ORF049L
E/L
IE/E
E
ORF102L
E/L
IE/E
E
ORF157R
E/L
IE/E
E
ORF050L
E/L
IE/E
E
ORF103R
IE
L
? ORF158L
E/L
IE/E
E
ORF051L
IE
IE/E
IE
ORF104L
IE
IE/E
IE
ORF159R
E/L
IE/E
E
ORF052L
E/L
IE/E
E
ORF107R
IE
L
? ORF160L
IE
IE/E
IE
ORF054R
E/L
IE/E
E
ORF110L
E/L
IE/E
E
ORF162L
IE
IE/E
IE
ORF055R
E/L
L
L
ORF111R
E/L
IE/E
E
ORF056R
E/L
L
L
ORF112R
E/L
IE/E
E
“IE” means the immediate early gene. “E” means the early stage viral gene. “L” means the late stage viral gene. “?” m
eans the
ORF is an unclassified viral gene. “IE/E” indicates the ORF could be an immediately early gene or an early stage viral gene. “E/L”
indicates the ORF could be an early stage viral gene or an late stage viral gene.

32
Figure 2.1. Hierarchical clustering gene tree of SGIV temporal gene expression data.
Pearson’s correlation coefficient, in which the temporal expression ratios of genes
were compared pairwise and grouped according to their similarity, were applied to
cluster the viral genes by using genespring. Each column indicates a time point and
each row indicates the expression profile of a viral gene. Different colors were used to
illustrate the different expression level. Green color indicates a low expression level.
Red color indicates a high expression level. Black color indicates a intermediate
expression level. The color intensities mean the magnitude of down regulation or up
regulation from the mean, as the color bar indicates.

33
Figure 2.2. Validation DNA microarray result with real time RT-PCR. There genes
(ORF086R, ORF006R and ORF072R) were selected for studies. Gene expression
level (Y axis) was plotted against time (X axis). The left panel presents the DNA
microarray data and the right panel presents the real time RT-PCR data.

34
Figure 2.3. Effect of CHX treatment on SGIV gene expression. The vertical axis
represents the normalized expression level of viral genes in the presence of different
concentration of CHX with 3PFU/cell SGIV-infection at 2h p.i. and the horizontal
axis represents the normalized expression level of viral genes with mock SGIV-
infection and different concentration CHX treatment. a). 50µg/ml CHX; b). 100µg/ml
CHX; c). 200µg/ml CHX; d). 500µg/ml CHX.

35
Figure 2.4. SGIV gene expression profiles with aphidicoline treatment. Vertical axis
represents the viral expression level with aphidicoline treatment and 3PFU/cell SGIV-
infection and horizontal axis represents the viral expression level with mock
aphidicoline treatment and 3PFU/cell SGIV.

36
Table 2.2 SGIV primers
ORF Forward primer sense primer
ORF001L TGACCATGAAGAGTTTCCCGCTGCAA ACCTAACGCGCCACAAGCT ORF003R TGACCATGAGCTACGATAGATTCACCATGG GGCCTTGTTCGTCTTGACTGTA ORF004L TGACCATGTTACCCATCTTTCTAGCGTCG TGATCTCTTCCCACTACGCTG ORF005L TGACCATGTTTGCTTATCGGGTCGGC GCCGACGATGACAAGACCA ORF006R TGACCATGAGAGGTAAAAATTCCCATCGTC TTCTTCTTGCTCGTCGTCTG ORF007L TGACCATGTGACGATAACTATAAGCCCGG AGGGTATATCTATCGGTTCGGC ORF008L TGACCATGAAAGGGCGAAAAGGGACC CCCCTATGGGTCCTTGGTCT ORF009L TGACCATGGGCTACAAACGACCCACTG GAGCCAATTCCTGTCCCGT ORF010L TGACCATGCTTTTGGTTTCGAGCCCG CCCGAATCGTGGCAACAA ORF012L TGACCATGCCGAATGTTTGACCCGAA GAGCGCGGACAAGATGGAT ORF014L TGACCATGACTACGGGTTCGATGGCTG CACCCGTTGTCGCAGTTT ORF016L TGACCATGCGTTTTAGACGAGTGGCTGAC ATCTCCATGACATTTTCGCG ORF018R TGACCATGGTCAGAGACCAAGGCGTTCG CACGTCACATCTGGTCTACACA ORF019R TGACCATGAACCCTGACTCTTTGGATTGC TTTAACGTCGTCCATCACCA ORF020L TGACCATGTGCTAAACCTCAAGACTCTGGA CTCTTTTGGGGGCTCTGTATTG ORF021L TGACCATGTCAATTTGCTCCGCGGAA TACCTAGTCTGCCAAAGTCTGC ORF023R TGACCATGACTCTTGCGTCTTGTGGGG GCAATGGACACGCTATGGT ORF024L TGACCATGAAATCGGGGAAACCAAACT ATGTCCATATTGTACCAGTCCG ORF025L TGACCATGAAACCAAAAGACCTGCAGTGT AAGAGGTCTTCTGGCCAATTGT ORF026R TGACCATGGGACATCATGCCAGCAGAG CGTCGGCGTTATATCCTTG ORF029L TGACCATGAAACAAAGGCGGGCTCTATA CTCGTTTAGTTTGGGCAGTTT ORF030L TGACCATGCAAGCACATGCAAACGTACAC ACGCGTCTGATGTATCTTGTCT ORF031L TGACCATGTTCGTGCGAGGGTAGCTACT TCGTTTCGGACAGGTTCG ORF033L TGACCATGGGGAATCCGTAACCATAACACA GGTATTTCGTACGCTCTCAGGT ORF034L TGACCATGGATCCGAGCGTGTACATTTG TCCGGTATTTTTGTCGATCTGT ORF035L TGACCATGAATAAAAAAGACAGCGCCCT TGCAACACATGTATATCAACGG ORF036L TGACCATGGGAAAAATAACGTCTCGCTTGA AACTTTCTTGCAGGTATTCTCG ORF037L TGACCATGCGTGGTTTACATCGACAGTGAC ATAATGTTTTCCGCGTTTGC ORF038L TGACCATGGCAATATAGCCGAAACAGGG CGTTAAGTCCGTTGTTGTTGC ORF039L TGACCATGAATGGCGCGGAGATGTTT ATCTATCGATGAGCTGTTGACC ORF041L TGACCATGACGGCAGAGAAATTCGCG GACAATCACGCCTCCGGTT ORF042R TGACCATGTATTCTAATATGGACCGCGA ATTTTATGCACGGAACGGA ORF043R TGACCATGTGGGGCAGCTAAAGGAATT CGTTCTTCGCATACTTTTGA ORF045L TGACCATGGCATCCAAACGTAACCTCAGT CCGTCCGCACCCTTTATT ORF046L TGACCATGGGACGCGAACGATATAGTGA GAAGTCCTTGAGGGCCTGGT ORF047L TGACCATGCTTATTGTCCCGCGTTGG TTATTCGTACGTCCAGCTGC ORF048L TGACCATGTGTAGGCATCATCAAACGCA TACTCAAGTTCCATCAAGACGG ORF049L TGACCATGTGGCAGTACGTCACGGAATA CATTTTTTTTGCCTAACTCCGG ORF050L TGACCATGGAGAAATGCGGCAAAGGTAC CAATATATTGAAGTAGGGGCGC ORF051L TGACCATGGGTTATCAGTCCGAATGCGA TAATCCATTTTGCGGTTCTG ORF052L TGACCATGTCTTTAGGCAGTTTTACGACGA TTAAACTTGTTCCGCCGC ORF054R TGACCATGATAGTGGGCATGTGCATTTTG GCATAAATACCGCGGCAT ORF055R TGACCATGCGAGATAAACGGCAGCACT GCCGTCTTTACCCATAGCG ORF056R TGACCATGAGCGACGGAACCGAATTA TTAATTTGTAGAGCCTTGAGGG ORF057L TGACCATGACGTGTGGACCGAAAAGAAT GCTTATCGTAACCCGCTTTGT
Continued on following page

37
ORF Forward primer sense primer
ORF059L TGACCATGCGCCCACCGGTAAATGAGTA TTACAGGTAAGAATGCGCCC ORF060R TGACCATGTAGGCTGATGAAAATAAACGGC CCATGAGATCGTTTTCGGA ORF061R TGACCATGCAAAGATGTGGTGAAGGCG TCATCGCAAGGTGTAAAAGC ORF062R TGACCATGCCACCCAGGAGCCCTCTT GTTCTATGGGGTCTGGCGT ORF063L TGACCATGGGGCTCCTGGGTGATATCAT CGGCGGCGAATTGATAGA ORF064R TGACCATGTGTACCGTACCGCGTTTGAA GGTCCTGTTTGCTTTGGTTC ORF065R TGACCATGTACTGTCTGATATTGAAA TATGATATTTTAGTCGAA ORF066R TGACCATGATGACCCCAAAGTTTACGGG TTAGCCGCCGAACGAGTCT ORF067L TGACCATGCATTCACGCTAAACTCGACG TCCACAACTTCTTCTTTAGGCG ORF068L TGACCATGAAGAAGTGGCGTTTGGACA AGTCCTATTTTCGGTACGTTCG ORF069L TGACCATGAATGGAAAACGCGCAGTC TACCGCCATTATTCAGTTGACA ORF070R TGACCATGACGAAGCGTGGGAACATTT TGTATCTAATCCGTAAAGGCGT ORF071R TGACCATGTAACGGTGAACCAAACAG GAACGTCTACCTCTTTTGT ORF072R TGACCATGGGTATTTTTCAGCCTCCATTCC CACTACCAACGCGAACCTCT ORF073L TGACCATGTCGGAGAGATGGAACAGTGG TACCTATGGCCTTCAGTTCTTG ORF075R TGACCATGGCCACTCGTAAGATCGCCA GCGTATGGAACCGTAACCTT ORF076L TGACCATGGTAGGAATGAGCACAGCGC CTCGCCGCGAATTTTCTCTA ORF077L TGACCATGAACGAGTACGATTGGGCAA AAGCGAGCGTTGATTTTCC ORF078L TGACCATGTCCAAACACGCCAGAACAT GCCCGCGTCAATGAGTTT ORF081L TGACCATGCGCTAGATGGTCCGTGAAC GTCTGATCCGTACGCCTGTG ORF082L TGACCATGTTTACCCAGGAGCCACGT ACATTCTTCGTCGTCGCC ORF083R TGACCATGCAGAGAACCGGTGATGCT GCAATCGTTCCGTTTTCC ORF084L TGACCATGGTCCAATACCTCGCAAGCTT GTATGTCTTTTTCGCCACCAAC ORF085R TGACCATGCTATTACGAACTATGGTCCGCG AAGACGGTCATGGGTTCG ORF086R TGACCATGGATCGGGACGTTCGTTGT GAAAATCGTTGCCCGGTG ORF087R TGACCATGACCTGATGGGTATACGTGCAA CTCCGTTATGCGCCCAAT ORF088L TGACCATGAGAGTGCAGGGGACGTTGTG TGCAGCTTCTCCAACTTCG ORF089L TGACCATGGCCCATGAGTAATTTGTCCAAC TTAATCCATCCTGCGCCT ORF090L TGACCATGTGAAAAAGTGGCCGCAGA TACGGTCTTTAAATCCTCGAGC ORF091L TGACCATGAAACAAATGTGCTACGCTTCC TGGTTTGCCCACGTTTTGTAC ORF092L TGACCATGCAAATATGCTACGCGGAATC TTTGTTTTCGCGCGATAATC ORF093L TGACCATGTTATGCCCGAAAACTACGACT AATTTGGTCGTCGTTTGCA ORF096R TGACCATGGTATATGAACGCGTGCAC CTCCTATTCTCTACATTTGC ORF097L TGACCATGTGATACGAGCGCACGGAAG ACCTAGCGGCTACAAACAGTCT ORF098R TGACCATGACCGGGCGAAAGTTTATCA CGTTTGGCGCAGTCTCTT ORF099R TGACCATGGACACTGAAAAAGATTGCGTTG CATCTTTCACAATTGGACAACG ORF101R TGACCATGACGAAGACAGCTGGGCCAT CGATCTAAAGGTTCCACGACG ORF102L TGACCATGAAAACCATCACGATTGACGTC TTACACTCCTCCTCTCAATCGC ORF103R TGACCATGAATGCTAGTCATGTATCTCGGG TGAGAAGAGAATGGTTGGGC ORF104L TGACCATGAGACCCACGCCTATAGACAGAT CGAAGACGGTTCCTGTTTGTAT ORF105R TGACCATGTGTACCCTGTGCCCATTTT AGTAGACAGGATGATGCGCA ORF107R TGACCATGCAGAGGGCAACGGGACCT TATTATTCCGGCCGCCACG ORF108L TGACCATGGGTGGAGGACTCGGGAGA CCCTGATCCCTACGTTCTCTC ORF110L TGACCATGCTATTTTTCTCGCGACCGTAT TACAAGTTAAGATGCAGCTGGC ORF111R TGACCATGTAGAAACCATGAACATAGGCGA AGTTTACGGGAGTGCCATTT ORF112R TGACCATGAGAAAGGAGAGACGGGGATG CGACGTTTTCTTCTCCTTATGC ORF114L TGACCATGGCGACGGCGGTGTATTTT CGCTATGGCTCCGCTTTT
Continued on following page

38
ORF Forward primer sense primer
ORF115R TGACCATGTTTCGGACGGCAACTTGA AGCGTTGGTTACCGAAGAGT ORF116R TGACCATGTTGACCGATAAAAGAGACGACG CACCCCAAATGATCGTATAGTT ORF118R TGACCATGAACGGAAACCCCTCTAGAAAA CGAGGGACAAAACGAAGTAAGT ORF119R TGACCATGGTTTTTAACAACGGCTATTCGC TTTGCACCACGGAAGGAT ORF120L TGACCATGGTCAAAGCGTTCGCCGTT GAGGTGTCCCATATGGCGT ORF121R TGACCATGTGGACTCTTGCACGATATATCA TCGGGTATGGAAAATCTCAGT ORF122L TGACCATGGGATACGCTCGCTGCAAA CCATTTTTTCACCAACGCC ORF123L TGACCATGCCGAGCGAGTAATAGTGTTTTC TCATAAATTGGCGAACTCGTTG ORF124R TGACCATGGTGCCGTGCGTAGGATTT CGTGCCTCCTATAAAAGCGT ORF125R TGACCATGCCGTGCGTGGGTATGTGTA CATTGACCTCCTGAGAACGTTC ORF126R TGACCATGGGGTGGCCGTGTACAAAT TGAGTATATCCCCACGAGCCT ORF127R TGACCATGTGTTCTGCCGAAAATCAATGTC ATCCCCATTTACCTCCGTTA ORF128R TGACCATGAGGCTCGAGTATGTGGTCTTAA CCTTTCTGTATGCCACCCTC ORF131R TGACCATGGATTTTTCGGCGGTGCTT CAATAAACGGTAAGCGCCA ORF132R TGACCATGGAAAAACCGTTTAGGAGCGTAT TGAGATATGCGCCTTGTACTGT ORF133R TGACCATGGTATACTGCGAAGGACCTCCC GCGCCTCTTCTTCCATATCG ORF134L TGACCATGGGCAAATAAAACTGGATGTGGA CGTTAAAAAATCTGGCGCGT ORF135L TGACCATGCGGAGCAACACCACGTCTATA GGTTCCGGCGTCTTCTTT ORF136R TGACCATGGGATGAATCAAGAAATGCAGAC GAAAAGGGATGCAGCAACA ORF137R TGACCATGGGTATGCCCGATGGAAACT CCCCGCAGTTGAATGGAA ORF139R TGACCATGCGTATCAAAACGACAAACTCCA TTTTAAATACTACGCCGCGA ORF140R TGACCATGGAAAAAGCTTTAGAGACGGCG TTCTTTTCCGCCTCTTCG ORF141R TGACCATGCGTTGGTGATCGCGACTAT GCGAGGTTGTTGGGATAGTAAT ORF142L TGACCATGTTCTGGTCCGCCTCTGTTG AAACTGTTGGCACTGGCG ORF143L TGACCATGATGGACGAGTTTCTCCGTACTA ACGCCCAAAAAGATACCCAAC ORF144R TGACCATGTGTGAGAGCGGGCCAGATA TTCCCGCCTTGTCTATGG ORF145R TGACCATGACGTGTGTATGTACTCCGGCG CGGGAGGTAAGGCTTTCTG ORF146L TGACCATGGCTGGGAATGCTTGAGAAA GTCGGCAATGTCAACAATCTG ORF147L TGACCATGCGTGATGACCGTGAGCAAATT TTACCTTAACCACGATGCGA ORF148R TGACCATGTTTACGGTTACGAGGATACACG GCTTCCGAAAGACATACGTGC ORF149R TGACCATGCCCTCACAGTGCAAGACAAG TTGTTTCGACGTCGTACCAT ORF150L TGACCATGGCGGAGATGCTTGTTCAGAT AATGATTGGCCCTTTCCG ORF151L TGACCATGGGGTACGGTGTTGGAAATTATA CTTCAAAAAGCAATTCCACCG ORF152R TGACCATGGGATAAGACGGCGTGGTGT CCACCGCGCAGTTTAGAT ORF154R TGACCATGGATTTCATCCGTTTCTGGTACA AAGCGCGTCGAAAAGATC ORF155R TGACCATGCGACATTTCCGGGTGCAA CGTCTTTCTTCTCCGTTTCGT ORF156L TGACCATGTACAATGCCATCTCGCGA CTAATAATTTTTCAGCTGCGCG ORF157R TGACCATGAGGCGGCGAAGAATGGTT CGGTTTCCAAAGTATTCGGC ORF158L TGACCATGTACGCACCTAAACCACGGG TTAAACGGCCGCCAAAGT ORF159R TGACCATGGCCCCGGTCACAAACAAA CATACCTTTTCCTCGCTTGTG ORF160L TGACCATGTGCACTACGGTCACATTCGA AGGCACGCTCACAACGAT ORF162L TGACCATGAAACGCGTGGTAAAGATGGT TCACTCTTCTTCGTCGGGA
39
Table 2.3. Partial cDNA sequences of β-actin and GAPDH
Gene name cDNA Sequence β-actin GAGAAGAGCT ACGAGCTGCC TGACGGACAG
GTCATCACCA TCGGCAATGA GAGGTTCCGT TGCCCAGAGG CCCTCTTCCA GCCTTCCTTC CTCGGTATGG AGTCCTGCGG AATCCACGAG ACCACCTACA ACAGCATCAT GAAGTGCGAC GTCGACATCC GTAAGGACCT GTACGCCAAC ACCGTGCTGT CTGGAGGTAC CACCATGTAC CCAGGCATCG CTGACAGGAT GCAAAAGGAG ATCACAGCCC TGGCCCCATC CAC
GAPDH GGACACCACC TGGTCCTCGG TGTAACCCAA CACTCCCTTC ATGGGCCCAT GTGCGGCCTT CTTGCAGGCT TCCTTAATGT CAGCATAAGA TGCAGGCTTG GACAGACGGC ATGTCAGGTC CACCACTGAC ACATCAGCAA CTGGCACCCT GAATGCCATG CCTGTCAGCT TACCGTTGAG CTCAGGGATG ACTTTGCCCA CTGCCTTGGC GGCACCGGTG GAGGCTGGAA TGATGTTTGT GTGGGCACAG CGGCCATCAC GCCAGGCCTT GGCGCTGGG

40
Table 2.4. Primers for Real time PCR
Gene Forward primer Reverse primer
β-actin TACGAGCTGCCTGACGGACA GGCTGTGATCTCCTTTTGCA ORF086R GATCGGGACGTTCGTTGT GAAAATCGTTGCCCGGTG ORF006R AGAGGTAAAAATTCCCATCGTC TTCTTCTTGCTCGTCGTCTG ORF072R GGTATTTTTCAGCCTCCATTCC CACTACCAACGCGAACCTCT

41
Table 2.5. S
GIV
genes with temporal expression on array
a
Continued
on follow
ing p
age
ORF
Putative Fun
ction
DTb
PTc
0H P.I.
1H P.I.
4H P.I.
8H
P.I.
16H
P.I.
32H
P.I.
48H
P.I.
72H
P.I.
96H
P.I.
ORF00
1L
Unknown
4 32
0.0676
0.0486
0.753
1.998
7.471
22.15
20.17
10.55
8.324
ORF00
3R
3-beta-hydroxy-delta-5-C27
-steroid oxidoredu
ctase
4 32
0.01
0.01
1.1
2.144
8.419
20.35
19.62
10.2
7.823
ORF00
4L
Unknown
4 96
0.01
0.01
0.763
2.062
7.603
16.49
17.55
16.04
21.98
ORF00
5L
Unknown
4 32
0.0624
0.119
0.423
1.926
8.427
23.18
22.17
12.91
8.006
ORF00
6R
EARLY protein
4 48
0.01
0.01
0.631
2.1
6.742
16.8
19.73
12.83
11.73
ORF00
7L
Unknown
4 32
0.0362
0.047
0.108
1.211
13.49
32.47
27.13
12.31
8.244
ORF00
8L
Unknown
1 48
0.0621
0.165
0.106
0.953
9.051
26.89
35.49
14.58
11.15
ORF00
9L
Unknown
8 32
0.0275
0.0267
0.0328
1.145
16.82
32.8
27.22
9.999
6.402
ORF01
0L
Unknown
1 48
0.082
0.171
0.128
1.367
9.598
27.19
27.4
9.325
5.572
ORF01
2L
Capsid protein
4 32
0.0563
0.051
0.162
1.339
11.72
25.64
23.05
9.238
5.819
ORF01
4L
Unknown
4 32
0.0488
0.0424
0.71
2.104
9.42
23.28
29.83
12.25
9.543
ORF01
6L
Unknown
4 32
0.01
0.01
0.505
2.552
12.12
24.91
23.62
12.96
11.66
ORF01
8R
Unknown
4 32
0.021
0.01
0.0934
2.01
15.78
26.17
19.02
9.831
5.658
ORF01
9R
Myristylated mem
brane protein
8 48
0.0492
0.0636
0.0912
1.604
9.501
25.6
14.47
9.851
7.464
ORF02
0L
Unknown
4 48
0.02
0.01
0.895
1.816
13.69
27.78
32.57
8.795
8.28
ORF02
1L
Unknown
1 48
0.0609
0.21
0.366
1.775
9.658
23.62
23.91
9.112
8.518
ORF02
4L
Unknown
4 48
0.165
0.0469
1.617
1.319
4.127
12.25
15.15
9.985
10.69
ORF02
5L
Coding SAP m
otif
4 32
0.0207
0.01
0.423
2.838
15.51
26.23
22.48
8.822
6.466
ORF02
6R
Unknown
4 32
0.0384
0.0255
0.146
1.602
13.2
32.56
32.26
12.47
7.526
ORF02
9L
Hom
olog to im
munoglobu
lin (Ig)-like domains
4 96
0.01
0.01
0.524
0.912
5.452
16
21.16
27.62
32.77
ORF03
0L
Tegum
ent p
rotein
4 32
0.0208
0.0213
0.54
1.537
9.892
22.33
16.16
10.07
10.7
ORF03
1L
Hom
olog to im
munoglobu
lin (Ig)-like domains
4 32
0.0272
0.0263
0.5
2.181
7.568
18.74
18.43
14.85
14.12
ORF03
3L
Hom
olog to im
munoglobu
lin (Ig)-like domains
4 96
0.01
0.01
0.756
5.528
12.19
14.66
13.23
16.83
29.18
ORF03
4L
Unknown
4 48
0.0263
0.01
0.754
2.515
11.86
26.78
27.13
12.37
13.66
ORF03
5L
Hom
olog to im
munoglobu
lin (Ig)-like domains
4 32
0.01
0.01
0.471
2.036
13.04
29.14
18.47
11.79
10.3
ORF03
6L
Unknown
4 96
0.01
0.01
0.829
1.483
6.465
18.43
23.26
18.28
24.67
ORF03
7L
Unknown
4 32
0.0366
0.052
0.706
1.858
8.713
21.37
16.85
10.4
10.75
ORF03
8L
Capsid protein
4 32
0.0211
0.01
0.0532
1.171
13.25
33.76
24.09
8.172
5.549
ORF03
9L
Unknown
4 32
0.0212
0.0286
0.0951
1.473
13.9
26.7
20.69
8.49
6.631
ORF04
1L
Unknown
4 72
0.0825
0.0663
0.914
1.505
6.3
15.74
21.53
22
20.21
ORF04
2R
Unknown
4 32
0.0568
0.0884
0.377
1.842
9.633
24.85
21.41
11.61
8.757
ORF04
3R
Unknown
4 32
0.01
0.01
0.0644
2.403
13.3
24.19
21.89
10.44
5.475
ORF04
5L
Unknown
4 32
0.0245
0.0224
0.0794
0.714
13.09
32.39
24.11
16.45
12.05
ORF04
6L
Unknown
4 32
0.0296
0.01
0.0978
0.55
12.45
36.83
33.87
18.44
15.28
ORF04
7L
Ribonucleoside-diph
osphate reductase beta subunit
4 32
0.0731
0.0879
0.482
1.458
8.156
21.12
17.71
9.143
10.66

42
ORF
Putative Fun
ction
DTb
PTc
0H P.I.
1H P.I.
4H P.I.
8H
P.I.
16H
P.I.
32H
P.I.
48H
P.I.
72H
P.I.
96H
P.I.
ORF04
8L
CARD-like Caspase
4 48
0.01
0.01
0.652
1.992
9.251
21.88
26.09
17.89
17.49
ORF04
9L
dUTPase
4 48
0.01
0.01
0.672
2.034
8.252
18.85
20.8
19.09
19.04
ORF05
0L
Unknown
4 48
0.0322
0.0218
0.817
1.183
5.301
17.54
24.26
21.71
22.6
ORF05
1L
Unknown
1 48
0.01
0.0244
1.785
1.981
4.91
15.91
16.68
10.66
9.028
ORF05
2L
D5 family NTPase
4 48
0.0918
0.0547
0.416
1.153
9.033
26.19
28.84
9.909
7.188
ORF05
4R
Unknown
4 32
0.01
0.01
0.322
1.794
8.647
23.03
20.35
10.31
7.666
ORF05
5R
Unknown
1 32
0.01
0.0233
0.108
1.63
14.78
33.7
26.64
12.86
7.446
ORF05
6R
Unknown
4 32
0.025
0.01
0.111
1.275
9.603
23.79
21.52
10.7
7.876
ORF05
7L
Unknown
4 48
0.0388
0.039
0.13
1.705
12.5
29.86
31.98
11.56
7.81
ORF05
9L
Unknown
4 48
0.0774
0.057
0.233
1.331
10.52
30.67
31.84
10.77
8.641
ORF06
0R
NTPase/helicase
4 48
0.049
0.0404
0.102
1.642
11.24
26.16
32.79
10.74
6.805
ORF06
1R
Unknown
4 32
0.0309
0.0371
0.132
1.923
12.73
27.58
24.01
11.04
7.011
ORF06
4R
Ribonucleoside-diph
osphate reductase alph
a subunit
4 48
0.01
0.01
0.306
1.278
6.551
34.87
42.32
29.13
22.34
ORF06
5R
Unknown
4 96
0.0381
0.047
0.48
1.523
5.881
25.25
24.26
28.64
36.1
ORF06
6R
Unknown
4 48
0.01
0.01
0.558
1.78
6.129
21.35
22.22
15.83
12.21
ORF06
7L
Deoxynu
cleoside kinase
4 48
0.01
0.01
0.93
2.278
8.441
20
20.67
11.68
9.749
ORF06
8L
Immun
oglobu
lins and m
ajor histocompatibility com
plex
proteins signature
4 48
0.0305
0.0214
0.207
1.98
11.6
31.02
38.9
10.41
7.365
ORF06
9L
Unknown
4 48
0.01
0.01
0.543
1.761
14.82
31.31
33.09
15.71
11.79
ORF07
0R
Thiol oxidoredu
ctase
4 32
0.043
0.0555
0.24
1.825
9.335
24.46
23.95
10.22
8.029
ORF07
1R
Unknown
4 48
0.064
0.0328
1.119
2.007
4.2
11.29
16.66
13.54
16.09
ORF07
2R
Major capsid protein
8 32
0.021
0.0284
0.0283
1.222
17.27
30.08
20.96
8.718
5.25
ORF07
3L
DNA-directed RNA polym
erase II second largest subunit
4 48
0.0738
0.0546
0.489
1.485
7.783
26.29
33.79
13.45
11.39
ORF07
5R
Unknown
4 48
0.01
0.01
0.14
1.083
13.18
27.97
28.75
16.94
11.27
ORF07
6L
Purine nucleoside phosphorylase
4 48
0.0299
0.0294
0.231
1.232
10.27
29.73
31.43
12.88
11.45
ORF07
7L
Unknown
4 48
0.0463
0.0396
0.512
1.65
9.402
26.18
28.96
13.71
12.68
ORF07
8L
Tyrosine kinase
4 32
0.102
0.0598
0.42
1.507
10.02
20.32
18.95
9.266
9.412
ORF08
1L
Tyrosine kinase
4 32
0.0566
0.0525
0.193
1.904
11.37
31.35
30.6
10.18
7.478
ORF08
2L
Unknown
4 48
0.078
0.0644
0.505
1.467
10.6
25.71
28
14.33
12.86
ORF08
3R
Unknown
1 48
0.0521
0.124
0.333
1.341
8.063
25.42
29
11.8
10.63
ORF08
4L
RNase III
4 32
0.0576
0.0679
0.371
1.476
10.41
26.03
23.15
10.88
9.993
ORF08
5R
Transcription elongation factor TFIIS
4 48
0.0612
0.0594
0.762
2.242
6.375
14.81
18.15
11.99
12.92
ORF08
6R
Immediate-early protein ICP-18
1 96
0.01
0.0213
1.252
2.721
4.249
8.056
12.99
13.17
18.25
ORF08
7R
Unknown
4 96
0.01
0.01
0.715
2.341
9.216
17.87
18.71
18.68
24.32
ORF08
8L
Myristylated mem
brane protein
4 48
0.0565
0.0444
0.159
1.161
13.32
29.55
32.1
11.92
9.186
Continued
on follow
ing p
age

43
ORF
Putative Fun
ction
DTb
PTc
0H P.I.
1H P.I.
4H P.I.
8H
P.I.
16H
P.I.
32H
P.I.
48H
P.I.
72H
P.I.
96H
P.I.
ORF08
9L
Unknown
1 32
0.01
0.0204
0.202
1.45
17.46
34.46
28.87
11.23
7.823
ORF09
0L
Unknown
4 32
0.033
0.0264
0.373
1.572
13.69
31.21
26.46
9.846
8.51
ORF09
1L
Unknown
4 48
0.0348
0.0562
0.894
1.139
4.283
13.93
38.91
12.84
13.11
ORF09
2L
Unknown
4 32
0.01
0.01
0.412
1.502
10.76
26.74
21.91
9.616
5.963
ORF09
3L
Unknown
4 32
0.01
0.01
0.13
1.773
14.08
23.74
21.03
7.382
5.424
ORF09
6R
Unknown
4 32
0.031
0.026
0.283
1.794
12.58
32.71
31.14
15.21
14.27
ORF09
7L
DNA repair protein RAD2
4 32
0.0225
0.01
0.635
2.402
9.911
26.63
19.38
13.39
9.514
ORF09
8R
Unknown
4 32
0.01
0.01
0.205
2.236
13.87
35.29
32.98
13.4
8.163
ORF09
9R
Unknown
1 32
0.01
0.0307
0.262
2.374
9.022
25.88
23.92
9.494
5.497
ORF10
1R
Unknown
4 32
0.01
0.01
0.394
1.559
14.97
34.59
20.56
9.695
8.43
ORF10
2L
Ubiqutin/ribosomal protein
4 96
0.01
0.01
0.831
1.148
3.968
13.22
19.46
32.81
43.58
ORF10
3R
Unknown
4 32
0.097
0.0838
0.404
2.18
11.1
20.2
16.7
8.654
7.217
ORF10
4L
DNA-dependent RNA polym
erase II largest subunit
4 48
0.0932
0.0665
0.278
1.583
7.875
23.96
31.07
13.21
11.6
ORF10
7R
Unknown
4 48
0.0581
0.0727
0.304
1.23
6.632
16.14
16.99
11.33
9.846
ORF11
0L
Unknown
4 32
0.0236
0.0258
0.327
1.231
11.62
28.13
22.28
17.28
16.49
ORF11
1R
Unknown
1 32
0.0255
0.0941
0.623
4.472
7.711
12.54
12.23
9.275
10.05
ORF11
2R
Unknown
4 32
0.01
0.01
0.225
2.294
21.49
35
24.18
15.41
15.29
ORF11
4L
Unknown
4 32
0.0233
0.0202
0.0607
1.545
16.16
34.98
27.62
11.02
6.353
ORF11
6R
Putative replication factor
1 48
0.0399
0.0966
0.617
2.471
10.55
26.74
30.36
12.82
11.1
ORF11
8R
Unknown
4 32
0.01
0.01
0.34
3.044
12.51
23.46
20.94
9.413
5.483
ORF11
9R
Unknown
4 32
0.0273
0.01
0.116
1.563
13.15
28.87
25.62
11.43
7.243
ORF12
0L
Unknown
4 32
0.01
0.01
0.0825
1.222
19.32
33.36
22.25
9.247
7.148
ORF12
1R
Unknown
4 32
0.01
0.01
0.0808
1.47
20.49
29.24
22.94
9.974
6.213
ORF12
2L
Unknown
4 48
0.01
0.01
0.614
1.927
9.268
18.3
20.29
14.28
12.15
ORF12
3L
Unknown
4 48
0.061
0.0441
0.674
1.897
7.898
22.55
23.5
15.89
13.47
ORF12
4R
Unknown
4 32
0.01
0.01
0.514
3.841
17.11
22.87
17.72
14.33
15.29
ORF12
5R
Unknown
4 96
0.0275
0.0255
0.437
2.593
11.96
17.19
31.53
22.17
38.52
ORF12
6R
Unknown
8 32
0.01
0.01
0.01
0.391
14.03
44.12
36.53
23.62
21.31
ORF12
7R
Unknown
4 32
0.01
0.01
0.148
0.791
22.69
79.21
33.57
17.47
15.88
ORF12
8R
DNA polym
erase
4 32
0.01
0.01
0.854
1.615
7.494
25.33
22.54
12.61
8.829
ORF13
1R
Hom
olog to im
munoglobu
lin (Ig)-like domains
4 96
0.0539
0.0754
0.918
1.203
5.303
18.53
21.35
20.99
23.78
ORF13
2R
Unknown
1 32
0.0295
0.0985
0.339
1.303
9.76
20.66
15.43
10.86
10.5
ORF13
3R
Unknown
4 32
0.01
0.01
1.021
1.875
7.432
16.13
14.4
9.866
8.449
ORF13
4L
ATPase
4 32
0.0235
0.01
0.425
2.598
13.28
25.22
24.5
11.49
8.952
ORF13
5L
Unknown
4 32
0.01
0.01
1.192
2.829
9.361
22.13
18.94
10.3
7.891
ORF13
6R
Unknown
4 96
0.0301
0.01
0.493
2.151
7.686
19.47
22.58
21.63
23.64
ORF13
7R
Unknown
4 96
0.0375
0.0502
0.392
1.95
6.597
13.74
14.71
12.94
15.2
ORF13
9R
Unknown
4 32
0.01
0.01
0.362
1.495
9.121
18.45
17.81
8.388
6.771
Continued
on follow
ing p
age

44
ORF
Putative Fun
ction
DTb
PTc
0H P.I.
1H P.I.
4H P.I.
8H
P.I.
16H
P.I.
32H
P.I.
48H
P.I.
72H
P.I.
96H
P.I.
ORF14
0R
Unknown
8 32
0.01
0.01
0.01
0.723
13.38
27.84
26.64
12.96
9.252
ORF14
1R
Glycoprotein
4 32
0.01
0.01
0.0387
1.171
31.62
51.5
33.57
15.68
11.44
ORF14
3L
Unknown
1 48
0.01
0.0279
0.12
2.067
7.829
20.15
22.41
11.44
10.79
ORF14
4R
Fibroblast grow
th factor
4 96
0.0279
0.0289
0.785
3.053
5.551
13.37
15.79
19.05
27.75
ORF14
5R
Fibroblast grow
th factor
4 72
0.01
0.01
0.652
2.563
5.48
12.72
14.26
16.01
13.25
ORF14
6L
NTPase/helicase
1 32
0.01
0.0248
0.951
1.361
7.03
20.28
19.98
20.21
15.73
ORF14
7L
Unknown
4 48
0.01
0.01
0.281
0.91
9.568
28.73
30.69
17.97
14.65
ORF14
8R
Unknown
4 32
0.0486
0.044
0.618
1.897
9.069
20.49
16.8
9.829
8.848
ORF14
9R
Unknown
4 96
0.01
0.01
1.026
2.106
3.765
9.37
14.54
18.28
19.66
ORF15
0L
Unknown
4 32
0.0302
0.01
0.498
3.45
8.257
19.03
17.93
8.851
6.952
ORF15
1L
Unknown
4 32
0.01
0.01
0.26
7.408
12.19
16.55
12.89
7.02
4.962
ORF15
2R
Helicase
4 32
0.0367
0.0612
0.654
1.434
8.278
22.94
19.35
13.58
11.46
ORF15
4R
Unknown
1 48
0.0241
0.0514
0.691
1.393
8.316
23.51
30.19
13.48
11.05
ORF15
5R
Hom
olog to mam
malian semaphorin
1 32
0.01
0.026
0.246
1.958
17.64
31.76
29.41
12.62
10.63
ORF15
6L
Unknown
4 48
0.01
0.01
0.367
1.449
10.5
27.01
27.92
14.12
9.041
ORF15
7R
Unknown
4 32
0.0306
0.0224
0.295
3.237
8.808
23.21
20.38
11.13
9.478
ORF15
8L
Unknown
4 48
0.0686
0.0571
0.302
1.262
8.138
18.93
27.84
16.71
13.81
ORF15
9R
Unknown
4 48
0.0598
0.0567
0.474
1.415
9.523
25.76
27.08
13.15
11.37
ORF16
0L
Unknown
4 32
0.0416
0.055
0.245
1.675
10.52
25.74
24.39
11.67
8.834
ORF16
2L
Immediate-early protein ICP-46
4 48
0.114
0.0389
0.766
1.421
6.881
22.91
28.38
12.17
8.785
a The DNA M
icroarray data from the M
icroarray im
ages were norm
alized using “per spot divided by control channel and per chip normalized to
β-actin”.
b DT m
eans the tim
e (hours post infection) at which the exp
ression of a viral gene is, for first tim
e, showed two fold up-regulating com
pared to
baseline exp
ression (0h p.i.).
c PT m
eans the tim
e (hours post infection) at which the transcriptome of a viral gene accumulates to its maxim
um amount.

45
Chapter Three
iTRAQ study of Grouper embryonic cells
infected by Singapore Grouper Iridovirus: an
insight into pathogen and host cell interaction
Chen et al. 2008. iTRAQ analysis of Singapore grouper iridovirus infection in a
grouper embryonic cell line. J Gen Virol.. (Accepted).

46
3.1 Summary
Here we report the first proteomics study of grouper embryonic cells (GEC) infected
by Singapore grouper iridovirus (SGIV). The differential proteomes of GEC with and
without virus infection were studied and quantitated with iTRAQ labeling followed
by LC-MS-MS. There are forty nine viral proteins recognized and eleven of them
were identified for the first time. Moreover, approximately seven hundreds host
proteins were revealed. In SGIV-infected grouper embryonic cells, fourteen host
proteins were up-regulated and five host proteins were down-regulated. In this chapter,
we present a new insight into the interaction of the virus and the host cell at a
proteome scale. This study might significantly contribute to the understanding of
infection mechanism and pathogenesis of SGIV.

47
3.2 Introduction
Recently, Chen and coworkers discovered that 127 ORFs of SGIV were
transcriptionally active (Chen et al., 2006). Although a total of 51 SGIV proteins were
identified, the translational products of the remaining 111 ORFs are unknown (Song
et al., 2004; Song et al., 2006).
Isobaric Tags for Relative and Absolute Quantification (iTRAQ) can be used for the
comparison of up to four different samples simultaneously (Ross et al., 2004. ). In this
study, iTRAQ was used to investigate the quantitative proteomics analysis of SGIV-
infected cells compared to the SGIV mock-infected cells. To our knowledge, this is
the first proteomics study on iridovirus and host interaction.
3.3 Materials and methods
3.3.1 Cell and virus infection
Protocols for cell and virus infection were described earlier in Chapter 2.
3.3.2 iTRAQ Labeling and Two Dimensional (2D) LC-MALDI MS
The mock-infected cells and infected cells (48 hours post infection of SGIV) were
lysed with lysis buffer (0.5 M triethylammonium bicarbonate, pH 8.5, containing 1 %
SDS). One hundred micrograms of total proteins from SGIV-infected cell lysate and
equivalent amount of proteins from mock-infected cell lysate were used for iTRAQ
experiments. Firstly, the proteins were reduced and cysteines blocked according to the
iTRAQ kit‘s protocol (Applied Biosystems). Then, the samples were 10X diluted with
0.5 M triethylammonium bicarbonate, pH 8.5. 25 microliters of a 1 µg/µL trypsin
(Applied Biosystems) and incubated at 37 °C overnight. The samples were vacuum-
dried and reconstituted with 30 µL 0.5 M triethylammonium bicarbonate, pH 8.5. The
proteins from the mock-infected cells were labeled with iTRAQ 114 reagents, and the
proteins from the SGIV-infected cells were labeled with iTRAQ 115 reagent. After

48
that, the labeled samples were pooled and purified using a strong cation exchange
(SCX) column (Applied Biosystems). The bound peptides were eluted with 5 %
NH4OH in 30 % methanol.
After drying, the iTRAQ-labeled peptides were resuspended with 20 µL 5 mM
KH2PO4 buffer containing 5 % ACN, pH 3.0, and separated using an Ultimate dual-
gradient LC system (Dionex-LC Packings). At the first dimension separation, we used
a 0.3 × 150-mm SCX column (FUS-15-CP, Poros 10S, Dionex-LC Packings). The
mobile phase A and B was 5 mM KH2PO4 buffer, pH 3.0, containing 5 % ACN and 5
mM KH2PO4 buffer, pH 3.0, containing 5 % ACN and 500 mM KCl, respectively,
with a flow rate of 6 µL/min. The eluants with step gradients of mobile phase B
(unbound, 0-5, 5-10, 10-15, 15-20, 20-30, 30-40, 40-50, and 50-100 %) were captured
alternatively with two 0.3 × 1-mm trap columns (3-µm C18 PepMap, 100 Å, Dionex-
LC Packings) and washed with 0.05 % trifluoroacetic acid (TFA) to remove salts. At
the second dimension separation, we used a 0.2 × 50-mm reverse-phase column
(Monolithic PS-DVB, Dionex-LC Packings) by using 2 % ACN with 0.05 % TFA as
mobile phase A and 80 % ACN with 0.04 % TFA as mobile phase B, respectively,
with a gradient of 0-60 % mobile phase B in 15 min and a flow rate of 2.7 µL/min.
The LC fractions were mixed with MALDI matrix solution in a flow rate of 5.4
µL/min through a 25-nL mixing tee (Upchurch Scientific, Oak Harbor, WA) and
spotted onto 192-well MALDI target plates (Applied Biosystems) with a Probot
Micro Fraction collector (Dionex-LC Packings).
The samples were analyzed by using an ABI 4700 Proteomics Analyzer MALDI
TOF/TOF mass spectrometer (Applied Biosystems, Foster City, CA). GPS Explorer
software version 3.5 (Applied Biosystems) employing MASCOT search engine
(version 2.1; Matrix Science) was used for peptide and protein identification and

49
iTRAQ quantification. The NCBI database was used as the database. Cysteine
methanethiolation, N-terminal iTRAQ labeling and iTRAQ labeled lysine were
selected as fixed modifications during iTRAQ data analysis.
3.3.3 RT PCR
Total RNA was extracted from infected cell culture at late stage (48 hours post
infection) using an RNaesy mini kit (QIAGEN). The extracted RNA was treated with
RNase-free DNase I (QIAGEN). RT-PCR was conducted as described in one step RT
PCR kit (QIAGEN) protocol using treated RNA and gene specific primers. Briefly, in
reverse transcription step, cDNA was synthesized from total RNA at 50○C for 30 min.
The reverse transcriptase was inactivated by a heating step at 95○C for 15 min. The
PCR amplification of target genes was started after activation of the HotStarTaq DNA
polymerase. The amplification reactions were carried out for 30 cycles under
conditions of 95○C for 30s, 55○C for 30s and 72○C for 1.5min per cycle. The RT-PCR
products then were analyzed with 1.2% agarose gel.
3.3.4 Western blotting
Infected cells (48 hour post infection) and mock-infected cells (for mock-infected
control) were harvested. The cell lysate was treated with 5X SDS loading dye and
boiled for 10 min. The proteins were separated by SDS-PAGE 15% gel and blotted
onto a Nitrocellulose membrane (Amersham) in blotting buffer (3.21 g Tris base,
14.25 g glycine and 200 ml methanol per liter) for 1h at 70V. The blotted membrane
was then blocked in 5% skim milk, 1% BSA in TBST (20 mM Tris pH 7.4, 154 mM
NaCl, 0.1% Tween 20) for 1hour, washed 3 × 10 min with TBST. The membranes
were incubated with the first antibodies (different dilution for different antibodies) for
1 hour, washed with 3 × 10 min TBST, treated with second antibodies for 1hour: anti-
mouse antibody (Chemicon) or anti-rabbit antibody (Amersham), washed 3 × 10 min.

50
After that, the membranes were treated with a mixture of Super Signal West Pico
Stable Peroxide Solution and luminol enhancer solution for 5 min and ready for
exposure to X-ray film and image developing.
3.4 Results
3.4.1 Identification of viral proteins by using iTRAQ
By using iTRAQ, a total of 49 viral proteins were identified. The total ion score
confidence interval calculation total ion (total ion score C.I. %) of 48 viral proteins is
larger than 95% (Table 3.1. & Table 3.2). Only ORF022L, which has been reported
previously, showed a total ion score C.I. % of 86.351%. A total of 38 viral proteins
have been reported earlier (Song et al., 2004; Song et al., 2006), and these proteins
are listed in Table 3.1. The remaining 11 viral proteins identified from iTRAQ all
showed a total ion score C.I. % >95% and were first reported in this study. These 11
newly identified viral proteins are listed in Table 3.2. Among these 11 newly
identified viral proteins, only ORF049L was predicted to a dUTPase-like protein. The
other 10 proteins are functionally unknown and are considered as novel proteins.
Given that 162 open reading frames was predicted from the SGIV genome, only 49
viral proteins were identified by iTRAQ. The reasons for this phenomenon could be: 1)
not all 162 open reading frames have translational products in cell culture; 2) iTRAQ
is not sensitive enough to identify the low abundant proteins; 3) some of viral proteins
might be expressed at a different stage of viral infection.
3.4.2 Identification of differential expression host proteins by using iTRAQ
Given the unknown nature of the grouper Epinephelus tauvina genome, when we
analyzed the iTRAQ data against NCBI, only 743 host proteins were identified (Table
3.5). Among these host proteins, only 726 host protein showed a total icon score C.I.
% >95% (Table 3.5). When we compared the SGIV-infected GECs (iTRAQ 115

51
labeled) to the mock SGIV-infected GECs (iTRAQ 114 labeled), 12 host proteins
(total icon score C.I. % >95%) were >1.5 fold up-regulated, and 5 host proteins (total
icon score C.I. % >95%) were >1.5 fold down-regulated (Table 3.3. & Table 3.4.).
Among the up-regulated host proteins, ATP synthase F1 alpha subunit in ATP
synthesis coupled proton transport; dihydrofolate synthase in folic acid and derivative
biosynthetic process (Tettelin et al., 2005); mucin-associated surface protein in the
innate immune system; alpha-2-macroglobulin isoform 1 is involved in protease
inhibition; transposase is an enzyme that binds to single-stranded DNA and can
incorporate it into genomic DNA. In the down-regulated proteins, Chain A Rotamer
Strain As A Determinant Of Protein Structural Specificity and ribosomal protein S27a
are involved in ubiquitination; histone H3 plays critical roles in genomic DNA
packaging and gene transcriptional regulation; Rho GTPase is involved in complex
mechanical processes such as cell motility and phagocytosis (Wherlock and Mellor,
2002). Given that two up-regulated proteins, Matrix protein and putative head-tail
adaptor, do not match to any of the 162 ORFs from the SGIV genome, we classified
them into host proteins.
3.4.3 RT-PCR and western blot analysis of the viral proteins
The transcriptsomes of the 11 newly identified proteins were characterized by using
RT-PCR (Table 3.6). Figure 3.1 shows that these 11 new viral proteins have full
length transcriptional products. The transcriptional products of the other 38 viral
proteins have been reported (Song et al., 2004; Song et al., 2006). We generated
specific antibodies against 5 viral proteins (i.e. ORF018R, ORF026R, ORF093L,
ORF135L, and ORF140R) by using the purified recombinant viral expressed in E.
coli. The full length protein products for ORF018R, ORF026R, and ORF093L have
not been reported before. Here, by using specific antibodies, we demonstrate that

52
ORF018R, ORF026R and ORF093L encode full length proteins. In addition, we
further demonstrated that the two newly identified viral proteins, ORF135L and
ORF140R, code for two full length viral proteins.
3.4.4 Up regulation of host Histone H3 Lysine 79 (K79) methylation upon SGIV
infection
iTRAQ data showed that host histone H3 was down-regulated upon SGIV infection
(Table 3.4). To validate this finding, we carried out western blot against histone H3
by using the commercial polyclonal antibodies against histone H3. We were surprised
to find that total histone H3 was not down-regulated upon SGIV-infection (Data not
shown). Because we did not include any kinds of post translational modification when
we analyzed the iTRAQ data, the iTRAQ data only showed that the non modified
form of histone H3 was down-regulated upon SGIV infection. Given that total histone
H3 did not change upon SGIV infection, we postulated that the modified form of
histone H3 might be up-regulated. Histone H3 can undergo many kinds of post
translational modifications, such as methylation, acetylation, and phosphorylation
(Zhang and Reinberg, 2001; Lacoste et al., 2003; Li et al., 2007). In order to figure
out what kind of modifications that could account for the findings presented above,
we reexamined the iTRAQ raw data, and found that the peptide “EIAQDFKTDLR”
of histone H3 was the only peptide identified from iTRAQ analysis and the non-
modified form of this histone H3 peptide showed down regulation upon SGIV
infection. This histone H3 peptide sequence “EIAQDFKTDLR” contains a lysine
residue (i.e. K), which is referred as K79 in histone H3, and K79 can undergo
methylations. We proposed that the K79 methylation form of histone H3 could be up-
regulated. Combination of the up regulation of the K79 methylated form of histone
H3 and the down-regulation of the K79 non-methylated histone H3 would make the

53
total histone H3 unchanged. To test this hypothesis, we carried out western blots
against K79 methylated histone H3 by using the specific polyclonal antibodies against
the K79 methylated form of histone H3. The results are shown in Figure 3. The first
panel shows that the K79 methylated form of histone H3 was up-regulated upon
SGIV infection; the middle panel shows that the total histone H3 was not changed
upon SGIV infection; the bottom panel shows that the beta actins, which were used as
controls, were not changed (Figure 3.3). By combining the iTRAQ and western blot
data, we conclude that upon SGIV infection, the host histone H3 K79 methylation is
up-regulated, and the total host histone H3 is not changed.
3.5 Discussion
In this study, for the first time, we have examined the infection of SGIV with host cell
at proteome scale by using iTRAQ. We have identified 49 SGIV viral proteins (Table
3.1 & Table 3.2). Eleven out of the 49 viral proteins were first reported (Table 3.1).
The transcriptional products for these 11 viral ORFs were validated by RT-PCR
(Figure 3.1). Two newly identified viral proteins, ORF135L and ORF140R, were also
validated by western blot (Figure 3.2). In addition, the translational products of
another three viral proteins, ORF018R, ORF026R, and ORF093L, were confirmed by
western blot (Figure 3.2). Among the 49 SGIV viral proteins, only 6 viral proteins are
predicted to share homologies with known functional proteins: ORF049L coded the
dUTPase-like proteins, ORF072R for the major capsid proteins, ORF081L, the
tyrosine kinase-like proteins, ORF084L, the RNase III like proteins, ORF086R, the
putative immediate-early proteins, and ORF102L, the ubiqutin/ribosomal protein like
proteins. The remaining 43 viral proteins are all functionally unknown. Our studies
identified that these viral proteins were real viral coding proteins. These results would
be valuable for the functional studies of these viral proteins.

54
The proteomics scale analysis of SGIV-infected GECs by iTRAQ also provides
important insight into the SGIV and host cell interactions by providing information on
the differential expression of host proteins. These differential expressions of host
proteins are involved in multi cellular processes, and are closely linked together to
form a complex host response to SGIV infection. The dihydrofolate synthase, which
is involved in the folic acid biosynthetic process, was up-regulated (Tettelin et al.,
2005). The up regulation of dihydrofolate synthase may lead to the up regulation of
folic acid that is needed to replicate DNA (Jennings, 1995), and the folic acid
biosynthetic process needs ATPs as an energy source. It is not surprising to find that
the ATP synthase F1 alpha subunit, which is involved in ATP synthesis, was also up-
regulated in SGIV-infected GECs. The up regulation of dihydrofolate synthase and
ATP synthase F1 alpha subunit may play important roles in the replication of SGIV
genomic DNA in the host cells. When the host cells were infected by SGIV, host
mucin-associated surface protein, which is involved in the innate immune regulation,
and Rho GTPase, which is involved in complex mechanical processes such as cell
motility and phagocytosis, was up-regulated. This phenomenon may account for the
regulation of the host immune responses, when SGIV infects host cells. In addition,
the up-regulated of alpha-2-macroglobulin isoform 1, which is involved in protease
inhibition, could play roles in the protection of newly synthesized viral proteins
during SGIV replication inside host cells. The up regulation of transposase, which is
involved in the incorporation of DNA fragments into genomic DNA, could play
important role in integrating SGIV genomic DNA into host genome. We also found
that two proteins, Chain A Rotamer Strain As A Determinant Of Protein Structural
Specificity and ribosomal protein S27a, which are involved in ubiquitination process,
were down-regulated upon SGIV infection. Given that SGIV genome contains an

55
open reading frame coding the ubiquitin like protein, the down regulation of host
unbiquitination related proteins could play very important role in the regulation of
host protein degradation.
Another interesting finding is that the K79 methylation of histone H3 was up-
regulated during SGIV infection (Figure 3.3). Histone H3 plays an very important role
in genomic package. Histone H3 together with H2A, H2B, and H4, assembles to form
one octameric nucleosome core particle by wrapping 146 base pairs of DNA around
the protein spool in 1.65 left-handed super-helical turn (Luger et al., 1997). Histones
are subjected to an enormous number of posttranslational modifications, including
acetylation and methylation of lysines (K) and arginines (R), phosphorylation of
serines (S) and threonines (T), ubiquitylation and sumoylation of lysines, as well as
ribosylation (Peterson and Laniel, 2004). Since chromatin is used as the physiological
template for all DNA-mediated processes, histone modifications play very important
roles in controlling the structure and/or function of the chromatin fiber, and different
modifications can yield distinct functional consequences. For histone H3, the
posttranslational modification could be the acetylation of lysines (K), methylation of
lysines (K) and arginines (R), and phosphorylation of serines (S) and threonines (T).
The acetylation of histone H3 could happen at K4, K9, K14, K18, K23, and K27. K4,
K9 and K27 can also be subjected to methylation. Besides K4, K9 and K27,
methylation of histone H3 can also happen at R27, K36 and K79. Besides acetylating
and methylation, histone H3 can also be subjected to phosphorylations. The
phosphorylation of histone H3 can occur at T3, S10, T11, and S28. In addition, the
different modifications of histone H3 may lead to different functional consequences.
Histone H3 lysine methylations are closely related to the gene silencing and gene
activations. It has been reported that G9a/GLP-mediated H3-K9 methylation functions

56
in the silencing of individual genes (Tachibana et al., 2005). Besides H3-K9
methylation, the methylation of histone H3 K27 has been reported to be linked to
several silencing phenomena including homeotic-gene silencing, X inactivation and
genomic imprinting (Cao and Zhang, 2004). However, the methylations on the sites of
histone H3 K4, K36 and K79 are associated with gene activations (Martin and Zhang,
2005). Compared to histone H3 K4 methylation, the functions of histone H3 K36 and
K79 methylation are not well defined (Martin and Zhang, 2005). Recent study showed
that histone H3 K79 methylation could be involved in DNA repair (Huyen et al.,
2004). Additionally, histone H3 K79 methylation was also reported to be involved in
leukemic transformation (Okada et al., 2005). Our results showed that histone H3
K79 methylation was up-regulated when host cells were infected by virus. Given that
little is known about the function of histone H3 K79 methylation, our finding may
open a new clue to the function of histone H3 K79 methylation.

57
Figure 3.1 Full length amplification of 11 novel genes of SGIV via RT-PCR. Total
RNA (harvested after 48h of infection) was isolated by using the One Step RT-PCR
kit. Lane C: control, lane M: Marker 100 bp DNA ladder (Axygen)
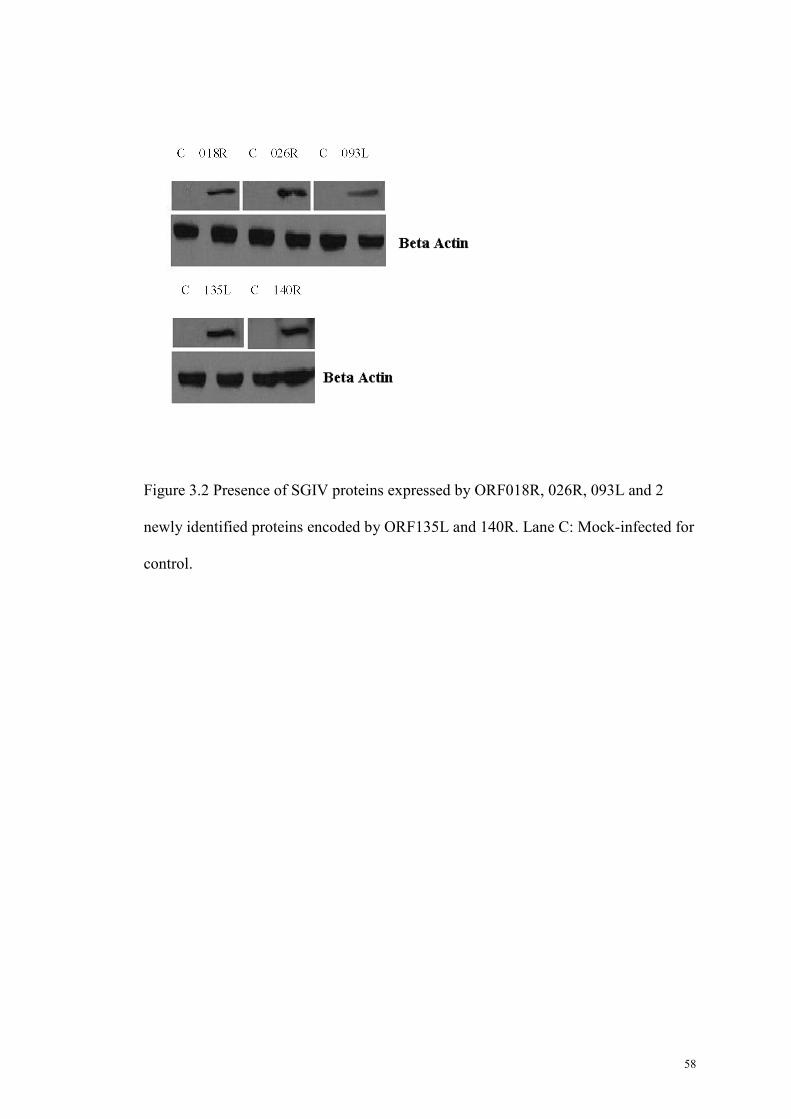
58
Figure 3.2 Presence of SGIV proteins expressed by ORF018R, 026R, 093L and 2
newly identified proteins encoded by ORF135L and 140R. Lane C: Mock-infected for
control.
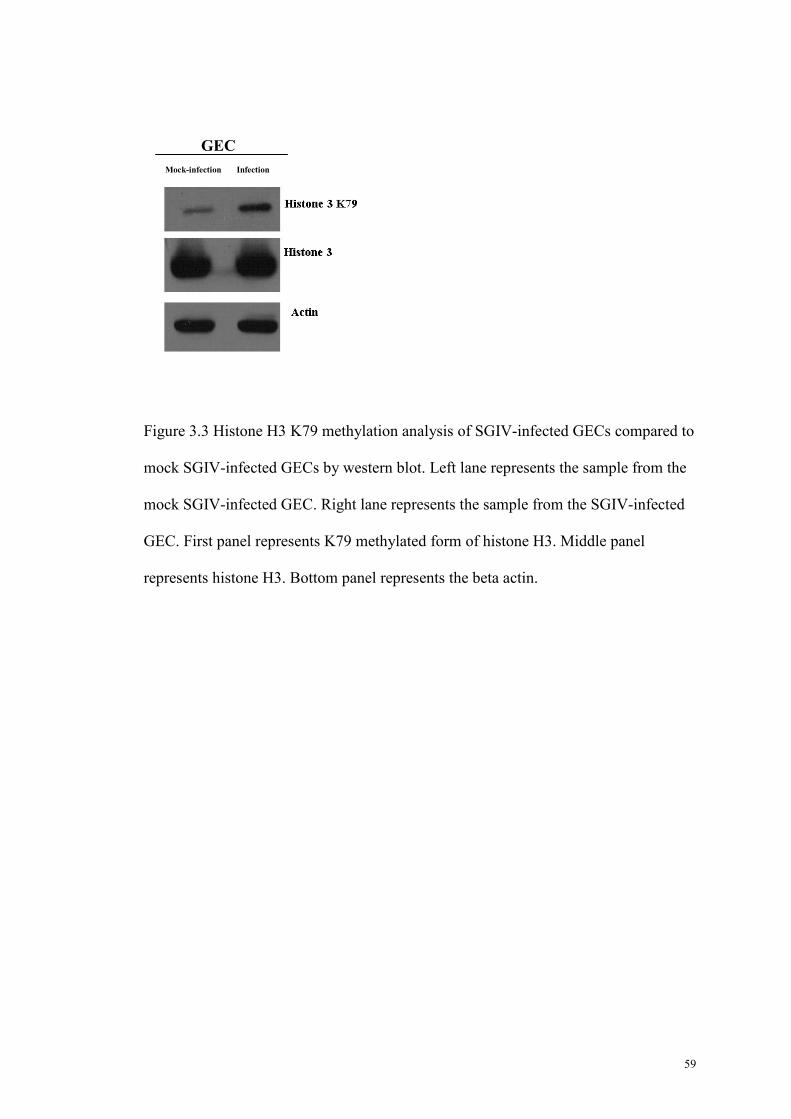
59
Figure 3.3 Histone H3 K79 methylation analysis of SGIV-infected GECs compared to
mock SGIV-infected GECs by western blot. Left lane represents the sample from the
mock SGIV-infected GEC. Right lane represents the sample from the SGIV-infected
GEC. First panel represents K79 methylated form of histone H3. Middle panel
represents histone H3. Bottom panel represents the beta actin.
Mock-infection Infection
GEC

60
Table 3.1. T
hirty eight viral proteins that were repo
rted earlier.
Protein
Name
Accession
Number
Gene
Function
Protein
MW
Protein
PI
Peptide
Count
Total Ion
Score
Total Ion
Score
C.I. %
Best Ion
Score
Best Ion
Score C.I.
%
ORF006R
gi|56692643
Unknown
33730.1
5.27
3 253.23
100
100.56
99.9999
ORF007L
gi|56692644
Unknown
32309.3
6.75
2 219.9
100
154.44
100
ORF008L
gi|56692645
Unknown
23577.4
9.52
6 522.32
100
159.33
100
ORF012L
gi|56692649
Unknown
129769
9.46
26
2068.35
100
165.88
100
ORF015L
gi|56692652
Unknown
6854.2
9.1
2 114.44
100
62.66
99.6127
ORF016L
gi|56692653
Unknown
49104.1
5.08
1 63.29
99.665
63.29
99.665
ORF018R
gi|56692655
Unknown
34786.3
6.01
10
769.15
100
146.11
100
ORF019R
gi|56692656
Unknown
40453.8
7.3
3 237.67
100
98.86
99.9999
ORF022L
gi|56692659
Unknown
22143.3
12.2
1 47.19
86.351
47.19
86.351
ORF025L
gi|56692662
Unknown
63935.3
7.2
11
1012.99
100
150.64
100
ORF026R
gi|56692663
Unknown
67740.6
6.38
3 190.93
100
69.82
99.9255
ORF038L
gi|56692675
Unknown
21278.9
9.72
1 84.04
99.9972
84.04
99.9972
ORF039L
gi|56692676
Unknown
129475
8.37
8 697.47
100
124.08
100
ORF043R
gi|56692680
Unknown
82574
5.36
5 354.99
100
108.62
100
ORF045L
gi|56692682
Unknown
23793.4
9.8
5 558.93
100
150.42
100
ORF046L
gi|56692683
Unknown
26298.3
9.87
3 321.98
100
126.78
100
ORF055R
gi|56692692
Unknown
24630
10.65
7 703.56
100
179.01
100
ORF056R
gi|56692693
Unknown
24647.8
6.26
4 512.39
100
187
100
ORF057L
gi|56692694
Unknown
141855
8.83
1 52.48
95.9626
52.48
95.9626
ORF067L
gi|56692704
deox
ynucleoside kinase
23673.6
6.43
5 374.87
100
94.9
99.9998
Table
to b
e co
nti
nued

61
Protein
Name
Accession
Number
Gene
Function
Protein
MW
Protein
PI
Peptide
Count
Total Ion
Score
Total Ion
Score
C.I. %
Best Ion
Score
Best Ion
Score C.I.
%
ORF069L
gi|56692706
Unknown
68132.5
9.62
9 671.82
100
106.27
100
ORF072R
gi|56692709
major capsid protein
52794.1
6.31
10
887.63
100
161.91
100
ORF075R
gi|56692712
Unknown
21389.3
4.5
3 182.42
100
71.43
99.9486
ORF081L
gi|56692715
tyrosine kinase
94045.7
8.75
3 165.6
100
62.39
99.5878
ORF082L
gi|56692719
Unknown
26561.7
9.02
3 219.63
100
96.44
99.9998
ORF084L
gi|56692721
RNase III
45984.4
9.17
1 72.63
99.961
72.63
99.961
ORF086R
gi|56692723
putative immediate-
early protein
18446.8
7.88
4 437.01
100
137.22
100
ORF088L
gi|56692725
Unknown
57860.9
4.89
1 62.11
99.5604
62.11
99.5604
ORF090L
gi|56692727
Unknown
47281.4
7.62
5 344.54
100
85.45
99.998
ORF093L
gi|56692730
Unknown
52020.3
7.18
2 106.61
100
54.39
97.3992
ORF098R
gi|56692735
Unknown
33404.9
9.49
2 103.72
100
56.4
98.3628
ORF101R
gi|56692738
Unknown
36873.3
6.11
6 443.26
100
148.07
100
ORF102L
gi|56692739
ubiqutin/ribosom
al
protein
9690.69
6.71
4 378.43
100
141.97
100
ORF119R
gi|56692756
Unknown
10275.3
9.36
1 77.65
99.9877
77.65
99.9877
ORF124R
gi|56692761
Unknown
22127.3
6.49
1 110.32
100
110.32
100
ORF125R
gi|56692762
Unknown
23111.8
5.91
2 98.56
99.9999
49.62
92.1999
ORF151L
gi|56692788
Unknown
24116.5
6.43
1 100.48
99.9999
100.48
99.9999
ORF156L
gi|56692793
Unknown
33642.7
5.6
8 683.34
100
126.85
100
Table 3.1. C
ond.

62
Table 3.2. E
leven newly identified viral proteins.
Protein
Name
Accession
Number
Gene
Function
Protein
MW
Protein
PI
Peptide
Count
Total Ion
Score
Total Ion
Score C.I.
%
Best Ion
Score
Best Ion
Score C.I.
%
ORF049L
gi|56692686
dUTPase
18678.9
6.51
3 322.16
100
140.84
100
ORF099R
gi|56692736
Unknown
10650.5
5.13
3 221.15
100
92.47
99.9996
ORF107R
gi|56692744
Unknown
41572.6
3.91
1 84
99.9972
84
99.9972
ORF111R
gi|56692748
Unknown
32503.8
5.47
1 90.83
99.9994
90.83
99.9994
ORF118R
gi|56692755
Unknown
41293.7
8.76
4 303.46
100
112.84
100
ORF127R
gi|56692764
Unknown
21925.3
7.01
1 57.35
98.6845
57.35
98.6845
ORF135L
gi|56692772
Unknown
15150
5.95
3 248.72
100
94.23
99.9997
ORF136R
gi|56692773
Unknown
13116.6
7.52
1 80.94
99.9942
80.94
99.9942
ORF140R
gi|56692777
Unknown
36630.9
4.85
14
1408.35
100
181.16
100
ORF155R
gi|56692792
Unknown
68875.1
5.03
2 136.06
100
82.44
99.9959
ORF162L
gi|56692799
Unknown
49351.3
6.49
3 158.02
100
61.4
99.4823
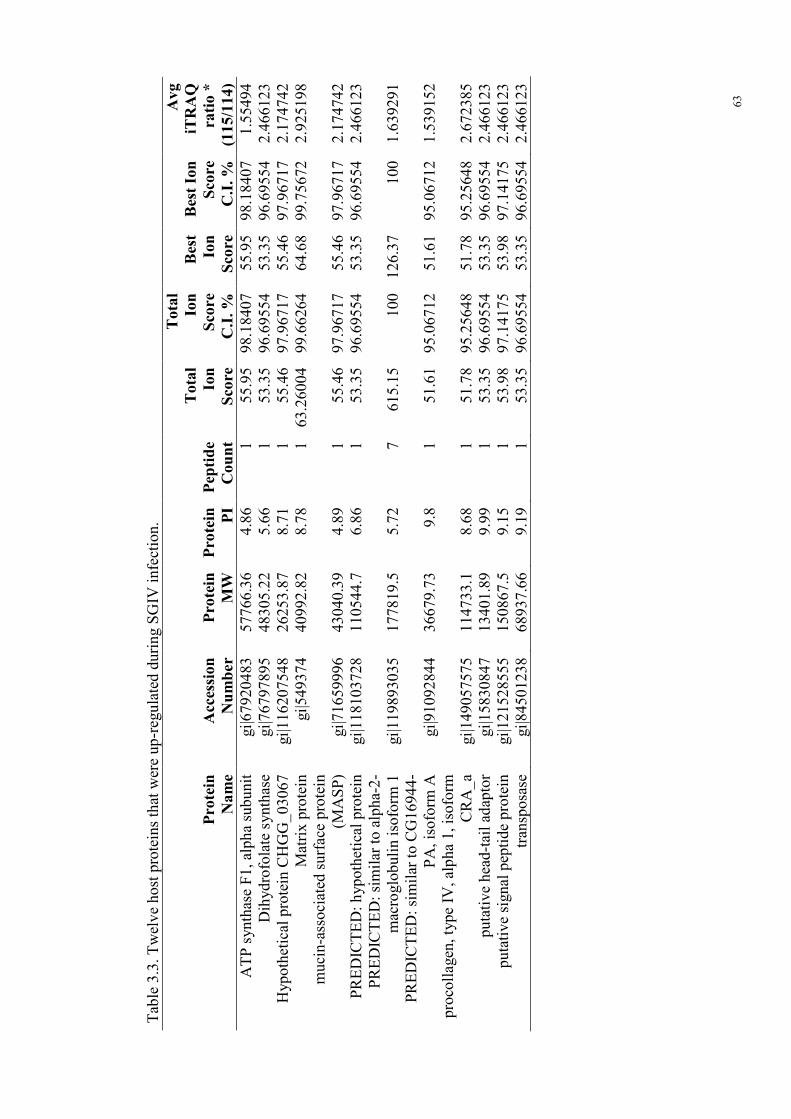
63
Table 3.3. T
welve host proteins that were up
-regulated during SGIV
infection.
Protein
Name
Accession
Number
Protein
MW
Protein
PI
Peptide
Count
Total
Ion
Score
Total
Ion
Score
C.I. %
Best
Ion
Score
Best Ion
Score
C.I. %
Avg
iTRAQ
ratio *
(115/114)
ATP synthase F1, alpha subunit
gi|67920483
57766.36
4.86
1 55.95
98.18407
55.95
98.18407
1.55494
Dihydrofolate synthase
gi|76797895
48305.22
5.66
1 53.35
96.69554
53.35
96.69554
2.466123
Hypothetical protein CHGG_03067
gi|116207548
26253.87
8.71
1 55.46
97.96717
55.46
97.96717
2.174742
Matrix protein
gi|549374
40992.82
8.78
1 63.26004 99.66264
64.68
99.75672
2.925198
mucin-associated surface protein
(MASP)
gi|71659996
43040.39
4.89
1 55.46
97.96717
55.46
97.96717
2.174742
PREDICTED: hypothetical protein
gi|118103728
110544.7
6.86
1 53.35
96.69554
53.35
96.69554
2.466123
PREDICTED: similar to alpha-2-
macroglobulin isoform
1
gi|119893035
177819.5
5.72
7 615.15
100
126.37
100
1.639291
PREDICTED: similar to CG16944-
PA, isoform
A
gi|91092844
36679.73
9.8
1 51.61
95.06712
51.61
95.06712
1.539152
procollagen, type IV
, alpha 1, isoform
CRA_a
gi|149057575
114733.1
8.68
1 51.78
95.25648
51.78
95.25648
2.672385
putative head-tail adaptor
gi|15830847
13401.89
9.99
1 53.35
96.69554
53.35
96.69554
2.466123
putative signal peptide protein
gi|121528555
150867.5
9.15
1 53.98
97.14175
53.98
97.14175
2.466123
transposase
gi|84501238
68937.66
9.19
1 53.35
96.69554
53.35
96.69554
2.466123
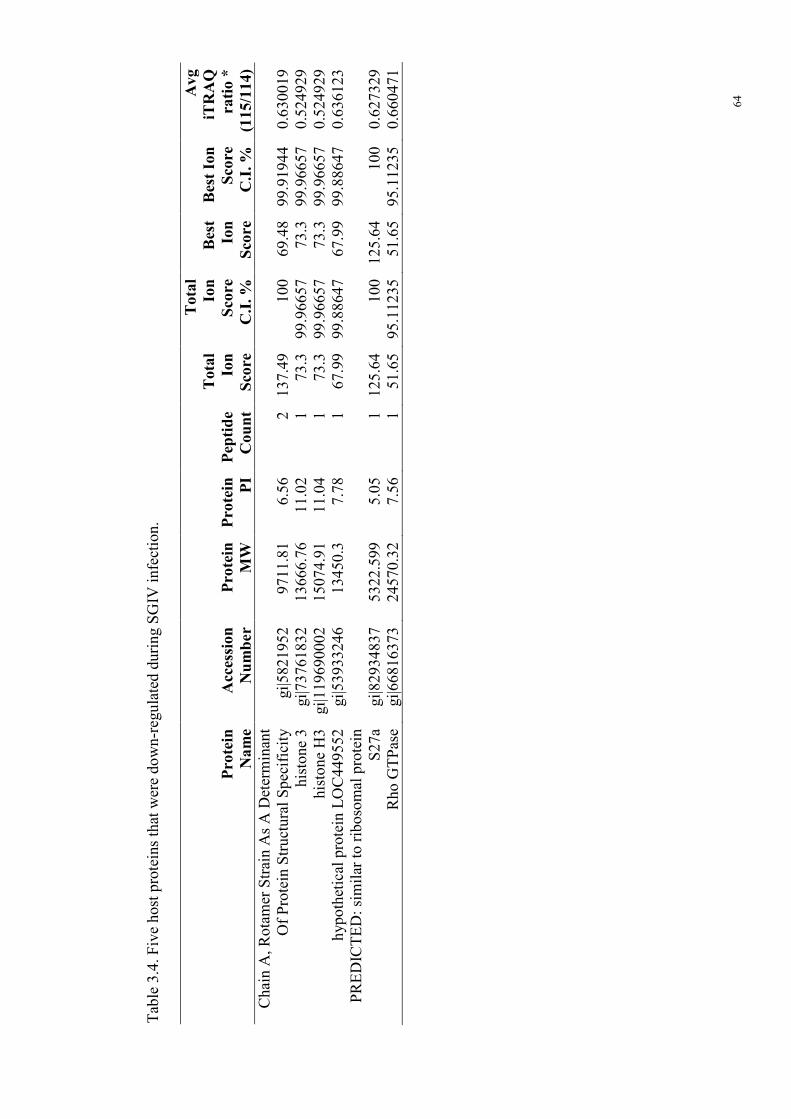
64
Table 3.4. F
ive host proteins that were do
wn-regulated during SGIV
infection.
Protein
Name
Accession
Number
Protein
MW
Protein
PI
Peptide
Count
Total
Ion
Score
Total
Ion
Score
C.I. %
Best
Ion
Score
Best Ion
Score
C.I. %
Avg
iTRAQ
ratio *
(115/114)
Chain A, R
otam
er Strain As A Determinant
Of Protein Structural Specificity
gi|5821952
9711.81
6.56
2 137.49
100
69.48
99.91944
0.630019
histone 3
gi|73761832
13666.76
11.02
1 73.3 99.96657
73.3 99.96657
0.524929
histone H3 gi|119690002
15074.91
11.04
1 73.3 99.96657
73.3 99.96657
0.524929
hypothetical protein LOC449552
gi|53933246
13450.3
7.78
1 67.99
99.88647
67.99
99.88647
0.636123
PREDICTED: similar to ribosomal protein
S27a
gi|82934837
5322.599
5.05
1 125.64
100
125.64
100
0.627329
Rho GTPase
gi|66816373
24570.32
7.56
1 51.65
95.11235
51.65
95.11235
0.660471

65
Table 3.5. GEC host proteins identified from iTRAQ analysis
Protein Name
Chain , Modified Beta Trypsin (Monoisopropylphosphoryl Inhibited) (E.C.3.4.21.4) (Neutron Data) Chain , Structure Of Hydrolase (Serine Proteinase) [Segment 3 of 4] Pollen allergen Sal k 1 14-3-3 epsilon2 isoform [Schistosoma bovis] 14-3-3.a protein [Fundulus heteroclitus] 26S proteasome regulatory subunit S4 like AAA ATpase [Cryptosporidium parvum Iowa II] 3-deoxy-7-phosphoheptulonate synthase [Lactococcus lactis subsp. lactis Il1403] 3-deoxy-7-phosphoheptulonate synthase [Planctomyces maris DSM 8797] 3-hydroxy-3-methylglutaryl-Coenzyme A synthase 1 (soluble) [Danio rerio] 3-monooxygenase/tryptophan 5-monooxygenase activation protein, gamma polypeptide [Danio rerio] 40S ribosomal protein S11 [Stizostedion vitreum] 40S ribosomal protein S12 40S ribosomal protein S13 40S ribosomal protein S16 40S ribosomal protein S18 40S ribosomal protein S19 40S ribosomal protein S3a 40S ribosomal protein S3a [Siniperca chuatsi] 40S ribosomal protein S6 40S ribosomal protein S6 [Pseudopleuronectes americanus] 40S ribosomal protein S7 40S ribosomal protein S8 40S ribosomal protein Sa-like protein [Sparus aurata] 40S ribosomal small subunit protein S10 [Xenopus laevis] 4SNc-Tudor domain protein short form [Danio rerio] 50S ribosomal protein L22 [Flavobacterium sp. MED217] 60S acidic ribosomal protein P1 [Platichthys flesus] 60S ribosomal protein L10a 60S ribosomal protein L18 60S ribosomal protein L22 [Scophthalmus maximus] 60S ribosomal protein L23 [Ustilago maydis 521] 60S ribosomal protein L28 (L29) (YL24) (RP44) (L27a) (RP62) 60S ribosomal protein L31 60S ribosomal protein L34 60S ribosomal protein L35 [Scophthalmus maximus] 60S ribosomal protein L6 [Pagrus major] 60S ribosomal protein L7a 60S ribosomal protein L8 ABC-type transport system, ATPase component [Uncultured methanogenic archaeon RC-I] ABR117Cp [Ashbya gossypii ATCC 10895] acetylcholinesterase - rabbit acetyl-CoA C-acyltransferase [Pyrobaculum aerophilum str. IM2] acidic ribosomal phosphoprotein P0 [Mus musculus] actin [Aspergillus nidulans FGSC A4] actin [Gossypium hirsutum] actin [Gregarina polymorpha] actin [Haemaphysalis longicornis]

66
actin [Haliotis rufescens] actin [Japetella diaphana] actin [Kluyveromyces polysporus] actin [Leucocryptos marina] actin [Mastigoteuthis magna] actin [Micronuclearia podoventralis] actin [Monodonta perplexa perplexa] actin [Nuclearia simplex] actin [Oxystele tigrina] actin [Panax ginseng] actin [Phaseolus acutifolius] actin [Phoma nigrificans] actin [Pterosperma cristatum] actin [Saccharomyces kunashirensis] actin [Saccharomyces spencerorum] actin [Symbiodinium sp. clade C] actin 1 [Paxillus involutus] actin 2 [Strongylocentrotus purpuratus] actin 5 [Aedes aegypti] actin related protein 2/3 complex subunit 2 [Homo sapiens] Actin, muscle actinin, alpha 3 [Homo sapiens] actinin, alpha 3 [Xenopus laevis] actin-like protein [Homo sapiens] actin-related protein - Japanese pufferfish acyl carrier protein (ACP) [Pseudomonas entomophila L48] adenine nucleotide translocator s254 [Takifugu rubripes] adenosylhomocysteinase [Solibacter usitatus Ellin6076] adenylate kinase [Nitrobacter winogradskyi Nb-255] alanyl-tRNA synthetase [Danio rerio] Aldehyde dehydrogenase [Caulobacter sp. K31] aldolase c, fructose-bisphosphate [Danio rerio] alpha actinin 4 [Homo sapiens] alpha tropomyosin [Gillichthys mirabilis] alpha tubulin [Gillichthys mirabilis] alpha tubulin [Notothenia coriiceps] alpha tubulin 1 [Rhynchopus sp. ATCC 50230] Alpha-actinin-2 (Alpha actinin skeletal muscle isoform 2) (F-actin cross-linking protein) Alpha-enolase (2-phospho-D-glycerate hydro-lyase) (Non-neural enolase) (NNE) (Enolase 1) alpha-internexin alpha-tubulin [Bombyx mori] alpha-tubulin [Dicyema japonicum] alpha-tubulin [Jakoba incarcerata] alpha-tubulin [Medicago truncatula] alpha-tubulin [Spathidium sp.] alpha-tubulin [Strobilidium sp.] alpha-tubulin [Vorticella microstoma] alpha-tubulin 2 [Homarus gammarus] annexin 11a isoform 2 [Danio rerio] annexin A2 [Monopterus albus] annexin max3 [Oryzias latipes] annexin max3 [Pagrus major] Asparagine synthetase [glutamine-hydrolyzing] (Glutamine-dependent asparagine synthetase) (Cell cyc

67
aspartate-tRNA ligase [Cryptococcus neoformans var. neoformans JEC21] ATCXXS1 (C-TERMINAL CYSTEINE RESIDUE IS CHANGED TO A SERINE 1); thiol-disulfide exchange intermedia ATP synthase alpha-subunit [Ciona intestinalis] ATP synthase beta chain, mitochondrial precursor, putative [Plasmodium falciparum 3D7] ATP synthase beta chain, mitochondrial, putative [Arabidopsis thaliana] ATP synthase beta subunit [Pachysandra procumbens] ATP synthase F1 subunit alpha [Reclinomonas americana] ATP synthase F1, alpha subunit [Crocosphaera watsonii WH 8501] ATP synthase F1, beta subunit [Frankia sp. EAN1pec] ATP synthase subunit B [Brucella melitensis 16M] ATP synthase subunit B [Mycoplasma hyopneumoniae 232] ATP synthase subunit B [Mycoplasma mycoides subsp. mycoides SC str. PG1] atpase ATPase associated with various cellular activities, AAA_5 [Nocardioides sp. JS614] ATPase, AAA family protein [Tetrahymena thermophila SB210] AtRABA1e (Arabidopsis Rab GTPase homolog A1e); GTP binding [Arabidopsis thaliana] beta actin [Atherina boyeri] beta tubulin [Apusomonas proboscidea] beta tubulin [Culex pipiens pipiens] beta tubulin [Gillichthys mirabilis] beta tubulin [Glomus claroideum] beta tubulin [Glomus sp. BEG19] beta-2 tubulin [Aedes aegypti] beta-2 tubulin [Gadus morhua] beta-actin [Macrobrachium rosenbergii] beta-actin [Monopterus albus] beta-actin [Mustela putorius furo] beta-actin [Pomacentrus moluccensis] beta-actin [Vanessa cardui] beta-tubulin [Basidiobolus microsporus] beta-tubulin [Bombyx mori] beta-tubulin [Bombyx mori] beta-tubulin [Bombyx mori] beta-tubulin [Chaetosphaeria chlorotunicata] beta-tubulin [Crassostrea gigas] beta-tubulin [Dicyema japonicum] beta-tubulin [Esslingeriana idahoensis] beta-tubulin [Halocynthia roretzi] beta-tubulin [Microbotryum violaceum] beta-tubulin [Monosiga brevicollis] beta-tubulin [Phytophthora palmivora] beta-tubulin [Schistosoma haematobium] beta-tubulin [Schistosoma japonicum] beta-tubulin [Sclerospora graminicola] biliverdin reductase B (flavin reductase (NADPH)) [Mus musculus] BiP, heat shock protein 3 Branched-chain amino acid aminotransferase II [Xylella fastidiosa Dixon] calcyclin-associated protein, CAP50=Ca2+/phospholipid-binding protein L-14 fragment [rabbits, lung, calmodulin calmodulin [Gonothyraea loveni] calmodulin [Homo sapiens] calreticulin [Paralichthys olivaceus] capping protein (actin filament) muscle Z-line, alpha 2 [Mus musculus]

68
capping protein (actin filament) muscle Z-line, alpha 2 [Takifugu rubripes] carboxyl-terminal processing protease [Prochlorococcus marinus str. MIT 9211] cation transport ATPase, HAD family [Methanobrevibacter smithii ATCC 35061] cation transporter p-type ATPase a CtpA [Mycobacterium ulcerans Agy99] CCTgamma CG5384-PA [Drosophila melanogaster] CG8036-PB, isoform B [Drosophila melanogaster] Chain A, Beta-Actin-Profilin Complex Chain A, Complex Between Rabbit Muscle Alpha-Actin: Human Gelsolin Domain 1 Chain A, Crystal Structure Of Bovine Liver Glutamate Dehydrogenase Complexed With Gtp, Nadh, And L- Chain A, Crystal Structure Of The D3b Subcomplex Of The Human Core Snrnp Domain At 2.0a Resolution Chain A, Crystal Structure Of Two D-Glyceraldehyde-3-Phosphate Dehydrogenase Complexes: A Case Of A Chain A, Rotamer Strain As A Determinant Of Protein Structural Specificity Chain A, Structure Of Hyper-Vil-Trypsin Chain A, Structure Of The Dead Domain Of Human Eukaryotic Initiation Factor 4a, Eif4a Chain A, Uncomplexed Rat Trypsin Mutant With Asp 189 Replaced With Ser (D189s) Chain B, Tubulin Alpha-Beta Dimer, Electron Diffraction chaperone protein DnaJ [Geobacter lovleyi SZ] chaperone protein DnaK [Shewanella amazonensis SB2B] chaperonin [Mesobuthus gibbosus] chaperonin [Mesobuthus gibbosus] chaperonin containing TCP1, subunit 2 (beta) [Danio rerio] chaperonin containing TCP1, subunit 4 (delta) [Homo sapiens] chaperonin containing TCP1, subunit 8 (theta) [Homo sapiens] chaperonin containing TCP1, subunit 8 (theta) [Xenopus tropicalis] chaperonin GroEL , truncated [Syntrophus aciditrophicus SB] chaperonin GroEL [Myxococcus xanthus DK 1622] chaperonin subunit 6a (zeta) [Mus musculus] chaperonin subunit 7 [Pagrus major] COG0366: Glycosidases [Bacillus anthracis str. A2012] conserved hypothetical protein [Coccidioides immitis RS] conserved hypothetical protein [Gibberella zeae PH-1] conserved hypothetical protein [Stigmatella aurantiaca DW4/3-1] conserved hypothetical protein TIGR00157 [Methylococcus capsulatus str. Bath] core-binding factor, beta subunit isoform 2 [Homo sapiens] CypA protein [Xenopus laevis] cytoplasmic actin CyII [Heliocidaris erythrogramma] cytoskeletal actin IIIa [Strongylocentrotus purpuratus] cytosolic heat shock protein 70 [Trimastix marina] cytosolic malate dehydrogenase A [Oryzias latipes] cytosolic malate dehydrogenase thermostable form [Sphyraena idiastes] dihydrofolate synthase [Streptococcus agalactiae 18RS21] Dihydrolipoyl dehydrogenase, mitochondrial precursor (Dihydrolipoamide dehydrogenase) (Glycine clea DNA excision repair protein Rad2 [Neosartorya fischeri NRRL 181] DNA polymerase dnak protein BiP [Tetrahymena thermophila SB210] dnaK-type molecular chaperone hsc74 - yeast (Pichia angusta) (fragments) elongation factor 1 alpha [Euzercon latum] elongation factor 1a [Antonina graminis] Elongation factor 1-alpha (EF-1-alpha) elongation factor 1-alpha [Rhincalanus nasutus]

69
Elongation factor 1-gamma (EF-1-gamma) (eEF-1B gamma) elongation factor 2 [Halichondria sp. AR-2003] elongation factor 2 [Nematostella vectensis] elongation factor-1 alpha [Micromegistus bakeri] elongation factor-1 alpha [Ostrinia nubilalis] elongation factor-2 [Echiniscus viridissimus] enolase 1, (alpha) [Danio rerio] Enoyl Coenzyme A hydratase, short chain, 1, mitochondrial [Bos taurus] enoyl Coenzyme A hydratase, short chain, 1, mitochondrial [Mus musculus] ENSANGP00000010754 [Anopheles gambiae str. PEST] ENSANGP00000012302 [Anopheles gambiae str. PEST] ENSANGP00000021214 [Anopheles gambiae str. PEST] ENSANGP00000024287 [Anopheles gambiae str. PEST] eukaryotic translation elongation factor 2 [Mus musculus] eukaryotic translation elongation factor 2 [Rana sylvatica] Eukaryotic translation elongation factor 2, like [Danio rerio] eukaryotic translation initiation factor 2, subunit 1 alpha [Rattus norvegicus] Eukaryotic translation initiation factor 3 subunit 7 (eIF-3 zeta) (eIF3 p66) (eIF3d) eukaryotic translation initiation factor 3, subunit 3 (gamma) [Danio rerio] eukaryotic translation initiation factor 3, subunit 3 gamma, 40kDa [Homo sapiens] eukaryotic translation initiation factor 4A2 [Mus musculus] ezrin/radixin/moesin (ERM)-like protein [Ciona intestinalis] F1-ATPase beta subunit=H(+)-transporting ATPase beta subunit [cattle, heart, Peptide Mitochondrial Partial, 19 aa] fatty acid binding protein 7, brain, a [Danio rerio] Fe-S protein assembly chaperone HscA [Polaromonas naphthalenivorans CJ2] Fe-S protein assembly chaperone HscA [Stigmatella aurantiaca DW4/3-1] fibrillarin [Danio rerio] Fibrillarin CG9888-PA [Drosophila melanogaster] Filamin-B (FLN-B) (Beta-filamin) (Actin-binding-like protein) (ABP-280-like protein) flagellar protein FlaG protein [Shewanella sp. W3-18-1] flightless I homolog [Homo sapiens] formyl transferase domain protein [Campylobacter jejuni RM1221] fructose bisphosphate aldolase [Polypterus senegalus] fructose-bisphosphate aldolase A-2 [Acipenser baerii] Fructose-bisphosphate aldolase C (Brain-type aldolase) Fructose-bisphosphate aldolase, non-muscle type fubp1 [Xenopus tropicalis] GA10751-PA [Drosophila pseudoobscura] gamma actin-like protein [Mus musculus] Genome polyprotein [Contains: Coat protein (CP)] glucosamine-6-phosphate deaminase [Cytophaga hutchinsonii ATCC 33406] glucose regulated protein, 58kDa [Xenopus laevis] glucose-regulated protein 78 [Paralichthys olivaceus] glucose-regulated protein 78, putative [Leishmania major] glucose-regulated protein 94 [Paralichthys olivaceus] glutamate oxaloacetate transaminase 2, mitochondrial [Mus musculus] glutathione S-transferase [Micropterus salmoides] glyceraldehyde-3-phosphate dehydrogenase [Oncorhynchus tshawytscha] glyceraldehyde-3-phosphate dehydrogenase, type I [Flavobacteria bacterium BAL38] Glycine dehydrogenase subunit [Geobacillus thermodenitrificans NG80-2] GTPase ObgE [Caminibacter mediatlanticus TB-2] GTP-binding nuclear protein Ran (GTPase Ran) GTP-binding protein LepA [Tropheryma whipplei TW08/27]

70
guanine nucleotide binding protein (G protein), beta polypeptide 2-like 1 [Danio rerio] H2A histone family, member Z [Homo sapiens] hCG1642531 [Homo sapiens] heart-type fatty acid-binding protein [Fundulus heteroclitus] heat shock 60 kD protein 1 [Danio rerio] heat shock 60kDa protein 1 (chaperonin) [Gallus gallus] Heat shock 70 kDa protein cognate 4 (Hsc 70-4) heat shock cognate 70 [Rhynchosciara americana] heat shock cognate 70 [Xiphophorus hellerii] heat shock cognate 70 kDa protein [Pimephales promelas] heat shock cognate 70 protein [Spodoptera frugiperda] heat shock protein [Numida meleagris] Heat shock protein [Plasmodium berghei strain ANKA] heat shock protein 10 [Monopterus albus] heat shock protein 60 [Trichinella spiralis] heat shock protein 60 kDa [Paralichthys olivaceus] heat shock protein 70 [Anatolica polita borealis] heat shock protein 70 [Bombyx mori] heat shock protein 70 [Capsaspora owczarzaki] heat shock protein 70 [Cryptosporidium andersoni] heat shock protein 70 [Cyclospora cercopitheci] heat shock protein 70 [Euplotes aediculatus] heat shock protein 70 [Geodia cydonium] heat shock protein 70 [Laternula elliptica] heat shock protein 70 [Latimeria chalumnae] heat shock protein 70 [Lucilia cuprina] heat shock protein 70 [Mizuhopecten yessoensis] heat shock protein 70 [Omphisa fuscidentalis] heat shock protein 70 [Oxytricha sp. LPJ-2005] heat shock protein 70 [Paralichthys olivaceus] heat shock protein 70 [Spumella uniguttata] heat shock protein 70 isoform 3 [Oryzias latipes] heat shock protein 70 isoform 5 [Oryzias latipes] heat shock protein 70 precursor [Neocallimastix patriciarum] heat shock protein 70, hsp70A2 heat shock protein 70-B cytosolic isoform [Bodo saltans] heat shock protein 70kDa [Pholcus phalangioides] heat shock protein 9 [Mus musculus] heat shock protein 90 heat shock protein 90 [Bufo gargarizans] heat shock protein 90 beta [Paralichthys olivaceus] Heat shock protein DnaJ-like protein [Lentisphaera araneosa HTCC2155] Heat shock protein Hsp70 [Xylella fastidiosa Dixon] heat shock protein, Hsp70 [Cryptosporidium parvum Iowa II] heat-shock protein [Littorina plena] heat-shock protein Hsp70 [Oopsacas minuta] heat-shock protein Hsp70 [Petrosia ficiformis] heavy metal translocating P-type ATPase [Caldicellulosiruptor saccharolyticus DSM 8903] hexokinase 1 [Danio rerio] high density lipoprotein-binding protein (vigilin) [Danio rerio] histone 3 [Frankliniella sp. KY-2004] Histone H2A histone h2a variant [Cryptococcus neoformans var. neoformans JEC21] histone H2B (ISS) [Ostreococcus tauri]

71
histone H2B [Anacropora matthai] Histone H2B 1.2 (H2B1.2) histone H3 [Anelosimus eximius] histone H4 histone H4 [Cucumis sativus] host actin-1 [Rhodomonas chrysoidea] HSC71 [Rivulus marmoratus] HSP60 [Carassius auratus] HSP70 [Chlamys farreri] Hsp70 [Hydrogenobacter hydrogenophilus] HSP70 [Oxyuranus scutellatus scutellatus] Hsp70 protein [Cetorhinus maximus] Hsp70 protein [Odontaspis ferox] Hsp70Bbb CG5834-PA [Drosophila melanogaster] hypothetical protein [Ictalurus punctatus] hypothetical protein [Neurospora crassa OR74A] hypothetical protein [Paramecium tetraurelia] hypothetical protein [Paramecium tetraurelia] hypothetical protein [Paramecium tetraurelia] hypothetical protein [Paramecium tetraurelia] hypothetical protein [Vitis vinifera] hypothetical protein [Vitis vinifera] hypothetical protein [Vitis vinifera] hypothetical protein A - mouse (fragment) hypothetical protein Aave_1075 [Acidovorax avenae subsp. citrulli AAC00-1] hypothetical protein An07g09990 [Aspergillus niger] hypothetical protein BA3462 [Bacillus anthracis str. Ames] Hypothetical protein CBG03435 [Caenorhabditis briggsae] Hypothetical protein CBG06421 [Caenorhabditis briggsae] Hypothetical protein CBG18934 [Caenorhabditis briggsae] hypothetical protein CdifQ_04001593 [Clostridium difficile QCD-32g58] hypothetical protein CHGG_03067 [Chaetomium globosum CBS 148.51] hypothetical protein Chro.80400 [Cryptosporidium hominis TU502] hypothetical protein CNBC3800 [Cryptococcus neoformans var. neoformans B-3501A] hypothetical protein CNBG1220 [Cryptococcus neoformans var. neoformans B-3501A] hypothetical protein DR_1619 [Deinococcus radiodurans R1] hypothetical protein FG03504.1 [Gibberella zeae PH-1] hypothetical protein GLP_456_20463_41396 [Giardia lamblia ATCC 50803] hypothetical protein GTNG_2000 [Geobacillus thermodenitrificans NG80-2] hypothetical protein lmo2611 [Listeria monocytogenes EGD-e] hypothetical protein LOC335798 [Danio rerio] hypothetical protein LOC337595 [Danio rerio] hypothetical protein LOC393186 [Danio rerio] hypothetical protein LOC394635 [Xenopus tropicalis] hypothetical protein LOC432005 [Xenopus laevis] hypothetical protein LOC436741 [Danio rerio] hypothetical protein LOC436954 [Danio rerio] hypothetical protein LOC449552 [Danio rerio] hypothetical protein LOC494995 [Xenopus laevis] hypothetical protein LOC495253 [Xenopus laevis] hypothetical protein LOC496627 [Xenopus tropicalis] hypothetical protein LOC548683 [Xenopus tropicalis] hypothetical protein LOC550333 [Danio rerio] hypothetical protein LOC641421 [Danio rerio]

72
hypothetical protein LOC734647 [Xenopus laevis] hypothetical protein LOC767746 [Danio rerio] hypothetical protein LOC779096 [Xenopus laevis] hypothetical protein MGG_05095 [Magnaporthe grisea 70-15] hypothetical protein MtrDRAFT_AC149032g20v2 [Medicago truncatula] hypothetical protein OsI_002780 [Oryza sativa (indica cultivar-group)] hypothetical protein OsI_004782 [Oryza sativa (indica cultivar-group)] hypothetical protein PC301050.00.0 [Plasmodium chabaudi chabaudi] hypothetical protein Pfl_3860 [Pseudomonas fluorescens PfO-1] hypothetical protein PH0744 [Pyrococcus horikoshii OT3] hypothetical protein PMM1513 [Prochlorococcus marinus subsp. pastoris str. CCMP1986] hypothetical protein Ppro_1975 [Pelobacter propionicus DSM 2379] hypothetical protein PST_0570 [Pseudomonas stutzeri A1501] hypothetical protein RUMTOR_00917 [Ruminococcus torques ATCC 27756] hypothetical protein SareDRAFT_0666 [Salinispora arenicola CNS205] hypothetical protein Sbal195DRAFT_0316 [Shewanella baltica OS195] hypothetical protein SNOG_03450 [Phaeosphaeria nodorum SN15] hypothetical protein SNOG_14343 [Phaeosphaeria nodorum SN15] hypothetical protein SPAC18G6.03 [Schizosaccharomyces pombe 972h-] hypothetical protein Sputw3181_0469 [Shewanella sp. W3-18-1] hypothetical protein Tc00.1047053509601.30 [Trypanosoma cruzi strain CL Brener] hypothetical protein TTHERM_00145010 [Tetrahymena thermophila SB210] hypothetical protein TTHERM_00349000 [Tetrahymena thermophila SB210] hypothetical protein TVAG_346800 [Trichomonas vaginalis G3] hypothetical protein UM03791.1 [Ustilago maydis 521] hypothetical protein UM05511.1 [Ustilago maydis 521] hypothetical protein WH5701_07924 [Synechococcus sp. WH 5701] hypothetical protein, conserved [Leishmania braziliensis] ibosomal protein L1p [Plasmodium yoelii yoelii str. 17XNL] isocitrate dehydrogenase (NADP+) [Nicotiana tabacum] Isocitrate dehydrogenase 1 (NADP+), soluble [Homo sapiens] isocitrate dehydrogenase, NADP-dependent [Sphingopyxis alaskensis RB2256] K18, simple type I keratin [Oncorhynchus mykiss] keratin 15 [Danio rerio] keratin 18 [Danio rerio] Keratin, type I cytoskeletal 18 (Cytokeratin-18) (CK-18) (Keratin-18) (K18) lactate dehydrogenase-A [Epinephelus coioides] lactate dehydrogenase-A; NAD+:lactate oxidoreductase; LDH-A [Chromis punctipinnis] lamin b2 [Danio rerio] late histone L3 H2b [Strongylocentrotus purpuratus] lipoprotein [Sinorhizobium meliloti] L-lactate dehydrogenase A chain (LDH-A) L-lactate dehydrogenase A chain (LDH-A) LOC397850 protein [Xenopus laevis] M116.5 [Caenorhabditis elegans] Matrix protein methyl-accepting chemotaxis sensory transducer [Pseudoalteromonas atlantica T6c] methylenetetrahydrofolate dehydrogenase (NADP+ dependent) 1, methenyltetrahydrofolate cyclohydrolas Methyltransferase type 12 [Shewanella denitrificans OS217] methyltransferase, FkbM family protein [Campylobacter fetus subsp. fetus 82-40] MGC108369 protein [Xenopus tropicalis] MGC75629 protein [Xenopus tropicalis] MGC79035 protein [Xenopus laevis]

73
minichromosome maintenance complex component 7 [Mus musculus] mitochondrial isocitrate dehydrogenase 2-like [Oreochromis mossambicus] mitochondrial malate dehydrogenase 2, NAD [Tamandua tetradactyla] M-TAXREB107 [Mus musculus] mucin-associated surface protein (MASP) [Trypanosoma cruzi strain CL Brener] muscle actin [Lethenteron japonicum] myosin regulatory light chain [Scophthalmus maximus] myosin, heavy polypeptide 9, non-muscle [Homo sapiens] N-acetylneuraminate lyase subunit [Staphylococcus saprophyticus subsp. saprophyticus ATCC 15305] nascent polypeptide-associated complex (NAC) domain-containing protein [Arabidopsis thaliana] nascent polypeptide-associated complex alpha subunit [Homo sapiens] natural killer enhancing factor [Paralichthys olivaceus] natural killer enhancing factor [Scophthalmus maximus] NHP2 non-histone chromosome protein 2-like 1 [Danio rerio] NHP2 non-histone chromosome protein 2-like 1 [Ictalurus punctatus] Nonspecific lipid-transfer protein (Propanoyl-CoA C-acyltransferase) (NSL-TP) (Sterol carrier prote nucleolin 2 [Cyprinus carpio] nucleoside diphosphate kinase [Oreochromis mossambicus] Nucleoside diphosphate kinase [Prochlorococcus marinus str. MIT 9211] nucleotide-sugar transporter, putative [Aspergillus fumigatus Af293] omega class glutathione-S-transferase [Takifugu rubripes] Os01g0805900 [Oryza sativa (japonica cultivar-group)] P4hb-prov protein [Xenopus tropicalis] p68 RNA helicase [Xenopus laevis] P68-LIKE PROTEIN (DEAD BOX FAMILY OF RNA HELICASES) [Encephalitozoon cuniculi GB-M1] paREP2b [Pyrobaculum aerophilum str. IM2] PAS/PAC sensor signal transduction histidine kinase [Flavobacterium johnsoniae UW101] Peptidyl-prolyl cis-trans isomerase B1 precursor (PPIase B1) (Rotamase B1) peroxiredoxin 3 [Bos taurus] peroxiredoxin 4 [Bos taurus] phenylacetate-coenzyme A ligase [Desulfovibrio vulgaris subsp. vulgaris str. Hildenborough] phosphogluconate dehydrogenase [Mus musculus] Phosphoglycerate kinase [Rhodobacter sphaeroides ATCC 17025] phosphoglycerate mutase [Chelon labrosus] phosphoglycerate mutase 1 family [Acidovorax sp. JS42] phosphoglyceromutase [Bacteroides fragilis YCH46] P-II family protein [Chlorobium tepidum TLS] Pkm2 protein [Danio rerio] polyubiquitin [Fragaria x ananassa] PPAT5 [Hyaloperonospora parasitica] Precorrin-6y C5,15-methyltransferase, subunit CbiE [Sagittula stellata E-37] predicted protein [Ostreococcus lucimarinus CCE9901] PREDICTED: AHNAK nucleoprotein 2 [Pan troglodytes] PREDICTED: hypothetical protein [Gallus gallus] PREDICTED: hypothetical protein [Gallus gallus] PREDICTED: hypothetical protein [Monodelphis domestica] PREDICTED: hypothetical protein [Monodelphis domestica] PREDICTED: hypothetical protein [Monodelphis domestica] PREDICTED: similar to 40S ribosomal protein S10 [Macaca mulatta] PREDICTED: similar to 40S ribosomal protein S20 [Macaca mulatta]

74
PREDICTED: similar to 60 kDa heat shock protein, mitochondrial precursor (Hsp60) (60 kDa chaperonin PREDICTED: similar to 60S ribosomal protein L23a [Canis familiaris] PREDICTED: similar to 60S ribosomal protein L23a [Macaca mulatta] PREDICTED: similar to 60S ribosomal protein L32 [Canis familiaris] PREDICTED: similar to 60S ribosomal protein L35 [Bos taurus] PREDICTED: similar to actinin, partial [Danio rerio] PREDICTED: similar to Activator 1 140 kDa subunit (Replication factor C large subunit) (A1 140 kDa PREDICTED: similar to alpha-1 tubulin, partial [Strongylocentrotus purpuratus] PREDICTED: similar to alpha-2-macroglobulin isoform 1 [Bos taurus] PREDICTED: similar to CG16944-PA, isoform A [Tribolium castaneum] PREDICTED: similar to CG4046-PA [Tribolium castaneum] PREDICTED: similar to CG5826-PA [Tribolium castaneum] PREDICTED: similar to CG9277-PB, isoform B [Tribolium castaneum] PREDICTED: similar to dynein, cytoplasmic, heavy polypeptide 1 isoform 6 [Canis familiaris] PREDICTED: similar to expressed in non-metastatic cells 1, protein (NM23A) (nucleoside diphosphate PREDICTED: similar to Gsn protein isoform 1 [Danio rerio] PREDICTED: similar to H2A histone family, member Z [Mus musculus] PREDICTED: similar to Heat shock cognate 71 kDa protein (Heat shock 70 kDa protein 8) [Canis famili PREDICTED: similar to heat shock protein 84b [Monodelphis domestica] PREDICTED: similar to heat shock protein protein [Strongylocentrotus purpuratus] PREDICTED: similar to histone 1, H2ai (predicted) isoform 1 [Canis familiaris] PREDICTED: similar to histone H2b-616 [Bos taurus] PREDICTED: similar to hoip-prov protein [Strongylocentrotus purpuratus] PREDICTED: similar to Keratin, type I cytoskeletal 18 (Cytokeratin 18) (K18) (CK 18) [Canis familiaris] PREDICTED: similar to KIAA0152, [Danio rerio] PREDICTED: similar to KIAA1641 protein isoform 6 [Pan troglodytes] PREDICTED: similar to LOC494641 protein [Strongylocentrotus purpuratus] PREDICTED: similar to Myelin P2 protein [Gallus gallus] PREDICTED: similar to nonmuscle myosin heavy chain [Danio rerio] PREDICTED: similar to OTTHUMP00000028706 [Danio rerio] PREDICTED: similar to OTTHUMP00000028706, partial [Danio rerio] PREDICTED: similar to PLC alpha [Monodelphis domestica] PREDICTED: similar to Probable leucyl-tRNA synthetase, mitochondrial precursor (Leucine--tRNA ligas PREDICTED: similar to ribosomal protein isoform 1 [Pan troglodytes] PREDICTED: similar to ribosomal protein S15a [Rattus norvegicus] PREDICTED: similar to ribosomal protein S2 [Macaca mulatta] PREDICTED: similar to ribosomal protein S27a [Mus musculus] PREDICTED: similar to SMT3 suppressor of mif two 3 homolog 2 isoform 1 [Rattus norvegicus] PREDICTED: similar to solute carrier family 14 (urea transporter), member 1 [Canis familiaris] PREDICTED: similar to squamous cell carcinoma antigen recognized by T cells 3 [Apis mellifera] PREDICTED: similar to Thioredoxin-dependent peroxide reductase, mitochondrial precursor (Peroxiredo PREDICTED: similar to tubulin alpha 6 [Danio rerio] PREDICTED: similar to Tubulin alpha-1 chain [Tribolium castaneum] PREDICTED: similar to Tubulin alpha-2 chain (Alpha-tubulin 2) [Canis familiaris] PREDICTED: similar to Tubulin beta-6 chain (Beta-tubulin class-VI) [Danio rerio]
75
PREDICTED: similar to ubiquitin A-52 residue ribosomal protein fusion product 1 isoform 1 [Mus musc probable acyl-CoA dehydrogenase [Cellulophaga sp. MED134] probable serine/threonine protein kinase [Rhodopirellula baltica SH 1] probableacetyltransferase/hydrolase [delta proteobacterium MLMS-1] procollagen, type IV, alpha 1, isoform CRA_a [Rattus norvegicus] Proliferating cell nuclear antigen (PCNA) (Cyclin) proliferating cell nuclear antigen [Bombyx mori] proliferation-associated 2G4, a [Danio rerio] protease, serine, 3 [Mus musculus] proteasome (prosome, macropain) subunit, alpha type 1 [Rattus norvegicus] proteasome (prosome, macropain) subunit, beta type, 3 [Danio rerio] proteasome 26S non-ATPase subunit 11 [Homo sapiens] proteasome alpha 3 subunit isoform 1 [Homo sapiens] proteasome beta 1 subunit [Homo sapiens] protein disulfide isomerase-related protein (provisional) [Danio rerio] protein disulfide-isomerase (EC 5.3.4.1) precursor - Caenorhabditis elegans (fragment) protein disulfide-isomerase [Ictalurus punctatus] protein Y6B3B.8 [imported] - Caenorhabditis elegans putative Aspartyl-tRNA synthetase [Oryza sativa (japonica cultivar-group)] putative DNA mismatch repair protein [Vibrio cholerae B33] putative eukaryotic translation initiation factor 4A [Silene latifolia] putative head-tail adaptor [Escherichia coli O157:H7 str. Sakai] putative primase [Lactococcus bacteriophage phi31] putative response regulator [marine gamma proteobacterium HTCC2207] putative ribosomal protein L7 protein [Oncorhynchus mykiss] putative signal peptide protein [Ralstonia pickettii 12J] putative TonB-dependent outer membrane receptor protein [Bacteroides fragilis NCTC 9343] putative transient receptor protein 2 [Pagrus major] Putative transposase, mutator type [Burkholderia xenovorans LB400] quail calpain [Coturnix coturnix] RAB18, member RAS oncogene family [Homo sapiens] RAB18, member RAS oncogene family variant [Homo sapiens] ras-related GTP-binding protein RAB10 [Canis lupus familiaris] Ras-related protein ORAB-1 rCG64140 [Rattus norvegicus] Rho GTPase [Dictyostelium discoideum AX4] ribosomal protein homologous to yeast S24 [Homo sapiens] Ribosomal protein L10a [Danio rerio] ribosomal protein L11 [Branchiostoma belcheri] ribosomal protein L11 [Mus musculus] ribosomal protein L13 [Branchiostoma lanceolatum] ribosomal protein L13a [Danio rerio] ribosomal protein L14 - human ribosomal protein L17 [Homo sapiens] ribosomal protein L19 [Xenopus laevis] ribosomal protein L21 [Siniperca chuatsi] ribosomal protein L23 [Canis lupus familiaris] ribosomal protein L27a [Plasmodium yoelii yoelii str. 17XNL] ribosomal protein L34 [Branchiostoma belcheri tsingtaunese] ribosomal protein L36 [Gallus gallus] ribosomal protein L4 [Pagrus major] ribosomal protein L5 [Mus musculus] Ribosomal protein L6 [Canis familiaris]

76
Ribosomal protein L6 [Danio rerio] ribosomal protein L7 [Oryzias latipes] ribosomal protein Large P0 [Protopterus dolloi] ribosomal protein S13 [Xenopus tropicalis] ribosomal protein S14 [Rattus norvegicus] ribosomal protein S20 [Solea senegalensis] Ribosomal protein S20 CG15693-PA [Drosophila melanogaster] ribosomal protein S27 [Homo sapiens] ribosomal protein S29 [Danio rerio] ribosomal protein S3 [Danio rerio] ribosomal protein S3 [Moniliophthora perniciosa] ribosomal protein S4, X-linked [Monodelphis domestica] ribosomal protein S8 [Gillichthys mirabilis] ribosomal protein S8 [Protopterus dolloi] ribosomal protein S9 [Homo sapiens] ribosomal protein S9 [Plutella xylostella] ribosomal protein, large, P0 [Danio rerio] RNA binding protein p37 AUF1 [Rattus norvegicus] rpL14 protein [Takifugu rubripes] RPS28 (RIBOSOMAL PROTEIN S28); structural constituent of ribosome [Arabidopsis thaliana] rs23 protein [Ciona intestinalis] S11 ribosomal protein [Sparus aurata] S14e ribosomal protein-like protein [Philodina sp. NPS-2005] S-adenosyl-L-homocysteine hydrolase [Blastopirellula marina DSM 3645] S-adenosyl-L-homocysteine hydrolase [Prosthecochloris aestuarii DSM 271] SEC22 vesicle trafficking protein-like 1 [Mus musculus] Serum albumin precursor (Allergen Bos d 6) (BSA) SET translocation [Mus musculus] signal transduction histidine kinase, nitrate/nitrite-specific, NarQ [Methylobacillus flagellatus KT] similar to alpha-Tubulin at 84B [Xenopus laevis] simple type II keratin K8b (S2) [Oncorhynchus mykiss] SMT3 supressor of mif two 3 homolog 2 [Mus musculus] Sodium/potassium-transporting ATPase alpha-3 chain (Sodium pump 3) (Na(+)/K(+) ATPase 3) (Alpha(III solute carrier family 25, member 5 [Mus musculus] SSR gamma subunit [Rattus norvegicus] stratifin [Homo sapiens] stress protein HSC70 [Xiphophorus maculatus] suppressor [Xenopus laevis] t-complex polypeptide 1 chaperonin delta chain - Japanese pufferfish t-complex protein 4a - bovine (fragments) Temporarily Assigned Gene name family member (tag-210) [Caenorhabditis elegans] tetra-ubiquitin [Saccharum hybrid cultivar H32-8560] Tln1 protein [Danio rerio] TPA: TPA_inf: HDC03427 [Drosophila melanogaster] TPR repeat [Delftia acidovorans SPH-1] Transcriptional regulator, MarR/EmrR family [Clostridium acetobutylicum ATCC 824] transfer RNA-Ala synthetase [Bombyx mori] translation elongation factor 2 [Spodoptera exigua] transporter, NRAMP family protein [Flavobacteriales bacterium HTCC2170] transposase [Oceanicola batsensis HTCC2597] triose phosphate isomerase [Polypterus ornatipinnis] triose-phosphate isomerase [Cyanidioschyzon merolae]
77
triosephosphate isomerase [Saccoglossus kowalevskii] triosephosphate isomerase B [Xiphophorus maculatus] tropomyosin [Fundulus heteroclitus] tropomyosin 2, beta [Mus musculus] tropomyosin4-1 [Takifugu rubripes] troponin C-like protein Try10-like trypsinogen [Mus musculus] trypsin (EC 3.4.21.4) precursor - bovine TUA1 (ALPHA-1 TUBULIN) [Arabidopsis thaliana] tubulin [Geodia cydonium] tubulin alpha 6 [Danio rerio] Tubulin alpha chain tubulin beta chain - rat (fragments) Tubulin beta chain (Beta tubulin) Tubulin beta-2 chain (Beta-tubulin 2) tubulin, alpha 4, isoform CRA_b [Homo sapiens] tubulin, alpha 4b [Xenopus tropicalis] tubulin, alpha 8 [Gallus gallus] tubulin, alpha 8 like 3 [Danio rerio] tubulin, beta 2a [Xenopus tropicalis] Tubulin, beta 2C [Homo sapiens] Tubulin, Beta family member (tbb-4) [Caenorhabditis elegans] type 2 actin [Pleurochrysis carterae] type II keratin E3 [Oncorhynchus mykiss] type II keratin subunit protein ubiquitin ubiquitin ubiquitin [Scyliorhinus torazame] Ubiquitin family protein [Tetrahymena thermophila SB210] ubiquitin/actin fusion protein [Gymnochlora stellata] ubiquitin/actin fusion protein 2 [Bigelowiella natans] ubiquitin-activating enzyme E1 (A1S9T and BN75 temperature sensitivity complementing) [Danio rerio] ubiquitin-like protein fubi and ribosomal protein S30 precursor [Homo sapiens] ubiquitin-like protein Ublp94.4 [Acanthamoeba castellanii] ubquitin/ribosomal protein S27Ae fusion protein [Curculio glandium] Unknown (protein for MGC:160678) [Xenopus laevis] Unknown (protein for MGC:82390) [Xenopus laevis] unknown [Homo sapiens] unknown [Schistosoma japonicum] unknown [Trichinella spiralis] unknown protein encoded by prophage CP-933K [Escherichia coli UTI89] unnamed protein product [Candida glabrata] unnamed protein product [Candida glabrata] unnamed protein product [Homo sapiens] unnamed protein product [Homo sapiens] unnamed protein product [Macaca fascicularis] unnamed protein product [Macaca fascicularis] unnamed protein product [Mus musculus] unnamed protein product [Mus musculus] unnamed protein product [Mus musculus] unnamed protein product [Tetraodon nigroviridis] unnamed protein product [Tetraodon nigroviridis] unnamed protein product [Tetraodon nigroviridis]

78
unnamed protein product [Tetraodon nigroviridis] unnamed protein product [Tetraodon nigroviridis] unnamed protein product [Tetraodon nigroviridis] unnamed protein product [Tetraodon nigroviridis] unnamed protein product [Tetraodon nigroviridis] unnamed protein product [Tetraodon nigroviridis] unnamed protein product [Tetraodon nigroviridis] unnamed protein product [Tetraodon nigroviridis] unnamed protein product [Tetraodon nigroviridis] unnamed protein product [Tetraodon nigroviridis] unnamed protein product [Tetraodon nigroviridis] unnamed protein product [Tetraodon nigroviridis] unnamed protein product [Tetraodon nigroviridis] unnamed protein product [Tetraodon nigroviridis] unnamed protein product [Tetraodon nigroviridis] unnamed protein product [Tetraodon nigroviridis] unnamed protein product [Tetraodon nigroviridis] unnamed protein product [Tetraodon nigroviridis] unnamed protein product [Tetraodon nigroviridis] unnamed protein product [Tetraodon nigroviridis] unnamed protein product [Tetraodon nigroviridis] unnamed protein product [Tetraodon nigroviridis] unnamed protein product [Tetraodon nigroviridis] unnamed protein product [Tetraodon nigroviridis] unnamed protein product [Tetraodon nigroviridis] unnamed protein product [Tetraodon nigroviridis] unnamed protein product [Tetraodon nigroviridis] unnamed protein product [Tetraodon nigroviridis] unnamed protein product [Tetraodon nigroviridis] unnamed protein product [Tetraodon nigroviridis] unnamed protein product [Tetraodon nigroviridis] unnamed protein product [Tetraodon nigroviridis] unnamed protein product [Tetraodon nigroviridis] unnamed protein product [Tetraodon nigroviridis] unnamed protein product [Tetraodon nigroviridis] unnamed protein product [Tetraodon nigroviridis] unnamed protein product [Tetraodon nigroviridis] unnamed protein product [Tetraodon nigroviridis] unnamed protein product [Tetraodon nigroviridis] unnamed protein product [Tetraodon nigroviridis] unnamed protein product [Tetraodon nigroviridis] unnamed protein product [Tetraodon nigroviridis] unnamed protein product [Tetraodon nigroviridis] unnamed protein product [Tetraodon nigroviridis] unnamed protein product [Tetraodon nigroviridis] unnamed protein product [Tetraodon nigroviridis] unnamed protein product [Tetraodon nigroviridis] unnamed protein product [Tetraodon nigroviridis] unnamed protein product [Tetraodon nigroviridis] unnamed protein product [Tetraodon nigroviridis] unnamed protein product [Tetraodon nigroviridis] unnamed protein product [Tetraodon nigroviridis] unnamed protein product [Tetraodon nigroviridis] unnamed protein product [Tetraodon nigroviridis]
79
unnamed protein product [Tetraodon nigroviridis] unnamed protein product [Tetraodon nigroviridis] unnamed protein product [Tetraodon nigroviridis] unnamed protein product [Tetraodon nigroviridis] unnamed protein product [Tetraodon nigroviridis] unnamed protein product [Tetraodon nigroviridis] unnamed protein product [Tetraodon nigroviridis] uracil-DNA glycosylase [Borrelia burgdorferi B31] UvrD/REP helicase [uncultured Prochlorococcus marinus clone ASNC2150] valosin containing protein [Danio rerio] vf14-3-3c protein [Vicia faba] V-Fos transformation effector [Scophthalmus maximus] vitronectin precursor [Homo sapiens] voltage-dependent anion channel [Paralichthys olivaceus] voltage-dependent anion channel 2 [Gallus gallus] YlACT1 [Yarrowia lipolytica] Zgc:112271 protein [Danio rerio]
Zgc:153867 protein [Danio rerio]

80
Table 3.6 Primers for the 11 newly identified viral proteins
ORFs Left primer Right primer
ORF049L ATGTACGTAT ACCCCGCAAT TCATTTTTTT TGCCTAACTC C ORF099R ATGCCCGTAT CAGATAAAGA TCATCTTTCA CAATTGGACA ORF107R ATGCAACGTT CCATAAATTT G TTACATGGCA GACTGCGCG ORF111R ATGGTGAATG AAATGTATAC A CTATAAAAGC GGGATGTTAA ORF118R ATGACCAGCC GGCGTTTC CTAAGCGAAT CCGAGCGTT ORF127R ATGTTAACCG CAATTGTAAC TTATTCGTTA AACGAATATC T ORF135L ATGGAAGAAC TCGTACAAGC TTACGGTTCC GGCGTCTT ORF136R ATGTACCCTG TATTGAAAAG TTATACAATT TTATAAACGG C ORF140R ATGTCAGAAT TTAGGGGTCA CTACGCTTTT TTATCCGCT ORF155R ATGGCACTAT TGATATCTAT TTACTCGCAA CTATCAATCA ORF162L ATGGCTTTCG TCACAGACAA TCACTCTTCT TCGTCGGGAA AC

81
Chapter Four
A novel SGIV-coding protein ORF158 is involved
in the regulation of K79 methylation of histone
H3

82
4.1 Sumarry
ORF158L, one of the 162 open reading frames (ORFs) predicted from the SGIV
genome, is a functionally unknown gene. In this chapter, we report that: ORF158L (i)
encodes a full length protein (~16Kd); (ii) is not essential for SGIV replication in cell
culture; (iii) is not engaged in the transcriptional regulation of SGIV gene expression
in cell culture; (iv) does not affect viral protein translation; (v) is highly accumulated
in the host nucleus and viral assembly center; (vi) is co-localized with histone H3 of
the host cells; (vii) is involved in the regulation of lysine 79 methylation of host
histone H3.

83
4.2 Introduction
Singapore Grouper Iridovirus (SGIV), an iridovirus of the ranavirus genus, was
isolated from brown-spotted grouper in 1998 after they caused significant economic
losses in Singapore marine net cage farms in 1994 (Chua et al., 1994; Qin et al.,
2001). In 2004, the genome of SGIV was sequenced, 162 Open Reading Frames
(ORFs) were predicted based on the 140,131 base pair length viral genome, and 26
SGIV proteins were identified (Song et al., 2004). Two years later, in 2006, additional
25 SGIV viral proteins were reported by proteomics methods (Song et al., 2006).
Although the proteins of 51 ORFs out of the 162 ORFs are reported, the translational
products of the remaining 117 ORFs are unknown (Song et al., 2004; Song et al.,
2006). Recently, Chen and coworkers reported that 127 ORFs of SGIV were
transcriptionally active (Chen et al., 2006). ORF158L was one of the 162 ORFs
predicted in the SGIV genome. Although ORF158L was reported to be
transcriptionally active and was classified as one of the SGIV early genes, the
translational product and function of the ORF158L remain unknown (Chen et al.,
2006). The present study aims to elucidate the biological function of the ORF158L
encoded protein.
4.3 Materials and Methods
4.3.1 Cell and virus infection
Protocols for cell and virus infection were described earlier in Chapter 2.
4.3.2 Antibodies
The ORF158L gene was PCR amplified and cloned into pET-15b (Novagen). The
recombinant protein was over expressed at 18 °C overnight with 0.1mM IPTG by
using a BL21 strain (DE3; Novagen). The recombinant protein was first purified by
using a Ni-NTA column (Qiagen) and was further purified by gel filtration

84
chromatography using a Superdex 75 column (Amersham). The purified protein was
used for generation of monoclonal antibodies. Monoclonal antibodies against beta
actin, polyclonal antibodies against histone H3 and K79 monomethylated histone H3
were purchased from ABCAM.
4.3.3 Knockdown of ORF158L
Morpholinos sequence against ORF158L (158_MO) is
5'-AGTTTGCTACGATGGCCCACCCCAT-3'. Control MO (Ctr_MO) sequence is
5'-CCTCTTACCTCAGTTACAATTTATA-3'. MOs were delivered into GEC cells
by electrophoresis using Nucleofactor (Amaxa). Forty hours after transfection, 5 MOI
SGIV were added into the cells. And the samples were harvested at 48h p.i. for further
investigations.
4.3.4 Electron Microscopy
The embryonic cells were fixed in 2.5% glutaraldehyde, 2% paraformaldehyde-PBS,
postfixed with 1% osmium tetroxide, followed by dehydration and infiltration. The
samples were sliced into ultra thin sections and stained with 2% uranyl acetate and
1% lead citrate. The samples were examined with a Philips CM10 electron
microscopy at 100 kv.
4.3.5 DNA Microarray and Real Time RT PCR
The methods for DNA Microarray and real time RT-PCR were described in chapter 2.
4.3.6 Immunofluorescence
Cells either treated or untreated with SGIV and morpholinos were cultured in Lab-
Tek® II CC2™ Chamber Slide™ (Nalge). In the case of SGIV infection, 5MOI SGIV
were used and the cells were investigated 48h p.i. later. The procedure of immunolabeling
is described next: first, the cells were washed with 1 × PBS; followed by the addition of
fixation buffer (3% w/v) and 100% methanol (pre-cooled at -20°C) and subsequently

85
the samples were washed with 1 × PBS; after adding blocking buffer (1% BSA, 1 ×
PBS), samples were incubated with antibodies. 1 hour later, the samples were washed
with 1 × PBS, followed by incubation with Alexa Fluor probes (Invitrogen) for 1 hour;
subsequently, trihydrochloride (Invitrogen) was added to samples and the samples
were washed with 1 × PBS. The chamber was removed and the sample was sealed
with cover slides. Finally, the samples were observed using Olympus Fluoview
FV500.
4.4 Results
4.4.1 Western blot against ORF158L When 158 mAbs was used to do western blots,
no protein could be detected in the SGIV mock-infected cell lysate (Fig 4.1. A.
Middle lane) and only one protein band was detected in the SGIV-infected cell lysate
(Fig 4.1. A. First lane). The ORF158L expressed in SGIV-infected cells was the same
molecular size as the tag-removed recombinant ORF158L proteins expressed in E.
coli (Fig 4.1. A. First lane and third lane). This study demonstrated that ORF158L
encoded a full length viral protein upon infection.
4.4.2 Knockdown of ORF158L Fig 4.1. B shows no detectable ORF158L in the
158_MO treated GEC with SGIV-infected when compared to the ORF158L in the
CTR_MO treated GEC with SGIV-infected (Fig 4.1. B).This evidence shows that
ORF158L was efficiently knocked down by anti-ORF158 MO (i.e. 158_MO).
Under EM, there was minimal alteration of virus assembly, the morphology of mature
SGIV particles did not change and the budding of SGIV particles was normal when
ORF158L was knocked down (Fig 4.1. C).
4.4.3 DNA Microarray and Real time RT-PCR investigation of transcriptomes of
viral genes when ORF158Lwas knocked down There was no obvious variation in
viral transcription upon ORF158L knockdown (Fig 4.2. A). Real time RT PCR results

86
of 7 ORFs were consistent with DNA microarray data showing that the transcription
of viral genes was not significantly affected when we knocked down ORF158L (Fig
4.2. B&C).
4.4.4 Subcellular localization of ORF158L and ORF158L & Histone H3
colocalization At late SGIV-infected stage (i.e. 48h p.i.), the morphology of nucleus
of host cells (i.e. GECs) was significantly altered (Fig 4.3.). The inter chromosome
spaces in host nucleus were dramatically increased at the late stage of SGIV-infected
and ORF158L accumulated in the host nuclear and viral assembly center (Fig 4.3). In
the 158_MO treated cells, no fluorescent signals corresponding to ORF158L were
detected (Fig 4.3. N). This phenomenon confirmed that ORF158L was successfully
knocked down.
Furthermore, the colocalization of ORF158L and histone H3 at host cell nucleus was
observed using immunofluorecence (Fig 4.4).
4.4.5 iTRAQ study of the effect of ORF158L knockdown at proteome scale
iTRAQ data identified 51 viral proteins and all these viral proteins were not
significantly changed when we knocked down ORF158L during SGIV-infection (Fig
4.7). Given the unknown nature of the host genome, only 700 plus host proteins were
identified from the iTRAQ data and most of the identified host proteins were not
notably changed when we knocked down ORF158L during SGIV infection compared
to those without ORF158L knockdown during SGIV infection (Data not shown).
4.4.6 ORF158L is involved in Histone H3 lysine 79 (K79) methylation regulation
iTRAQ data showed that host histone H3 were up-regulated when we knocked down
ORF158L during SGIV-infection (Figure 4.5). To validate this finding, we carried out
western blot against histone H3 by using the commercial polyclonal antibodies
against histone H3 . Surprisingly, the total histone H3 was not up-regulated when we

87
knocked down ORF158L during SGIV-infection (Figure 4.6). Because we did not
include any kind of post translational modification when we analyzed the iTRAQ data,
the iTRAQ data only showed that the non modified form of histone H3 was down-
regulated upon SGIV infection. Given that total histone H3 did not change when we
knocked down ORF158L during SGIV infection, we suspected that the modified form
of histone H3 might be down-regulated. Histone H3 can undergo many kinds of post
translational modifications, such as methylation, acetylation, and phosphorylation. To
determine what kind of modification could account for the findings presented above,
we reexamined the iTRAQ raw data, and found that the peptide “EIAQDFKTDLR”
of histone H3 was the only peptide identified from iTRAQ analysis and the non
modified form of this histone H3 peptide was up-regulated when we knocked down
ORF158L during SGIV infection. This histone H3 peptide sequence
“EIAQDFKTDLR” contains a lysine (i.e. K), which is referred as K79 in histone H3 ,
and this K79 can undergo methylation. We proposed that K79 methylated form of
histone H3 could be down-regulated. A combination of up regulation of the K79
methylation form of histone H3 and down-regulation of K79 non-methylated histone
H3 would make the total histone H3 unchanged. To test this hypothesis, we carried
out western blots against K79 methylated histone H3 by using the specific polyclonal
antibodies against K79 methylation form of histone H3. The results are shown in
Figure 4.6. The first panel shows that the K79 methylation form of histone H3 was
up-regulated upon SGIV-infected and down-regulated when we knocked down
ORF158L during SGIV infection; the second panel shows that total histone H3 was
not changed; the third panel shows that ORF158L was successfully knocked down;
the bottom panel shows beta actin, which was used as controls, were not changed
(Figure 4.6). By combining the iTRAQ and western blot data, we can conclude that
88
K79 monomethylation of histone H3 was up-regulated when GECs were infected by
SGIV. When ORF158L was knocked down in SGIV-infected GECs, the K79
monomethylation of histone H3 was down-regulated compared to those SGIV-
infected GECs without ORF158L knockdown (Figure 4.6).
4.5 Discussion
A total of 12 iridovirus genomes including SGIV has been sequenced (Tidona and
Darai, 1997; He et al., 2001; Jakob et al., 2001; He et al., 2002; Jancovich et al.,
2003; Do et al., 2004; Tan et al., 2004; Zhang et al., 2004; Song et al., 2004; Tsai et
al., 2005; Lu et al., 2005; Delhon et al., 2006). Genomic annotations have predicted a
number of ORFs based on the genomic sequences. In SGIV, a total of 162 ORFs was
predicted on the basis of the viral genomic sequence, and only 23 are highly
homologous to other iridovirus proteins with specific biological functions (Song et al.,
2004). To date, only 45 viral proteins out of the 162 ORFs have been detected at the
protein level using mass spectrometry (Song et al., 2004; Song et al., 2006). Recently,
127 ORFs out of the 162 ORFs have been characterized at the transcriptional level
and are classified into three groups (i.e. immediate early, early and late genes) (Chen
et al., 2006). Although ORF158L has been classified to be an early gene, the
corresponding proteins and its functions remain unknown (Chen et al., 2006). In this
study, we found that ORF158L was involved in the regulation of histone H3 K79
methylation.
Besides methylation, histone H3 can be acetylated and phosphorylated, and these
modifications affect gene expression (Zhang and Reinberg, 2001; Lacoste et al., 2003;
Li et al., 2007). The different modifications of histone H3 , including acetylation,
phosphorylation, and methylation, have different functions. For example, acetylations
of histone H3 are generally related to transcriptional activation, while, methylations of
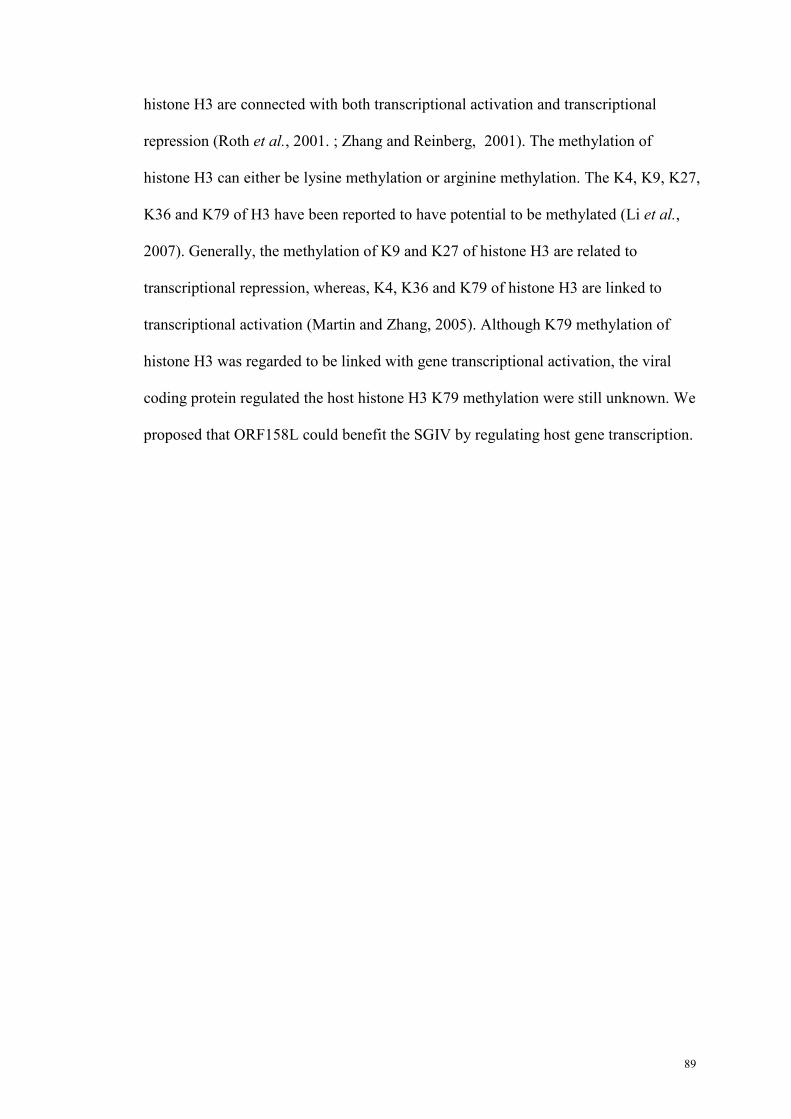
89
histone H3 are connected with both transcriptional activation and transcriptional
repression (Roth et al., 2001. ; Zhang and Reinberg, 2001). The methylation of
histone H3 can either be lysine methylation or arginine methylation. The K4, K9, K27,
K36 and K79 of H3 have been reported to have potential to be methylated (Li et al.,
2007). Generally, the methylation of K9 and K27 of histone H3 are related to
transcriptional repression, whereas, K4, K36 and K79 of histone H3 are linked to
transcriptional activation (Martin and Zhang, 2005). Although K79 methylation of
histone H3 was regarded to be linked with gene transcriptional activation, the viral
coding protein regulated the host histone H3 K79 methylation were still unknown. We
proposed that ORF158L could benefit the SGIV by regulating host gene transcription.

90
Figure 4.1 Identification and knockdown of ORF158L in cell culture. A.) Upper panel
is western blot by using monoclonal antibodies against ORF158L. Lower panel is
western blot by using beta actin monoclonal antibodies. First lane is the cell lysate of
GECs which are 48 hours post infection with 5MOI SGIV. Second lane is the cell
lysate of mock SGIV-infected GECs. Third lane is the purified ORF158L protein with
his-tag cleaved by thrombin. B.) First lane is the cell lysate of anti 158 morpholinos
(158_MO) treated GECs which are 48 hours post infection with 5MOI SGIV. Second
lane is the cell lysate of control morpholinos (Ctr_MO) treated GECs which are 48
hours post infection with 5MOI SGIV. C.) Left is the EM picture of a section of
158_MO treated GECs which are 48 hours post infection with 5MOI SGIV. Right is
the EM picture of a section of Ctr_MO treated GECs which are 48 hours post
infection with 5MOI SGIV. ‘ ’ points to mature SGIV particles.

91
0
5000
10000
15000
20000
ORF009L ORF033L ORF041L ORF049L ORF051L ORF120L ORF155R
Signal Intensity
CTR_MO
158_MO
0
0.5
1
1.5
2
ORF009L ORF033L ORF041L ORF049L ORF051L ORF120L ORF155R
2-∆∆Ct
Ctr_MO_2-∆∆Ct
158_MO_2-∆∆Ct
B
C
Figure 4.2 A comparison of transcriptional profiles of SGIV with and without
ORF158L knock down. A.) X axis is the DNA microarray data of Control
morpholinos (Ctr_MO) treated GECs which are 48 hours post infection with 5MOI
SGIV normalized to beta actin. Y axis is the DNA microarray data of anti 158
morpholinos (158_MO) treated GECs which are 48 hours post infection with 5MOI
SGIV normalized to beta actin. B.) Fold changes between 158_MO treated and
Ctr_MO treated DNA microarray data of random selected ORFs. X axis lists the
random selected ORFs.Y axis is the fold changes of selected ORFs when we
compared the normalized DNA microarray data of 158_MO to Ctr_MO. C.) The
investigations of the fold changes between 158_MO treated and Ctr_MO treated
samples of random selected ORFs in Figure 2 B by Real time RT-PCR.

92
Figure 4.3 Subcellular localization of ORF158L. Blue colors represent DAPI staining ds DNA.
Green color represents the ORF158L.

93
Figure 4.4. The co localization study between ORF158L and histone H3.
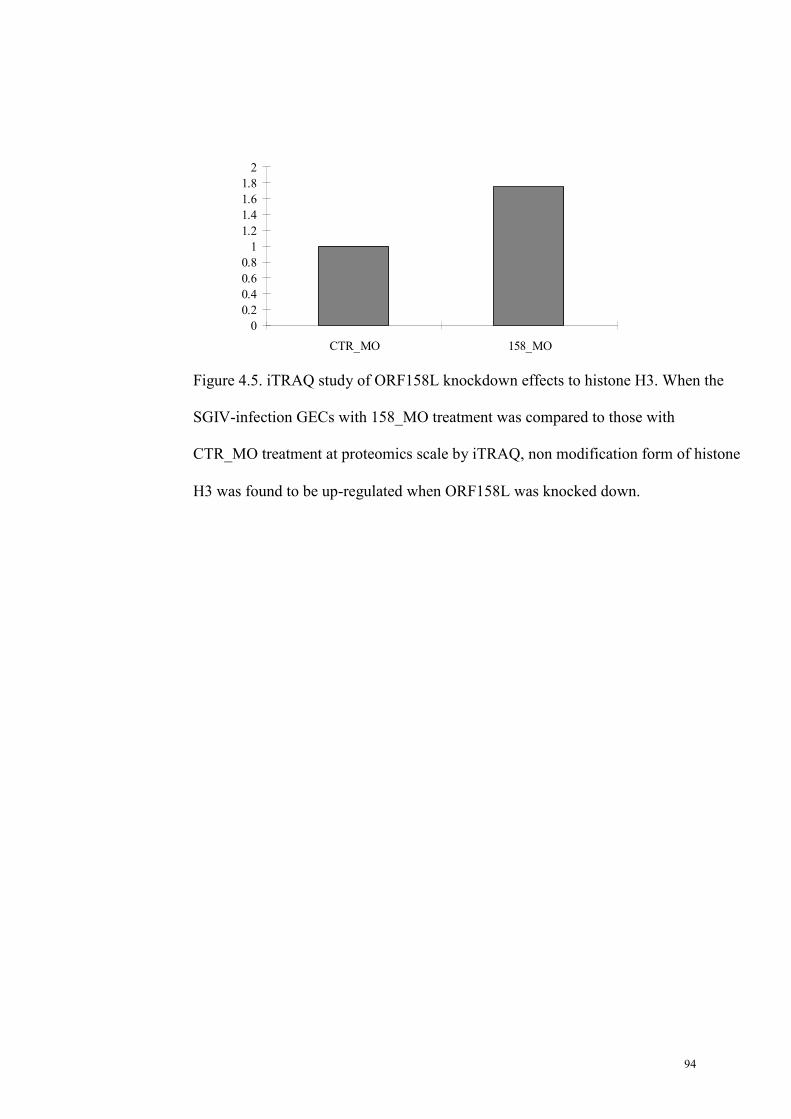
94
00.20.40.60.81
1.21.41.61.82
CTR_MO 158_MO
Figure 4.5. iTRAQ study of ORF158L knockdown effects to histone H3. When the
SGIV-infection GECs with 158_MO treatment was compared to those with
CTR_MO treatment at proteomics scale by iTRAQ, non modification form of histone
H3 was found to be up-regulated when ORF158L was knocked down.

95
Figure 4.6. Western blot of histone H3 modification. First lane represents SGIV mock-
infected GEC; second lane represents SGIV-infected GEC; third lane represents SGIV-
infected GEC with CTR_MO treatment; fourth lane represents SGIV-infection GEC with
158_MO treatment. First panel represents K79 monomethylation form of histone 3; second
panel represents histone 3; third panel represents ORF158L; fourth panel represents beta
actin.

96
0 0.5 1 1.5 2
ORF162LORF156LORF155RORF151LORF140RORF136RORF135LORF127RORF125RORF124RORF119RORF118RORF111RORF107RORF102LORF101RORF099RORF098RORF093LORF090LORF088LORF086RORF084LORF082LORF081LORF075RORF072RORF069LORF067LORF057LORF056RORF055RORF049LORF046LORF045LORF043RORF039LORF038LORF026RORF025LORF022LORF019RORF018RORF016LORF015LORF012LORF008LORF007LORF006R
Fold changes (158_MO/CTR_MO)
Figure 4.7. iTRAQ study of ORF158L knockdown effects in SGIV-infected GECs. Viral protein
comparison between SGIV-infection GECs with 158_MO treatment and those with CTR_MO
treatment at proteomic scale by iTRAQ shows that the synthesis of viral proteins were not inhibited
when ORF158L was knock down during SGIV-infection of GECs.

97
Chapter Five
Structural study of ORF158L-coded protein

98
5.1 Summary & Introduction
The functional studies show that ORF158L is involved in the regulation of host
histone H3 K79 methylation. In this chapter, we report the structural study of
ORF158L. After we failed to solve the structure of ORF158L by NMR, we solved the
structure of ORF158L by X-ray crystallography at 1.8 Å resolution. The structure of
ORF158L is highly similar to ASF1, which is an anti-silencing factor involved in
nucleosome assembly. We also verified that ORF158L can bind to H3 & H4 complex
with sub-micromolar binding affinity using SPR.

99
5.2 Materials and Methods
5.2.1 Construction of the expression plasmid
Full length DNA coding sequence of ORF158L, which coded 138 amino acids, was
amplified by PCR from the SGIV genome and the PCR products were further cloned
into the pET-15b vector. The sequence was verified by DNA sequencing. The
resulting construct was transformed into DE3-star strain for protein expression.
5.2.2 Expression and purification of ORF158L
Large scale expression of ORF158L was done by the following procedure: the
transformed cells were cultured in LB with 100µg/ml of ampicillin; 0.2mM IPTG was
added when OD600 value of cells reached 1.0; ORF158L was induced to overexpress
by culturing the cells at 18°C over night. The gene product of ORF158L was purified
under native conditions by Ni-NTA chromatography (Qiagen) and his-tag was
cleaved by thrombin. The elutes from Ni-NTA column were further purified by
SuperdexTM 75, followed by mono Q ion exchange chromatography.
5.2.3 Mass spectrometry analysis
Purified ORF158L was subjected to MALDI-TOF mass spectrometry to verify its
molecular mass.
5.2.4 Dynamic light scattering (DLS) study
In order to assess the homogeneity of ORF158L, the purified protein was
characterized using DLS with Dynapro instrument (Protein Solutions Inc). The data
were analyzed by using Dynamics 5.0 (Moradian-Oldak, 1998 ).
5.2.5 Circular dichroism (CD) study
The secondary structure of ORF158L was characterized by CD. ORF158L was
prepared in 10-20 mM sodium phosphate buffer, pH6.8. The experiment was

100
conducted in the far UV range (190-260 nm) with Jasco spectropolarimeter J-720 at
25°C.
5.2.6 NMR sample preparation
15N and 15N/13C-labeled ORF158L were prepared in M9 medium with the addition of
(15NH4)2SO4 for 15N labeling and (15NH4)2SO4 and [
13C] glucose for 15N/13C double
labeling, respectively. Samples for NMR spectroscopy were concentrated to 0.5 mM
in the buffer which contained 20 mM sodium phosphate buffer with pH6.6, 1 mM
Mg2Cl2, 5 mM 2-ME, 150 mM NaCl. Finally, 450 µl of protein solution was mixed
with 50µl of D2O (final concentration is 10%) and transferred to an NMR tube
(Cambridge Isotope Laboratories, Inc.). All samples were examined by 15% SDS-
PAGE after purification.
5.2.7 NMR Experiments and data processing.
All NMR spectra were acquired at 298K on a Bruker 800MHz spectrometer. All
NMR data were processed with NMRPipe (Delaglio 1995.) and analyzed with
NMRview (Johnson 1994.). Structure calculation could be performed with the
program CYANA (Herrmann 2002.) and the phi and psi angle constraints could be
generated from TALOS program (Cornilescu 1999). Ten conformers with the lowest
final values of the CYANA target function could be chosen to represent the most
probable structures.
5.2.8 SeMet ORF158L preparation
SeMet ORF158L was prepared by using M9 SeMET growth media kits and
following the manufacturer’s protocol (Medicilon).
5.2.9 Crystallization
Purified native ORF158L was concentrated to approximately 8 mg/ml in the buffer
consisting of 20 mM Tris pH8.5, 150 mM NaCl, 1 mM MgCl2, 1 mM DTT. Initial

101
crystallization screening was performed using the sparse matrix approach using kits
from Hampton Research (Screen I and II). The protein was crystallized by the
hanging drop vapor diffusion method at 25°C. The best crystals appeared when
equilibrating against reservoir solution containing 3% glycerol, 18% PEG3350, 0.1 M
Tris pH8.5, 0.3 M NaAc with a drop size of 1 µl protein solution mixed with 1 µl
reservoir solution. Similar to the native ORF158, the recombinant SelMet ORF158
was concentrated to approximately 8mg/ml in the same buffer as the native protein.
SelMet substituted crystals were grown under essentially the same conditions as the
native ORF158. In order to obtain bigger SelMet crystals macroseeding was
employed. The crystals grew to a final size of approximately ~0.2×0.2×0.05mm3
(Figure 5.7).
5.2.10 Data collection, structure solution and refinement
Prior to data collection, both native and SelMet crystals were soaked in the reservoir
solution with step wise increased concentrations of glycerol (5% glycerol, 10%
glycerol, 15% glycerol, 20% glycerol, 25% glycerol) as cryo-protectant. Crystals were
picked up in a nylon loop, and frozen at 100K in N2 (gas) cold stream. Synchrotron
data were measured at beamline X29, NSLS, Brookhaven National Laboratory.
Diffraction data were processed using the program HKL2000. For phase
determination, the resolution range from 50 to 2.5Å was chosen. Two of the three
expected Se sites of one asymmetric unit were found using the program BNP. BNP
was further used to automatically build 90% of the total model. Remaining parts of
the model were built manually using the program O. Further cycles of model building,
alternating with refinement using the program CNS resulted in the final model, with
an R-factor of 0.207 (Rfree=0.245). The data collection and refinement statistics of
ORF158 was listed in Table 5.1.

102
5.2.11 Expression and purification of H3 and H4 complex
The plasmid, which co-expresses histone H3 and H4, was kindly provided by Dr.
James T. Kadonaga. Large scale expression of recombinant H3 and H4 was
performed by the following procedure: transformed cells were cultured in LB with
100µg/ml of ampicillin; 0.4mM IPTG was added when OD600 value of cells reached
0.6; Recombinant H3 and H4 was induced to overexpress by culturing the cells at
37°C for 2 hours. Unless stated otherwise, all subsequent operations were performed
at 4 °C. The cells were pelleted by centrifugation (4,000g, 17min). The pellets were
resuspended in the buffer (20 ml/liter bacterial cell culture), which contains 10 mM
Hepes (pH7.6), 0.1 M NaCl, 10% (v/v) glycerol, 1 mM dTT, and lysed by three
cycles of sonication of 30 s each. The lysate was subjected to centrifugation (10,000 g,
30 min), and the supernatant was discarded. The pellet was suspended in 0.25 N HCl
(10ml/liter bacterial cell culture) and dispersed with a dounce homogenizer. The
resulting suspension was incubated at -20 °C for 30 min and subjected to
centrifugation (10,000 g, 60 min). The supernatant was collected and neutralized with
0.17 volumes of 2M Tris base. The H3-H4 tetramers were purified by monoS
chromatography (flow rate = 0.8ml/min; fraction size = 0.5 ml). Protein was eluted
with a linear gradient (20 ml) from 0.1 to 2 M NaCl in the buffer, which contains 10
mM Hepes (pH7.6), 0.1 M NaCl, 10% (v/v) glycerol, 1 mM dTT. The H3 and H4
complex was eluted at about 1 M NaCl. (Figure 5.8)
5.2.12 Surface Plasmon Resonance (SPR)
Surface plasmon resonance (SPR) was carried out on a BIACORE 3000 instrument,
which uses SPR technology to investigate the interactions of macromolecules with
each other and with small ligands by immobilizing one of the ligands on a gold
surface followed by flowing the second partner (analyte) over the immobilized ligand

103
surface. One hundred microliters of 25µg/ml histone H3 and H4 complex were
captured on the CM5 (Biacore). After ligand immobilization on the analyte cell, both
the analyte and the reference cells were washed with the histone binding buffer (10
mM HEPES [pH 7.4], 150 mM NaCl, and 0.005% Surfactant P20). Serial dilution
from 0.1 µM to 25 µM of ORF158L protein sample was injected across the chip.
Binding proteins were removed by 10 microliters of 100 mM HCl after each
dissociation cycle. The data were fitted to a 1:1 binding mode with mass transfer
effect using the BIAevaluation 3.1 software (BIAcore).
5.3 Results & Discussion
5.3.1 Protein purification profiles of ORF158L
ORF158L was cloned into the pET-15b vector, expressed as a soluble form, purified
with AF, SEC, and IEC to achieve the appropriate homogeneity level for downstream
studies. The chromatography profile of ORF158L is shown in Figure 5.1.
5.3.2 Mass spectrometry analysis
The molecular mass of ORF158L is 16050 Dalton, which matched the theoretical
M.W. of 16069 Dalton. The SeMET ORF158L is 16240 Da (Figure 5.2), which
means all 4 methionines in ORF158L were replaced by Se-Met. The sequence here is
referring to the full length of ORF158L (15770 Da) plus GSH residues (299 Da) at the
N-terminal of recombinant ORF158L after thrombin cleavage of the his tag.
5.3.3 Dynamic light scattering (DLS) study
The DLS data shows that ORF158L behaves as a 81.8 kDa protein by aggregating to
be ORF158L polymers (Figure 5.3).
5.3.4 Circular dichroism study
The CD spectrum measured in the far UV region (190-260nm) showed that the
secondary structure of ORF158L is β sheet-dominant (Figure 5.4).

104
5.3.5 1D NMR
A simple one-dimensional proton experiment is the most basic spectrum in NMR
spectroscopy that can be acquired in a short time (usually not longer than a few
minutes) for samples as dilute as 0.01 mM. It provides us the folding status of
proteins (i.e. a protein is folded or unfolded). The protein folding status is important
for any further functional or structural studies on the protein as only folded proteins
retain their functional activity and three-dimensional structure. Figure 5.5 A shows a
typical one-dimensional proton NMR spectrum of a folded protein (upper panel) and a
typical one-dimensional proton NMR spectrum of an unfolded protein (lower panel).
The folded protein shows signal dispersion downfield (left) of 8.5 ppm and upfield (to
the right) of 1 ppm in one-dimensional proton NMR spectrum. With comparison, an
unfolded protein sample shows strong signals around 8.3 ppm, which is the region
characteristic for amide groups in random coil conformation, and no signal dispersion
below approximately 8.5 ppm, and also no further signals to the right of the strong
methyl peak at 0.8 ppm (Figure 5.5 A). Figure 5.5 B shows the 1D NMR spectra of
ORF158L. The 1D NMR spectra of ORF158L identifies that ORF158L is a well folded
protein (Figure 5.5 B). The signal dispersion upfield (to the right) of 0 ppm in one-
dimension proton NMR spectrum indicates that ORF158L is a well folded and beta
sheet-dominant protein.
5.3.6 1H-15N HSQC study of ORF158L
A one-dimensional spectrum of the protein molecule contains overlapping signals from
many hydrogen atoms because the differences in chemical shifts are often smaller than
the resolving power of the experiment. This problem has been bypassed by designing
experimental conditions that yield a two-dimensional NMR spectrum. Compared to 1H-
15N HSQC spectrum of ORF129, which is another protein coded in the SGIV genome,
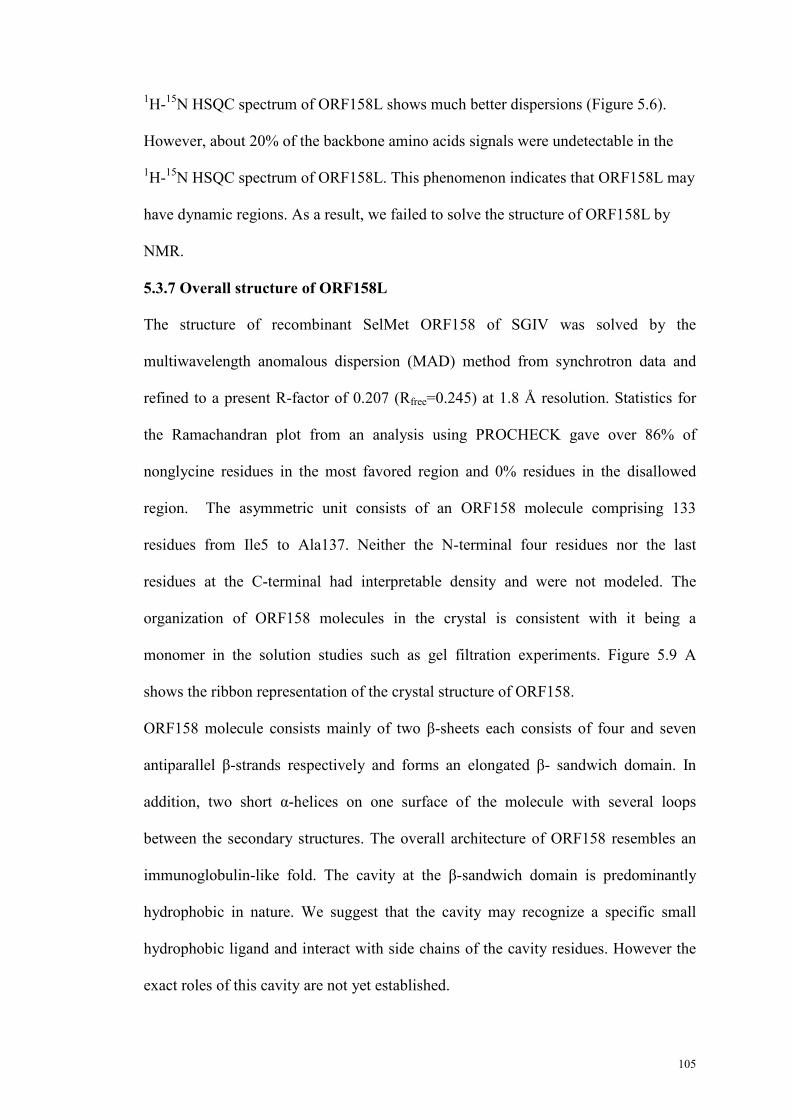
105
1H-15N HSQC spectrum of ORF158L shows much better dispersions (Figure 5.6).
However, about 20% of the backbone amino acids signals were undetectable in the
1H-15N HSQC spectrum of ORF158L. This phenomenon indicates that ORF158L may
have dynamic regions. As a result, we failed to solve the structure of ORF158L by
NMR.
5.3.7 Overall structure of ORF158L
The structure of recombinant SelMet ORF158 of SGIV was solved by the
multiwavelength anomalous dispersion (MAD) method from synchrotron data and
refined to a present R-factor of 0.207 (Rfree=0.245) at 1.8 Å resolution. Statistics for
the Ramachandran plot from an analysis using PROCHECK gave over 86% of
nonglycine residues in the most favored region and 0% residues in the disallowed
region. The asymmetric unit consists of an ORF158 molecule comprising 133
residues from Ile5 to Ala137. Neither the N-terminal four residues nor the last
residues at the C-terminal had interpretable density and were not modeled. The
organization of ORF158 molecules in the crystal is consistent with it being a
monomer in the solution studies such as gel filtration experiments. Figure 5.9 A
shows the ribbon representation of the crystal structure of ORF158.
ORF158 molecule consists mainly of two β-sheets each consists of four and seven
antiparallel β-strands respectively and forms an elongated β- sandwich domain. In
addition, two short α-helices on one surface of the molecule with several loops
between the secondary structures. The overall architecture of ORF158 resembles an
immunoglobulin-like fold. The cavity at the β-sandwich domain is predominantly
hydrophobic in nature. We suggest that the cavity may recognize a specific small
hydrophobic ligand and interact with side chains of the cavity residues. However the
exact roles of this cavity are not yet established.

106
The structure of ORF158 has a concave surface on one side of the β-sandwich domain.
This concave surface spread across strands from β9 to β11 of the β-sheet. The
calculated electrostatic surface potential shows strong negative charge in the concave
region. It is worth mentioning here that several conserved residues of ORF158 are
located in this region and would suggest an important functional role for this surface
feature. Our functional data suggest that ORF158 is a histone binding protein and we
speculate that this function could be related to this structural feature.
5.3.8 Sequence and structural homology
Blast searches revealed that ORF158 has no significant sequence homology with any
protein with known function. However it exhibits a maximum identity of less than
18% with two hypothetical proteins from Ostreococcus lucimarinus and Laccaria
bicolor. A search for topologically similar proteins within the PDB data base was
performed with the program DALI. Interestingly, significant structural similarity was
found between Asf1 and ORF158. It is worth mentioning here that the BLAST search
against all the protein sequences did not identify any similarity with the Asf1 protein.
The sequence identity among these proteins was only 13%, however their three
dimensional structures are highly homologous. The highest structural similarity is
observed between ORF158 and the Asf1, yielding an rmsd of 3.4 Å for 73 Cα atoms,
with 13% sequence identity. This observation suggests that there may be an
evolutionarily conserved structural and functional relationship among these proteins,
while at the same time the amino acid sequences of these proteins have diverged.
5.3.9 Putative histone binding region
Taking clues from the structural resemblance of ORF158 with Asf1, we hypothesize
that ORF158 could be a histone binding protein and this property is required to
regulate host histone H3 K79 methylation during SGIV replication. To verify our

107
hypothesis we inferred the ORF158 Histone proteins complex by superimposing
ORF158 on Asf1 of the heterotrimer complex with Histone 3 (H3) and Histone 4 (H4)
proteins. In the inferred complex, the Histone proteins, particularly H3 protrudes into
the negatively charged surface concave region and established several hydrogen
bonding contacts with the nearby conserved residues. The key residue Val94 of Asf1,
Ala 92 in the case of ORF158, occupies in the same pocket. Figure 5.9 shows the
inferred ORF158 complex model. Further to verify this hypothesis, we have
expressed and purified Histone proteins (Figure 5.8) and examined the formation of
complex with ORF158. The histone proteins are shown to co-localize with ORF158 in
the nucleus of SGIV-infected cells (Figure 4.4). Furthermore we have also carried out
Surface Plasmon Resonance (SPR) to obtain the binding affinities between them.
ORF158 binds with Histone which in the order of 0.362µM indicates the formation of
heterotrimer complex (Figure 5.10). Based on our experimental observations and
inferred Histone complex model, we propose that ORF158 binds with histone proteins
in a way similar to Asf1. Figure 5.9 E shows the electrostatic surface potential of
ORF158. The surface concave is located in a strong negative patch. It has been shown
for Asf1 that a mutation of Val94 with Arg completely abolished the histone binding
property of Asf1. This may be due to the introduction of large side chain residues in
this pocket. A similar argument holds true for ORF158, mutating Ala 92 with a large
side chain amino acid may affect its histone recognition. Future studies will be
directed to understand the role of key residues in ORF158 to recognize histone
proteins.

108
Figure 5.1 Purification of ORF158L. A) Gel filtration profile of ORF158L on
Superdex-30 gel filtration column (Amersham); B) Ion exchange chromatography of
ORF158 on HiTraq 5ml Q column (Amersham): C) SDS page of final purified
ORF158L.

109
Figure 5.2 Molecular Mass determination by MS. A) MS results of Native ORF158L;
B) MS results of SeMET ORF158L.

110
Figure 5.3 DLS result of ORF158L.

111
-20
-15
-10
-5
0
5
10
15
20
200 210 220 230 240 250
Figure 5.4 CD results of ORF158L at 25°C..

112
Figure 5.5 Characterization of protein structures by one-dimensional NMR
spectroscopy: A). Upper panel: A typical one-dimensional proton NMR spectrum of a
folded protein. Lower panel: A typical one-dimensional proton NMR spectrum of an
unfolded protein sample. B). One-dimensional proton NMR spectrum of ORF158L.
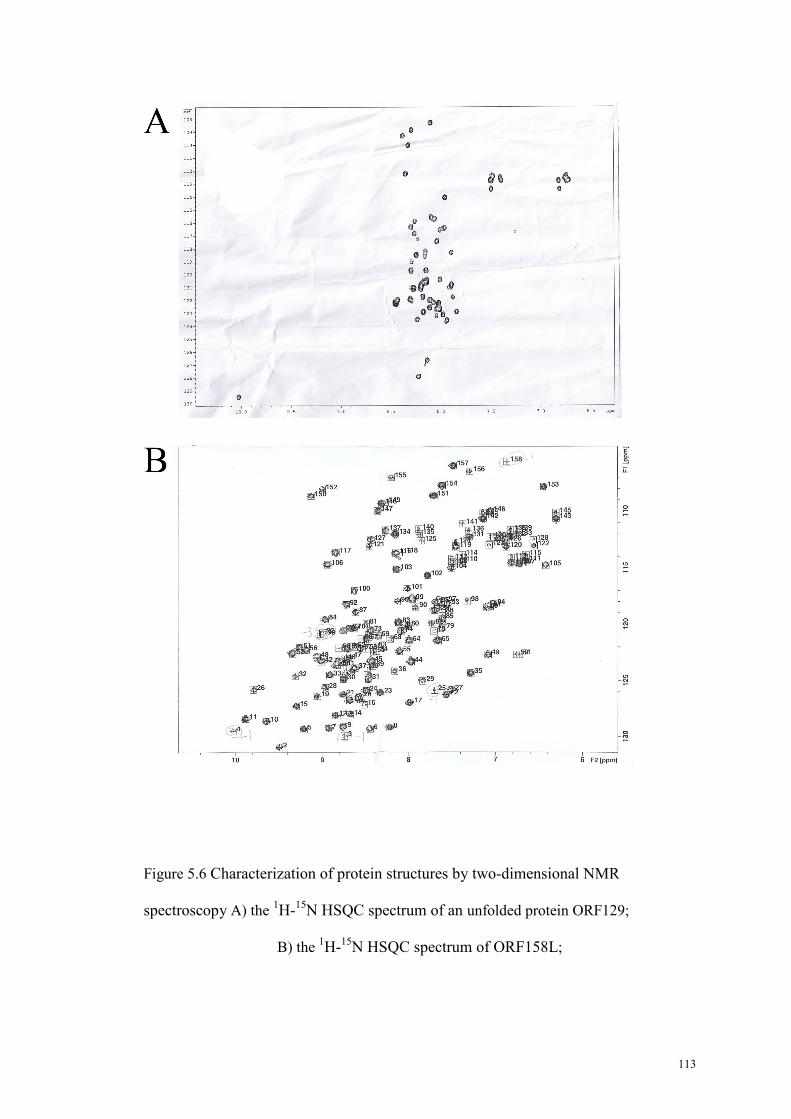
113
Figure 5.6 Characterization of protein structures by two-dimensional NMR
spectroscopy A) the 1H-15N HSQC spectrum of an unfolded protein ORF129;
B) the 1H-15N HSQC spectrum of ORF158L;

114
Figure 5.7 Crystal picture of SeMET ORF158L.

115
Figure 5.8 Purification of histone H3 & H4 complex. A) Chromatograph profile of
histone H3 & H4 complex monoS column (Amersham); B) SDS page of purified
histone H3 & H4 complex.

116
Figure 5.9 Structure of ORF158L and models of ORF158L and histones complex. A)
Overall structure of ORF158L; B) Structure comparison between ORF158L and Asf1;
C) The model of ORF158L and histone H3 complex; D) The model of ORF158L and
histone H3 & H4 complex; E) The electrostatic surface potential of ORF158L, blue
color represents positive charge, red color represents negative charge.

117
Figure 5.10 SPR study of ORF158L binding to histone H3 & H4 complex.

118
Table 5.1 Data collection and refinement statistics of ORF158L
Data collection and refinement statistics
Space group C2 Unit cell dimensions (Å) a=59.98, b= 41.01, c= 52.33 α=90, β= 95.32, γ=90.0 Data set Peak Inflection
Resolution range (Å) 50-1.8 Wavelength (Å) 0.979 0.9792 Observed hkl 86250 73264 Unique hkl 11855 10223 Completeness (%) 99.9 99.9 Overall (I/oI) 14.8 12.3 Rsym a (%) 6.2 6 Refinement and quality Resolution range [I>o(I)] 1.8 -20.0 Rwork b (no. of reflections) 0.2074(21617) Rfree c (no. of reflections) 0.2447(1093) rmsd bond lengths (A) 0.006 rmsd bond angles (deg) 1.3 Ramachandran plot Most favored regions (%) 86 Additional allowed regions (%) 13.2 Generously allowed regions (%) 0.9 Disallowed regions (%) 0

119
Chapter Six
Achievements & Future experiments
120
6.1 Achievements
In this thesis, we have presented the following achievements:
1) We are the first to study the temporal and differential gene expression of
Singapore grouper iridovirus (SGIV) by DNA microarray. To our knowledge,
this is one of the first studies where DNA microarray technique and also real-
time RT-PCR were used for the investigation of fish viruses. (Chen et al.,
2006)
2) We are the first to study the SGIV and host cell interaction at proteomics scale
by using iTRAQ. (Chen et al., 2008)
3) We are the first to demonstrate that ORF158L is a real protein encoded by
SGIV.
4) We are the first to characterize the function of ORF158L and show that
ORF158L is involved in the regulation of histone H3 K79 methylation.
5) We are the first to elucidate the crystal structure of ORF158L.
6.2 Future experiments
In future, we are going to further investigate the following scientific questions:
1) We are going to study the mechanism about how ORF158L regulates host
histone H3 K79 methylation and the consequences of the regulation of host
histone H3 K79 methylation.
2) By combining knockdown, DNA microarray and iTRAQ, we are going to
carry functional studies of SGIV genes.
3) With the help of NMR and X-ray crystallography, we are going to continue
the structural studies of both viral structural proteins and viral non structural
proteins.

121
4) Based on the functional genomics and structural genomics studies of SGIV,
we are going to uncover the SGIV pathogenesis and provide valuable
knowledge.
5) Based on the functional genomics and structural genomics studies of SGIV,
we are going to design new drugs and raise new strategies in the treatment of
SGIV infection on grouper.

122
References:
Aparicio, S., J. Chapman, E. Stupka et al. 2002. Whole-genome
shotgun assembly and analysis of the genome of Fugu rubripes.
Science 297:1301-1310.
Ashburner, M., C. A. Ball, J. A. Blake et al. 2000. Gene ontology: tool
for the unification of biology. The Gene Ontology Consortium. Nature
Genet. 25:25-29.
Bax, A. 2003. Weak alignment offers new NMR opportunities to study
protein structure and dynamics. Protein Sci. 12:1-16.
Bloch, F., W. W. Hansen, and M. E. Packard. 1946. Nuclear induction.
Phys.Rev. 69:127-150.
Blow, D. M. 2002. Rearrangement of Cruickshank's formulae for the
diffraction-component precision index. Acta Crystallogr D Biol
Crystallogr. 58:792-797.
Brenner, S. E. 2001. A tour of structural genomics. Nat Rev Genet.
2:801-809.
Bruschweiler, R. 2003. New approaches to the dynamic interpretation
and prediction of NMR relaxation data from proteins. Curr. Opin. Struct.
Biol. 13:175-183.
Cao, R., and Y. Zhang. 2004. The functions of E(Z)/EZH2-mediated
methylation of lysine 27 in histone H3. Curr. Opin. Genet. Dev. 14:155-
164.
Chayen, N. E. 2004. Turning protein crystallization from an art into a
science. Curr. Opin. Struct. Biol. 14:577-583.
Chen, L. M., B. N. Tran, Q. Lin, T. K.Lim, F. Wang, C. L. Hew. 2008.

123
iTRAQ analysis of Singapore grouper iridovirus infection in a grouper
embryonic cell line. J Gen Virol. (Accepted).
Chen, L. M., F. Wang, W. J. Song, and C. L. Hew. 2006. Temporal
and differential gene expression of Singapore grouper iridovirus. J Gen
Virol. 87:2907-2915.
Chew, L. M., G. H. Ngoh, M. K. Ng, J. M. Lee, P. Chew, J. Li, Y. C.
Chan, and J. L. C. Howe. 1994. Grouper cell line for propagating
grouper viruses. Singap J Prim Ind. 22:113-116.
Chinchar, V. G., S. Essbauer, J. G. He, A. Hyatt, T. Miyazaki, V.
Seligy, and T. Williams. 2005. Family Iridoviridae. In Virus Taxonomy:
Eighth Report of the International Committee on Taxonomy of Viruses,
pp. 150–162. Edited by C. M. Fauquet, M. A. Mayo, J. Maniloff, U.
Desselberger & L. A. Ball. San Diego: Elsevier/Academic Press.
Chinchar, V. G., J. Han, J. Mao, I. Brooks, and K. Srivastava. 1994.
Instability of frog virus 3 mRNA in productively infected cells. Virology
203: 187-192.
Chinchar, V. G., and W. Yu. 1992. Metabolism of host and viral
mRNAs in frog virus 3-infected cells. Virology 186:435-443.
Chua, F. H. C., M. L. Ng, K. L. Ng, J. J. Loo, and J. Y. Wee. 1994.
Investigation of outbreaks of a novel disease, ‘sleepy grouper disease,’
affecting the brown-spotted grouper, Epinephelus tauvina Forskal. J
Fish Dis 17:417-427.
Clore, G. M., and A. M. Gronenborn. 1991. Structures of larger
proteins in solution: three- and four-dimensional heteronuclear NMR
spectroscopy. Science 252:1390-1399.

124
Cornilescu, G., Delaglio, E & Bax, A. . 1999. Protein backbone angle
restraints from searching a database for chemical shift and sequence
homology. J Biomol. NMR. 13:289-302.
D’Costa, S. M., H. Yao, and S. L. Bilimoria. 2001. Transcription and
temporal cascade in Chilo iridescent virus infected cells. Arch Virol
146:2165–2178.
D’Costa, S. M., H. Yao, and S. L. Bilimoria. 2004. Transcriptional
mapping in Chilo iridescent virus infections. Arch Virol 149:723-742.
Delaglio, F., S. Grzesiek, et al. 1995. NMRPIPE - A Multidimensional
Spectral Processing System Based on UNIX Pipes. J Biomol. NMR.
6:277-293.
Delhon, G., E. R. Tulman, C. L. Afonso, Z. Lu, J. J. Becnel, B. A.
Moser, G. F. Kutish, and D. L. Rock. 2006. Genome of invertebrate
iridescence virus type 3 (Mosquito iridescent virus). J Virol 80:8439-
8449.
Do, J. W., C. H. Moon, H. J. Kim et al. 2004. Complete genomic DNA
sequence of rock bream iridovirus. Virology 325:351-363.
Eaton, H. E., J. Metcalf, E. Penny, V. Tcherepanov, C. Upton, and C.
R. Brunetti. 2007. Comparative genomic analysis of the family
Iridoviridae: re-annotating and defining the core set of iridovirus genes.
Virol J. 4: 11.
Eisen, M. B., P. T. Spellman, P. O. Brown, and D. Botstein. 1998.
Cluster analysis and display of genome-wide expression patterns. Proc
Natl Acad Sci U S A 95:14863-14868.
Fernandez, C., and G. Wider. 2003. TROSY in NMR studies of the

125
structure and function of large biological macromolecules. Curr. Opin.
Struct. Biol. 13:570-580.
Fiaux, J., E.B. Bertelsen, A. L. Horwich, and K. Wüthrich. 2002.
NMR analysis of a 900 K GroEL-GroES complex. Nature 418:207-221.
Goorha, R. 1982. Frog virus 3 DNA replication occurs in two stages. J
Virol. 43:519-528.
Goorha, R., G. Murti, A. Granoff, and R. Tirey. 1978. Macromolecular
synthesis in cells infected by frog virus 3. VIII. The nucleus is a site of
frog virus 3 DNA and RNA synthesis. Virology 84:32-50.
Green, E. D. 2001. Strategies for the systematic sequencing of
complex genomes. Nat Rev Genet. 2:573-583.
Gygi, S. P., B. Rist, S. A. Gerber, F. Turecek, M. H. Gelb, and R.
Aerbersold. 1999. Quantitative analysis of complex protein mixtures
using isotope-coded affinity tags. Nature Biotechnology 17:994-999.
He, J. G., M. Deng, S. P. Weng, Z. Li, S. Y. Zhou, Q. X. Long, X. Z.
Wang, and S. M. Chan. 2001. Complete genome analysis of the
mandarin fish infectious spleen and kidney necrosis iridovirus. Virology
291:126-139.
He, J. G., L. Lu, M. Deng et al. 2002. Sequence analysis of the
complete genome of an iridovirus isolated from the tiger frog. Virology
292:185-197.
Herrmann, T., Giintert,P.and Wuthrich,K. 2002. Protein NMR
structure determination with automated NOE assignment using the new
software CANDID and the torsion angle dynamics algorithm DYANA.
J.Mol.Biol. 319:209-227.

126
Huyen, Y., O. Zgheib, R. A. J. Ditullio et al. 2004. Methylated lysine
79 of histone H3 targets 53BP1 to DNA double-strand breaks. Nature
432:406-411.
Ishima, R., and D. A. Torchia. 2000. Protein dynamics from NMR.
Nat. Struct. Biol. 7:740-743.
Jakob, N. J., K. Müller, U. Bahr, and G. Darai. 2001. Analysis of the
first complete DNA sequence of an invertebrate iridovirus: coding
strategy of the genome of Chilo iridescent virus. Virology 286:182-196.
Jancovich, J. K., J. H. Mao, V. G. Chinchar et al. 2003. Genomic
sequence of a ranavirus (family Iridoviridae) associated with
salamander mortalities in North America. Virology 316:90-103.
Jennings, E. 1995. Folic acid as a cancer preventing agent. Medical
Hypotheses 45:297-303.
Johnson, B. a. B., R.. . 1994. NMR VIEW - A Computer-Program for
the Visualization and Analysis of NMR Data. Journal of Biomolecular
NMR 4:603-614.
Kay, L. E. 2005. NMR studies of protein structure and dynamics.
Journal of Magnetic Resonance 173:193-207.
Kendrew, J. C., G. Bodo, H. M. Dintzis, R. G. Parrish, H. Wyckoff,
and D. C. Phillips. 1958. A Three-Dimensional Model of the Myoglobin
Molecule Obtained by X-Ray Analysis. Nature 181:662-666.
Lacoste, N., R. T. Utley, J. M. Hunter, and T. Jenuwein. 2003. An
epigenetic road map for histone lysine methylation. J. Cell.Sci.
116:2117-2124.
Li, B., M. Carey, and J. L. Workman. 2007. The role of chromatin
127
during transcription. Cell 128:707-719.
Livak, K. J., and T. D. Schmittgen. 2001. Analysis of relative gene
expression data using real-time quantitative PCR and the 2-CT method.
Methods 25:402-408.
Lu, L., S. Y. Zhou, C. Chen, S. P. Weng, S. M. Chan, and J. G. He.
2005. Complete genome sequence analysis of an iridovirus isolated
from the orange-spotted grouper, Epinephelus coioides. Virology
339:81-100.
Lua, D. T., M. Yasuike, I. Hirono, and T. Aoki. 2005. Transcription
Program of Red Sea Bream Iridovirus as Revealed by DNA
Microarrays. J. Virol. 79:15151-15164.
Lua, D. T., M. Yasuike, I. Hirono, H. Kondo, and T. Aoki. 2007.
Transcriptional profile of red seabream iridovirus in a fish model as
revealed by viral DNA microarrays. Virus Genes 35:449-461.
Luger, K., A. W. Mäder, R .K. Richmond, D. F. Sargent, and T. J.
Richmond. 1997. Crystal structure of the nucleosome core particle at
2.8 A resolution. Nature 389:251-260.
Marsden, R. L., J. A. Ranea, A. Sillero et al. 2006. Exploiting protein
structure data to explore the evolution of protein function and biological
complexity. Philos Trans R Soc Lond B Biol Sci. 361:425-440.
Martin, C., and Y. Zhang. 2005. The diverse functions of histone
lysine methylation. Nat Rev Mol Cell Biol. 6:838-849.
McMillan, N. A., and J. Kalmakoff. 1994. RNA transcript mapping of
the Wiseana iridescent virus genome. Virus Res. 32:343-352.
Moradian-Oldak, J., Leung, W., Fincham, A. G.. 1998 Temperature

128
and pH-dependent supramolecular self-assembly of amelogenin
molecules: a dynamic light-scattering analysis. J. Struct. Biol. 122:320-
327.
Murti, K. G., R. Goorha, and A. Granoff. 1985. An unusual
replication strategy of an animal iridovirus. Adv. Virus Res. 30:1-19.
Okada, Y., Q. Feng, Y. Lin et al. 2005. hDOT1L links histone
methylation to leukemogenesis. Cell 121:167-178.
Okazaki, Y., M. Furuno, T. Kasukawa et al. 2002. Analysis of the
mouse transcriptome based on functional annotation of 60,770 full-
length cDNAs. Nature 420:563-573.
Ong, S. E., B. Blagoev, I. Kratchmarova, D. B. Kristensen, H. Steen,
A. Pandey, and M. Mann. 2002. Stable isotope labeling by amino
acids in cell culture, SILAC, as a simple and accurate approach to
expression proteomics. Molecular and Cellular Proteomics 1:376-386.
Overhauser, A. W. 1953. Nuclear Overhauser effect. Phys.Rev.
91:476.
Paulose, M. M., N. K. Ha, C. Xiang et al. 2001. Transcription program
of human herpesvirus 8 (Kaposi's sarcoma-associated herpersvirus). J
Virol. 75:4843-4853.
Peterson, C. L., and M. A. Laniel. 2004. Histones and histone
modifications. Curr. Biol. 27:R546-551.
Purcell, E. M., H. C. Torrey, and R.V. Pound. 1946. Resonance
Absorption by Nuclear Magnetic Moments in a Solid. Phys. Rev. 69:37-
38.
Qin, Q. W., T. J. Lam, Y. M. Sin, H. Shen, S. F. Chang, G. H. Ngoh,

129
and C. L. Chen. 2001. Electron microscopic observations of a marine
fish iridovirus isolated from brown-spotted grouper, Epinephelus
tauvina. J. Virol. Methods 98:17–24.
Rabi, I. I., J. R. Zacharias, S. Millman, and P. Kusch. 1938. A New
Method of Measuring Nuclear Magnetic Moment. Physical Review
53:318.
Ross, P. L., Y. N. Huang, J. N. Marchese et al. 2004. Multiplexed
protein quantitation in Saccharomyces cerevisiae using aminereactive
isobaric tagging reagents. Molecular and Cellular Proteomics 3:1154-
1169.
Roth, S. Y., Denu, J. M., Allis, C. D. 2001. Histone acetyltransferases.
Annu. Rev. Biochem. 70: 81-120.
Sattler, M., J. Schleucher, and C. Griesinger. 1999. Heteronuclear
multidimensional NMR experiments for the structure determination of
proteins in solution employing pulsed field gradients. Prog. Nucl. Magn.
Reson. Spectrosc. 34:93-158.
Scapin, G. 2006. Structural biology and drug discovery. Curr. Pharm.
Des. 12:2087-2097.
Smith, K. M., and N. Xeros. 1954. An unusual virus disease of a
dipterous larva. Nature 173:866–867.
Song, W., Q. Lin, S. B. Joshi, T. K. Lim, and C. L. Hew. 2006.
Proteomic studies of the Singapore grouper iridovirus. Mol Cell
Proteomics 5:256–264.
Song, W. J., Q. W. Qin, J. Qiu, C. H. Huang, F. Wang, and C. L. Hew.
2004. Functional genomics analysis of Singapore grouper iridovirus:

130
complete sequence determination and proteomic analysis. J. Virol.
78:12576–12590.
Strausberg, R. L., E. A. Feingold, L. H. Grouse et al. 2002.
Generation and initial analysis of more than 15,000 full-length human
and mouse cDNA sequences. Proc Natl Acad Sci U S A 99:16899-
16903.
Tachibana, M., J. Ueda, M. Fukuda et al. 2005. Histone
methyltransferases G9a and GLP form heteromeric complexes and are
both crucial for methylation of euchromatin at H3-K9. Genes Dev
19:815-826.
Tagashira, S., H. Harada, T. Katsumata, N. Itoh, and M. Nakatsuka.
1997. Cloning of mouse FGF10 and up-regulation of its gene
expression during wound healing. Gene 197:399-404.
Tan, W. G., T. J. Barkman, C. V. Gregory, and K. Essani. 2004.
Comparative genomic analyses of frog virus 3, type species of the
genus Ranavirus (family Iridoviridae). Virology 323:70-84.
Tettelin, H., V. Masignani, M. J. Cieslewicz et al. 2005. Genome
analysis of multiple pathogenic isolates of Streptococcus agalactiae:
implications for the microbial 'pan-genome'. Proc. Natl. Acad. Sci.
U.S.A. 102:13950-13955.
Tidona, C. A., and G. Darai. 1997. The complete DNA sequence of
lymphocystis disease virus. Virology 230:207-216.
Tsai, C. T., J. W.Ting, M. H. Wu, M. F.Wu, I. C. Guo, and C. Y.
Chang. 2005 Complete genome sequence of the grouper iridovirus
and comparison of genomic organization with those of other

131
iridoviruses. J Virol. 79:2010-2023.
Umemori, H., M. W. Linhoff, D. M. Ornitz, and J. R. Sanes. 2004.
FGF22 and its close relatives are presynaptic organizing molecules in
the mammalian brain. Cell 118:257-270.
Wherlock, M., and H. Mellor. 2002. The Rho GTPase family: a Racs
to Wrchs story. Journal of Cell Science 115:239-240.
Wider, G., and K. Wüthrich. 1999. NMR spectroscopy of large
molecules and multimolecular assemblies in solution. Curr. Opin. Struct.
Biol. 9:594-601.
Williamson, M. P., Havel, T. F., and Wüthrich, K. 1985. Solution
conformation of proteinase inhibitor IIA from bull seminal plasma by 1H
nuclear magnetic resonance and distance geometry. J. Mol. Biol. 182, 295–
315.
Williams, T., S. V. Barbosa, and V. G. Chinchar. 2005. A decade of
advances in iridovirus research. Adv Virus Res. 65:173–248.
Williams, T. 1996. The iridoviruses. Adv. Virus Res. 46:345-412.
Williams T., C. V. G., Darai G., Hyatt A., Kalmakoff J. & Seligy V.
2000. Iridoviridae. Seventh report of the International Committee on
the Taxonomy of Viruses.
Willis, D. B., and A. Granoff. 1978. Macromolecular synthesis in cells
infected by frog virus 3. IX. Two temporal classes of early viral RNA.
Virology 86:443-453.
Willis, D. B., R. Goorha, M. Miles, and A. Granoff. 1977.
Macromolecular synthesis in cells infected by frog virus 3. VII.
Transcriptional and post-transcriptional regulation of virus gene

132
expression. J Virol. 24:326-342.
Zhang, Q. Y., F. Xiao, J. Xie, Z. Q. Li and J. F. Gui. 2004. Complete
genome sequence of lymphocystis disease virus isolated from China. J
Virol. 78:6982-6994.
Zhang, Y., and D. Reinberg. 2001. Transcription regulation by histone
methylation: interplay between different co-valent modifications of the
core histone tails. Genes Dev. 15:2343-2360.
Zhu, J. W., Z.. . 2005. FAST: a novel protein structure alignment
algorithm. Proteins. 58:618-627.
Zieske, R. L. 2006. A perspective on the use of iTRAQTM reagent
technology for protein complex and profiling studies. J. Exp Bot
57:1501-1508.