financial results for the 1st...financial results for the 1st half of the fiscal year ending march...
TRANSCRIPT

Financial Results for the
1st Half of the Fiscal Year
Ending March 2020
(from April to September 2019)
November 1, 2019
Makoto TakahashiPresidentKDDI Corporation

Highlights of Financial Resultsfor the 1st Half
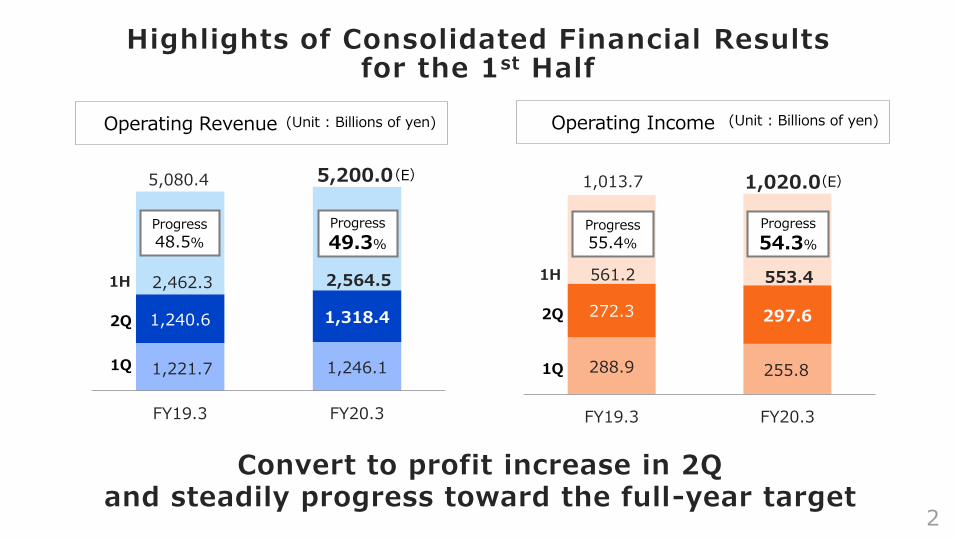
1,221.7 1,246.1
1,240.6 1,318.4
FY19.3 FY20.3
(E)
1Q
5,200.05,080.4
Convert to profit increase in 2Qand steadily progress toward the full-year target
Progress
48.5%
Progress
49.3%
2Q
2
Highlights of Consolidated Financial Resultsfor the 1st Half
Operating Revenue Operating Income(Unit : Billions of yen) (Unit : Billions of yen)
288.9 255.8
272.3 297.6
FY19.3 FY20.3
(E)
1Q
1,013.7 1,020.0
Progress
54.3%
Progress
55.4%
2Q
2,462.3 2,564.5 561.2 553.41H 1H

3
<Life DesignDomain>
FY19.3 1H FY20.3 1H
<BusinessSegment>
<HandsetSales Cost>
<One Off>
1Q +5.0
2Q +14.0
1Q +5.9
2Q +12.9
2Q Profit in growth fields has increasedmore robustly than 1Q
Growth Fields
+
+
+
(Unit : Billions of yen)<Others>
【main details】・change accounting period for Myanmar business・accelerate depreciation for 3G shut down, etc.
Inc.) the retentionon the migration
from 3G to 4G, etc.
Operating Income :Factor for Change, YoY for 1st Half
YOY(7.8)
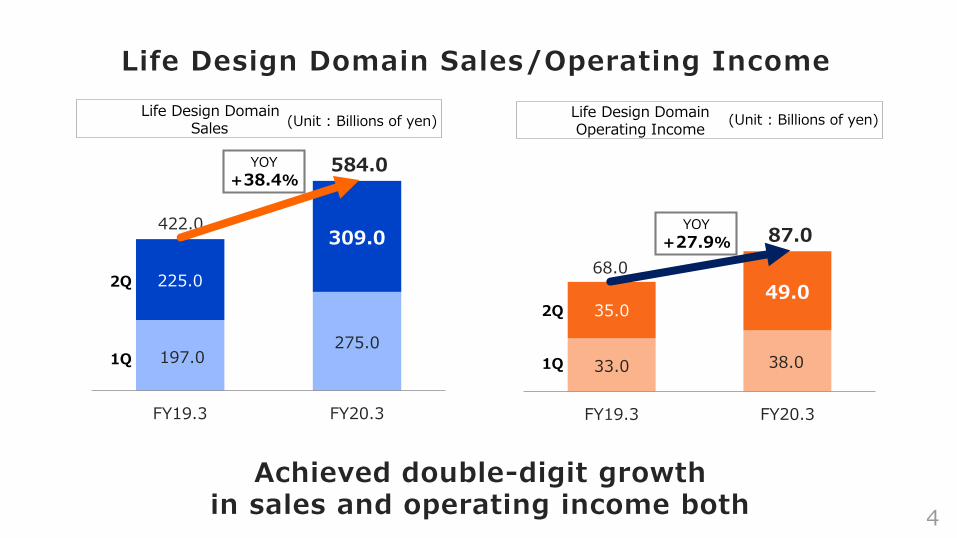
Life Design Domain Sales/Operating Income
197.0275.0
225.0
309.0
FY19.3 FY20.3
33.0 38.0
35.049.0
FY19.3 FY20.3
1Q 1Q
2Q
2Q
Achieved double-digit growthin sales and operating income both
422.0
584.0
68.0
87.0
YOY
+38.4%
YOY
+27.9%
4
Life Design DomainOperating Income
Life Design DomainSales
(Unit : Billions of yen) (Unit : Billions of yen)
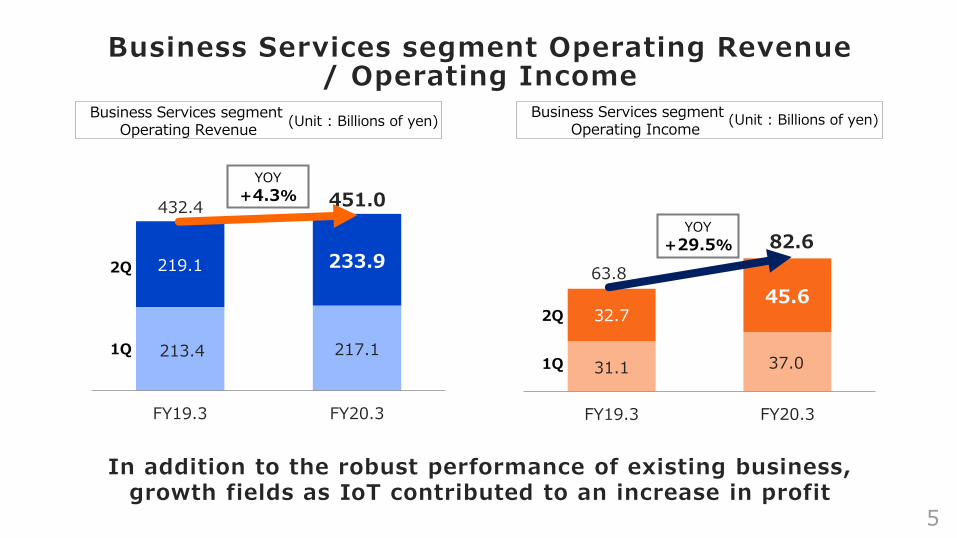
213.4 217.1
219.1 233.9
FY19.3 FY20.3
31.1 37.0
32.745.6
FY19.3 FY20.3
1Q1Q
2Q
2Q
432.4 451.0
63.8
82.6
YOY
+4.3%
YOY
+29.5%
Business Services segment Operating Revenue/ Operating Income
In addition to the robust performance of existing business, growth fields as IoT contributed to an increase in profit
5
Business Services segmentOperating Revenue
(Unit : Billions of yen)Business Services segment
Operating Income(Unit : Billions of yen)

ID×ARPA×Engagement

Maximizing Life Time Value
7
Collaboration with OTT PlayersEvolution of au Smart Pass
Fixed line×
Mobile
Telecommunications
×Life design
New price plantowards the coming 5G
Value-Added
Telecommunications
Life TimeValue
Expand our IDsby implementing Group strategies
Engagement
ID
Aim to expand Life Time Valuevia “ID×ARPA×Engagement”
au Smart Value Smart Value(life design edition)
ARPA

8
Expand Our IDsby Implementing Group Strategies
Mobile IDs* (Unit : Millions)
*au accounts + MVNO subscriptions
Act in collaboration with Group MVNO to increasethe Mobile IDs for the entire Group
Customersprefer
lower prices
Customerswant fast, smooth
high-capacitycommunications
Diverse sales channel and customer basis
9/'16 9/'17 9/'18 9/'19
auaccounts
MVNOsubscriptions
26.08 26.70 27.0925.70

Total ARPA / Total ARPA Revenues
Total ARPA RevenuesTotal ARPA (Unit : Yen)
Achieved year on year growth in all componentsof Total ARPA*
9* au ARPA, Value-added ARPA, au Denki ARPA, Handset Repair and Compensation ARPA
(Unit : Billions of yen)
549.4
569.4
FY19.3 2Q FY20.3 2Q
YOY
+3.6%
7,450 7,770
FY19.3 2Q FY20.3 2Q
YOY
+4.3%

Growth Fields

11
Expansion of Finance Business
Earn points through smartphone
Finance through smartphone
From Oct 2018 From Apr 2019 Within FY2019
au’siDeCo
Point utilizationMicro loans
Microinvestments
Life DesignDomain
Customers can utilize their au WALLET pointsin financial services
au PAY / au WALLET
*1) Subs. as of Oct 5, 2019 *2) Valid members as of Oct 12, 2019 *3) Valid members as of the end of Sep 2019
Aiming business growth by expanding settlement platforms and facilitating point circulation
(electricity service)
Over 6 million*1
Total over 33 million
Credit cardOver 5 million*2
3/'19 6/'19 9/'19
Prepaid cardOver 22 million*3

Expansion of services
12
8.51 million members(as of the end of Sep 2019)
Penetration rate ofau Smart Pass Premium*1
37% (as of the end of Sep 2018)
↓
55% (as of the end of Sep 2019)
Free take ofApps
Memberprivileges
SelectedCoupon
Reward Day
Freeshipping*2
Concerts andentertainment
events
xRexperience
The Members ofau Smart Pass Premium
*1 Ratio of au Smart Pass Premium members to au Smart Pass members*2 Products with premium marks and that were purchased on ‘au Wowma!’ will receive free shipping
Offer attractive services to increase membership
au Smart Pass Premium
Life DesignDomain
Protection forbreakage or
loss of a phone

Total Strength toward IoT Market
13
BusinessServicessegment
* Created by KDDI based on “IT Navigator 2019 Edition” written by Nomura Research Institute, Ltd.
1.92.7
2.4
4.9
FY19.3 FY21.3 FY23.3 FY25.3
Provide one-stop IoTfor the entire group
(Unit : trillion Yen)
Tele
communication
/ device
Utilize data
/cloud
High growth market
1.8 times in 6 years
Compile Transmit Stock Visualize Analyze/Estimate
Estimated Sizing of DomesticIoT Market by Business Category*
4.3
7.6
Aiming for growth that surpasses the marketwith total Group strength
14
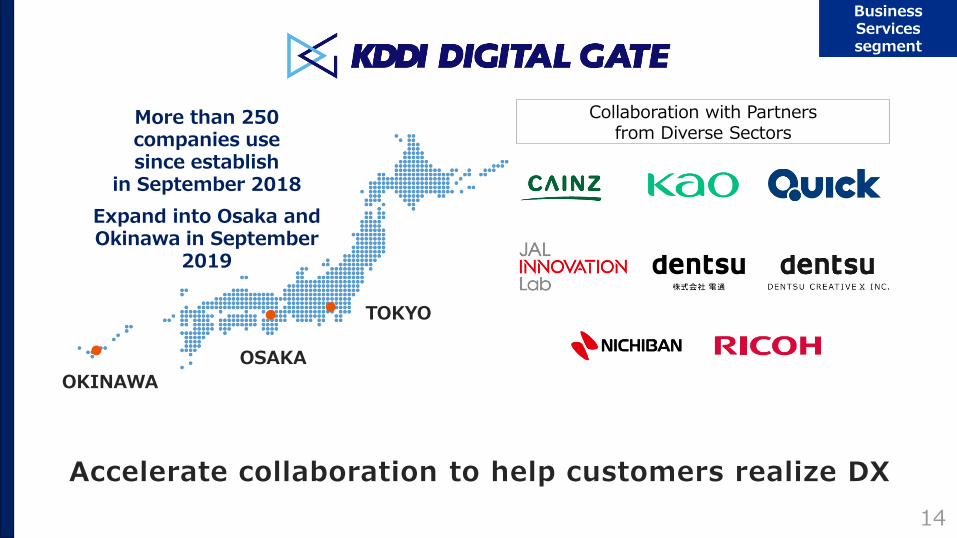
Accelerate collaboration to help customers realize DX
TOKYO
OKINAWA
OSAKA
Collaboration with Partnersfrom Diverse Sectors
More than 250 companies usesince establish
in September 2018
Expand into Osaka and Okinawa in September
2019
BusinessServicessegment
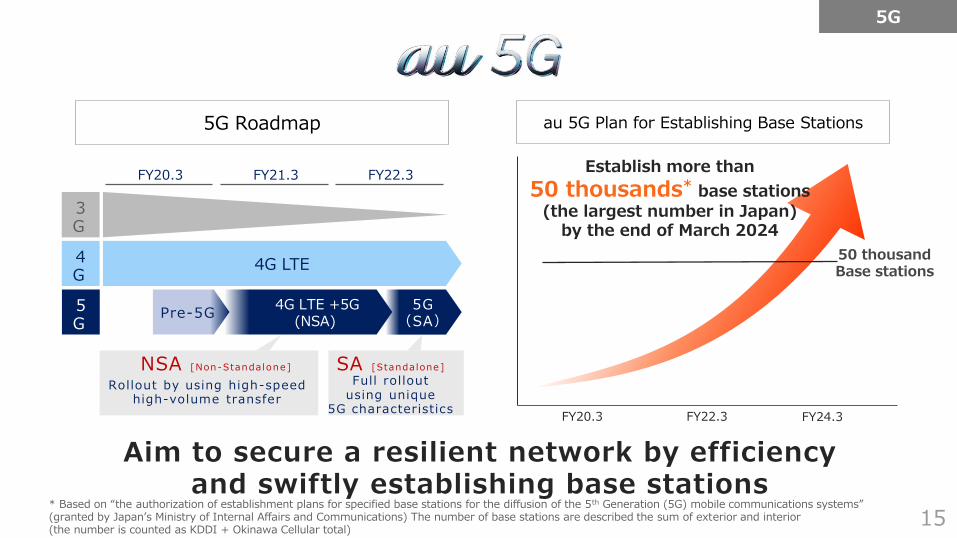
Aim to secure a resilient network by efficiencyand swiftly establishing base stations
15
au 5G Plan for Establishing Base Stations5G Roadmap
5G
* Based on “the authorization of establishment plans for specified base stations for the diffusion of the 5th Generation (5G) mobile communications systems”(granted by Japan’s Ministry of Internal Affairs and Communications) The number of base stations are described the sum of exterior and interior(the number is counted as KDDI + Okinawa Cellular total)
5G(SA)
4G LTE +5G(NSA)
5G
Pre-5G
4G
4G LTE
FY20.3 FY21.3 FY22.3
3G
NSA [Non -Standa lone] SA [S tanda lone ]
Rollout by using high-speedhigh-volume transfer
Ful l ro l loutusing unique
5G characterist icsFY20.3 FY24.3
50 thousandBase stations
FY22.3
Establish more than
50 thousands* base stations
(the largest number in Japan)by the end of March 2024

16
Deliver new experience value towards the erathat telecommunications will be prevalent everywhere
“Projection×5G”Launch a trial platform
in November 2019
5G
Customer Experience Value in the 5G Era
5G-Compatible Solution
S p o r t s w i l l c h a n g eT o w n w i l l c h a n g e
E n t e r t a i n m e n t w i l l c h a n g e
拡 張C r e a t e n e w v a l u e
=

Our Response in Times of Disaster
Realize quick telecommunication restorationand disaster area support 17
Retrieval Activities use Equipment Various Back-Up Activities
Vehicle-mounted base stations
Ship-mounted base stations
Refugecharger support
Free Wi-Fi00000JAPAN
Satellitecommunication
equipment
Portableelectric generator
au shopcharger BOX
Rental ofrestoration
support goods

“No.1 in Mobile PhoneService Satisfaction”
4 consecutive years
Source:J.D. Power 2016-2019 Mobile Phone Service Satisfaction Study. Based on responses from 27,600 mobile phone users in 2019.J.D. Power 2016-2019 Business Mobile Phone Service Satisfaction Study. Based on 2,872 companies with 100 or more employees in a survey in 2019.J.D. Power 2013-2019 Business IP Phone & Direct Line Phone Service Satisfaction Study. Based on 1,519 companies with 100 or more employees in a survey in 2019.J.D. Power 2019 Business Network Service Satisfaction Study. Based on 598 companies with 1,000 or more employees in a survey in 2019. jdpower-japan.com
“No.1 in Business IP Phone and Direct Line
Phone Service Satisfaction”
7 consecutive years
Pursue further improvement of customer satisfaction
18
“No.1 in Business Mobile Phone Service Satisfaction”<large and mid-sized corporation market
segment>
4 consecutive years
“No.1 in Business Network Service
Satisfaction<large enterprise market segment>
Received Top AwardsJ.D. Power Customer Satisfaction

Convert to profit increase in 2Q and steadily progress toward the full-year target
Achieved double-digit profit growth both in the life design domain and the Business Services segment
1HFinancial
Result
GrowthFields
Expand Life Time Value via “ID×ARPA×Engagement”
We aim to achieve business expansion in the life design domain, as our core remains telecommunication services, by taking advantage of finance and settlement solutions and au Smart Pass Premium
Promote to tackle the growth fields especially IoTin the Business Services segment
Deliver new customer experience valuetowards the coming 5G
Summary
19

20

Appendix

Note) “KDDI (consolidated)” is prepared in accordance with IFRS and “au Financial Holdings (consolidated)” is prepared in accordance with J-GAAP22
KDDI (consolidated) au Financial Holdings (consolidated)
Property,Plant and equipment
andIntangible assets
Goodwill
Tradeand
other receivables
Securities forfinancial business
Loans forfinancial business
Contract costs
Cash andcash equivalents Others
Interest-bearingdebt
Trade andother payables
Deposits forfinancial business
Other liabilities
Equity
Others
Cash andcash equivalents
SecuritiesLoans
Deposits
Others
Total Assets 9.27 trillion yen
Total Assets 1.88 trillion yen
Consolidated Statement of Financial Position

23
IncreaseEBITDA
FY19.3 1H FY20.3 1H
IncreaseCAPEX
M&A,etc.
Others
YOY
+103.6
(FY19.3) kakaku.com, etc.(FY20.3) kabu.com securities, etc.
++
+
* Cash flow related to financial business as described in the consolidated cash flow statement in the 2nd quarter of the fiscal year ending March 2020+ revenue from Jibun Bank’s gain control
Includesthe impact of
the IFRS16 adoption+46.7
Free Cash Flow :Factor for Change, YoY for 1st Half
FinanceBusiness*
(Unit : Billions of yen)

24
Statements made in these documents with respect to the KDDI Group‘s performance targets, projected subscriber numbers, future forecasts and strategies that are not historical facts are forward-looking statements about the future performance of the
KDDI Group, based on company’s assumptions and beliefs in light of the information available at the time they were made. Theytherefore include certain risks and uncertainties. Actual results can differ from these statements due to reasons including, but not limited to, domestic and overseas economic trends, competitive position, formulation, revision or abolition of laws and ordinances,
regulations or systems, government actions or intervention and the success or lack thereof of new services.Consequently, please understand that there is a possibility that actual performance, subscriber numbers, strategies and otherinformation may differ significantly from the forecast information contained in these materials or other envisaged situations.
Disclaimer