capcom financial results presentation for 1st quarter in fy2016
TRANSCRIPT
0 Capcom Public Relations & Investor Relations Section Capcom Public Relations & Investor Relations Section
Capcom Co., Ltd. (Tokyo Exchange, First Section, 9697)
1st Quarter Report Fiscal year ending March 31, 2017
1 Capcom Public Relations & Investor Relations Section
Forward-looking Statements
Strategies, plans, outlooks and other statements that are not historical facts are based on assumptions that use information currently available and reasonable judgments. Actual performance may be significantly different from these statements for a number of reasons.
In the entertainment industry, which includes Capcom, performance may be highly volatile because of diverging user needs and other changes in market conditions.
Factors that can affect Capcom’s performance include: (1) the number of hit titles and sales volume in the Home Video Game Business, which accounts for the majority of sales; (2) progress in developing home video games; (3) consumer demand for home video game consoles; (4) sales outside Japan; (5) changes in stock prices and exchange rates; (6) alliances with other companies concerning product development, sales and other operations; and (7) changes in market conditions. Please note that this is not a complete list of factors that can influence Capcom’s operating results.
2 Capcom Public Relations & Investor Relations Section
4. Summary of Major Financial Information 22
page
1. Forecasts for FY3/17 3
Contents
3. Business Segments 12
2. Financial Highlights 6
3 Capcom Public Relations & Investor Relations Section
Forecast for fiscal year ending
March 31, 2017
4 Capcom Public Relations & Investor Relations Section
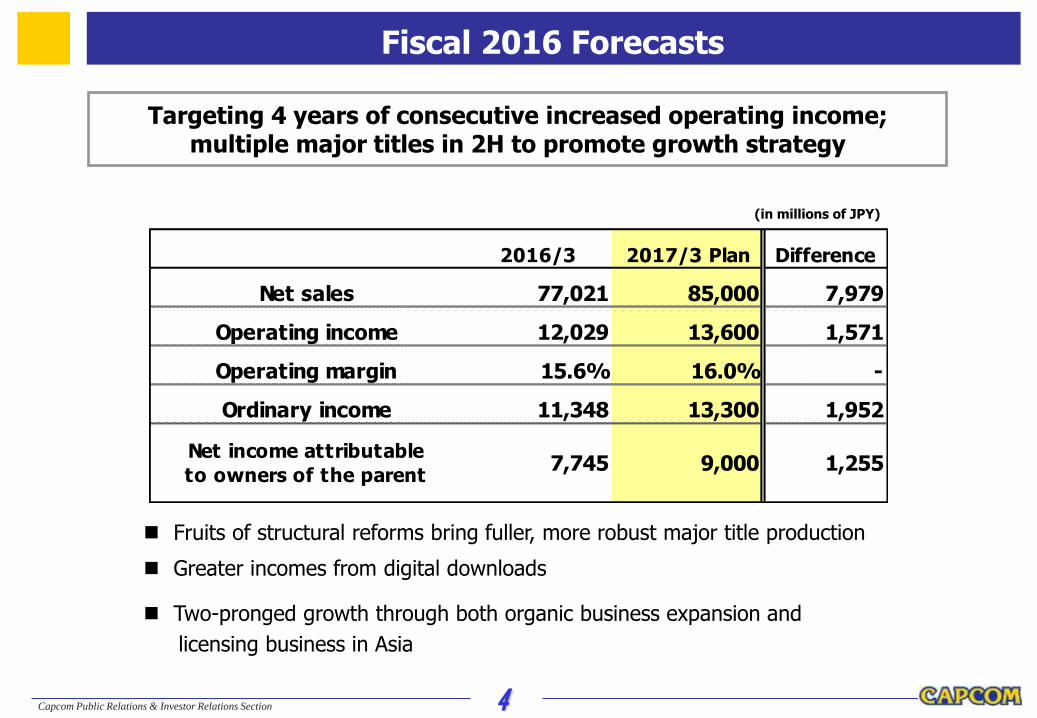
2016/3 2017/3 Plan Difference
Net sales 77,021 85,000 7,979
Operating income 12,029 13,600 1,571
Operating margin 15.6% 16.0% -
Ordinary income 11,348 13,300 1,952
Net income attributable
to owners of the parent7,745 9,000 1,255
Targeting 4 years of consecutive increased operating income; multiple major titles in 2H to promote growth strategy
Fruits of structural reforms bring fuller, more robust major title production
Greater incomes from digital downloads
Two-pronged growth through both organic business expansion and
licensing business in Asia
(in millions of JPY)
Fiscal 2016 Forecasts

5 Capcom Public Relations & Investor Relations Section
Strengthen the Consumer business
Resident Evil 7 biohazard January 2017 release announced Full PlayStation®VR support
PS4 demo broke 2 million downloads (as of June 26)
Received various awards at E3 (Electronic Entertainment Expo)
More than 20 awards including:
• GameSpot : Best of E3 2016 Winner
• GamesRadar+ : Best of E3 2016 Award
• VG24/7 : Editor’s Choice Award E3 2016
Dead Rising 4 Holiday 2016 release announced
Growth Strategy Updates
Business Segment Highlights
6 Capcom Public Relations & Investor Relations Section
Financial Highlights
7 Capcom Public Relations & Investor Relations Section
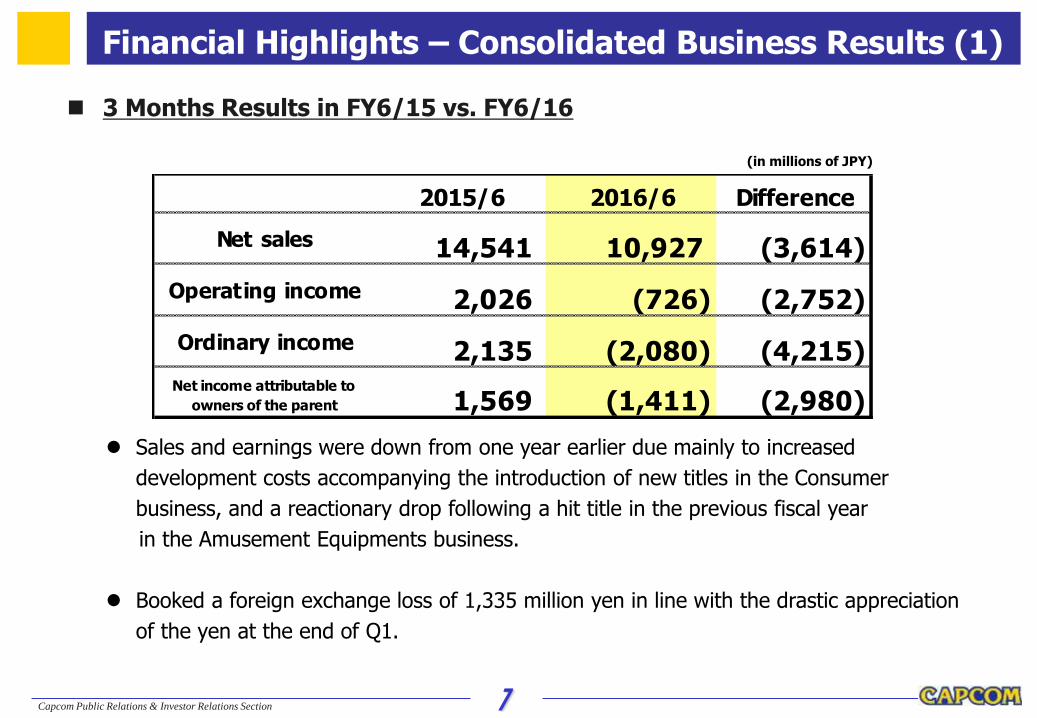
2015/6 2016/6 Difference
Net sales 14,541 10,927 (3,614)
Operating income 2,026 (726) (2,752)
Ordinary income 2,135 (2,080) (4,215)Net income attributable to
owners of the parent 1,569 (1,411) (2,980)
Sales and earnings were down from one year earlier due mainly to increased
development costs accompanying the introduction of new titles in the Consumer
business, and a reactionary drop following a hit title in the previous fiscal year
in the Amusement Equipments business.
Booked a foreign exchange loss of 1,335 million yen in line with the drastic appreciation
of the yen at the end of Q1.
3 Months Results in FY6/15 vs. FY6/16
(in millions of JPY)
Financial Highlights – Consolidated Business Results (1)
8 Capcom Public Relations & Investor Relations Section
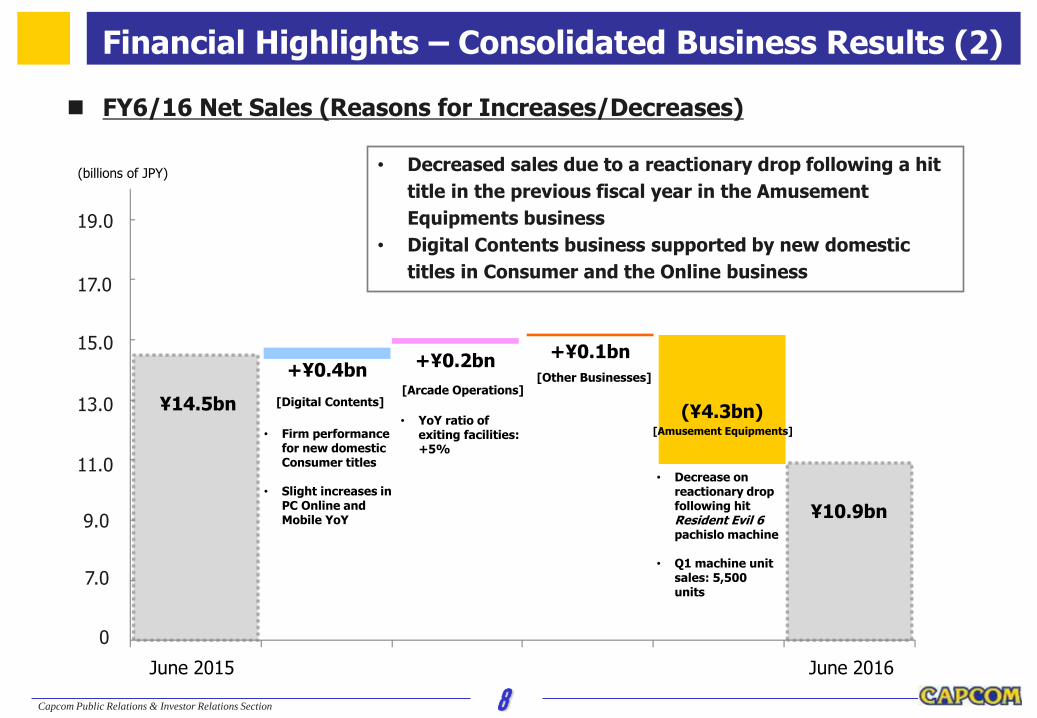
¥14.5bn
¥10.9bn
+¥0.4bn +¥0.1bn +¥0.2bn
• YoY ratio of exiting facilities: +5%
• Decrease on reactionary drop following hit Resident Evil 6 pachislo machine
• Q1 machine unit sales: 5,500 units
0
• Firm performance for new domestic Consumer titles
• Slight increases in PC Online and Mobile YoY
(¥4.3bn)
• Decreased sales due to a reactionary drop following a hit
title in the previous fiscal year in the Amusement
Equipments business
• Digital Contents business supported by new domestic
titles in Consumer and the Online business
FY6/16 Net Sales (Reasons for Increases/Decreases)
(billions of JPY)
19.0
9.0
11.0
13.0
15.0
17.0
7.0
[Digital Contents] [Arcade Operations]
[Other Businesses]
[Amusement Equipments]
June 2015 June 2016
Financial Highlights – Consolidated Business Results (2)
9 Capcom Public Relations & Investor Relations Section
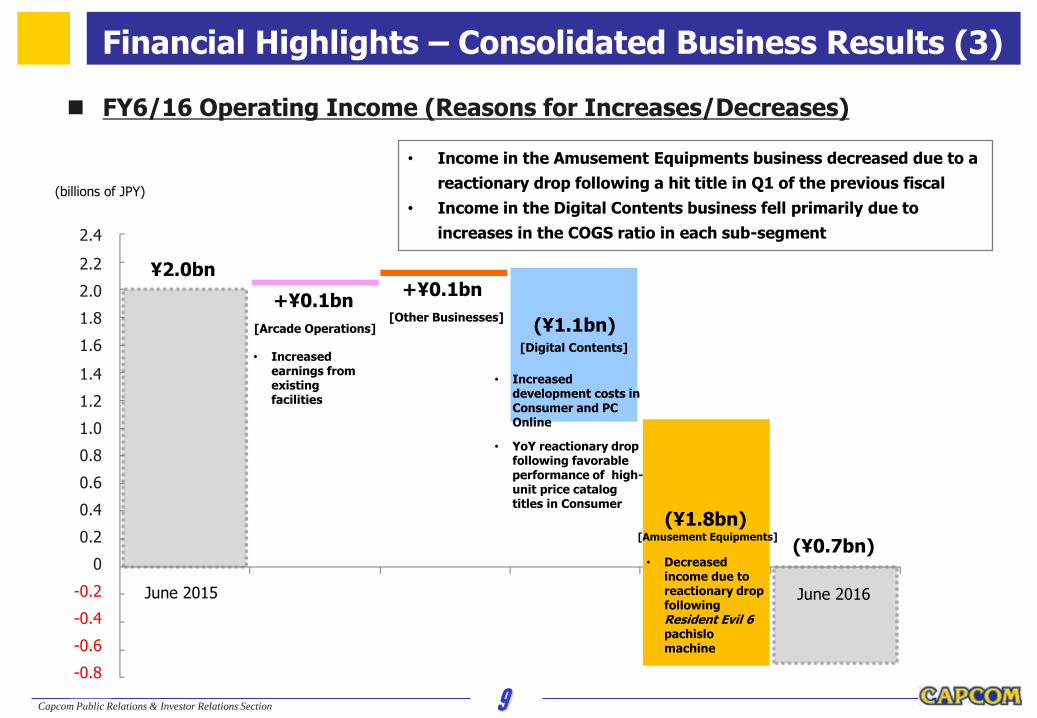
• Income in the Amusement Equipments business decreased due to a
reactionary drop following a hit title in Q1 of the previous fiscal
• Income in the Digital Contents business fell primarily due to
increases in the COGS ratio in each sub-segment
(¥0.7bn)
(¥1.1bn)
(¥1.8bn)
+¥0.1bn +¥0.1bn
• Increased development costs in Consumer and PC Online
• YoY reactionary drop following favorable performance of high-unit price catalog titles in Consumer
• Decreased income due to reactionary drop following Resident Evil 6 pachislo machine
• Increased earnings from existing facilities
¥2.0bn
FY6/16 Operating Income (Reasons for Increases/Decreases)
(billions of JPY)
2.4
2.2
2.0
1.8
1.6
1.4
1.2
1.0
0.8
0.6
0.4
0.2
0
-0.2
-0.4
-0.6
-0.8
June 2015 June 2016
[Digital Contents]
[Arcade Operations] [Other Businesses]
[Amusement Equipments]
Financial Highlights – Consolidated Business Results (3)
10 Capcom Public Relations & Investor Relations Section
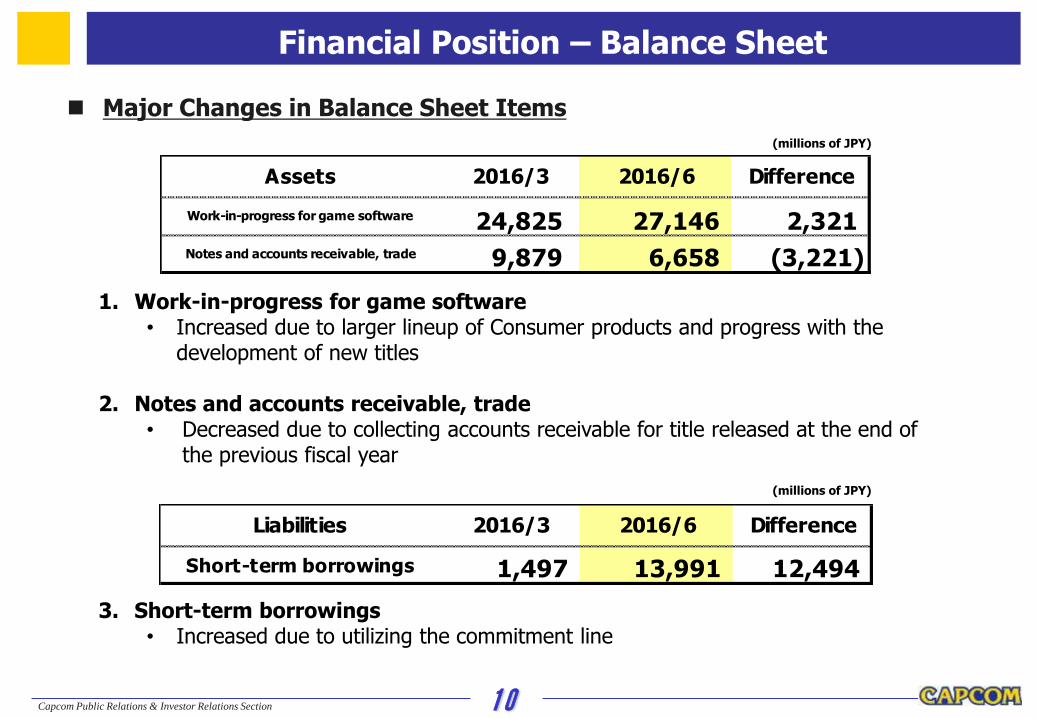
Assets 2016/3 2016/6 Difference
Work-in-progress for game software 24,825 27,146 2,321Notes and accounts receivable, trade 9,879 6,658 (3,221)
Major Changes in Balance Sheet Items
3. Short-term borrowings • Increased due to utilizing the commitment line
1. Work-in-progress for game software • Increased due to larger lineup of Consumer products and progress with the
development of new titles
2. Notes and accounts receivable, trade • Decreased due to collecting accounts receivable for title released at the end of
the previous fiscal year
(millions of JPY)
(millions of JPY)
Liabilities 2016/3 2016/6 Difference
Short-term borrowings 1,497 13,991 12,494
Financial Position – Balance Sheet
11 Capcom Public Relations & Investor Relations Section
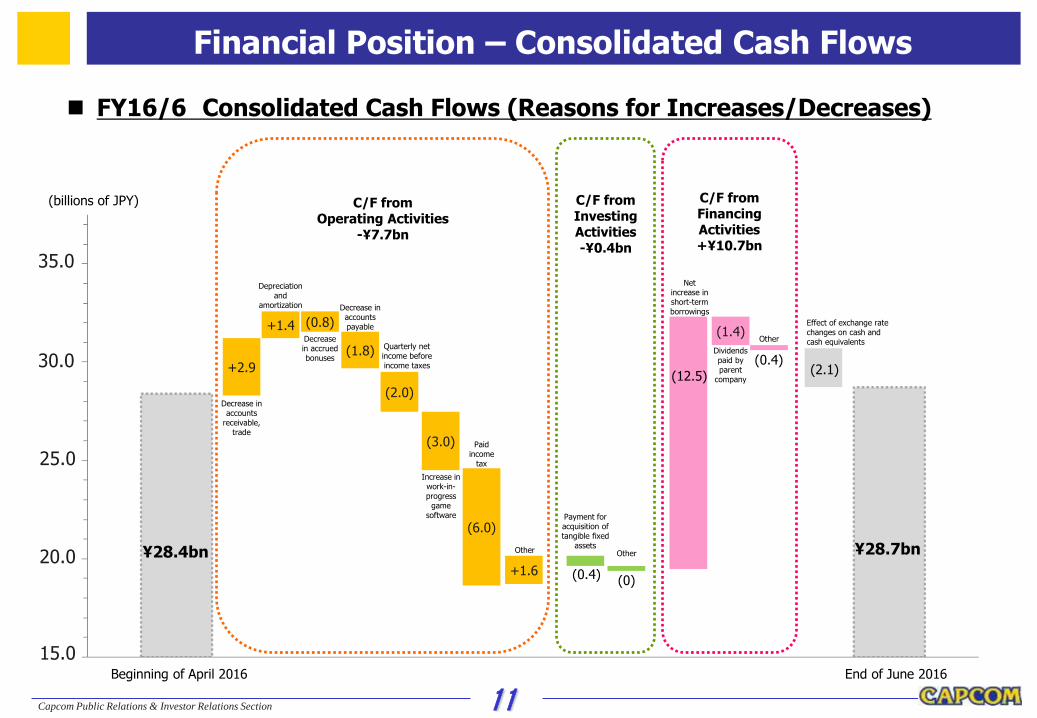
(0.4)
+2.9
+1.6
+1.4
(3.0)
(2.0)
(1.4)
¥28.4bn ¥28.7bn
C/F from Operating Activities
-¥7.7bn
C/F from Investing Activities -¥0.4bn
C/F from Financing Activities +¥10.7bn
Depreciation and
amortization
Decrease in accrued bonuses
Decrease in accounts
receivable, trade
Payment for acquisition of tangible fixed
assets Other
Net increase in short-term borrowings
Other
Dividends paid by parent
company
Effect of exchange rate changes on cash and cash equivalents
(12.5) (2.1)
(0)
(1.8)
Decrease in accounts payable
Increase in work-in-progress
game software
(0.8)
(6.0)
Paid income
tax
(0.4)
FY16/6 Consolidated Cash Flows (Reasons for Increases/Decreases)
(billions of JPY)
35.0
30.0
25.0
20.0
15.0
Other
Beginning of April 2016 End of June 2016
Financial Position – Consolidated Cash Flows
Quarterly net income before income taxes
12 Capcom Public Relations & Investor Relations Section
Business Segments
13 Capcom Public Relations & Investor Relations Section
Digital Contents business
14 Capcom Public Relations & Investor Relations Section
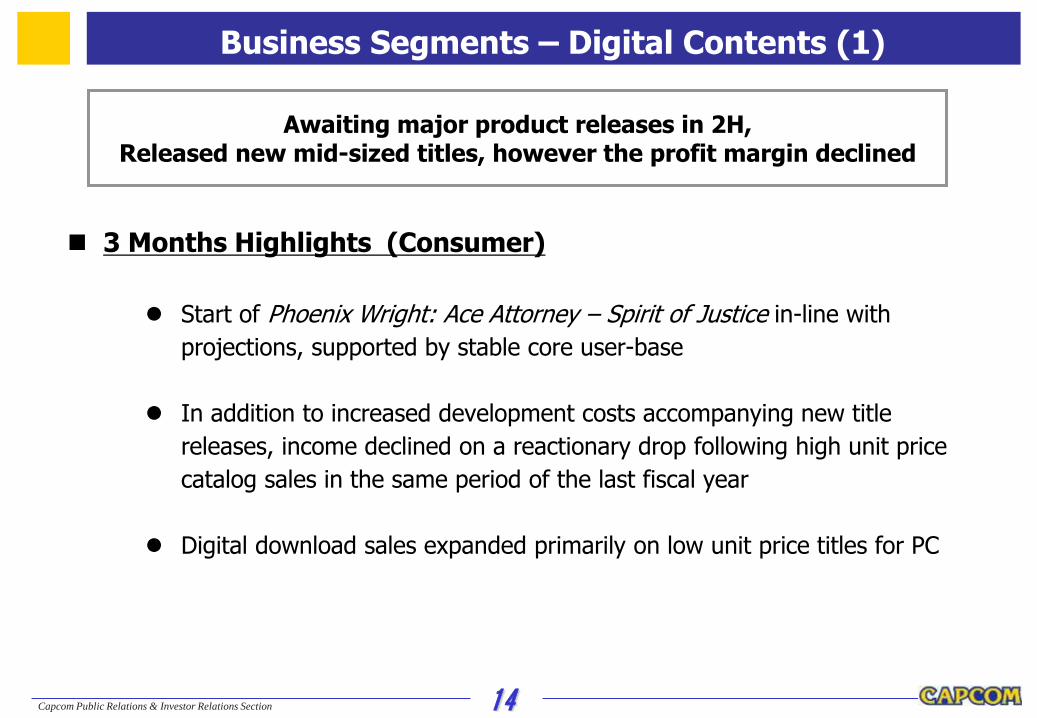
3 Months Highlights (Consumer)
Start of Phoenix Wright: Ace Attorney – Spirit of Justice in-line with
projections, supported by stable core user-base
In addition to increased development costs accompanying new title
releases, income declined on a reactionary drop following high unit price
catalog sales in the same period of the last fiscal year
Digital download sales expanded primarily on low unit price titles for PC
Awaiting major product releases in 2H, Released new mid-sized titles, however the profit margin declined
Business Segments – Digital Contents (1)
15 Capcom Public Relations & Investor Relations Section
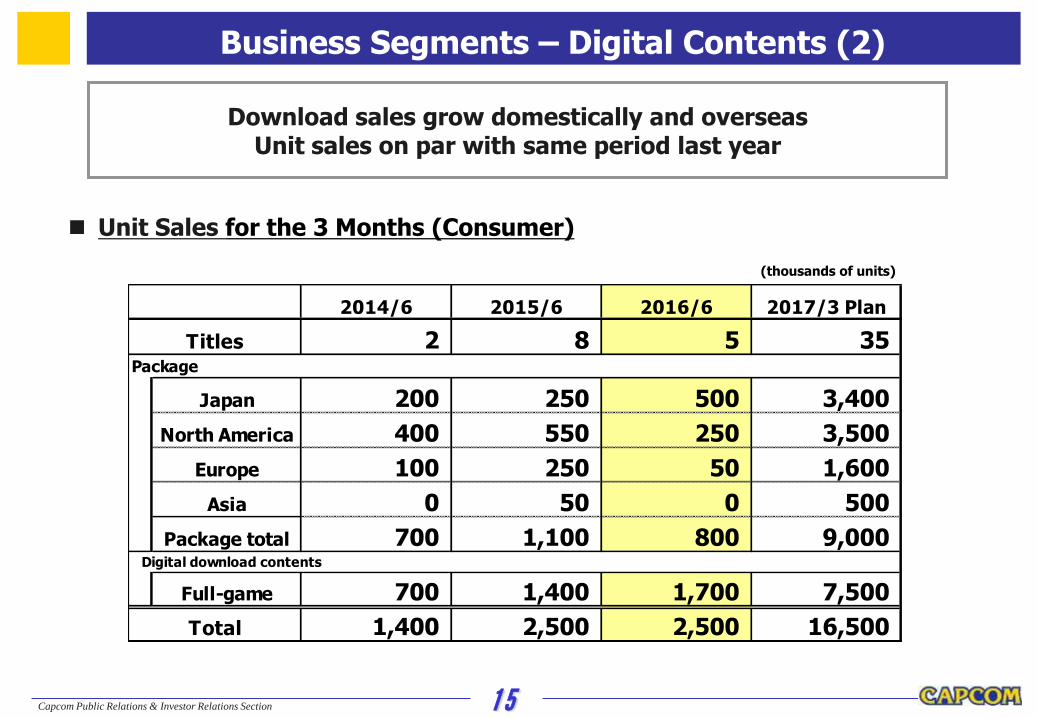
2014/6 2015/6 2016/6 2017/3 Plan
2 8 5 35Package
Japan 200 250 500 3,400
North America 400 550 250 3,500
Europe 100 250 50 1,600
Asia 0 50 0 500
Package total 700 1,100 800 9,000 Digital download contents
Full-game 700 1,400 1,700 7,500
1,400 2,500 2,500 16,500
Titles
Total
Unit Sales for the 3 Months (Consumer)
(thousands of units)
Download sales grow domestically and overseas Unit sales on par with same period last year
Business Segments – Digital Contents (2)
16 Capcom Public Relations & Investor Relations Section
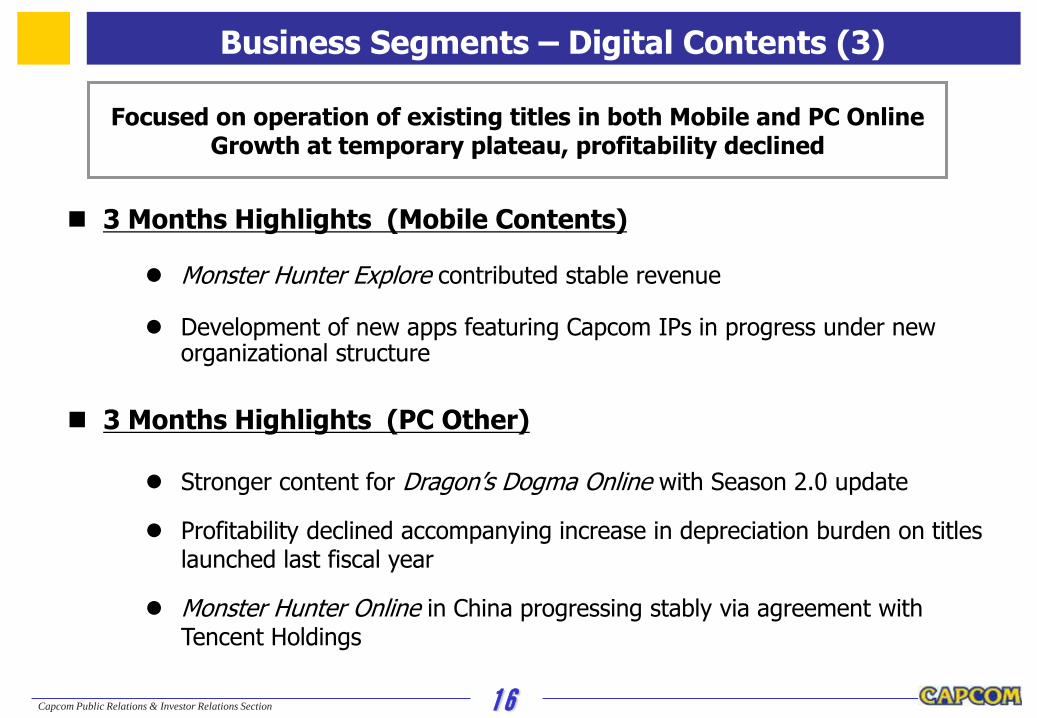
3 Months Highlights (Mobile Contents)
Monster Hunter Explore contributed stable revenue
Development of new apps featuring Capcom IPs in progress under new organizational structure
3 Months Highlights (PC Other)
Stronger content for Dragon’s Dogma Online with Season 2.0 update
Profitability declined accompanying increase in depreciation burden on titles
launched last fiscal year
Monster Hunter Online in China progressing stably via agreement with Tencent Holdings
Focused on operation of existing titles in both Mobile and PC Online Growth at temporary plateau, profitability declined
Business Segments – Digital Contents (3)

17 Capcom Public Relations & Investor Relations Section
2015/6 2016/6 2017/3 Plan
62 67 590
11 0 143
17.6% 0.1% 24.2%Breakdown of net sales
28 25 330
18 21 140
46 46 470
6 9 40
10 12 80PC Other
Net sales
Operating income
Operating margin
Package
Consumer total
Mobile Contets
Digital download contents
Digital Contents Performance
Slight increase in net sales on upturn in Mobile and PC Online Income decreased with rising COGS in each sub-segment
(hundreds of millions of JPY)
Business Segments – Digital Contents (4)
18 Capcom Public Relations & Investor Relations Section
Arcade Operations business

19 Capcom Public Relations & Investor Relations Section
2014/6 2015/6 2016/6 2017/3 Plan
Net sales 22 19 21 90
Operating income 2 0 1 8
Operating margin 9.7% 1.8% 5.0% 8.9%
YoY Ratio of
existing arcades -7% -11% 5% ±0
2015/3 2016/3 2016/6 2017/3 Plan
New arcades 1 4 0 3
Closed arcades 1 3 0 0
Total 33 34 34 37
3 Months Highlights
YoY net sales of existing facilities: +5%
Character merchandise, prizes related to popular IPs driving sales
3 Months Business Results
(facilities) Number of Arcades
Market conditions show signs of recovery Sales and income up as existing facilities beat same period last year
(hundreds of millions of JPY)
Business Segments – Arcade Operations

20 Capcom Public Relations & Investor Relations Section
Amusement Equipments business
21 Capcom Public Relations & Investor Relations Section
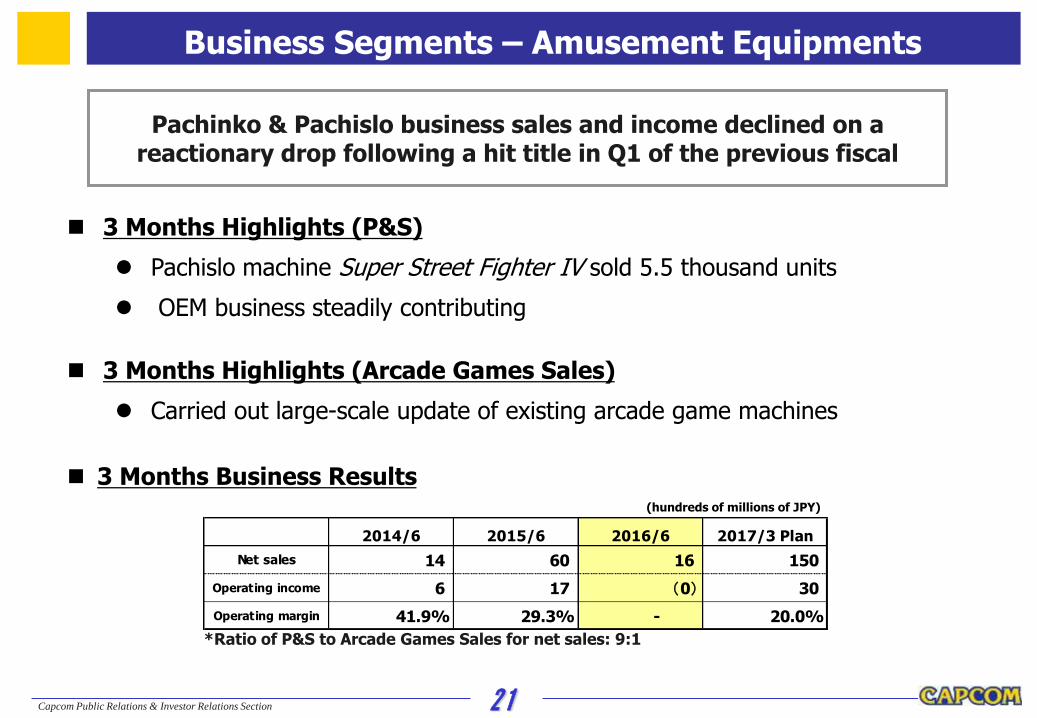
2014/6 2015/6 2016/6 2017/3 Plan
Net sales 14 60 16 150
Operating income 6 17 (0) 30
Operating margin 41.9% 29.3% - 20.0%
3 Months Highlights (Arcade Games Sales)
Carried out large-scale update of existing arcade game machines
3 Months Highlights (P&S)
Pachislo machine Super Street Fighter IV sold 5.5 thousand units
OEM business steadily contributing
3 Months Business Results
*Ratio of P&S to Arcade Games Sales for net sales: 9:1
Pachinko & Pachislo business sales and income declined on a reactionary drop following a hit title in Q1 of the previous fiscal
(hundreds of millions of JPY)
Business Segments – Amusement Equipments
22 Capcom Public Relations & Investor Relations Section
Summary of Major Financial Information
23 Capcom Public Relations & Investor Relations Section
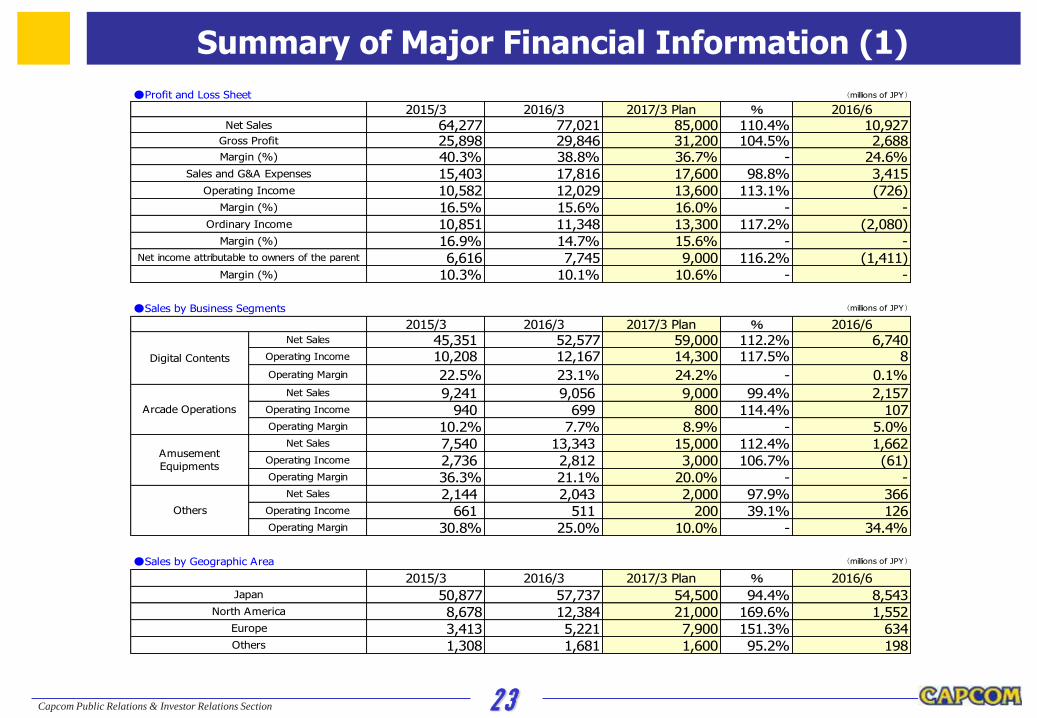
●Profit and Loss Sheet (millions of JPY)
2015/3 2016/3 2017/3 Plan % 2016/6Net Sales 64,277 77,021 85,000 110.4% 10,927
Gross Profit 25,898 29,846 31,200 104.5% 2,688Margin (%) 40.3% 38.8% 36.7% - 24.6%
Sales and G&A Expenses 15,403 17,816 17,600 98.8% 3,415Operating Income 10,582 12,029 13,600 113.1% (726)
Margin (%) 16.5% 15.6% 16.0% - -Ordinary Income 10,851 11,348 13,300 117.2% (2,080)
Margin (%) 16.9% 14.7% 15.6% - -Net income attributable to owners of the parent 6,616 7,745 9,000 116.2% (1,411)
Margin (%) 10.3% 10.1% 10.6% - -
●Sales by Business Segments (millions of JPY)
2015/3 2016/3 2017/3 Plan % 2016/6Net Sales 45,351 52,577 59,000 112.2% 6,740
Operating Income 10,208 12,167 14,300 117.5% 8
Operating Margin 22.5% 23.1% 24.2% - 0.1%Net Sales 9,241 9,056 9,000 99.4% 2,157
Operating Income 940 699 800 114.4% 107Operating Margin 10.2% 7.7% 8.9% - 5.0%
Net Sales 7,540 13,343 15,000 112.4% 1,662Operating Income 2,736 2,812 3,000 106.7% (61)Operating Margin 36.3% 21.1% 20.0% - -
Net Sales 2,144 2,043 2,000 97.9% 366Operating Income 661 511 200 39.1% 126Operating Margin 30.8% 25.0% 10.0% - 34.4%
●Sales by Geographic Area (millions of JPY)
2015/3 2016/3 2017/3 Plan % 2016/6
50,877 57,737 54,500 94.4% 8,543
8,678 12,384 21,000 169.6% 1,552
3,413 5,221 7,900 151.3% 634
1,308 1,681 1,600 95.2% 198
Others
Amusement
Equipments
Arcade Operations
Digital Contents
Others
Europe
North America
Japan
Summary of Major Financial Information (1)
24 Capcom Public Relations & Investor Relations Section
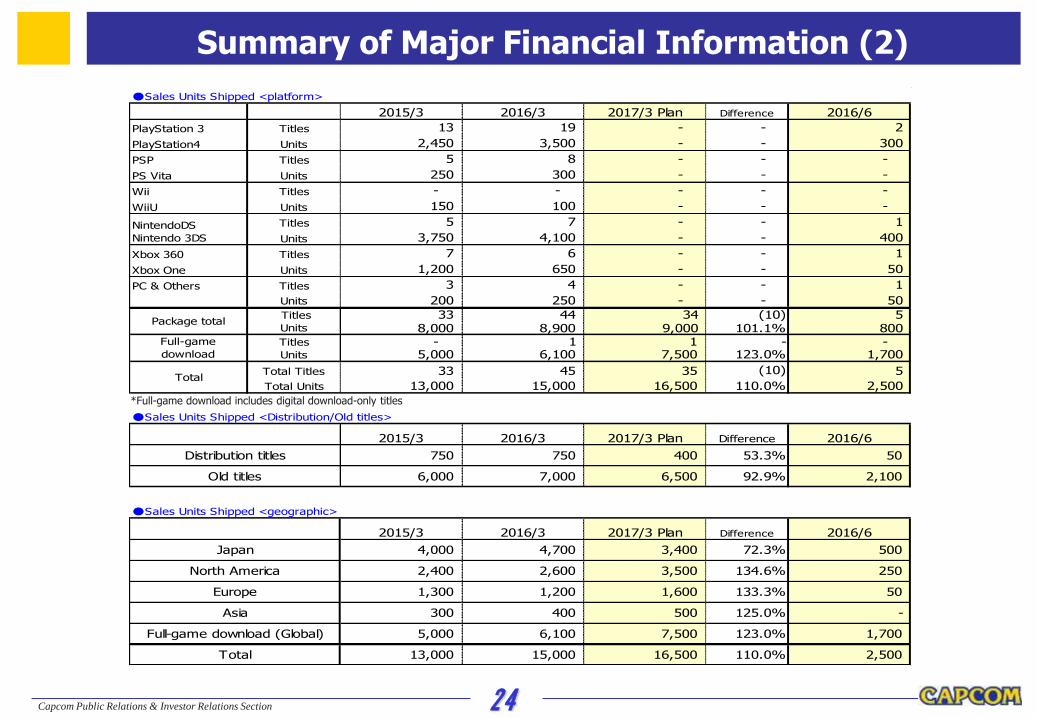
●Sales Units Shipped <platform>
2015/3 2016/3 2017/3 Plan Difference 2016/6
PlayStation 3 Titles 13 19 - - 2
PlayStation4 Units 2,450 3,500 - - 300
PSP Titles 5 8 - - -
PS Vita Units 250 300 - - -
Wii Titles - - - - -
WiiU Units 150 100 - - -
Titles 5 7 - - 1
Units 3,750 4,100 - - 400
Xbox 360 Titles 7 6 - - 1
Xbox One Units 1,200 650 - - 50
PC & Others Titles 3 4 - - 1
Units 200 250 - - 50
Titles 33 44 34 (10) 5 Units 8,000 8,900 9,000 101.1% 800 Titles - 1 1 - - Units 5,000 6,100 7,500 123.0% 1,700
Total Titles 33 45 35 (10) 5
Total Units 13,000 15,000 16,500 110.0% 2,500
●Sales Units Shipped <Distribution/Old titles>
2015/3 2016/3 2017/3 Plan Difference 2016/6
750 750 400 53.3% 50
6,000 7,000 6,500 92.9% 2,100
●Sales Units Shipped <geographic>
2015/3 2016/3 2017/3 Plan Difference 2016/6
4,000 4,700 3,400 72.3% 500
2,400 2,600 3,500 134.6% 250
1,300 1,200 1,600 133.3% 50
300 400 500 125.0% -
5,000 6,100 7,500 123.0% 1,700
13,000 15,000 16,500 110.0% 2,500
Full-game download (Global)
Total
Japan
Distribution titles
Old titles
North America
Europe
Asia
Package total
Full-game
download
NintendoDS
Nintendo 3DS
Total
*Full-game download includes digital download-only titles
Summary of Major Financial Information (2)