fy2022 1st quarter financial results
TRANSCRIPT
KONAMI HOLDINGS CORPORATION
August 5, 2021
FY2022 1st Quarter Financial ResultsThree months ended June 30, 2021
2
Statements made in this presentation with respect to KONAMI HOLDINGS’ current plans, estimates,
strategies and beliefs, including forecasts, are forward-looking statements about the future
performance of the Company. These statements are based on management’s assumptions and
beliefs in light of information currently available to it and, therefore, you should not place undue
reliance on them. A number of important factors could cause actual results to be materially different
from and worse than those discussed in forward-looking statements. Such factors include, but are not
limited to (1) Changes in economic conditions affecting our operations; (2) Fluctuations in foreign
exchange rates, particularly with respect to the value of the Japanese yen, the U.S. dollar and the
Euro; (3) the Company’s ability to continue to win acceptance of our products, which are offered in
highly competitive markets characterized by the continuous introduction of new products, rapid
developments in technology and subjective and changing consumer preferences; (4) the Company’s
ability to successfully expand internationally with a focus on our Digital Entertainment business,
Amusement business and Gaming & Systems business; (5) the Company’s ability to successfully
expand the scope of our business and broaden our customer base through our Sports business; (6)
Regulatory developments and changes and our ability to respond and adapt to those changes; (7)
the Company’s expectations with regard to further acquisitions and the integration of any companies
we may acquire; and (8) the outcome of contingencies.
- Financial information included herein is not audited by independent public accountants
(1) Numbers included in this presentation material are;
a) in accordance with IFRS
b) rounded to the nearest one hundred million yen
(2) Revenues of each segment include inter-segment sales
Cautionary statement with respect to forward-looking statements
3
➢ Consolidated Financial Results 4
➢ Revenue by Business Segment 5
➢ Profit by Business Segment 6
➢ Earnings Guidance for FY2022 7
➢ Dividend Forecast for FY2022 8
➢ Digital Entertainment 9
➢ Amusement 10
➢ Gaming & Systems 11
➢ Sports 12
➢ Titles Released in Apr - Jun 2021 / Pipeline 13
➢ Consolidated Business Performance 15
➢ Consolidated Financial Position 16
➢ Consolidated Cash Flows 17
Contents
4
Consolidated Financial Results
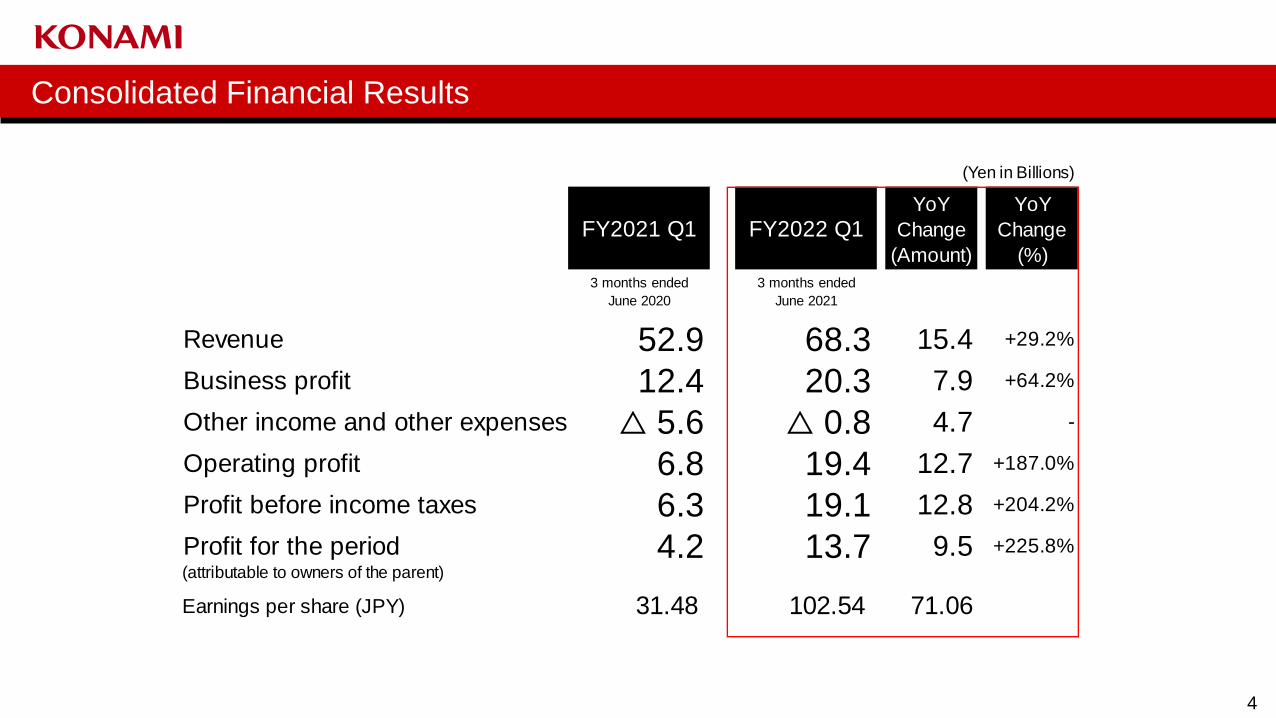
(Yen in Billions)
FY2021 Q1 FY2022 Q1YoY
Change
(Amount)
YoY
Change
(%)
3 months ended
June 2020
3 months ended
June 2021
Revenue 52.9 68.3 15.4 +29.2%
Business profit 12.4 20.3 7.9 +64.2%
Other income and other expenses △ 5.6 △ 0.8 4.7 -
Operating profit 6.8 19.4 12.7 +187.0%
Profit before income taxes 6.3 19.1 12.8 +204.2%
Profit for the period 4.2 13.7 9.5 +225.8%
(attributable to owners of the parent)
Earnings per share (JPY) 31.48 102.54 71.06
5
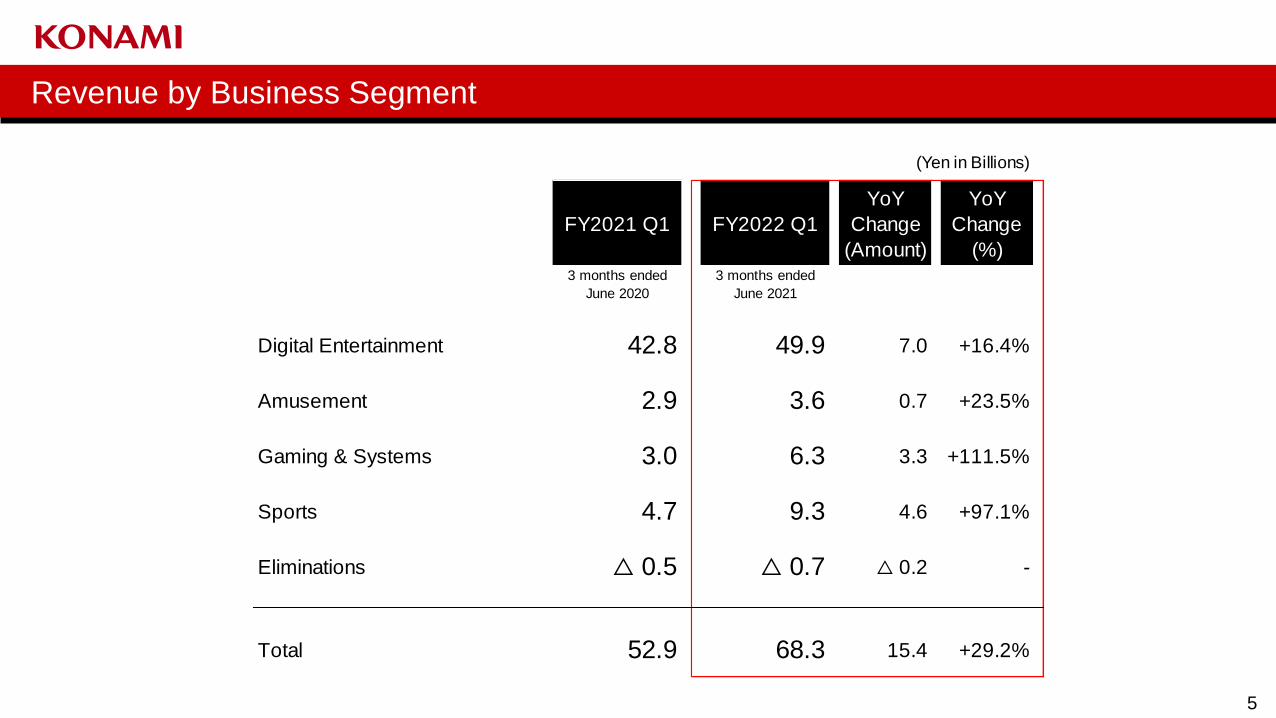
Revenue by Business Segment
(Yen in Billions)
FY2021 Q1 FY2022 Q1
YoY
Change
(Amount)
YoY
Change
(%)3 months ended
June 2020
3 months ended
June 2021
Digital Entertainment 42.8 49.9 7.0 +16.4%
Amusement 2.9 3.6 0.7 +23.5%
Gaming & Systems 3.0 6.3 3.3 +111.5%
Sports 4.7 9.3 4.6 +97.1%
Eliminations △ 0.5 △ 0.7 △ 0.2 -
Total 52.9 68.3 15.4 +29.2%
6
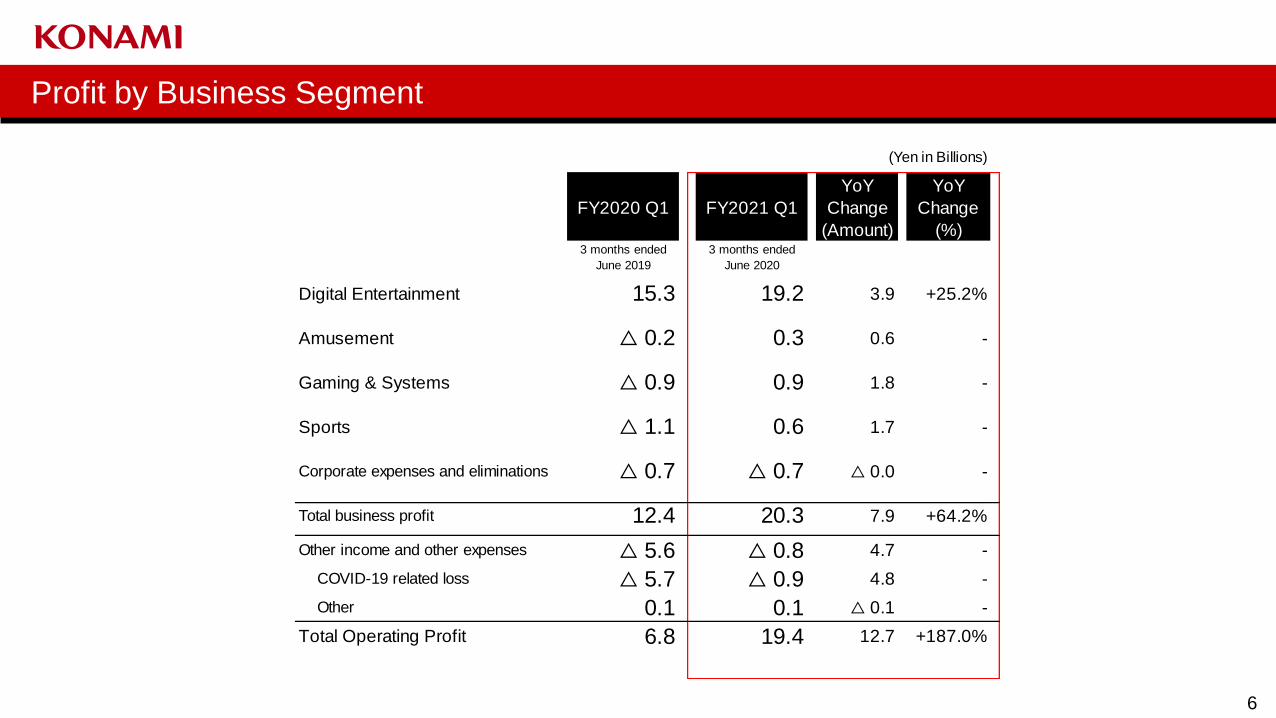
Profit by Business Segment
(Yen in Billions)
FY2020 Q1 FY2021 Q1
YoY
Change
(Amount)
YoY
Change
(%)3 months ended
June 2019
3 months ended
June 2020
Digital Entertainment 15.3 19.2 3.9 +25.2%
Amusement △ 0.2 0.3 0.6 -
Gaming & Systems △ 0.9 0.9 1.8 -
Sports △ 1.1 0.6 1.7 -
Corporate expenses and eliminations △ 0.7 △ 0.7 △ 0.0 -
Total business profit 12.4 20.3 7.9 +64.2%
Other income and other expenses △ 5.6 △ 0.8 4.7 -
COVID-19 related loss △ 5.7 △ 0.9 4.8 -
Other 0.1 0.1 △ 0.1 -
Total Operating Profit 6.8 19.4 12.7 +187.0%
7
Earnings visibility remains low given COVID-19 related factors including
declarations of state-of-emergency and timeline of vaccine rollout.
Hence, consolidated earnings outlook for the fiscal year ending March 2022
has not been determined with the challenging circumstances to make a
reasonable calculation.
We will promptly disclose our guidance when a reasonable projection
becomes possible.
Earnings and dividend guidance for FY2022 (TBD)
8
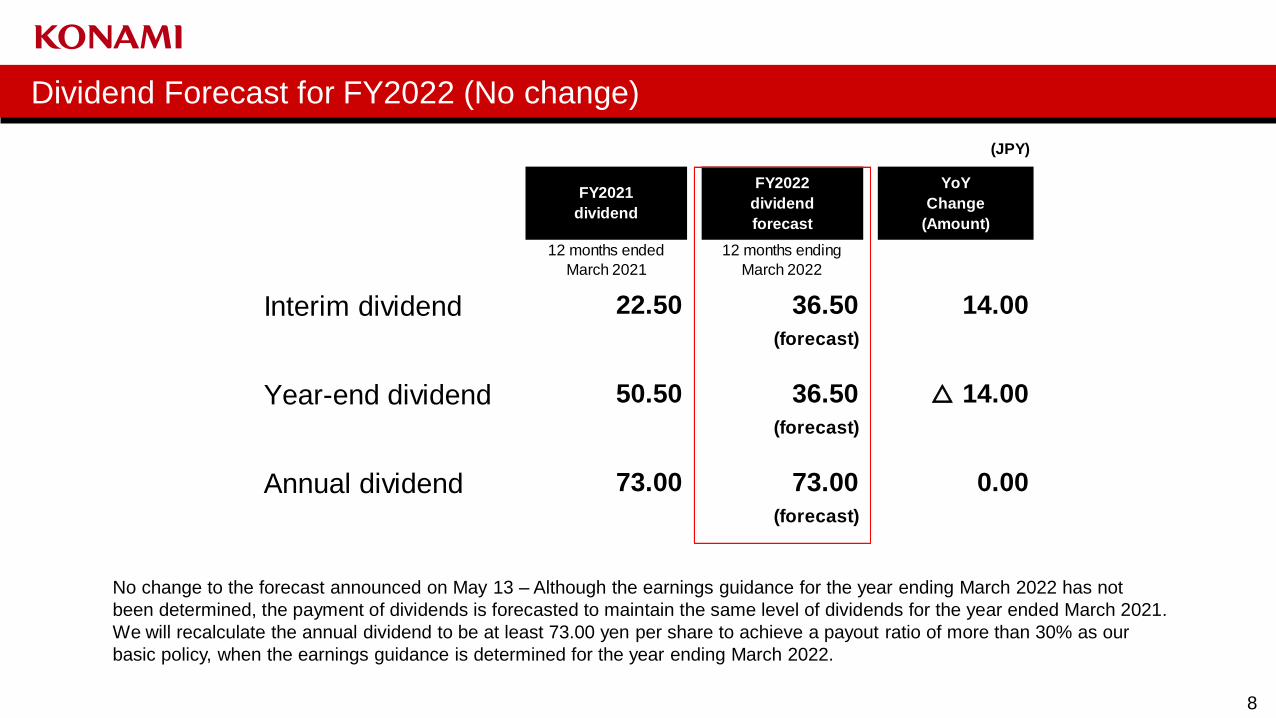
No change to the forecast announced on May 13 – Although the earnings guidance for the year ending March 2022 has not
been determined, the payment of dividends is forecasted to maintain the same level of dividends for the year ended March 2021.
We will recalculate the annual dividend to be at least 73.00 yen per share to achieve a payout ratio of more than 30% as our
basic policy, when the earnings guidance is determined for the year ending March 2022.
Dividend Forecast for FY2022 (No change)
(JPY)
12 months ended
March 2021
12 months ending
March 2022
Interim dividend 22.50 36.50 14.00
(forecast)
Year-end dividend 50.50 36.50 △ 14.00
(forecast)
Annual dividend 73.00 73.00 0.00
(forecast)
FY2021
dividend
FY2022
dividend
forecast
YoY
Change
(Amount)
9
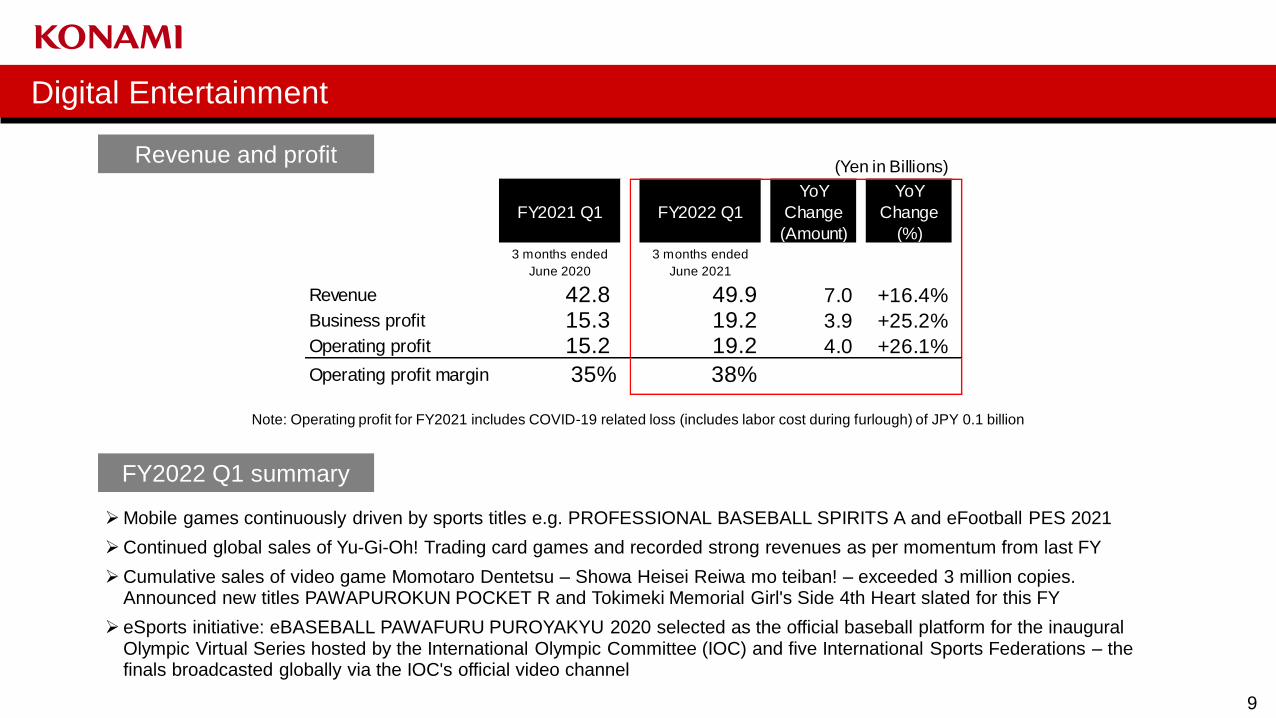
FY2022 Q1 summary
➢Mobile games continuously driven by sports titles e.g. PROFESSIONAL BASEBALL SPIRITS A and eFootball PES 2021
➢Continued global sales of Yu-Gi-Oh! Trading card games and recorded strong revenues as per momentum from last FY
➢Cumulative sales of video game Momotaro Dentetsu – Showa Heisei Reiwa mo teiban! – exceeded 3 million copies. Announced new titles PAWAPUROKUN POCKET R and Tokimeki Memorial Girl's Side 4th Heart slated for this FY
➢ eSports initiative: eBASEBALL PAWAFURU PUROYAKYU 2020 selected as the official baseball platform for the inaugural Olympic Virtual Series hosted by the International Olympic Committee (IOC) and five International Sports Federations – the finals broadcasted globally via the IOC's official video channel
Digital Entertainment
Note: Operating profit for FY2021 includes COVID-19 related loss (includes labor cost during furlough) of JPY 0.1 billion
(Yen in Billions)
FY2021 Q1 FY2022 Q1
YoY
Change
(Amount)
YoY
Change
(%)3 months ended
June 2020
3 months ended
June 2021
Revenue 42.8 49.9 7.0 +16.4%
Business profit 15.3 19.2 3.9 +25.2%
Operating profit 15.2 19.2 4.0 +26.1%
Operating profit margin 35% 38%
Revenue and profit
10
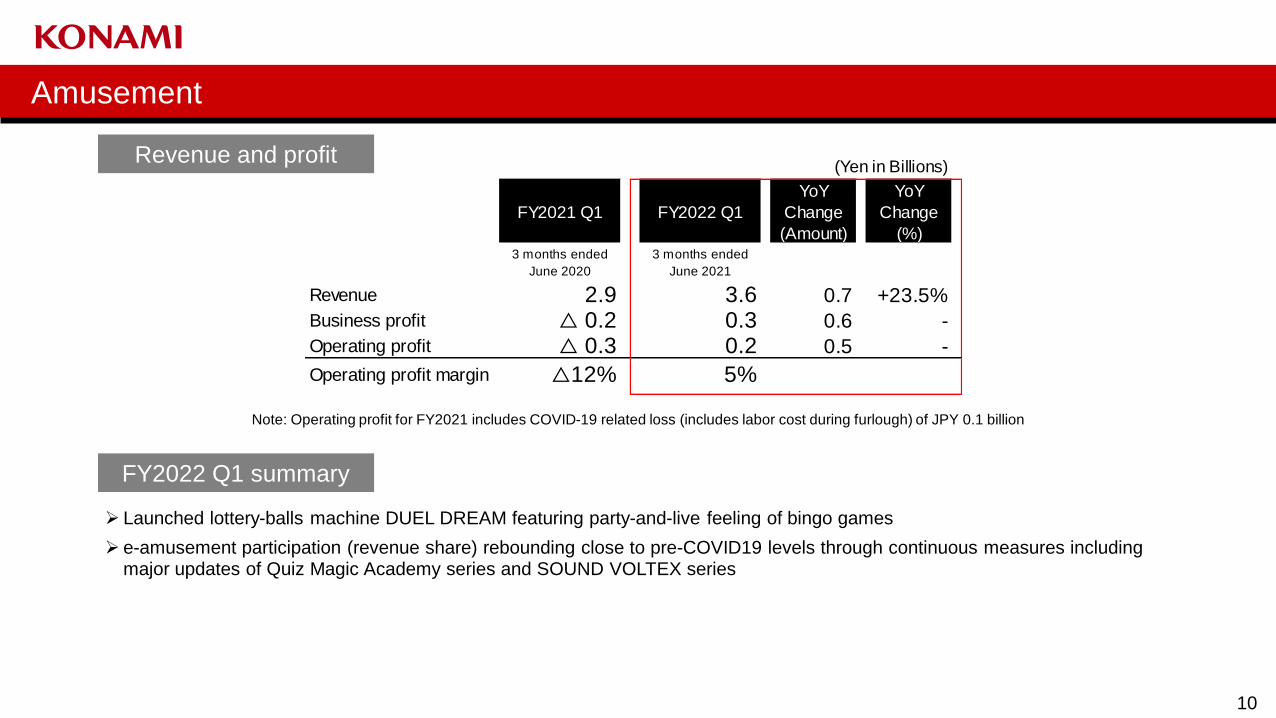
FY2022 Q1 summary
➢ Launched lottery-balls machine DUEL DREAM featuring party-and-live feeling of bingo games
➢ e-amusement participation (revenue share) rebounding close to pre-COVID19 levels through continuous measures including major updates of Quiz Magic Academy series and SOUND VOLTEX series
Amusement
Note: Operating profit for FY2021 includes COVID-19 related loss (includes labor cost during furlough) of JPY 0.1 billion
(Yen in Billions)
FY2021 Q1 FY2022 Q1
YoY
Change
(Amount)
YoY
Change
(%)3 months ended
June 2020
3 months ended
June 2021
Revenue 2.9 3.6 0.7 +23.5%
Business profit △ 0.2 0.3 0.6 -
Operating profit △ 0.3 0.2 0.5 -
Operating profit margin △12% 5%
Revenue and profit
11
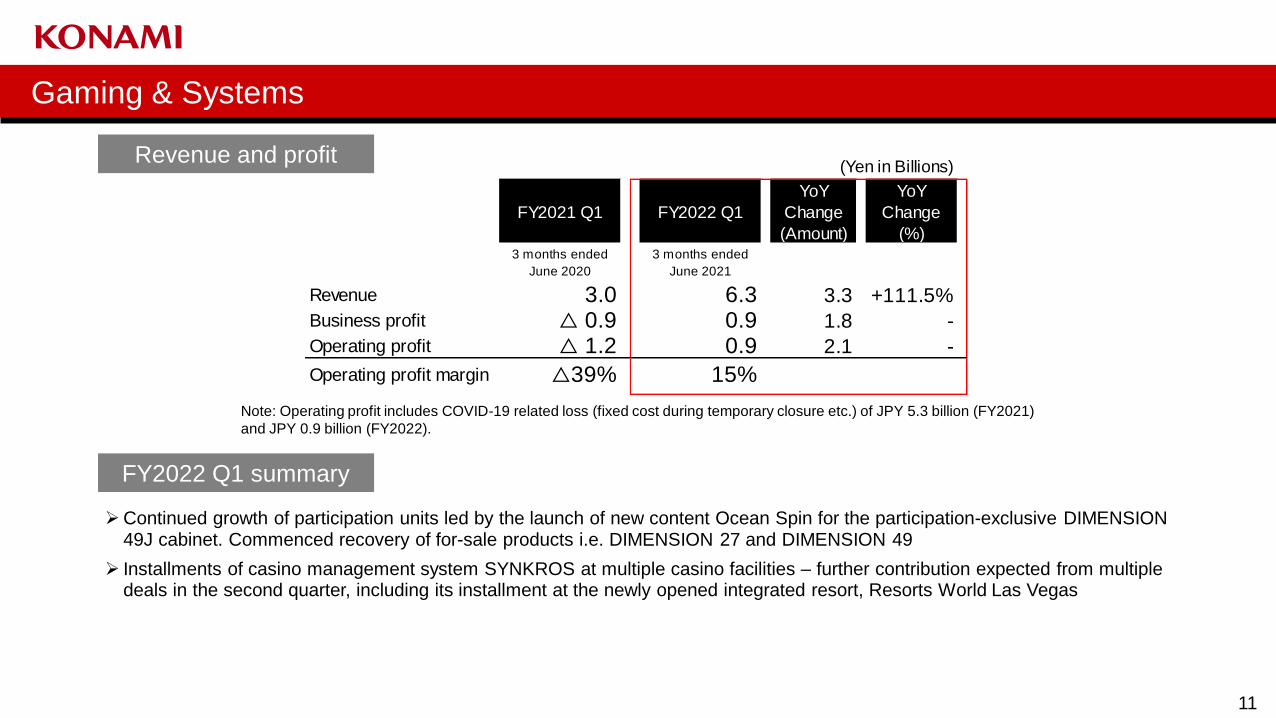
FY2022 Q1 summary
➢Continued growth of participation units led by the launch of new content Ocean Spin for the participation-exclusive DIMENSION 49J cabinet. Commenced recovery of for-sale products i.e. DIMENSION 27 and DIMENSION 49
➢ Installments of casino management system SYNKROS at multiple casino facilities – further contribution expected from multiple deals in the second quarter, including its installment at the newly opened integrated resort, Resorts World Las Vegas
Gaming & Systems
Note: Operating profit includes COVID-19 related loss (fixed cost during temporary closure etc.) of JPY 5.3 billion (FY2021)
and JPY 0.9 billion (FY2022).
(Yen in Billions)
FY2021 Q1 FY2022 Q1
YoY
Change
(Amount)
YoY
Change
(%)3 months ended
June 2020
3 months ended
June 2021
Revenue 3.0 6.3 3.3 +111.5%
Business profit △ 0.9 0.9 1.8 -
Operating profit △ 1.2 0.9 2.1 -
Operating profit margin △39% 15%
Revenue and profit
12
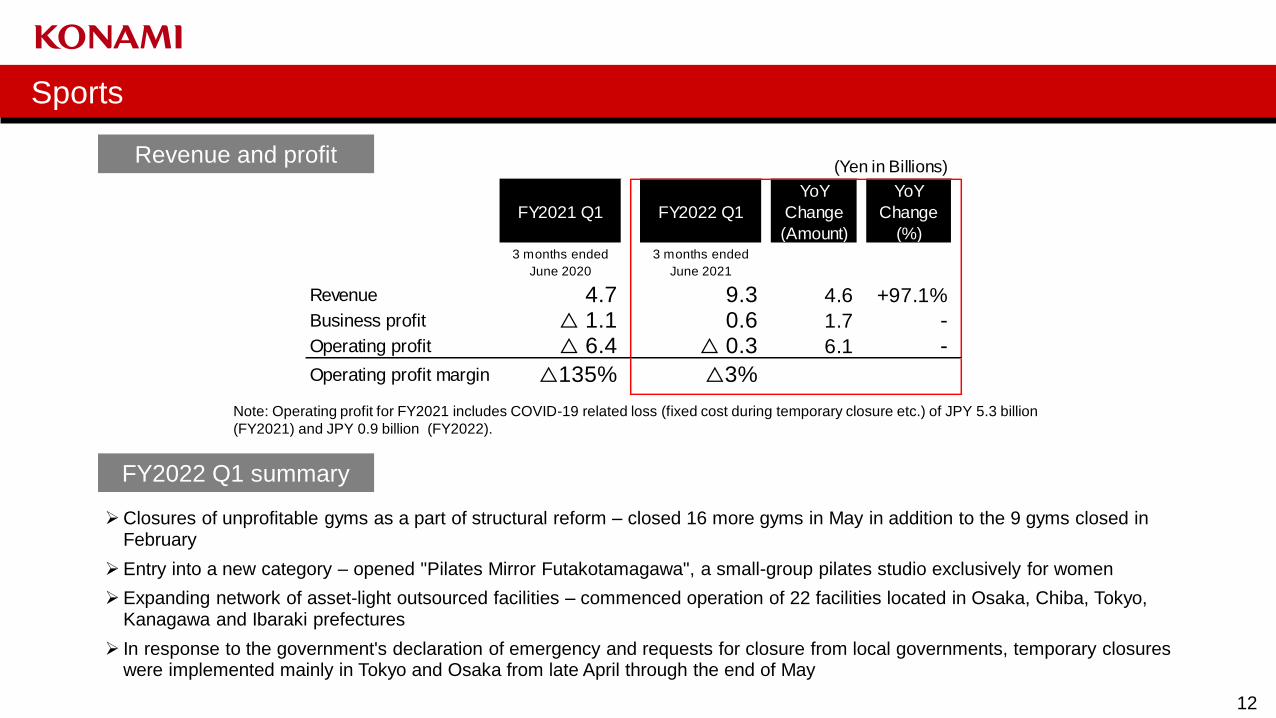
FY2022 Q1 summary
➢Closures of unprofitable gyms as a part of structural reform – closed 16 more gyms in May in addition to the 9 gyms closed in February
➢Entry into a new category – opened "Pilates Mirror Futakotamagawa", a small-group pilates studio exclusively for women
➢Expanding network of asset-light outsourced facilities – commenced operation of 22 facilities located in Osaka, Chiba, Tokyo, Kanagawa and Ibaraki prefectures
➢ In response to the government's declaration of emergency and requests for closure from local governments, temporary closures were implemented mainly in Tokyo and Osaka from late April through the end of May
Sports
Note: Operating profit for FY2021 includes COVID-19 related loss (fixed cost during temporary closure etc.) of JPY 5.3 billion
(FY2021) and JPY 0.9 billion (FY2022).
(Yen in Billions)
FY2021 Q1 FY2022 Q1
YoY
Change
(Amount)
YoY
Change
(%)3 months ended
June 2020
3 months ended
June 2021
Revenue 4.7 9.3 4.6 +97.1%
Business profit △ 1.1 0.6 1.7 -Operating profit △ 6.4 △ 0.3 6.1 -
Operating profit margin △135% △3%
Revenue and profit
13
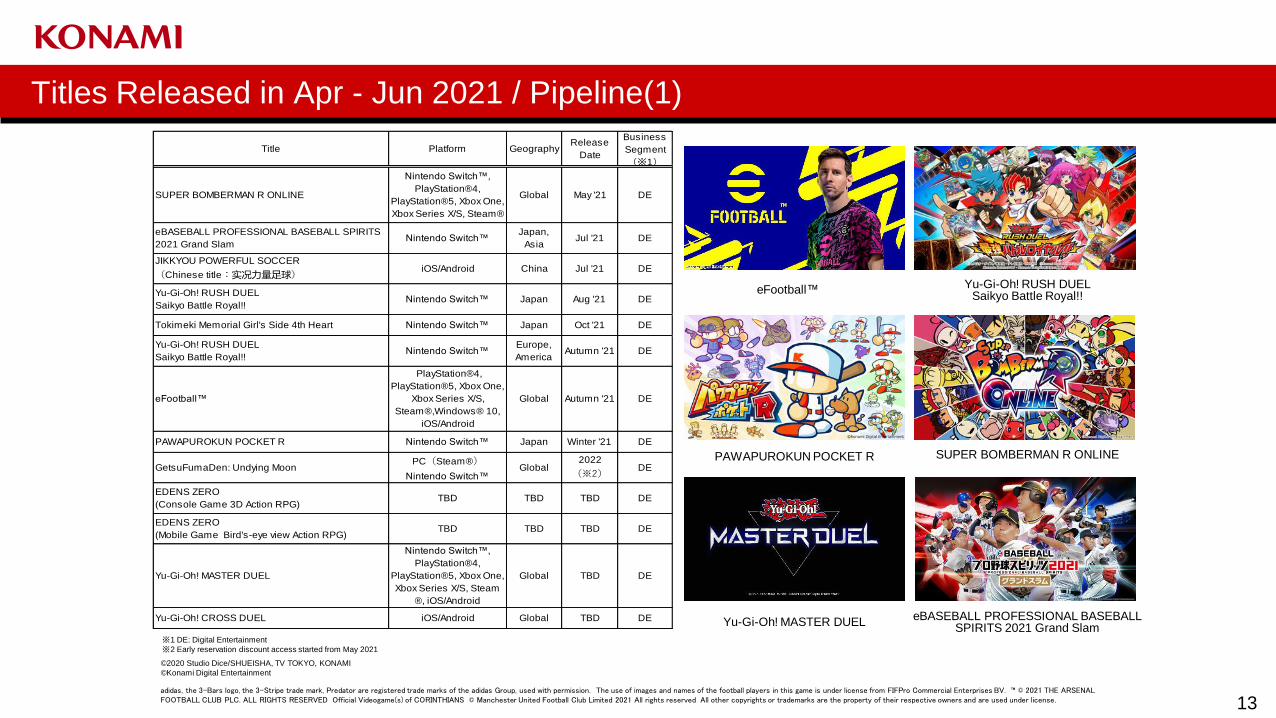
Titles Released in Apr - Jun 2021 / Pipeline(1)
※1 DE: Digital Entertainment
※2 Early reservation discount access started from May 2021
©2020 Studio Dice/SHUEISHA, TV TOKYO, KONAMI
©Konami Digital Entertainment
Yu-Gi-Oh! RUSH DUELSaikyo Battle Royal!!
eBASEBALL PROFESSIONAL BASEBALL SPIRITS 2021 Grand Slam
SUPER BOMBERMAN R ONLINEPAWAPUROKUN POCKET R
Yu-Gi-Oh! MASTER DUEL
eFootball™
Title Platform GeographyRelease
Date
Business
Segment
(※1)
SUPER BOMBERMAN R ONLINE
Nintendo Switch™,
PlayStation®4,
PlayStation®5, Xbox One,
Xbox Series X/S, Steam®
Global May '21 DE
eBASEBALL PROFESSIONAL BASEBALL SPIRITS
2021 Grand SlamNintendo Switch™
Japan,
AsiaJul '21 DE
JIKKYOU POWERFUL SOCCER
(Chinese title:实况力量足球)iOS/Android China Jul '21 DE
Yu-Gi-Oh! RUSH DUEL
Saikyo Battle Royal!!Nintendo Switch™ Japan Aug '21 DE
Tokimeki Memorial Girl's Side 4th Heart Nintendo Switch™ Japan Oct '21 DE
Yu-Gi-Oh! RUSH DUEL
Saikyo Battle Royal!!Nintendo Switch™
Europe,
AmericaAutumn '21 DE
eFootball™
PlayStation®4,
PlayStation®5, Xbox One,
Xbox Series X/S,
Steam®,Windows® 10,
iOS/Android
Global Autumn '21 DE
PAWAPUROKUN POCKET R Nintendo Switch™ Japan Winter '21 DE
GetsuFumaDen: Undying MoonPC(Steam®)
Nintendo Switch™Global
2022
(※2)DE
EDENS ZERO
(Console Game 3D Action RPG)TBD TBD TBD DE
EDENS ZERO
(Mobile Game Bird's-eye view Action RPG)TBD TBD TBD DE
Yu-Gi-Oh! MASTER DUEL
Nintendo Switch™,
PlayStation®4,
PlayStation®5, Xbox One,
Xbox Series X/S, Steam
®, iOS/Android
Global TBD DE
Yu-Gi-Oh! CROSS DUEL iOS/Android Global TBD DE
adidas, the 3-Bars logo, the 3-Stripe trade mark, Predator are registered trade marks of the adidas Group, used with permission. The use of images and names of the football players in this game is under license from FIFPro Commercial Enterprises BV. ™ © 2021 THE ARSENAL FOOTBALL CLUB PLC. ALL RIGHTS RESERVED Official Videogame(s) of CORINTHIANS © Manchester United Football Club Limited 2021 All rights reserved All other copyrights or trademarks are the property of their respective owners and are used under license.
14
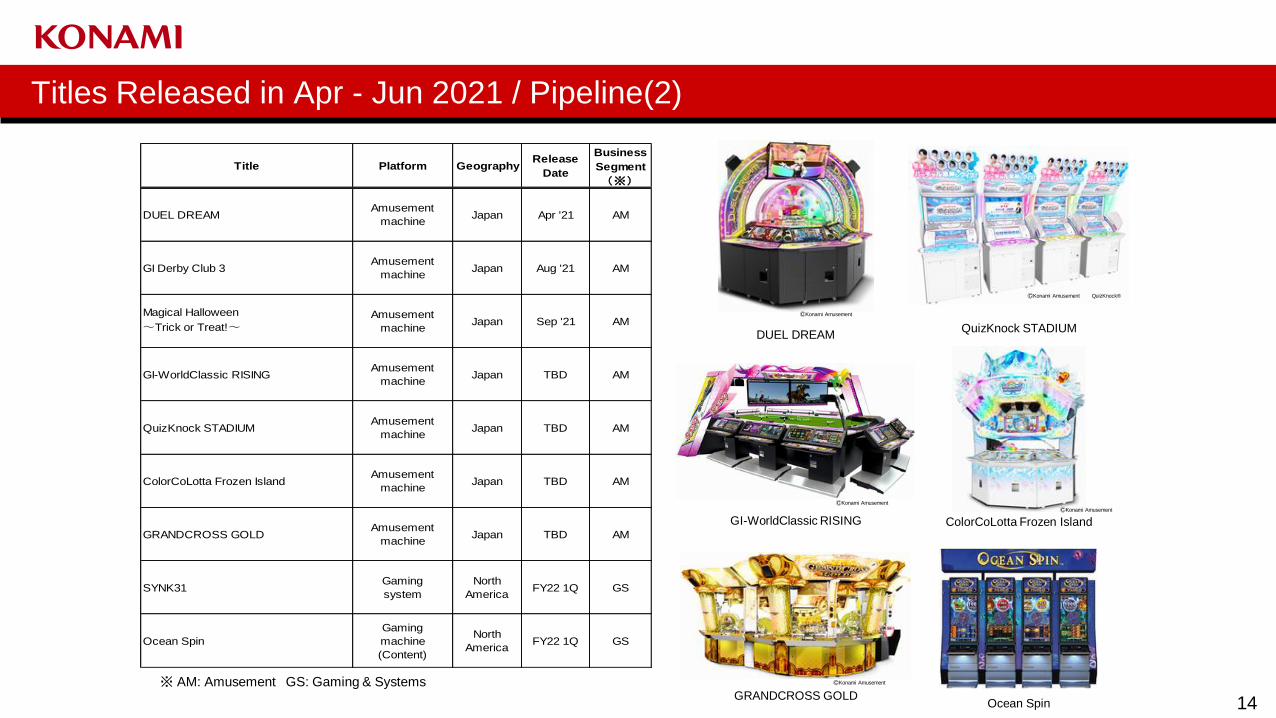
Titles Released in Apr - Jun 2021 / Pipeline(2)
※ AM: Amusement GS: Gaming & Systems
DUEL DREAM
ⒸKonami Amusement
QuizKnock STADIUM
Ocean Spin
GI-WorldClassic RISING
ⒸKonami Amusement
GRANDCROSS GOLD
ⒸKonami Amusement
ColorCoLotta Frozen IslandⒸKonami Amusement
ⒸKonami Amusement QuizKnock®
Title Platform GeographyRelease
Date
Business
Segment
(※)
DUEL DREAMAmusement
machineJapan Apr '21 AM
GI Derby Club 3Amusement
machineJapan Aug '21 AM
Magical Halloween
~Trick or Treat!~Amusement
machineJapan Sep '21 AM
GI-WorldClassic RISINGAmusement
machineJapan TBD AM
QuizKnock STADIUMAmusement
machineJapan TBD AM
ColorCoLotta Frozen IslandAmusement
machineJapan TBD AM
GRANDCROSS GOLDAmusement
machineJapan TBD AM
SYNK31Gaming
system
North
AmericaFY22 1Q GS
Ocean Spin
Gaming
machine
(Content)
North
AmericaFY22 1Q GS
15
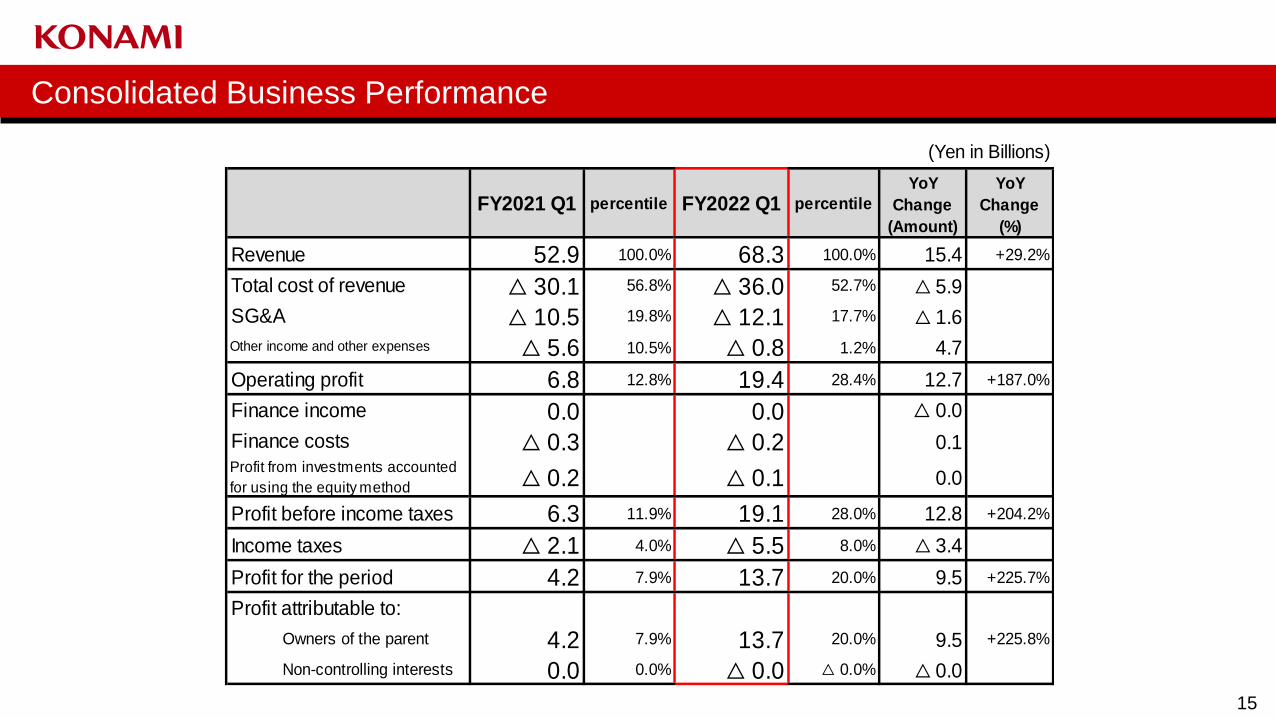
Consolidated Business Performance
(Yen in Billions)
52.9 100.0% 68.3 100.0% 15.4 +29.2%
△ 30.1 56.8% △ 36.0 52.7% △ 5.9
△ 10.5 19.8% △ 12.1 17.7% △ 1.6
△ 5.6 10.5% △ 0.8 1.2% 4.7
6.8 12.8% 19.4 28.4% 12.7 +187.0%
0.0 0.0 △ 0.0
△ 0.3 △ 0.2 0.1
△ 0.2 △ 0.1 0.0
6.3 11.9% 19.1 28.0% 12.8 +204.2%
△ 2.1 4.0% △ 5.5 8.0% △ 3.4
4.2 7.9% 13.7 20.0% 9.5 +225.7%
Owners of the parent 4.2 7.9% 13.7 20.0% 9.5 +225.8%
Non-controlling interests 0.0 0.0% △ 0.0 △ 0.0% △ 0.0
Revenue
Total cost of revenue
SG&A
Profit before income taxes
Income taxes
Profit for the period
Profit attributable to:
Other income and other expenses
Operating profit
Finance income
Finance costs
Profit from investments accounted
for using the equity method
percentileFY2022 Q1YoY
Change
(%)
FY2021 Q1 percentile
YoY
Change
(Amount)
16
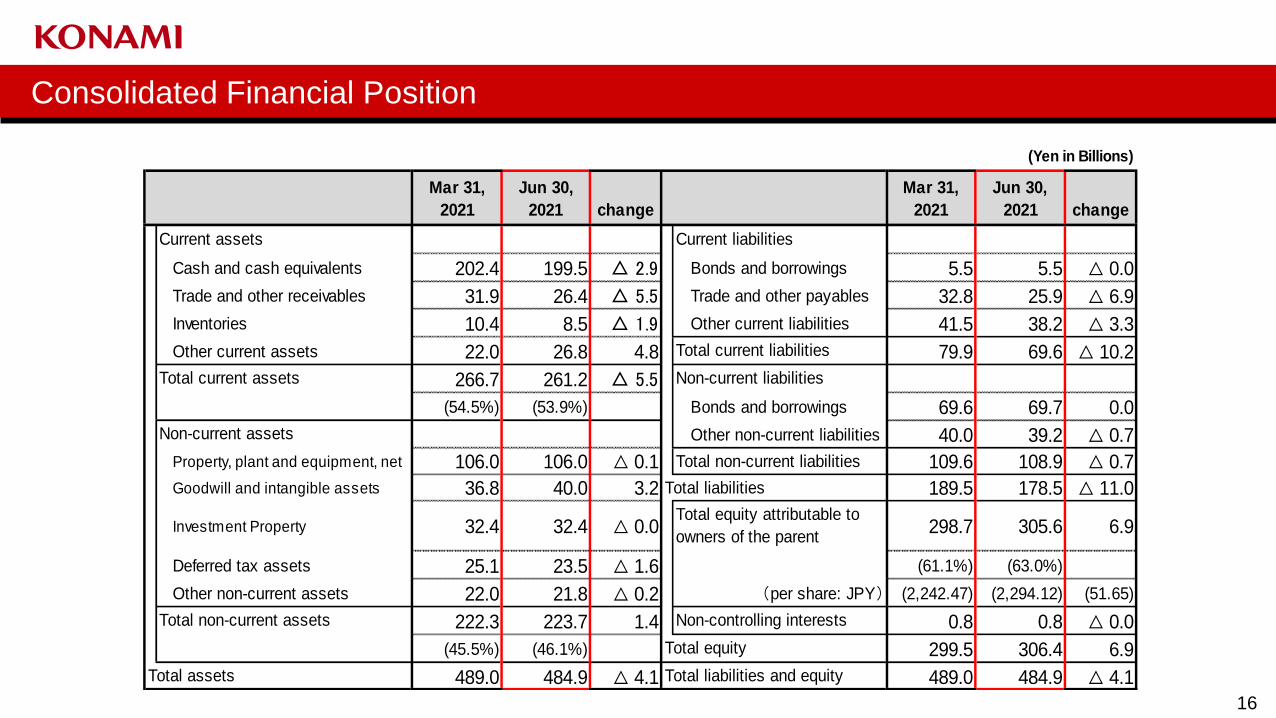
Consolidated Financial Position
(Yen in Billions)
Mar 31, Jun 30, Mar 31, Jun 30,
2021 2021 change 2021 2021 change
Cash and cash equivalents 202.4 199.5 △ 2.9 Bonds and borrowings 5.5 5.5 △ 0.0
Trade and other receivables 31.9 26.4 △ 5.5 Trade and other payables 32.8 25.9 △ 6.9
Inventories 10.4 8.5 △ 1.9 Other current liabilities 41.5 38.2 △ 3.3
Other current assets 22.0 26.8 4.8 79.9 69.6 △ 10.2
266.7 261.2 △ 5.5
(54.5%) (53.9%) Bonds and borrowings 69.6 69.7 0.0
Other non-current liabilities 40.0 39.2 △ 0.7
Property, plant and equipment, net 106.0 106.0 △ 0.1 109.6 108.9 △ 0.7
Goodwill and intangible assets 36.8 40.0 3.2 189.5 178.5 △ 11.0
Investment Property 32.4 32.4 △ 0.0 298.7 305.6 6.9
Deferred tax assets 25.1 23.5 △ 1.6 (61.1%) (63.0%)
Other non-current assets 22.0 21.8 △ 0.2 (per share: JPY) (2,242.47) (2,294.12) (51.65)
222.3 223.7 1.4 0.8 0.8 △ 0.0
(45.5%) (46.1%) 299.5 306.4 6.9
489.0 484.9 △ 4.1 489.0 484.9 △ 4.1
Non-current assets
Total non-current liabilities
Total liabilities
Total equity
Current assets Current liabilities
Total current assets
Total current liabilities
Non-current liabilities
Total liabilities and equity
Total non-current assets
Total assets
Total equity attributable to
owners of the parent
Non-controlling interests
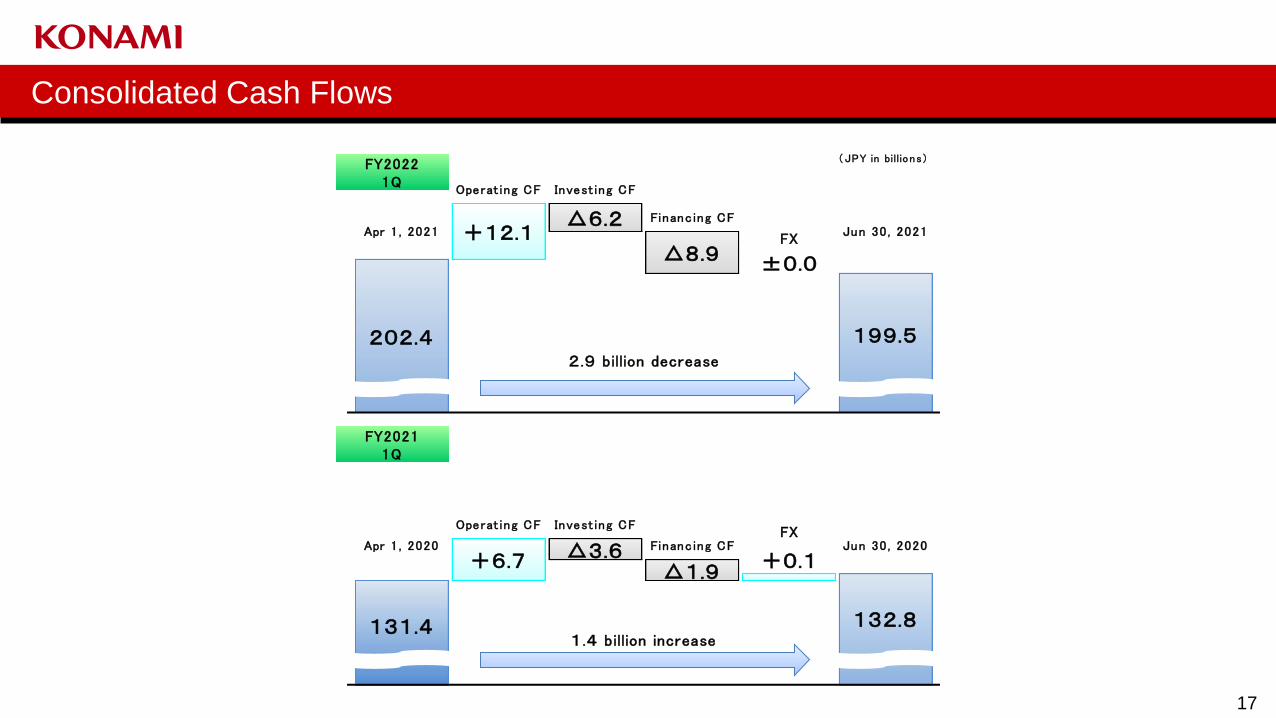
17
Consolidated Cash Flows
FXJun 30 , 2020
+0.1
132.8
Financ ing CF
△1.9
FY20221Q
(JPY in billions)
FXJun 30 , 2021
2.9 billion decrease
Invest ing CF
202.4
△6.2
±0.0
Financ ing CF
199.5
△8.9
Operat ing CF
131.4
Apr 1 , 2021
Operat ing CF Invest ing CF
Apr 1 , 2020
+6.7 △3.6
+12.1
FY20211Q
1.4 billion increase

18
THANK YOU
©KONAMI