analyst and investor briefing on second quarter of fy2022
TRANSCRIPT
Analyst and Investor Briefing on Second Quarter of FY2022.3(Fiscal year ending March 31, 2022)
November 4, 2021
Yamaha Corporation
FY2022.3 1H Highlights
Overview
Outlook
FY2022.3 1H Achievements- Market conditions continued to recover, and revenue and profit both increased year on year.- Supply shortages continued due to restrictions on factory operations caused by the
resurgence of COVID-19 infections, semiconductor procurement difficulties, and logistics disruptions.
- Although logistics and procurement costs rose, core operating profit increased due to the effects of higher revenue.
FY2022.3 Full Year Outlook- Although market demand remains robust, previous projections have been revised downward
amid expectations of continuing supply shortages.- The main factors are difficulties procuring semiconductors such as sound generator LSIs and
prolongation of logistics disruptions.- Cost controls have partially offset factors such as lower revenue and production than
previously projected and increases in logistics and procurement costs, but projected core operating profit has been revised to the previous year’s levels. 1
1. Performance Summary
FY2022.3 Full Year Outlook
FY2022.3 1H Performance(six months)
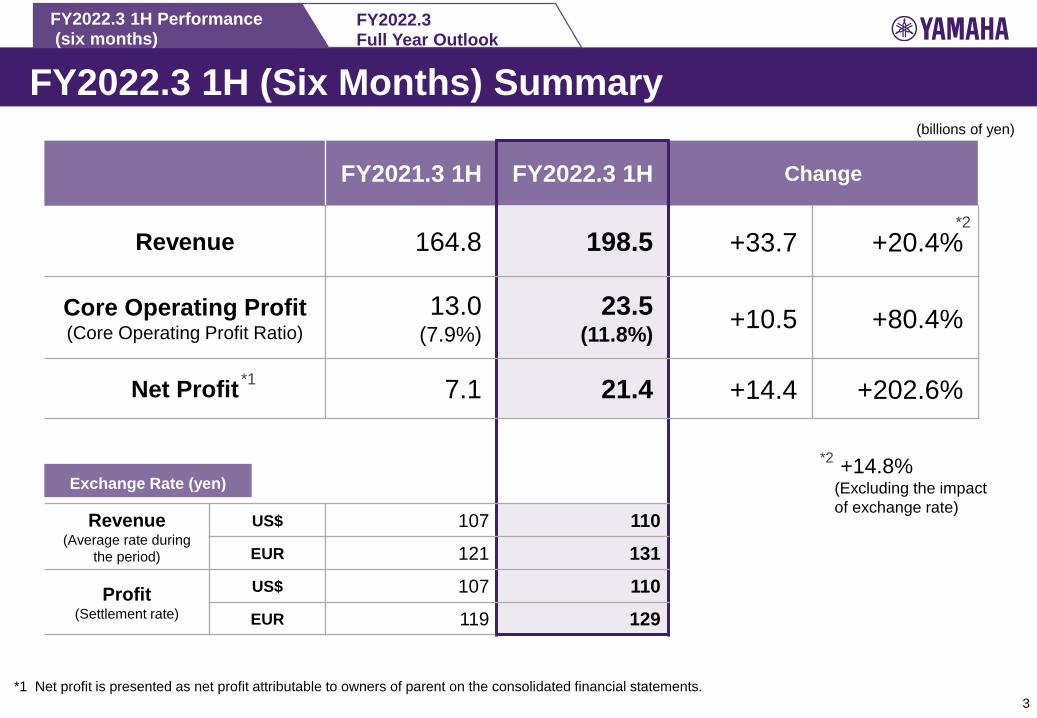
FY2022.3 1H (Six Months) Summary
FY2021.3 1H FY2022.3 1H Change
Revenue 164.8 198.5 +33.7 +20.4%
Core Operating Profit(Core Operating Profit Ratio)
13.0(7.9%)
23.5(11.8%) +10.5 +80.4%
Net Profit 7.1 21.4 +14.4 +202.6%
Revenue(Average rate during
the period)
US$ 107 110EUR 121 131
Profit(Settlement rate)
US$ 107 110EUR 119 129
+14.8%(Excluding the impact of exchange rate)
*2
*2
*1
3
(billions of yen)
Exchange Rate (yen)
*1 Net profit is presented as net profit attributable to owners of parent on the consolidated financial statements.
FY2022.3 Full Year Outlook
FY2022.3 1H Performance(six months)
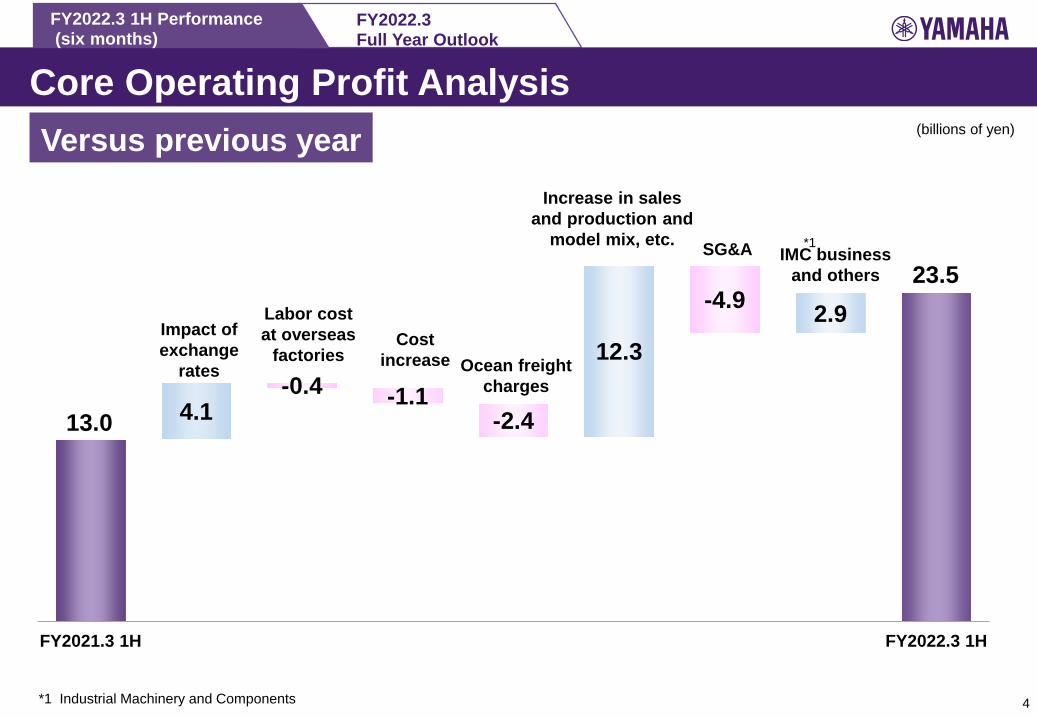
Core Operating Profit Analysis
13.0
23.5
4.1 -0.4 -1.1
-2.4
12.3
-4.9 2.9
FY2021.3 1H FY2022.3 1H
4
(billions of yen)
*1 Industrial Machinery and Components
*1
Labor cost at overseas
factories
SG&A
Impact of exchange
rates
Cost increase
IMC business and others
Increase in sales and production and
model mix, etc.
Versus previous year
Ocean freight charges
FY2022.3 Full Year Outlook
FY2022.3 1H Performance(six months)
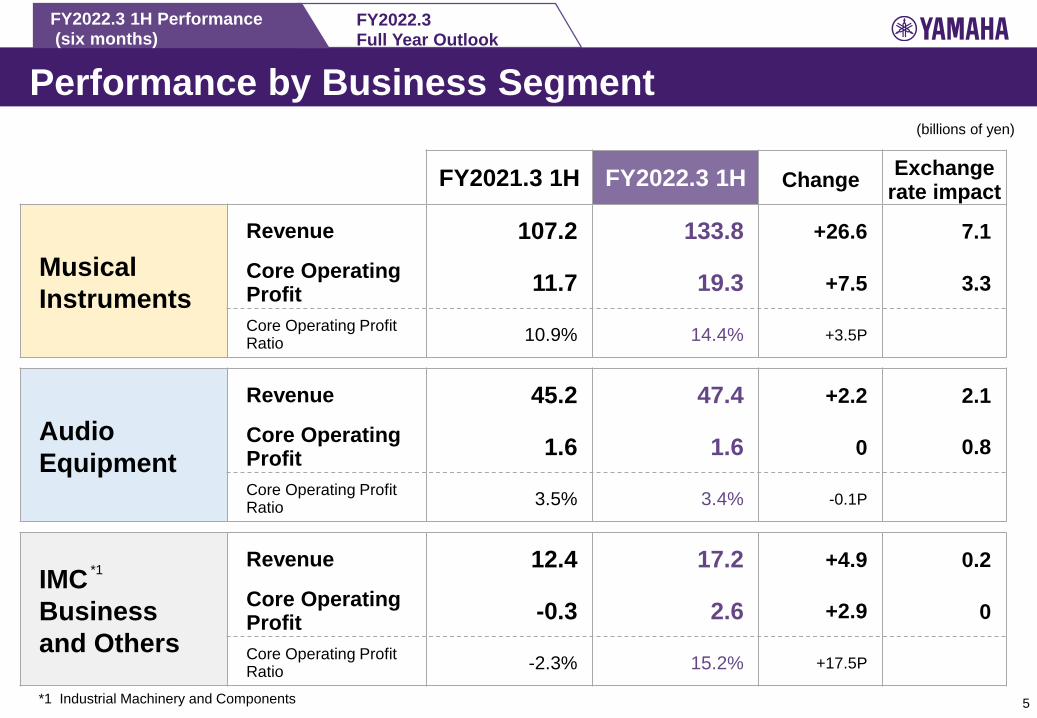
Performance by Business Segment
FY2021.3 1H FY2022.3 1H Change Exchange rate impact
Musical Instruments
Revenue 107.2 133.8 +26.6 7.1
Core Operating Profit 11.7 19.3 +7.5 3.3
Core Operating Profit Ratio 10.9% 14.4% +3.5P
Audio Equipment
Revenue 45.2 47.4 +2.2 2.1
Core Operating Profit 1.6 1.6 0 0.8
Core Operating Profit Ratio 3.5% 3.4% -0.1P
IMC Business and Others
Revenue 12.4 17.2 +4.9 0.2
Core Operating Profit -0.3 2.6 +2.9 0
Core Operating Profit Ratio -2.3% 15.2% +17.5P
5
(billions of yen)
*1
*1 Industrial Machinery and Components
FY2022.3 Full Year Outlook
FY2022.3 1H Performance(six months)
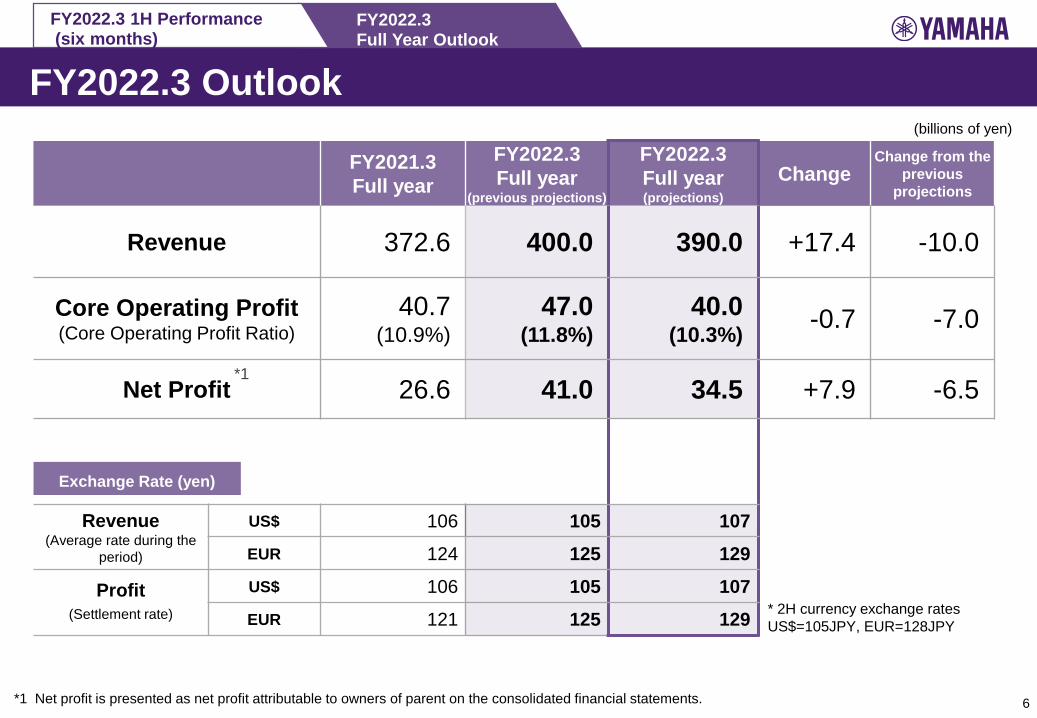
FY2022.3 Outlook
FY2021.3 Full year
FY2022.3 Full year
(previous projections)
FY2022.3 Full year(projections)
ChangeChange from the
previous projections
Revenue 372.6 400.0 390.0 +17.4 -10.0
Core Operating Profit(Core Operating Profit Ratio)
40.7(10.9%)
47.0(11.8%)
40.0(10.3%) -0.7 -7.0
Net Profit 26.6 41.0 34.5 +7.9 -6.5
Revenue(Average rate during the
period)
US$ 106 105 107EUR 124 125 129
Profit(Settlement rate)
US$ 106 105 107EUR 121 125 129
*1
6
(billions of yen)
*1 Net profit is presented as net profit attributable to owners of parent on the consolidated financial statements.
* 2H currency exchange rates US$=105JPY, EUR=128JPY
Exchange Rate (yen)
FY2022.3 Full Year Outlook
FY2022.3 1H Performance(six months)
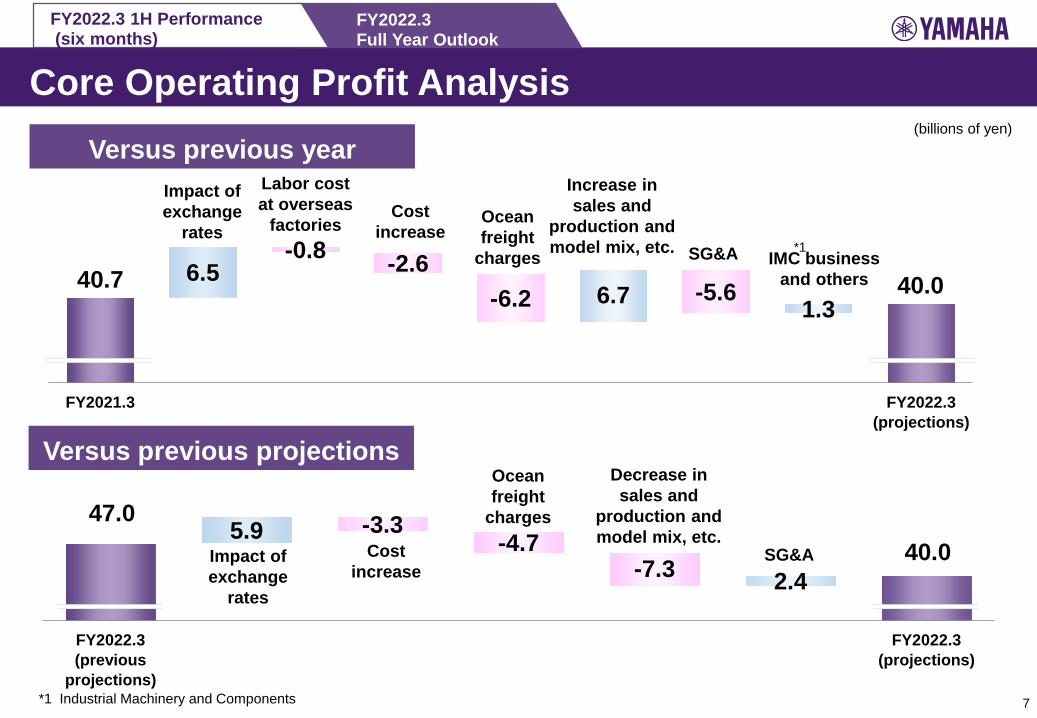
47.0 40.0
5.9 -3.3 -4.7
-7.3 2.4
FY2022.3 (previous
projections)
FY2022.3 (projections)
Core Operating Profit Analysis
40.7 40.0 6.5 -0.8 -2.6
-6.2 6.7 -5.6 1.3
FY2021.3 FY2022.3 (projections)
7
(billions of yen)Versus previous year
Versus previous projections
*1 Industrial Machinery and Components
*1
Labor cost at overseas
factoriesSG&A
Impact of exchange
ratesCost
increaseIMC business
and others
Increase in sales and
production and model mix, etc.
Ocean freight
charges
SG&AImpact of exchange
rates
Cost increase
Decrease in sales and
production and model mix, etc.
Ocean freight
charges
FY2022.3 Full Year Outlook
FY2022.3 1H Performance(six months)
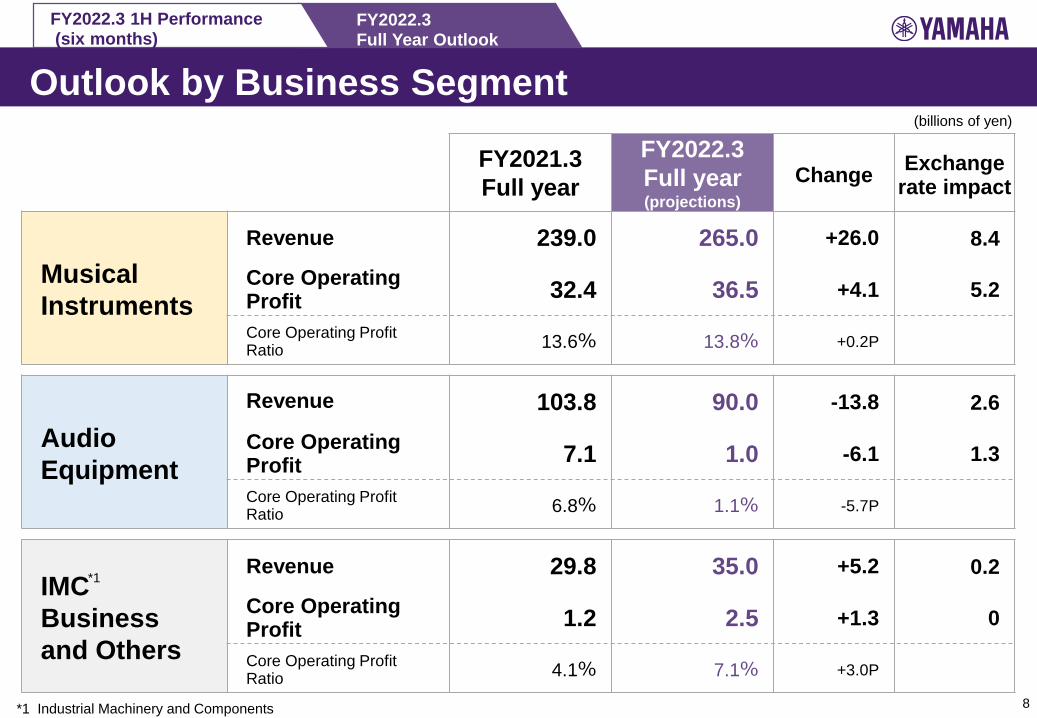
Outlook by Business Segment
FY2021.3 Full year
FY2022.3 Full year (projections)
Change Exchange rate impact
Musical Instruments
Revenue 239.0 265.0 +26.0 8.4
Core Operating Profit 32.4 36.5 +4.1 5.2
Core Operating Profit Ratio 13.6% 13.8% +0.2P
Audio Equipment
Revenue 103.8 90.0 -13.8 2.6
Core Operating Profit 7.1 1.0 -6.1 1.3
Core Operating Profit Ratio 6.8% 1.1% -5.7P
IMC Business and Others
Revenue 29.8 35.0 +5.2 0.2
Core Operating Profit 1.2 2.5 +1.3 0
Core Operating Profit Ratio 4.1% 7.1% +3.0P
8
*1
*1 Industrial Machinery and Components
(billions of yen)
2. Segment Overview & Updates
Musical Instruments Audio Equipment IMC Business and Others
11.7
32.4 19.3
36.5
0
10
20
30
40
50
FY2021.3 1H
FY2021.3 Full year
FY2022.3 1H
FY2022.3 Full year
(projections)
Core Operating Profit
107.2
239.0
133.8
265.0
0
50
100
150
200
250
300
FY2021.3 1H
FY2021.3 Full year
FY2022.3 1H
FY2022.3 Full year
(projections)
Revenue
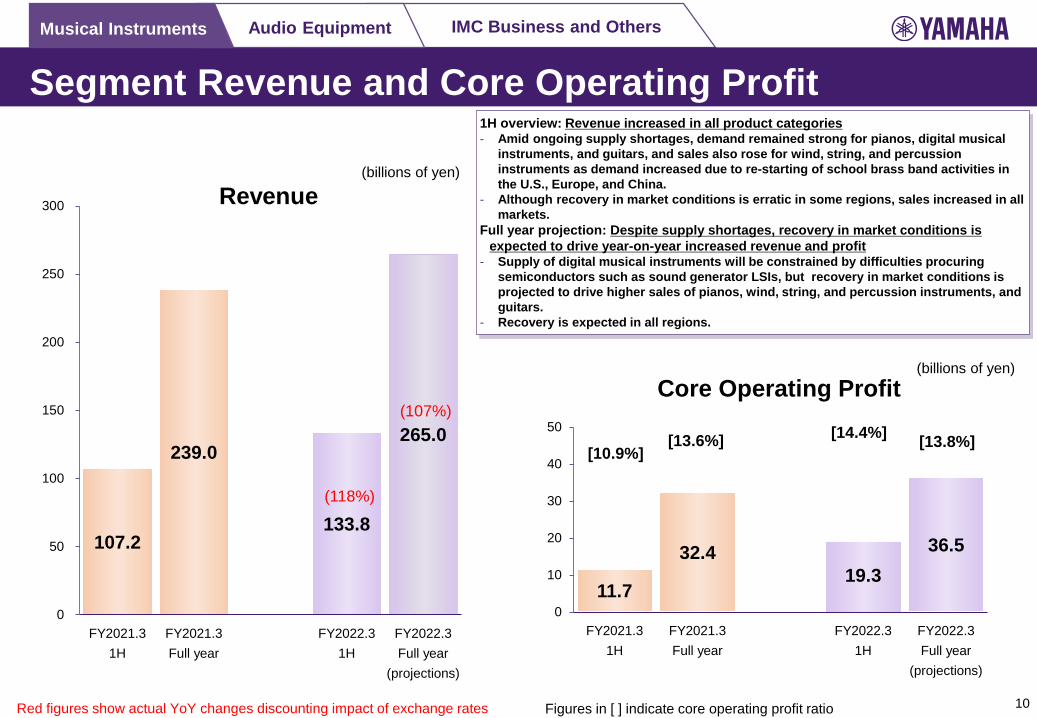
Segment Revenue and Core Operating Profit1H overview: Revenue increased in all product categories- Amid ongoing supply shortages, demand remained strong for pianos, digital musical
instruments, and guitars, and sales also rose for wind, string, and percussion instruments as demand increased due to re-starting of school brass band activities in the U.S., Europe, and China.
- Although recovery in market conditions is erratic in some regions, sales increased in all markets.
Full year projection: Despite supply shortages, recovery in market conditions is expected to drive year-on-year increased revenue and profit
- Supply of digital musical instruments will be constrained by difficulties procuring semiconductors such as sound generator LSIs, but recovery in market conditions is projected to drive higher sales of pianos, wind, string, and percussion instruments, and guitars.
- Recovery is expected in all regions.
[13.6%][10.9%]
(118%)
(107%)
[13.8%][14.4%]
10
(billions of yen)
Red figures show actual YoY changes discounting impact of exchange rates Figures in [ ] indicate core operating profit ratio
(billions of yen)
Musical Instruments Audio Equipment IMC Business and Others
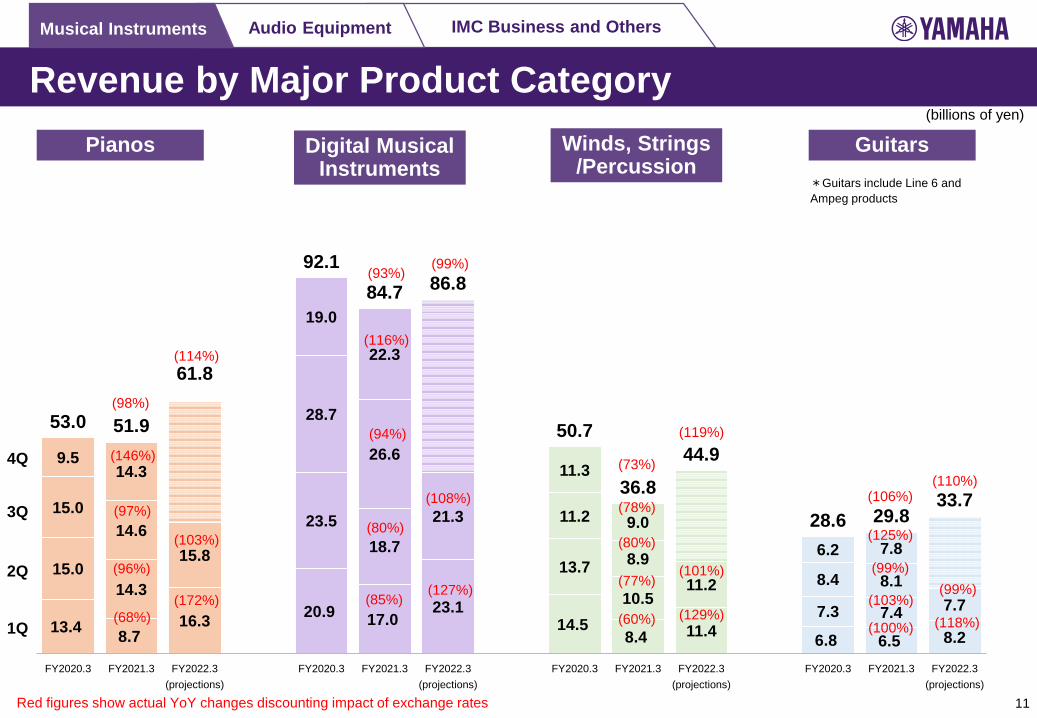
Revenue by Major Product Category
1Q
2Q
3Q
4Q
13.4 8.7 16.3 20.9 17.0
23.1 14.5
8.4 11.4 6.8 6.5 8.2
15.0 14.3
15.8
23.5 18.7
21.3
13.7
10.5 11.2
7.3 7.4 7.7
15.0 14.6
28.7
26.6
11.2
8.9 8.4 8.1
9.5 14.3
19.0
22.3
11.3
9.0 6.2 7.8
53.0 51.9
61.8
92.1 84.7 86.8
50.7
36.8 44.9
28.6 29.8 33.7
FY2020.3 FY2021.3 FY2022.3 (projections)
FY2020.3 FY2021.3 FY2022.3 (projections)
FY2020.3 FY2021.3 FY2022.3 (projections)
FY2020.3 FY2021.3 FY2022.3 (projections)
(106%)
(98%)
(93%)
(73%)(110%)
(114%)
(99%)
(119%)
(100%)(68%)
(85%)(60%)
(96%)
(80%)
(77%)(103%)
(97%)
(94%)
(80%)
(99%)
(146%)
(116%)
(78%)
(125%)
(172%)(127%)
(129%) (118%)
(103%)
(108%)
(101%)(99%)
11
(billions of yen)
Red figures show actual YoY changes discounting impact of exchange rates
Pianos Digital Musical Instruments
Winds, Strings /Percussion
Guitars*Guitars include Line 6 and Ampeg products
Musical Instruments Audio Equipment IMC Business and Others
19.5 10.6
16.7 12.8 10.5 13.3 11.7 9.0 12.6 12.5 9.5 14.5 11.0 7.1 11.4
18.0
14.3 13.2
15.3 12.0
13.6 11.6
10.5 12.6 13.4
13.6 14.4
12.7 10.3
11.4
15.4
14.9 16.0
13.1 16.4
15.1 12.7 13.6 14.2
12.1
16.0
15.3 13.4
13.2 9.9
11.5 5.8 11.5 11.0
11.6
68.9
55.1 57.8 57.5
48.7
57.7
49.7 46.1
51.7
44.3 48.2
53.2 48.9
41.0 44.5
FY2020.3 FY2021.3 FY2022.3
(projections)
FY2020.3 FY2021.3 FY2022.3
(projections)
FY2020.3 FY2021.3 FY2022.3
(projections)
FY2020.3 FY2021.3 FY2022.3
(projections)
FY2020.3 FY2021.3 FY2022.3
(projections)
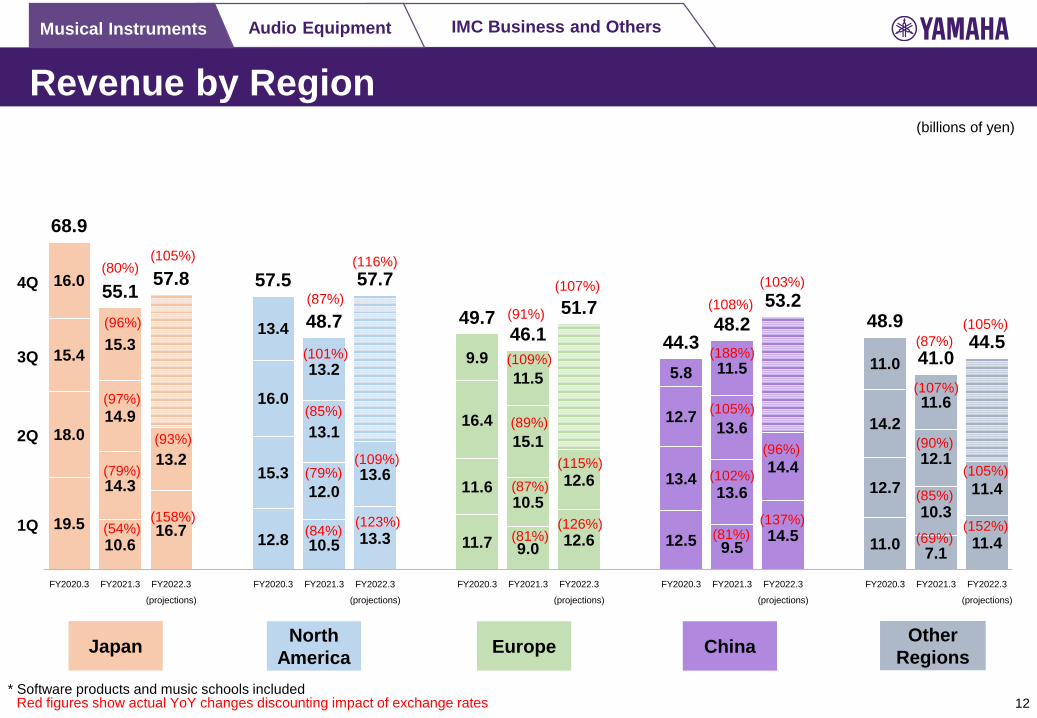
Revenue by Region
1Q
2Q
(80%)
(87%)(91%) (108%)
(87%)3Q
4Q(105%) (116%)
(107%) (103%)
(105%)
(54%) (84%) (81%) (81%) (69%)
(79%) (79%)(87%)
(102%)(85%)
(85%)(97%)
(89%)(105%)
(90%)
(96%)
(101%) (109%) (188%)
(107%)
(158%) (123%) (126%) (137%) (152%)
(93%)(109%) (115%)
(96%)(105%)
12
North America Europe China Other
RegionsJapan
* Software products and music schools includedRed figures show actual YoY changes discounting impact of exchange rates
(billions of yen)
Musical Instruments Audio Equipment IMC Business and Others
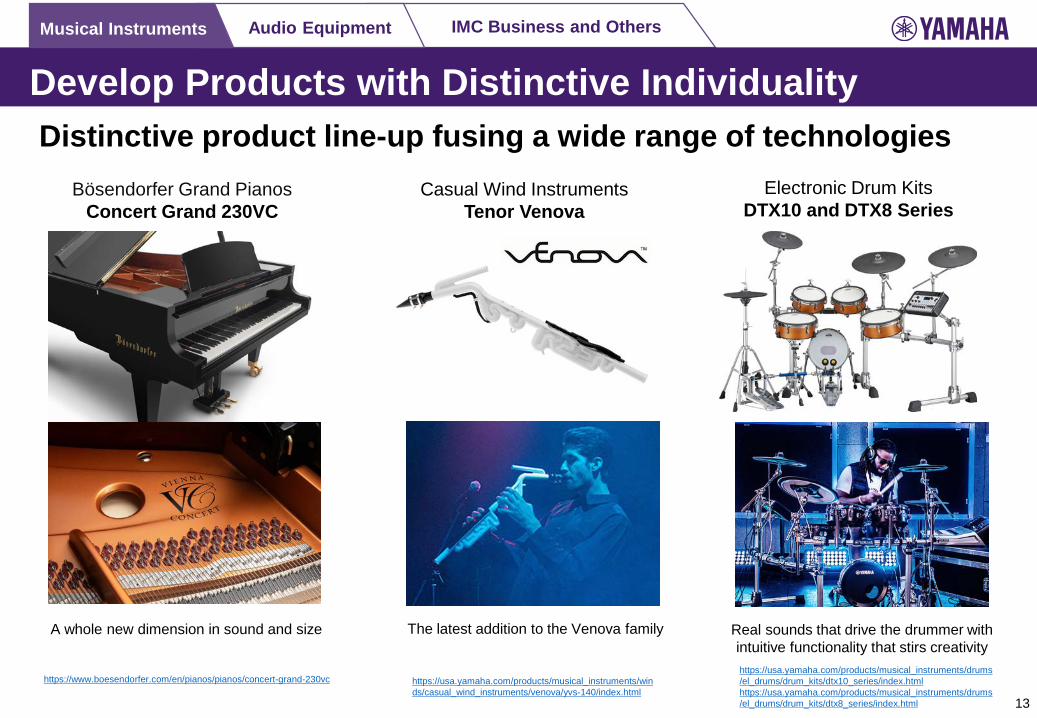
Develop Products with Distinctive IndividualityDistinctive product line-up fusing a wide range of technologies
Bösendorfer Grand Pianos Concert Grand 230VC
Casual Wind InstrumentsTenor Venova
A whole new dimension in sound and size The latest addition to the Venova family
Electronic Drum KitsDTX10 and DTX8 Series
Real sounds that drive the drummer with intuitive functionality that stirs creativity
https://www.boesendorfer.com/en/pianos/pianos/concert-grand-230vc https://usa.yamaha.com/products/musical_instruments/winds/casual_wind_instruments/venova/yvs-140/index.html
https://usa.yamaha.com/products/musical_instruments/drums/el_drums/drum_kits/dtx10_series/index.htmlhttps://usa.yamaha.com/products/musical_instruments/drums/el_drums/drum_kits/dtx8_series/index.html 13
Musical Instruments Audio Equipment IMC Business and Others
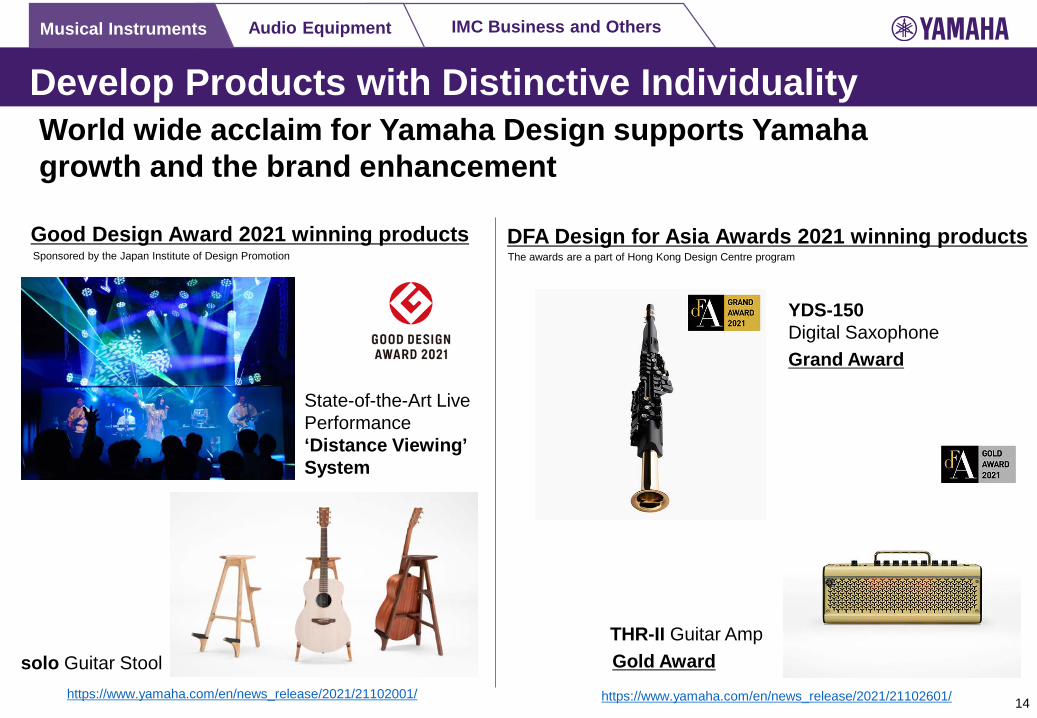
Develop Products with Distinctive IndividualityWorld wide acclaim for Yamaha Design supports Yamaha growth and the brand enhancement
solo Guitar Stool
State-of-the-Art Live Performance‘Distance Viewing’ System
Good Design Award 2021 winning products DFA Design for Asia Awards 2021 winning products
YDS-150 Digital Saxophone
THR-II Guitar Amp
https://www.yamaha.com/en/news_release/2021/21102001/
Grand Award
Gold Awardhttps://www.yamaha.com/en/news_release/2021/21102601/
Sponsored by the Japan Institute of Design Promotion
14
The awards are a part of Hong Kong Design Centre program
Musical Instruments Audio Equipment IMC Business and Others
1.6
7.1
1.6 1.0 0
2
4
6
8
10
FY2021.3 1H
FY2021.3 Full year
FY2022.3 1H
FY2022.3 Full year
(projections)
Core Operating Profit
45.2
103.8
47.4
90.0
0
25
50
75
100
125
FY2021.3 1H
FY2021.3 Full year
FY2022.3 1H
FY2022.3 Full year
(projections)
Revenue
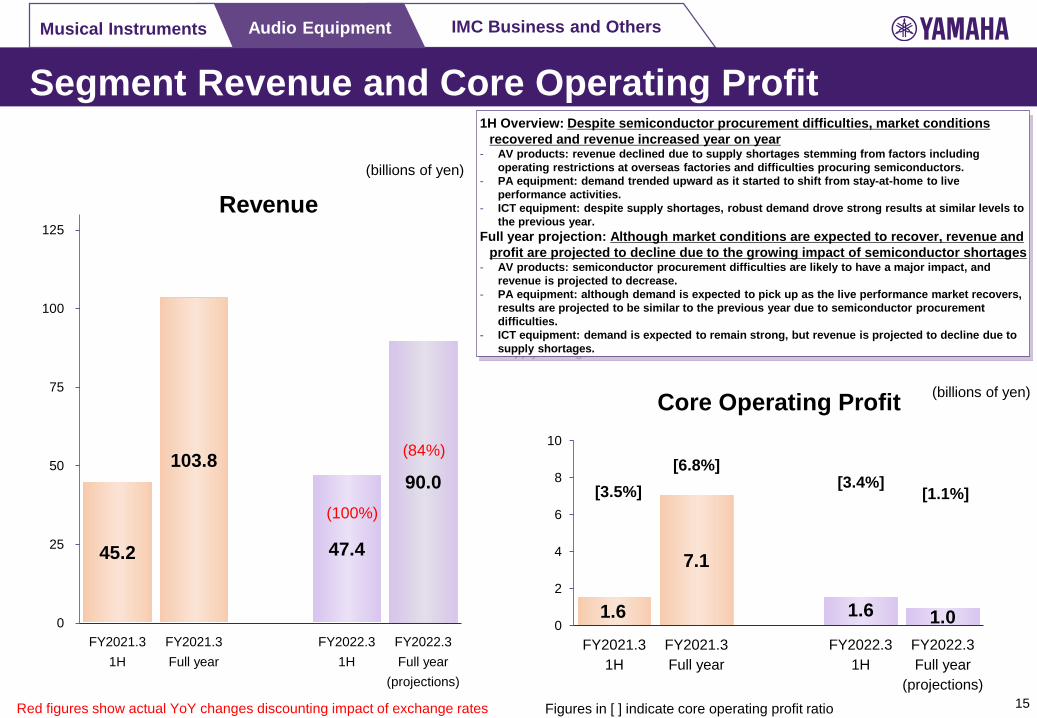
Segment Revenue and Core Operating Profit1H Overview: Despite semiconductor procurement difficulties, market conditions
recovered and revenue increased year on year- AV products: revenue declined due to supply shortages stemming from factors including
operating restrictions at overseas factories and difficulties procuring semiconductors.- PA equipment: demand trended upward as it started to shift from stay-at-home to live
performance activities.- ICT equipment: despite supply shortages, robust demand drove strong results at similar levels to
the previous year.Full year projection: Although market conditions are expected to recover, revenue and
profit are projected to decline due to the growing impact of semiconductor shortages- AV products: semiconductor procurement difficulties are likely to have a major impact, and
revenue is projected to decrease.- PA equipment: although demand is expected to pick up as the live performance market recovers,
results are projected to be similar to the previous year due to semiconductor procurement difficulties.
- ICT equipment: demand is expected to remain strong, but revenue is projected to decline due to supply shortages.
(100%)
(84%)[6.8%]
[3.5%] [1.1%][3.4%]
15Red figures show actual YoY changes discounting impact of exchange rates Figures in [ ] indicate core operating profit ratio
(billions of yen)
(billions of yen)
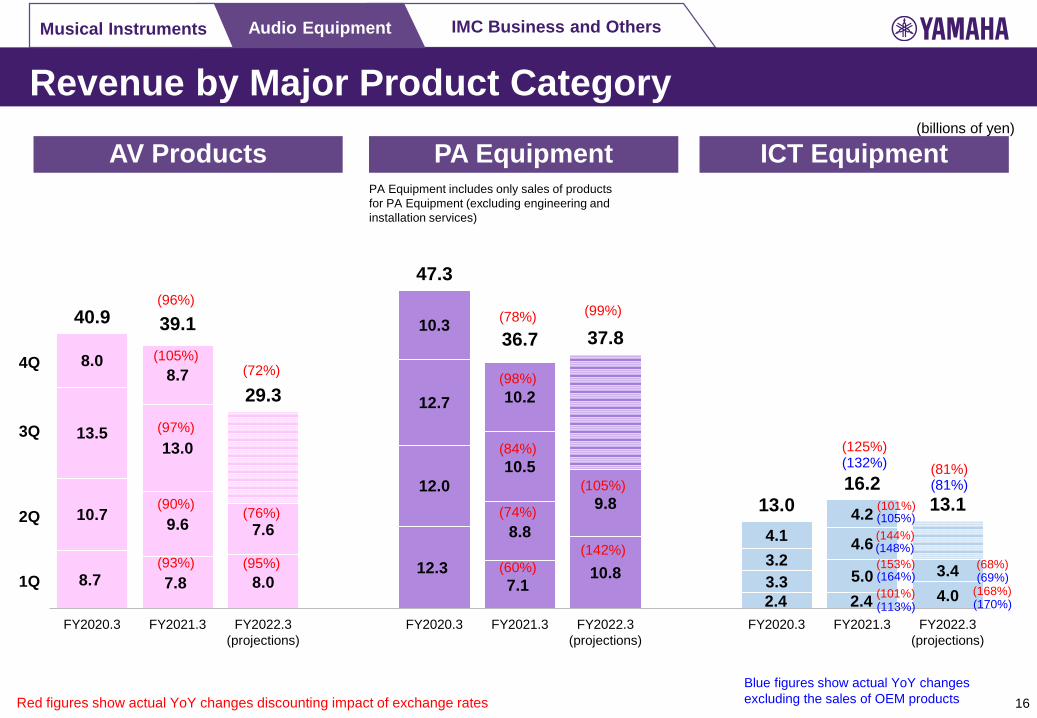
Musical Instruments Audio Equipment IMC Business and Others
Revenue by Major Product Category
8.7 7.8 8.0 12.3
7.1 10.8
2.4 2.4 4.0
10.7 9.6 7.6
12.0
8.8 9.8
3.3 5.0 3.4
13.5 13.0
12.7
10.5
3.2 4.6
8.0 8.7
10.3
10.2
4.1 4.2
40.9 39.1
29.3
47.3
36.7 37.8
13.0 16.2
13.1
FY2020.3 FY2021.3 FY2022.3 (projections)
FY2020.3 FY2021.3 FY2022.3 (projections)
FY2020.3 FY2021.3 FY2022.3 (projections)
(96%)(78%)
(125%)
(72%)
(99%)
(81%)
1Q
2Q
3Q
4Q
(132%)(81%)
(93%) (60%)
(101%)(113%)
(90%) (74%)
(153%)(164%)
(97%)(84%)
(144%)(148%)
(105%)(98%)
(101%)(105%)
(142%)(95%)
(168%)(170%)
(76%)
(105%)
(68%)(69%)
16
AV Products PA Equipment ICT EquipmentPA Equipment includes only sales of products for PA Equipment (excluding engineering and installation services)
(billions of yen)
Blue figures show actual YoY changes excluding the sales of OEM productsRed figures show actual YoY changes discounting impact of exchange rates
Musical Instruments Audio Equipment IMC Business and Others
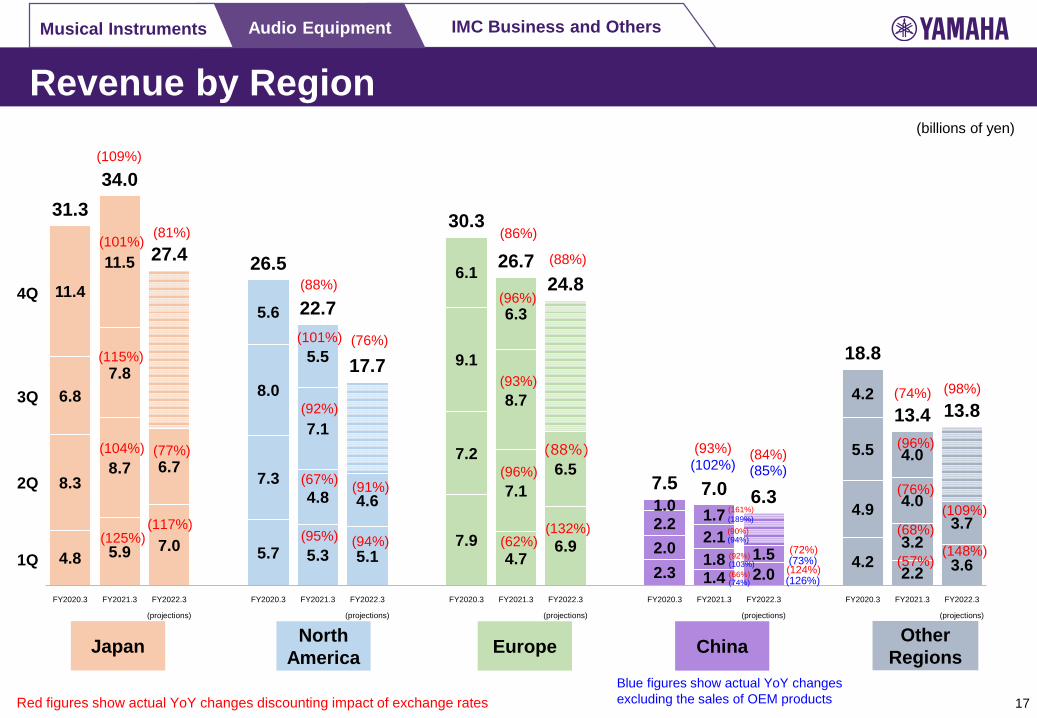
Revenue by Region
4.8 5.9 7.0 5.7 5.3 5.1 7.9
4.7 6.9
2.3 1.4 2.0 4.2
2.2 3.6
8.3 8.7 6.7
7.3 4.8 4.6
7.2
7.1 6.5
2.0 1.8 1.5
4.9
3.2 3.7
6.8 7.8
8.0
7.1
9.1
8.7
2.2 2.1
5.5
4.0
11.4
11.5
5.6
5.5
6.1
6.3
1.0 1.7
4.2
4.0
31.3 34.0
27.4 26.5
22.7
17.7
30.3
26.7 24.8
7.5 7.0 6.3
18.8
13.4 13.8
FY2020.3 FY2021.3 FY2022.3
(projections)
FY2020.3 FY2021.3 FY2022.3
(projections)
FY2020.3 FY2021.3 FY2022.3
(projections)
FY2020.3 FY2021.3 FY2022.3
(projections)
FY2020.3 FY2021.3 FY2022.3
(projections)
(88%)
1Q
2Q
(109%)
(88%)
(86%)
(93%)
(74%)3Q
4Q
(81%)
(76%)
(88%)
(84%)
(98%)
(102%) (85%)
(125%) (95%) (62%)
(66%)(57%)
(74%)
(92%)(103%)
(68%)
(104%)
(67%) (96%)
(115%)
(92%)
(93%)
(90%)(94%)
(76%)
(101%)
(101%)
(96%)
(96%)
(161%)(189%)(117%)
(94%)(132%)
(124%)(148%)
(126%)
(77%)
(91%)(109%)
(72%)(73%)
17
North America Europe China Other
RegionsJapan
Red figures show actual YoY changes discounting impact of exchange ratesBlue figures show actual YoY changes excluding the sales of OEM products
(billions of yen)
Musical Instruments Audio Equipment IMC Business and Others
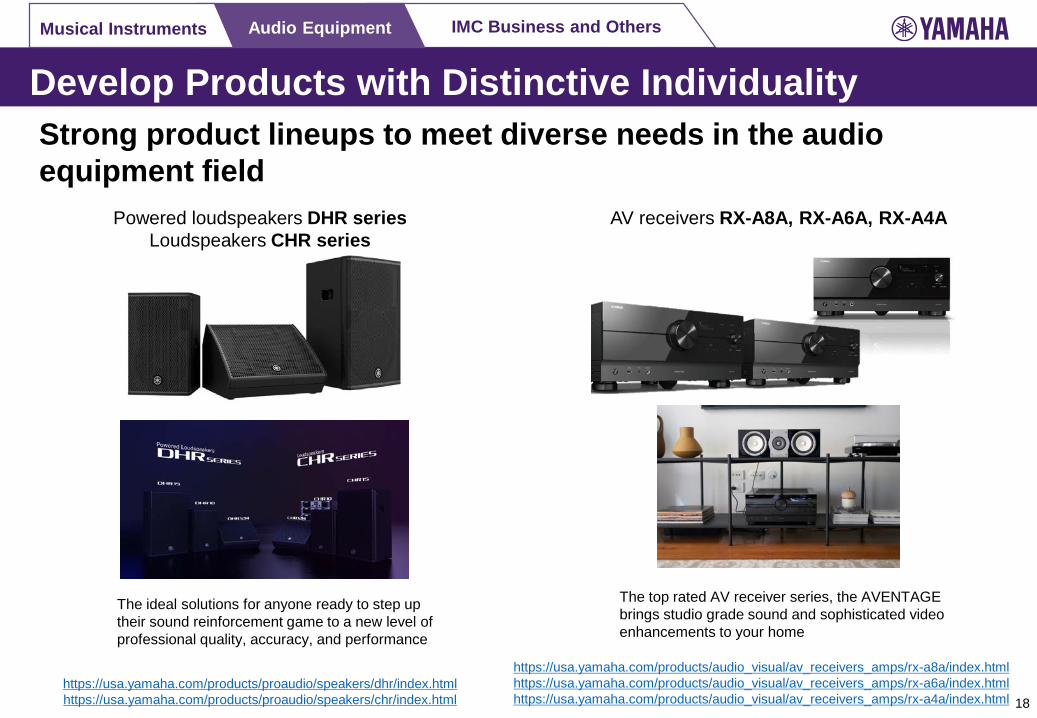
Develop Products with Distinctive Individuality
AV receivers RX-A8A, RX-A6A, RX-A4A
The ideal solutions for anyone ready to step up their sound reinforcement game to a new level of professional quality, accuracy, and performance
The top rated AV receiver series, the AVENTAGE brings studio grade sound and sophisticated video enhancements to your home
Strong product lineups to meet diverse needs in the audio equipment field
https://usa.yamaha.com/products/proaudio/speakers/dhr/index.htmlhttps://usa.yamaha.com/products/proaudio/speakers/chr/index.html
https://usa.yamaha.com/products/audio_visual/av_receivers_amps/rx-a8a/index.htmlhttps://usa.yamaha.com/products/audio_visual/av_receivers_amps/rx-a6a/index.htmlhttps://usa.yamaha.com/products/audio_visual/av_receivers_amps/rx-a4a/index.html 18
Powered loudspeakers DHR seriesLoudspeakers CHR series
Musical Instruments Audio Equipment IMC Business and Others
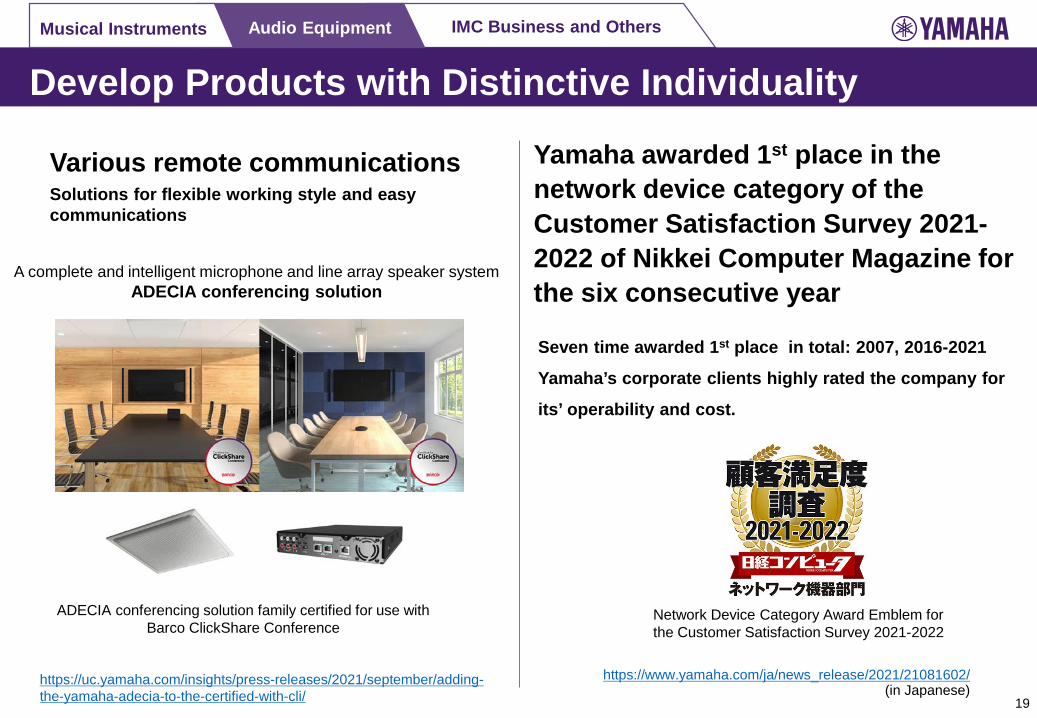
Develop Products with Distinctive Individuality
Yamaha awarded 1st place in the network device category of the Customer Satisfaction Survey 2021-2022 of Nikkei Computer Magazine for the six consecutive year
Seven time awarded 1st place in total: 2007, 2016-2021
Yamaha’s corporate clients highly rated the company for
its’ operability and cost.
Various remote communications
A complete and intelligent microphone and line array speaker systemADECIA conferencing solution
ADECIA conferencing solution family certified for use with Barco ClickShare Conference
https://www.yamaha.com/ja/news_release/2021/21081602/(in Japanese)
https://uc.yamaha.com/insights/press-releases/2021/september/adding-the-yamaha-adecia-to-the-certified-with-cli/ 19
Network Device Category Award Emblem for the Customer Satisfaction Survey 2021-2022
Solutions for flexible working style and easy communications
Musical Instruments Audio Equipment IMC Business and Others
12.4
29.8
17.2
35.0
0
10
20
30
40
FY2021.3 1H
FY2021.3 Full year
FY2022.3 1H
FY2022.3 Full year
(projections)
Revenue
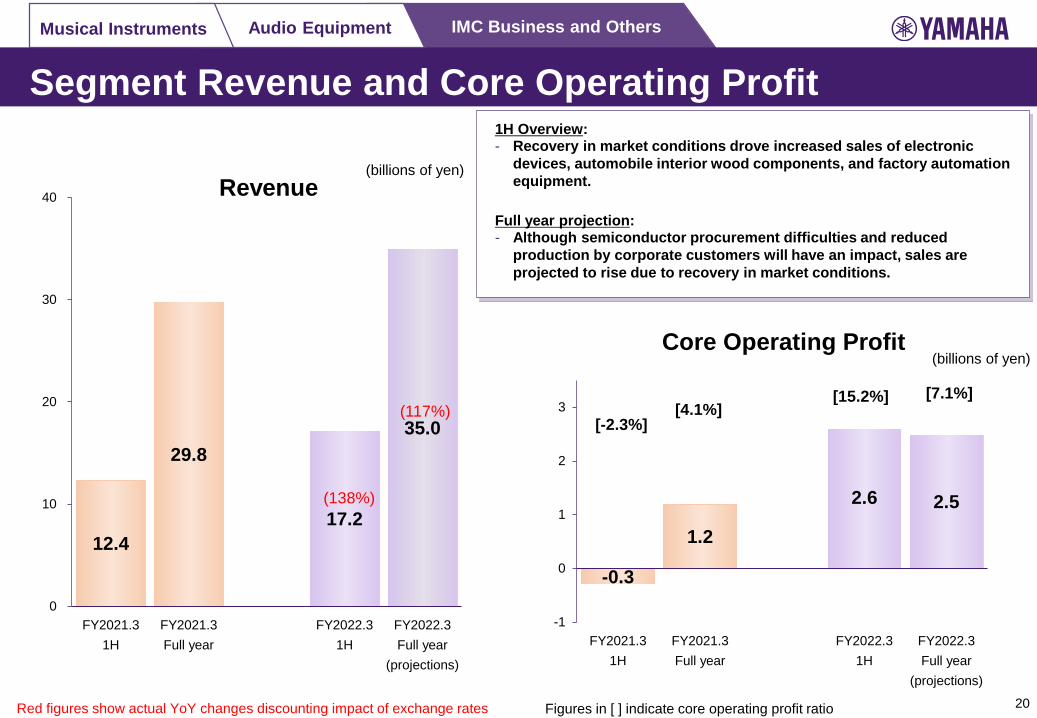
Segment Revenue and Core Operating Profit1H Overview:- Recovery in market conditions drove increased sales of electronic
devices, automobile interior wood components, and factory automation equipment.
Full year projection:- Although semiconductor procurement difficulties and reduced
production by corporate customers will have an impact, sales are projected to rise due to recovery in market conditions.
(138%)
(117%)
-0.3
1.2
2.6 2.5
-1
0
1
2
3
FY2021.3 1H
FY2021.3 Full year
FY2022.3 1H
FY2022.3 Full year
(projections)
Core Operating Profit
[4.1%][-2.3%]
[7.1%][15.2%]
20Red figures show actual YoY changes discounting impact of exchange rates Figures in [ ] indicate core operating profit ratio
(billions of yen)
(billions of yen)

3. Other Financial Figures
ESGSegment OverviewPerformance Summary
OtherFinancial Figures
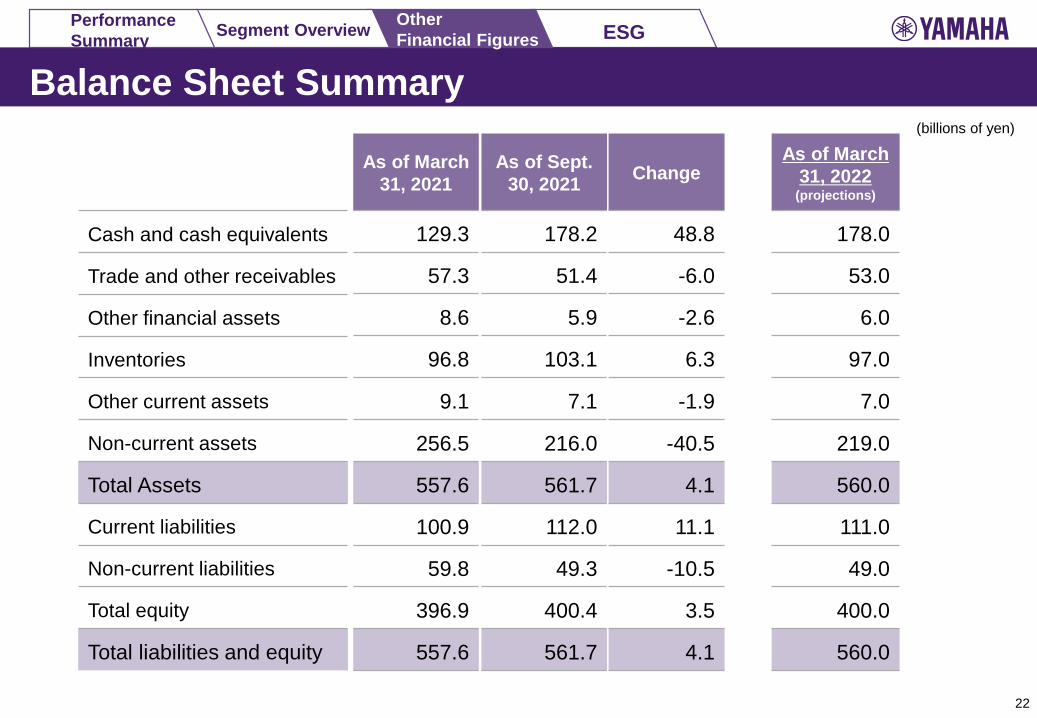
Balance Sheet Summary
As of March 31, 2021
129.3
57.3
8.6
96.8
9.1
256.5
557.6
100.9
59.8
396.9
557.6
Cash and cash equivalents
Trade and other receivables
Other financial assets
Inventories
Other current assets
Non-current assets
Total Assets
Current liabilities
Non-current liabilities
Total equity
Total liabilities and equity
Change
48.8
-6.0
-2.6
6.3
-1.9
-40.5
4.1
11.1
-10.5
3.5
4.1
As of Sept. 30, 2021
178.2
51.4
5.9
103.1
7.1
216.0
561.7
112.0
49.3
400.4
561.7
As of March 31, 2022
(projections)
178.0
53.0
6.0
97.0
7.0
219.0
560.0
111.0
49.0
400.0
560.0
22
(billions of yen)
ESGSegment OverviewPerformance Summary
OtherFinancial Figures
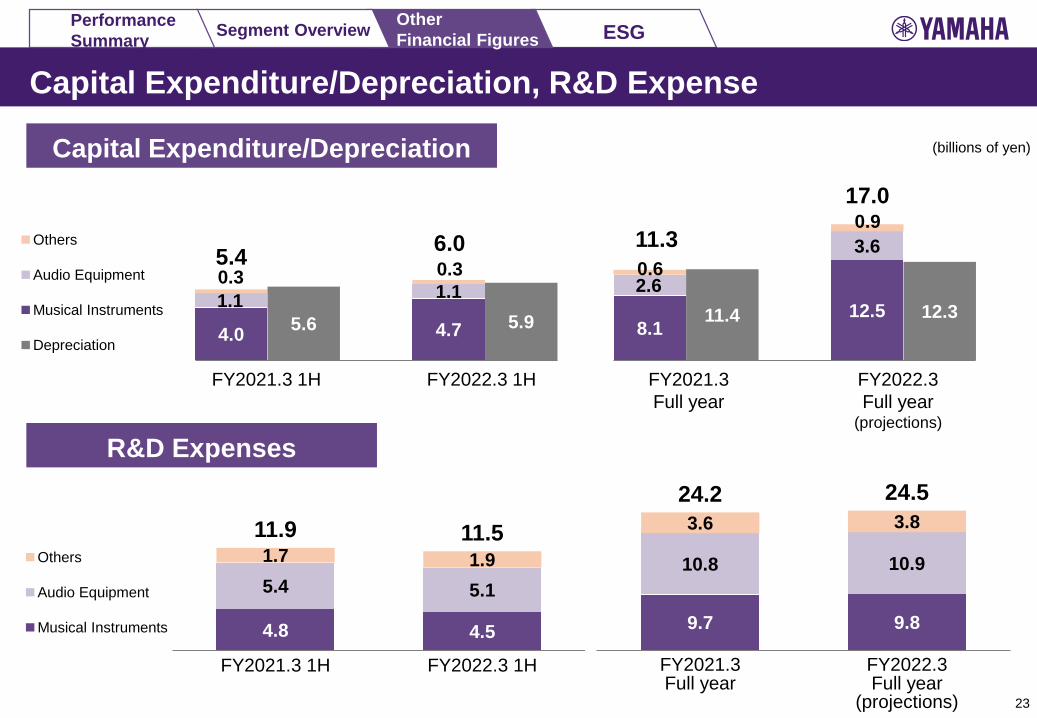
Capital Expenditure/Depreciation, R&D Expense
4.8 4.5
5.4 5.1
1.7 1.9 11.9 11.5
FY2021.3 1H FY2022.3 1H
4.0 4.7 1.1 1.1 0.3 0.3 5.4 6.0
5.6 5.9
FY2021.3 1H FY2022.3 1H
8.1 12.5
2.6
3.6 0.6
0.9 11.3
17.0
11.4 12.3
FY2021.3 Full year
FY2022.3 Full year
(projections)
9.7 9.8
10.8 10.9
3.6 3.8 24.2 24.5
FY2021.3 Full year
FY2022.3 Full year
(projections) 23
(billions of yen)Capital Expenditure/Depreciation
R&D Expenses
■Others
■Audio Equipment
■Musical Instruments
■Depreciation
■Others
■Audio Equipment
■Musical Instruments
4. ESG
ESGSegment OverviewPerformance Summary
OtherFinancial Figures
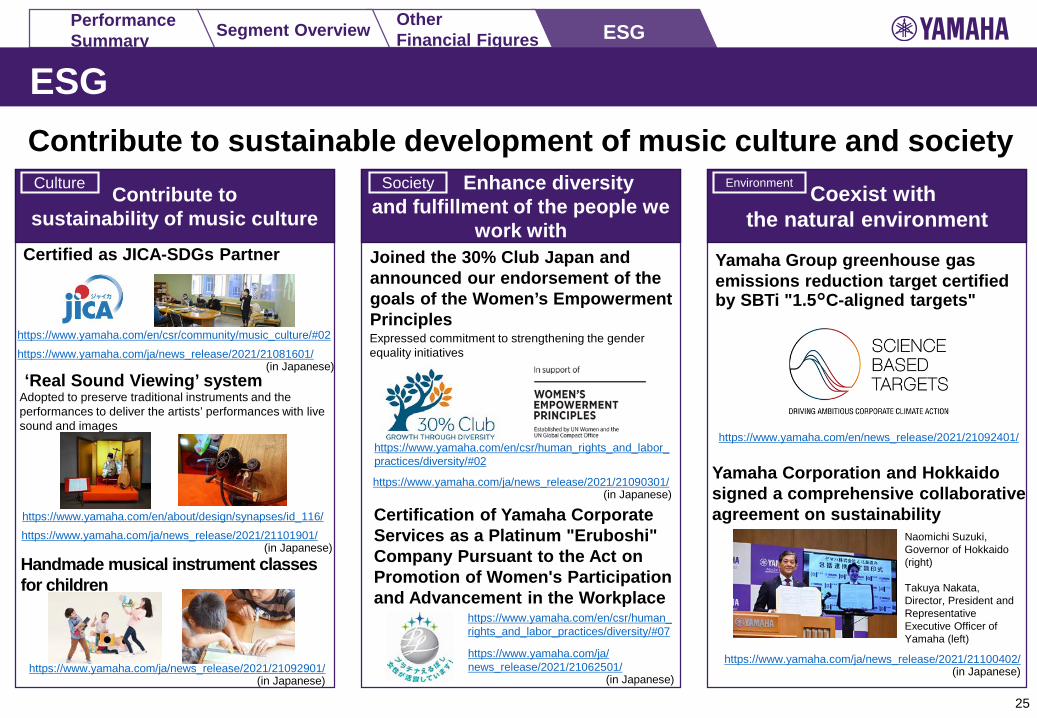
ESGContribute to sustainable development of music culture and society
Yamaha Group greenhouse gas emissions reduction target certified by SBTi "1.5°C-aligned targets"
Yamaha Corporation and Hokkaido signed a comprehensive collaborative agreement on sustainability
https://www.yamaha.com/ja/news_release/2021/21090301/(in Japanese)
Naomichi Suzuki, Governor of Hokkaido (right)
Takuya Nakata, Director, President and Representative Executive Officer of Yamaha (left)
https://www.yamaha.com/ja/news_release/2021/21100402/(in Japanese)
https://www.yamaha.com/ja/news_release/2021/21081601/(in Japanese)
https://www.yamaha.com/en/news_release/2021/21092401/
https://www.yamaha.com/ja/news_release/2021/21062501/
(in Japanese)
https://www.yamaha.com/ja/news_release/2021/21101901/(in Japanese)
‘Real Sound Viewing’ system
Handmade musical instrument classes for children
https://www.yamaha.com/ja/news_release/2021/21092901/(in Japanese)
Expressed commitment to strengthening the gender equality initiatives
25
Contribute to sustainability of music culture
Enhance diversity and fulfillment of the people we
work with
Coexist with the natural environment
Culture Society Environment
Joined the 30% Club Japan and announced our endorsement of the goals of the Women’s Empowerment Principles
Certification of Yamaha Corporate Services as a Platinum "Eruboshi" Company Pursuant to the Act on Promotion of Women's Participation and Advancement in the Workplace
Certified as JICA-SDGs Partner
Adopted to preserve traditional instruments and the performances to deliver the artists’ performances with live sound and images
https://www.yamaha.com/en/csr/community/music_culture/#02
https://www.yamaha.com/en/about/design/synapses/id_116/
https://www.yamaha.com/en/csr/human_rights_and_labor_practices/diversity/#02
https://www.yamaha.com/en/csr/human_rights_and_labor_practices/diversity/#07
ESGSegment OverviewPerformance Summary
OtherFinancial Figures
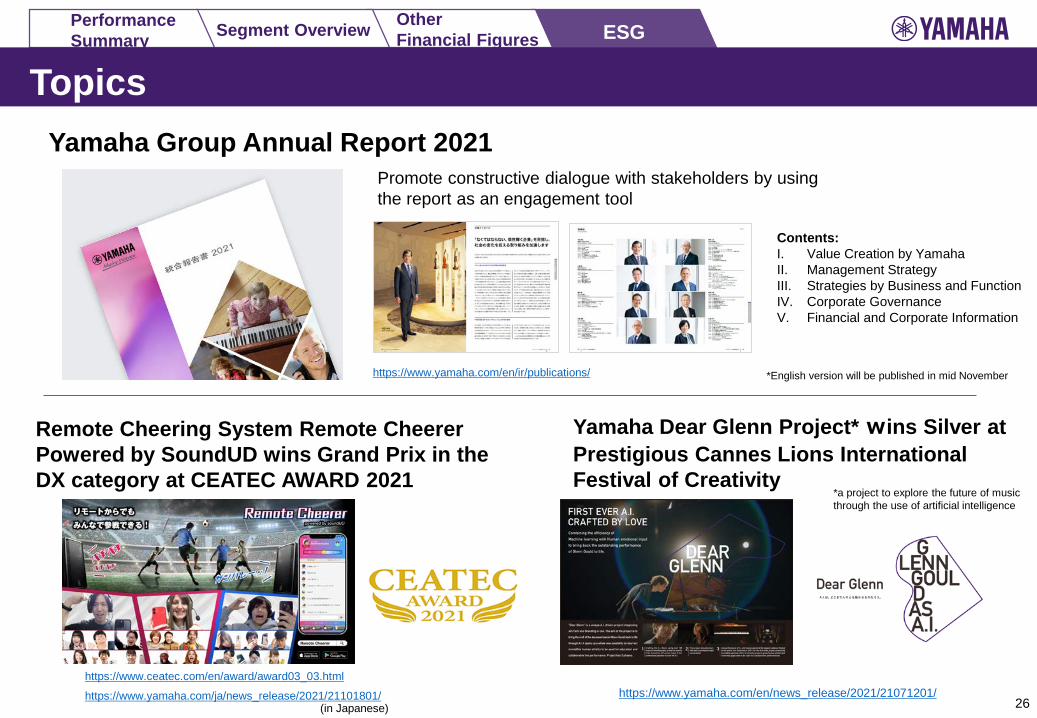
Topics
Remote Cheering System Remote Cheerer Powered by SoundUD wins Grand Prix in the DX category at CEATEC AWARD 2021
Yamaha Dear Glenn Project* wins Silver at Prestigious Cannes Lions International Festival of Creativity
https://www.yamaha.com/ja/news_release/2021/21101801/(in Japanese)
https://www.yamaha.com/en/news_release/2021/21071201/
Yamaha Group Annual Report 2021
https://www.yamaha.com/en/ir/publications/ *English version will be published in mid November
Contents:I. Value Creation by YamahaII. Management StrategyIII. Strategies by Business and FunctionIV. Corporate GovernanceV. Financial and Corporate Information
26
Promote constructive dialogue with stakeholders by using the report as an engagement tool
*a project to explore the future of music through the use of artificial intelligence
https://www.ceatec.com/en/award/award03_03.html
Appendix
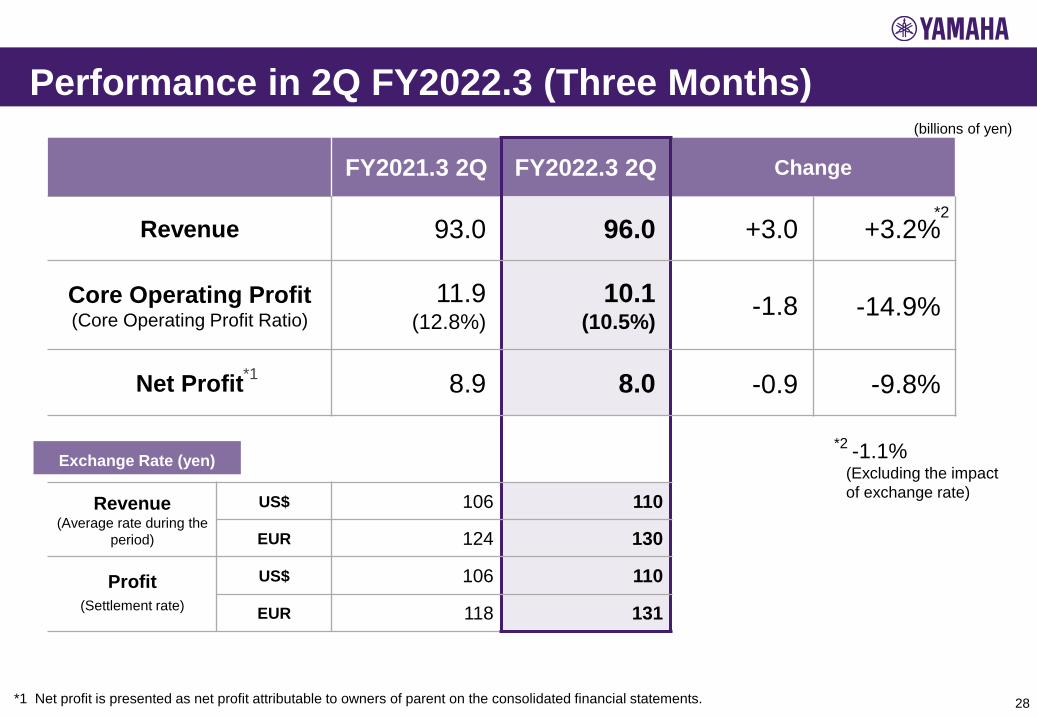
Performance in 2Q FY2022.3 (Three Months)
FY2021.3 2Q FY2022.3 2Q Change
Revenue 93.0 96.0 +3.0 +3.2%
Core Operating Profit(Core Operating Profit Ratio)
11.9(12.8%)
10.1(10.5%) -1.8 -14.9%
Net Profit 8.9 8.0 -0.9 -9.8%
Revenue(Average rate during the
period)
US$ 106 110
EUR 124 130
Profit(Settlement rate)
US$ 106 110
EUR 118 131
-1.1%(Excluding the impact of exchange rate)
*2
*2
28
*1
(billions of yen)
*1 Net profit is presented as net profit attributable to owners of parent on the consolidated financial statements.
Exchange Rate (yen)
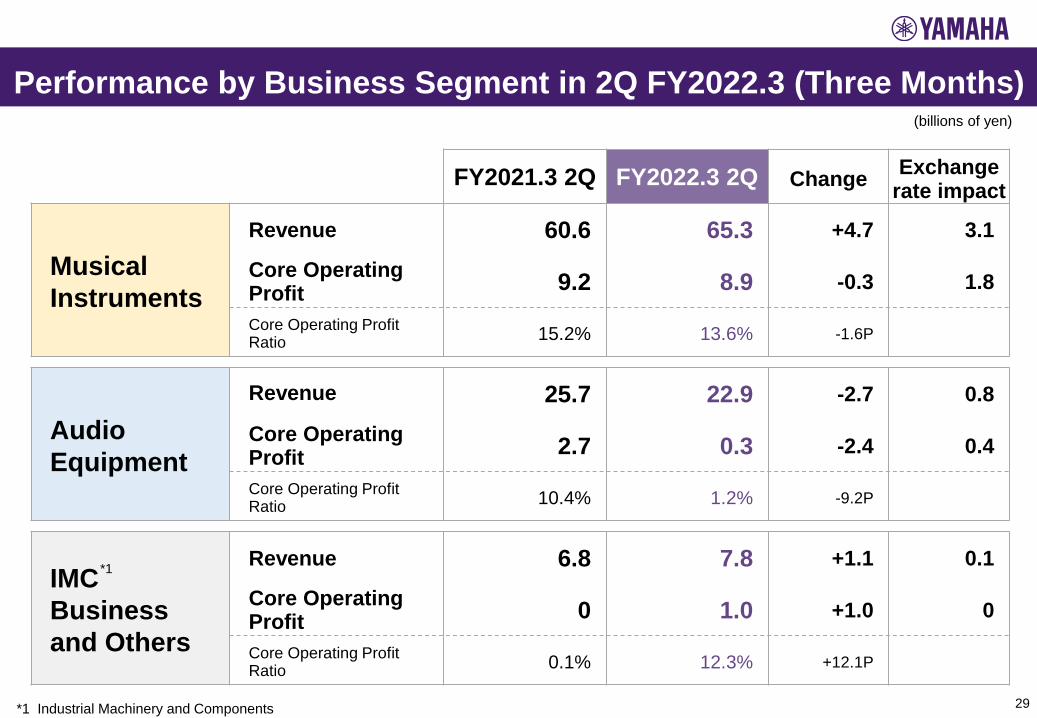
Performance by Business Segment in 2Q FY2022.3 (Three Months)
FY2021.3 2Q FY2022.3 2Q Change Exchange rate impact
Musical Instruments
Revenue 60.6 65.3 +4.7 3.1
Core Operating Profit 9.2 8.9 -0.3 1.8
Core Operating Profit Ratio 15.2% 13.6% -1.6P
Audio Equipment
Revenue 25.7 22.9 -2.7 0.8
Core Operating Profit 2.7 0.3 -2.4 0.4
Core Operating Profit Ratio 10.4% 1.2% -9.2P
IMC Business and Others
Revenue 6.8 7.8 +1.1 0.1
Core Operating Profit 0 1.0 +1.0 0
Core Operating Profit Ratio 0.1% 12.3% +12.1P
29
*1
*1 Industrial Machinery and Components
(billions of yen)
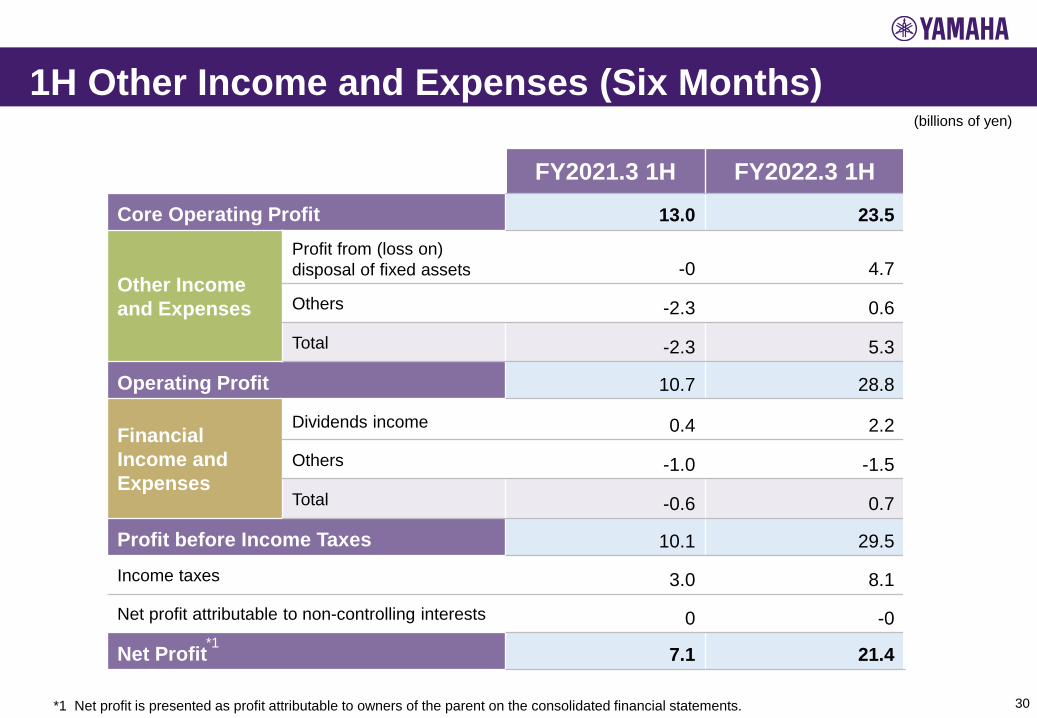
1H Other Income and Expenses (Six Months)
FY2021.3 1H FY2022.3 1HCore Operating Profit 13.0 23.5
Other Income and Expenses
Profit from (loss on) disposal of fixed assets -0 4.7
Others -2.3 0.6
Total -2.3 5.3
Operating Profit 10.7 28.8
Financial Income and Expenses
Dividends income 0.4 2.2
Others -1.0 -1.5
Total -0.6 0.7
Profit before Income Taxes 10.1 29.5
Income taxes 3.0 8.1
Net profit attributable to non-controlling interests 0 -0
Net Profit 7.1 21.4
30
(billions of yen)
*1
*1 Net profit is presented as profit attributable to owners of the parent on the consolidated financial statements.
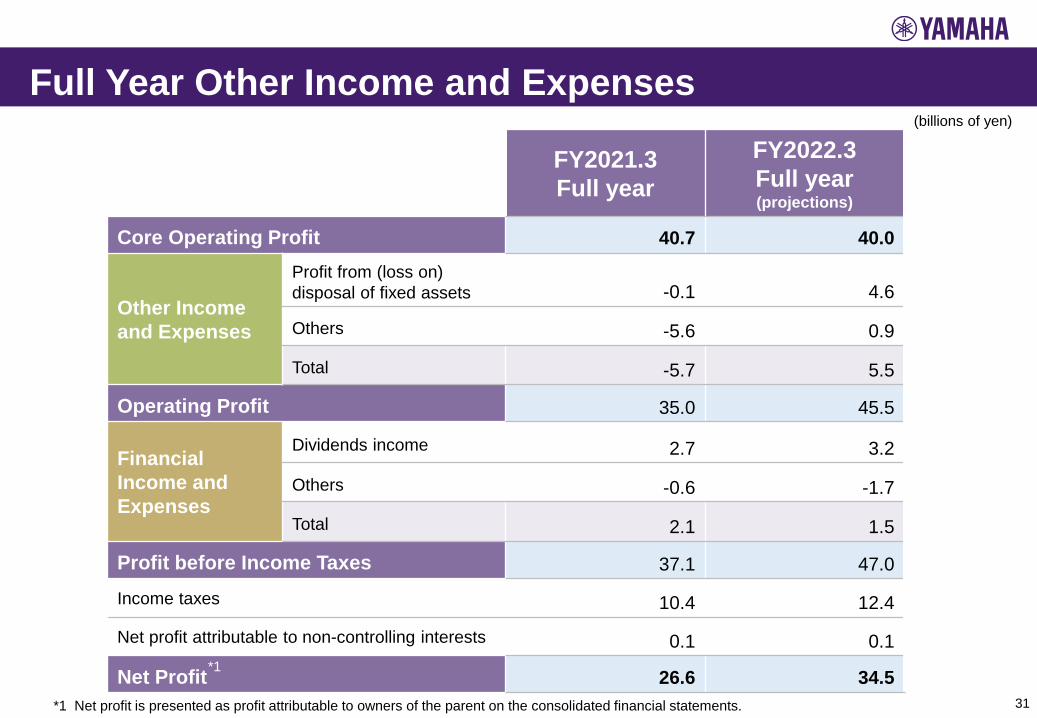
Full Year Other Income and Expenses
FY2021.3 Full year
FY2022.3 Full year (projections)
Core Operating Profit 40.7 40.0
Other Income and Expenses
Profit from (loss on) disposal of fixed assets -0.1 4.6
Others -5.6 0.9
Total -5.7 5.5
Operating Profit 35.0 45.5
Financial Income and Expenses
Dividends income 2.7 3.2
Others -0.6 -1.7
Total 2.1 1.5
Profit before Income Taxes 37.1 47.0
Income taxes 10.4 12.4
Net profit attributable to non-controlling interests 0.1 0.1
Net Profit 26.6 34.531
(billions of yen)
*1
*1 Net profit is presented as profit attributable to owners of the parent on the consolidated financial statements.
In this report, the figures forecast for the Company’s future performance have been calculated on the basis of information currently available to Yamaha and the Yamaha Group. Forecasts are, therefore, subject to risks and uncertainties.
Accordingly, actual performance may differ greatly from our projections depending on changes in the economic conditions surrounding our business, demand trends, and the value of key currencies, such as the U.S. dollar and the euro.