1st quarter 2020 financial results - veoneer
TRANSCRIPT

© 2020 Copyright Veoneer Inc. All Rights Reserved24-Apr-20 VNE Q1'20 Earnings Release Presentation1
1st Quarter 2020Financial Results
Earnings Conference Call and WebcastApril 24, 2020
© 2020 Copyright Veoneer Inc. All Rights Reserved
Safe Harbor Statement
24-Apr-20 VNE Q1'20 Earnings Release Presentation2
This report contains forward-looking statements within the meaning of the Private Securities Litigation Reform Act of 1995. All statements contained in this report other than statements of historicalfact, including without limitation, statements regarding management’s examination of historical operating trends and data, estimates of future sales (including estimates related to order intake), RD&Espend, operating margin, cash flow, taxes or other future operating performance or financial results, are forward-looking statements. In some cases, you can identify these statements by forward-looking words such as “estimates,” “expects,” “anticipates,” “projects,” “plans,” “intends,” “believes,” “may,” “likely,” “might,” “would,” “should,” “could,” or the negative of these terms and other comparableterminology, although not all forward-looking statements contain such words. We have based these forward-looking statements on our current expectations and assumptions and/or data available fromthird parties about future events and trends that we believe may affect our financial condition, results of operations, business strategy, short-term and long-term business operations and objectives andfinancial needs.
New risks and uncertainties arise from time to time, and it is not possible for our management to predict all risks, nor can we assess the impact of all factors on our business or the extent to which anyfactor, or combination of factors, may cause actual results to differ materially from those contained in any forward-looking statements we may make. Factors that could cause actual results to differmaterially from these forward-looking statements include, without limitation, the following: general economic conditions; the cyclical nature of automotive sales and production; changes in generalindustry and market conditions or regional growth or decline; further decreases in light vehicle production; impact of COVID-19 on our customers and their production and product launch schedules;impact of COVID-19 on the Company’s financial condition, business operations and liquidity; our ability to complete the transaction contemplated by the non-binding agreement with Volvo Cars and todivest VBS, which are subject to the negotiation and documentation of definitive agreements and closing; our ability to achieve the intended benefits from our separation from our former parent; ourability to be awarded new business or loss of business from increased competition; higher than anticipated costs and use of resources related to developing new technologies; higher raw material,energy and commodity costs; component shortages; changes in customer and consumer preferences for end products; market acceptance of our new products; dependence on and relationships withcustomers and suppliers; our ability to share RD&E costs with our customers; unfavorable fluctuations in currencies or interest rates among the various jurisdictions in which we operate; costs ordifficulties related to the integration of any new or acquired businesses and technologies; successful integration of acquisitions and operations of joint ventures; successful implementation of strategicpartnerships and collaborations; product liability, warranty and recall claims and investigations and other litigation and customer reactions thereto; higher expenses for our pension and other post-retirement benefits, including higher funding needs for our pension plans; work stoppages or other labor issues; possible adverse results of future litigation, regulatory actions or investigations orinfringement claims; our ability to protect our intellectual property rights; tax assessments by governmental authorities and changes in our tax rate; dependence on key personnel; legislative orregulatory changes impacting or limiting our business; political conditions; and other risks and uncertainties contained in the Company's quarterly reports and Annual Report on Form 10-K.
For any forward-looking statements contained in this report or any other document, we claim the protection of the safe harbor for forward-looking statements contained in the Private SecuritiesLitigation Reform Act of 1995, and we assume no obligation to revise or publicly release the results of any revision to these forward-looking statements, except as required by law. Given these risks anduncertainties, readers are cautioned not to place undue reliance on such forward-looking statements.
© 2020 Copyright Veoneer Inc. All Rights Reserved24-Apr-20 VNE Q1'20 Earnings Release Presentation3
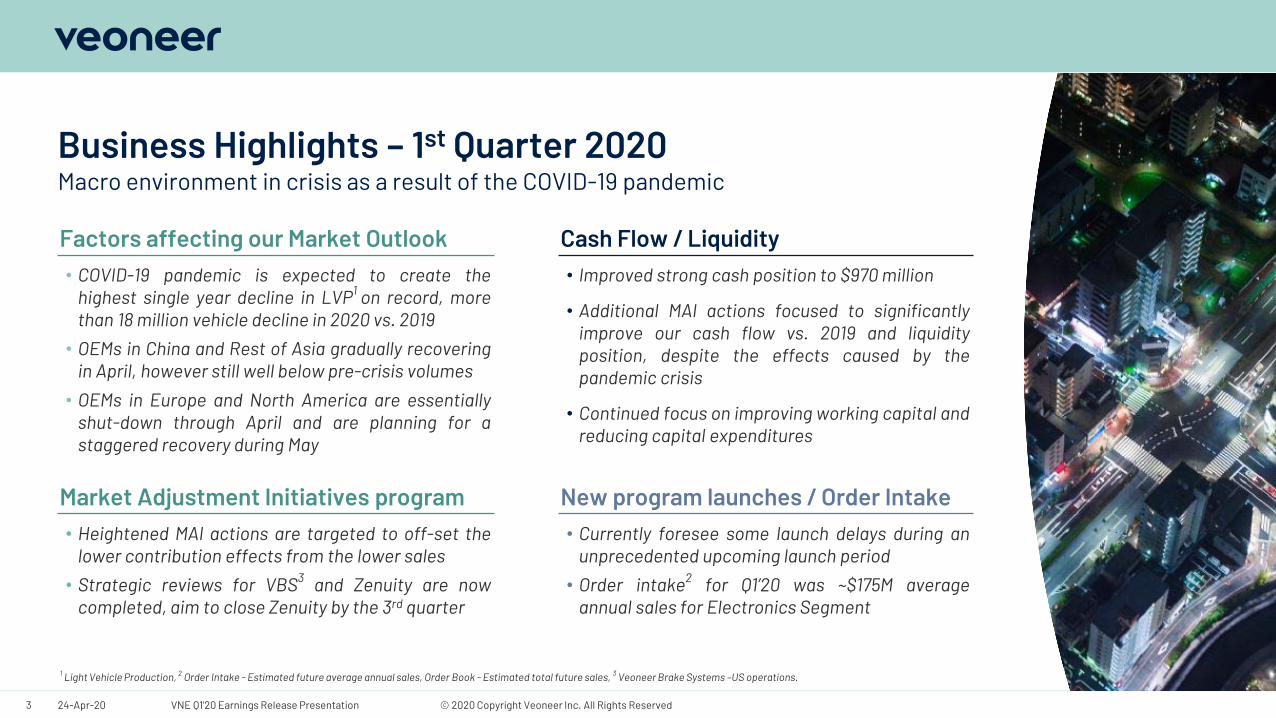
Macro environment in crisis as a result of the COVID-19 pandemicBusiness Highlights – 1st Quarter 2020
Factors affecting our Market Outlook Cash Flow / Liquidity• COVID-19 pandemic is expected to create the
highest single year decline in LVP1 on record, morethan 18 million vehicle decline in 2020 vs. 2019
• OEMs in China and Rest of Asia gradually recoveringin April, however still well below pre-crisis volumes
• OEMs in Europe and North America are essentiallyshut-down through April and are planning for astaggered recovery during May
• Improved strong cash position to $970 million
• Additional MAI actions focused to significantlyimprove our cash flow vs. 2019 and liquidityposition, despite the effects caused by thepandemic crisis
• Continued focus on improving working capital andreducing capital expenditures
Market Adjustment Initiatives program New program launches / Order Intake• Heightened MAI actions are targeted to off-set the
lower contribution effects from the lower sales
• Strategic reviews for VBS3 and Zenuity are nowcompleted, aim to close Zenuity by the 3rd quarter
• Currently foresee some launch delays during anunprecedented upcoming launch period
• Order intake2 for Q1’20 was ~$175M averageannual sales for Electronics Segment
1 Light Vehicle Production, 2 Order Intake - Estimated future average annual sales, Order Book - Estimated total future sales, 3 Veoneer Brake Systems –US operations.
© 2018 Copyright Veoneer Inc. All Rights Reserved24-Apr-20 VNE Q1'20 Earnings Release Presentation4
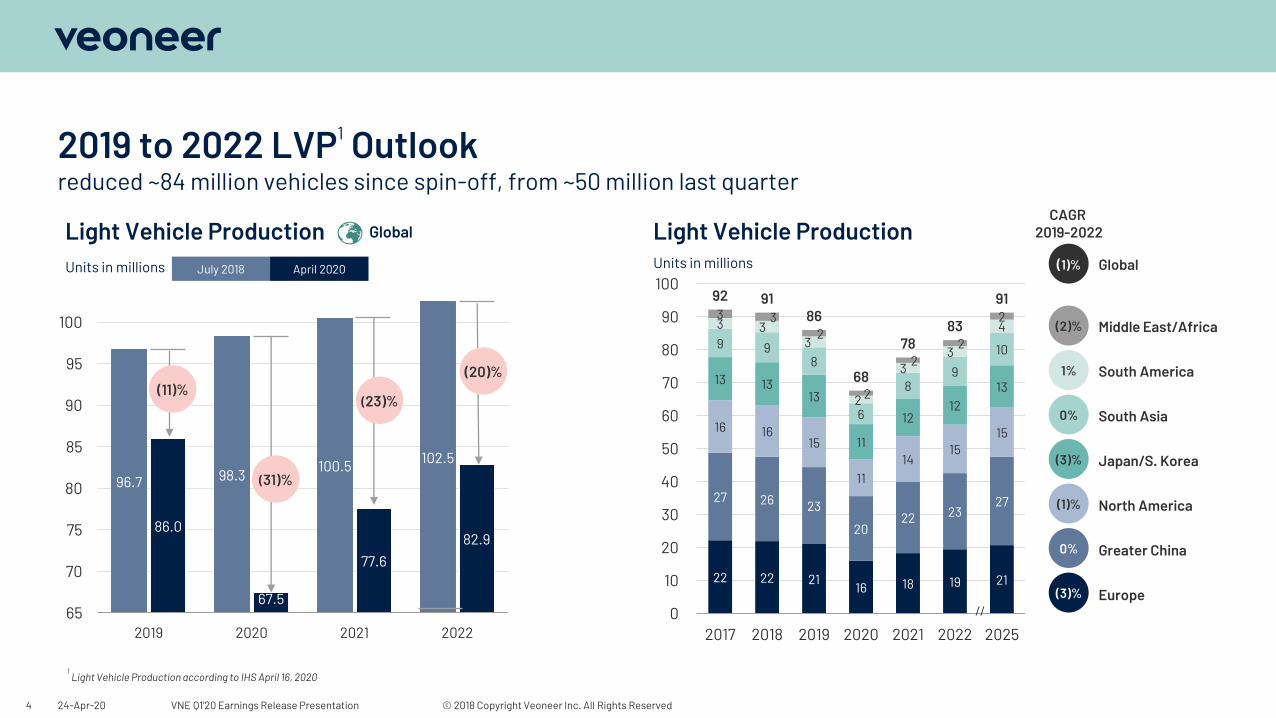
2019 to 2022 LVP1 Outlookreduced ~84 million vehicles since spin-off, from ~50 million last quarter
22 22 2116 18 19 21
27 26 23
2022 23
27
16 1615
1114
1515
13 1313
11
1212
13
9 98
6
89
10
3 33
2
33
4 3 3
2
2
22
2
92 9186
68
7883
91
0
10
20
30
40
50
60
70
80
90
100
2017 2018 2019 2020 2021 2022 2025
Units in millions
(3)%
0%
(1)%
(3)%
0%
1%
(2)%
(1)%
CAGR 2019-2022
96.7 98.3100.5 102.5
86.0
67.5
77.682.9
65
70
75
80
85
90
95
100
2019 2020 2021 2022
Global Light Vehicle Production
Middle East/Africa
South America
South Asia
Japan/S. Korea
North America
Greater China
Europe
Global
(11)%(23)%
(20)%
1Light Vehicle Production according to IHS April 16, 2020
July 2018 April 2020Units in millions
Light Vehicle Production
(31)%
//
© 2020 Copyright Veoneer Inc. All Rights Reserved
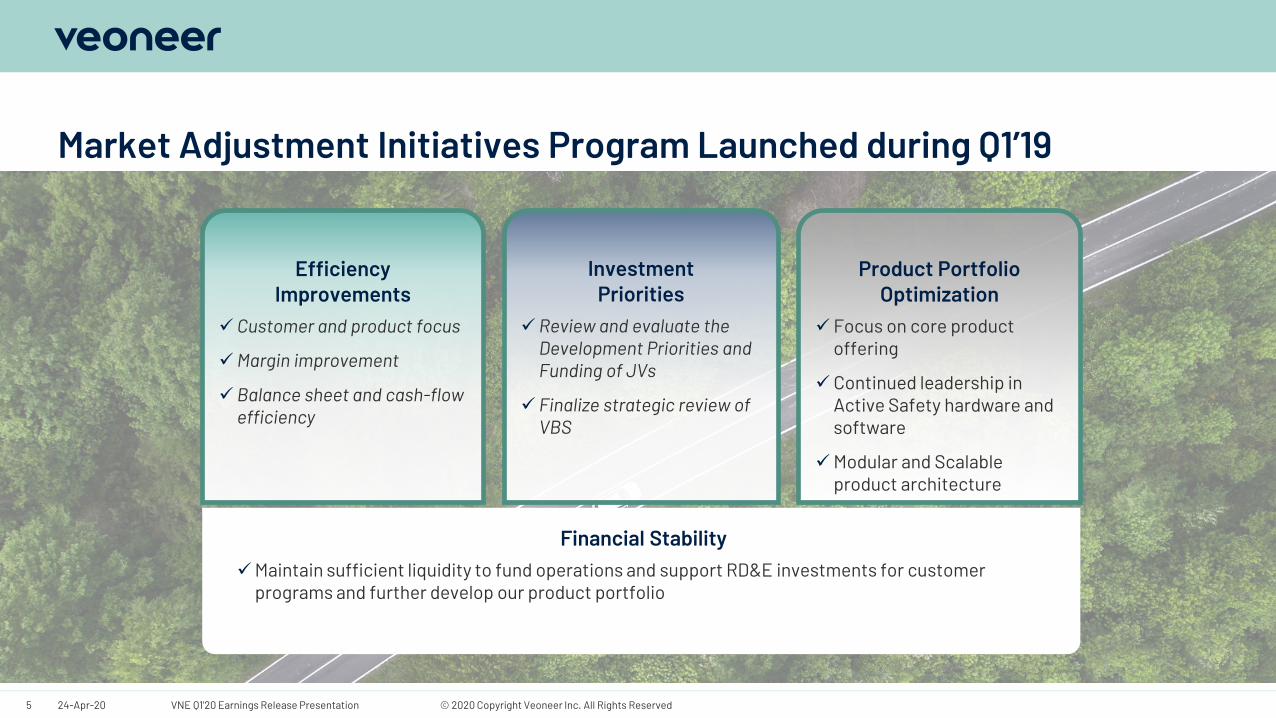
Market Adjustment Initiatives Program Launched during Q1’19
5 24-Apr-20 VNE Q1'20 Earnings Release Presentation
Investment Priorities
✓ Review and evaluate the Development Priorities and Funding of JVs
✓ Finalize strategic review of VBS
Product Portfolio Optimization
✓ Focus on core product offering
✓Continued leadership in Active Safety hardware and software
✓Modular and Scalable product architecture
Efficiency Improvements
✓ Customer and product focus
✓Margin improvement
✓Balance sheet and cash-flow efficiency
Financial Stability✓Maintain sufficient liquidity to fund operations and support RD&E investments for customer
programs and further develop our product portfolio
© 2020 Copyright Veoneer Inc. All Rights Reserved
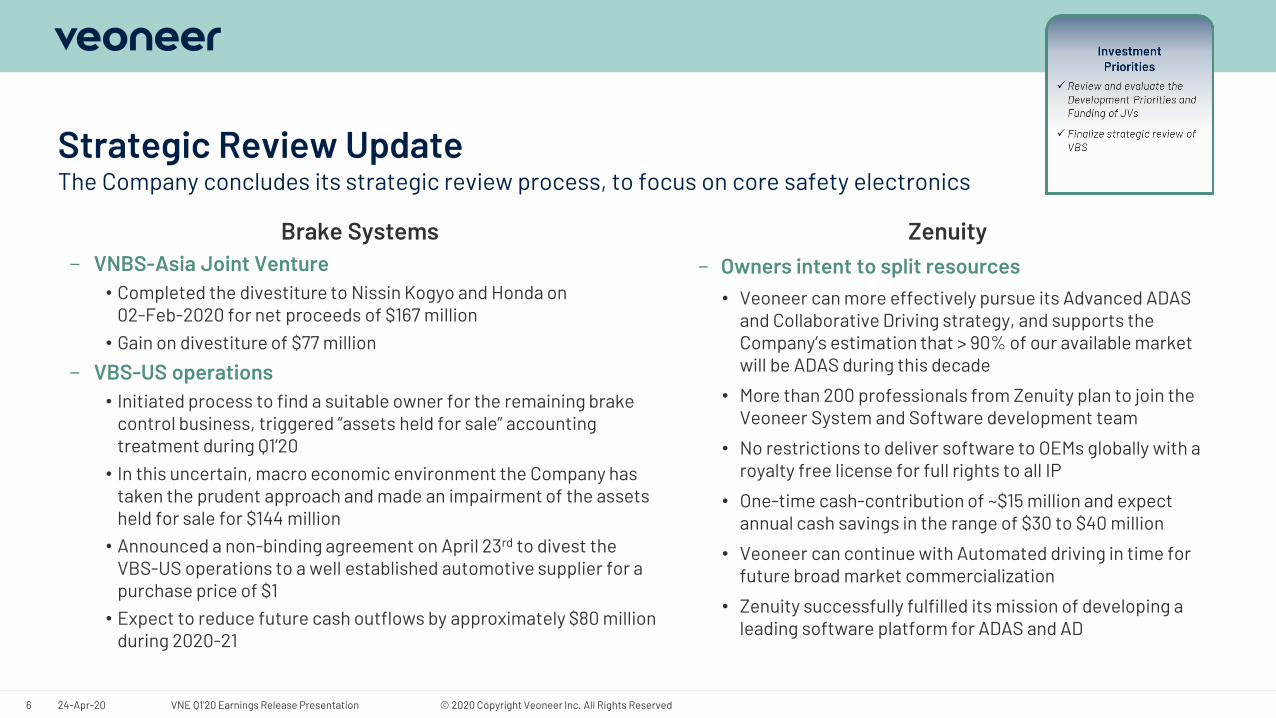
Strategic Review Update
Brake Systems− VNBS-Asia Joint Venture
• Completed the divestiture to Nissin Kogyo and Honda on 02-Feb-2020 for net proceeds of $167 million
• Gain on divestiture of $77 million
− VBS-US operations• Initiated process to find a suitable owner for the remaining brake
control business, triggered “assets held for sale” accounting treatment during Q1’20
• In this uncertain, macro economic environment the Company has taken the prudent approach and made an impairment of the assets held for sale for $144 million
• Announced a non-binding agreement on April 23rd to divest the VBS-US operations to a well established automotive supplier for a purchase price of $1
• Expect to reduce future cash outflows by approximately $80 million during 2020-21
Zenuity− Owners intent to split resources
• Veoneer can more effectively pursue its Advanced ADAS and Collaborative Driving strategy, and supports the Company’s estimation that > 90% of our available market will be ADAS during this decade
• More than 200 professionals from Zenuity plan to join the Veoneer System and Software development team
• No restrictions to deliver software to OEMs globally with a royalty free license for full rights to all IP
• One-time cash-contribution of ~$15 million and expect annual cash savings in the range of $30 to $40 million
• Veoneer can continue with Automated driving in time for future broad market commercialization
• Zenuity successfully fulfilled its mission of developing a leading software platform for ADAS and AD
24-Apr-20 VNE Q1'20 Earnings Release Presentation6
The Company concludes its strategic review process, to focus on core safety electronics
© 2018 Copyright Veoneer Inc. All Rights Reserved
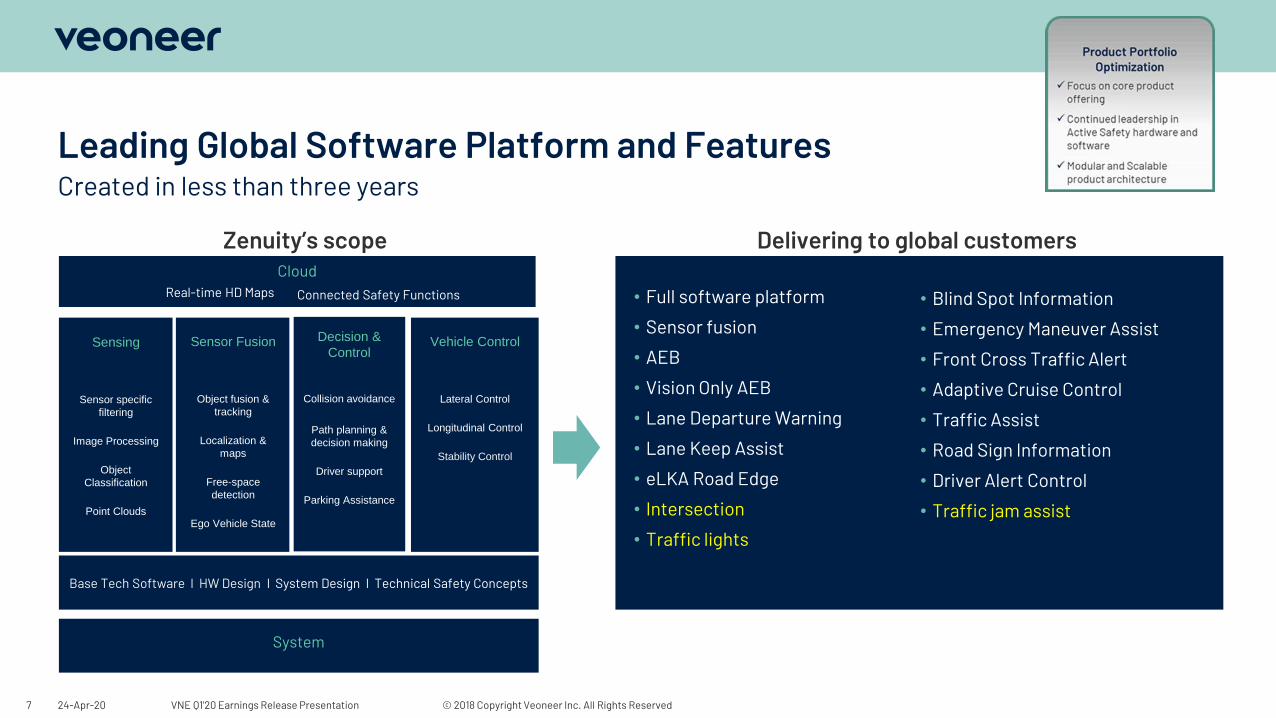
Leading Global Software Platform and Features
24-Apr-20 VNE Q1'20 Earnings Release Presentation7
Created in less than three years
Cloud
Base Tech Software l HW Design l System Design l Technical Safety Concepts
Vehicle Control
Lateral Control
Longitudinal Control
Stability Control
Real-time HD Maps Connected Safety Functions
System
Zenuity’s scope Delivering to global customers
• Full software platform
• Sensor fusion
• AEB
• Vision Only AEB
• Lane Departure Warning
• Lane Keep Assist
• eLKA Road Edge
• Intersection
• Traffic lights
• Blind Spot Information
• Emergency Maneuver Assist
• Front Cross Traffic Alert
• Adaptive Cruise Control
• Traffic Assist
• Road Sign Information
• Driver Alert Control
• Traffic jam assist
Decision &
Control
Collision avoidance
Path planning &
decision making
Driver support
Parking Assistance
Sensor Fusion
Object fusion &
tracking
Localization &
maps
Free-space
detection
Ego Vehicle State
Sensing
Sensor specific
filtering
Image Processing
Object
Classification
Point Clouds
© 2020 Copyright Veoneer Inc. All Rights Reserved24-Apr-20 VNE Q1'20 Earnings Release Presentation8
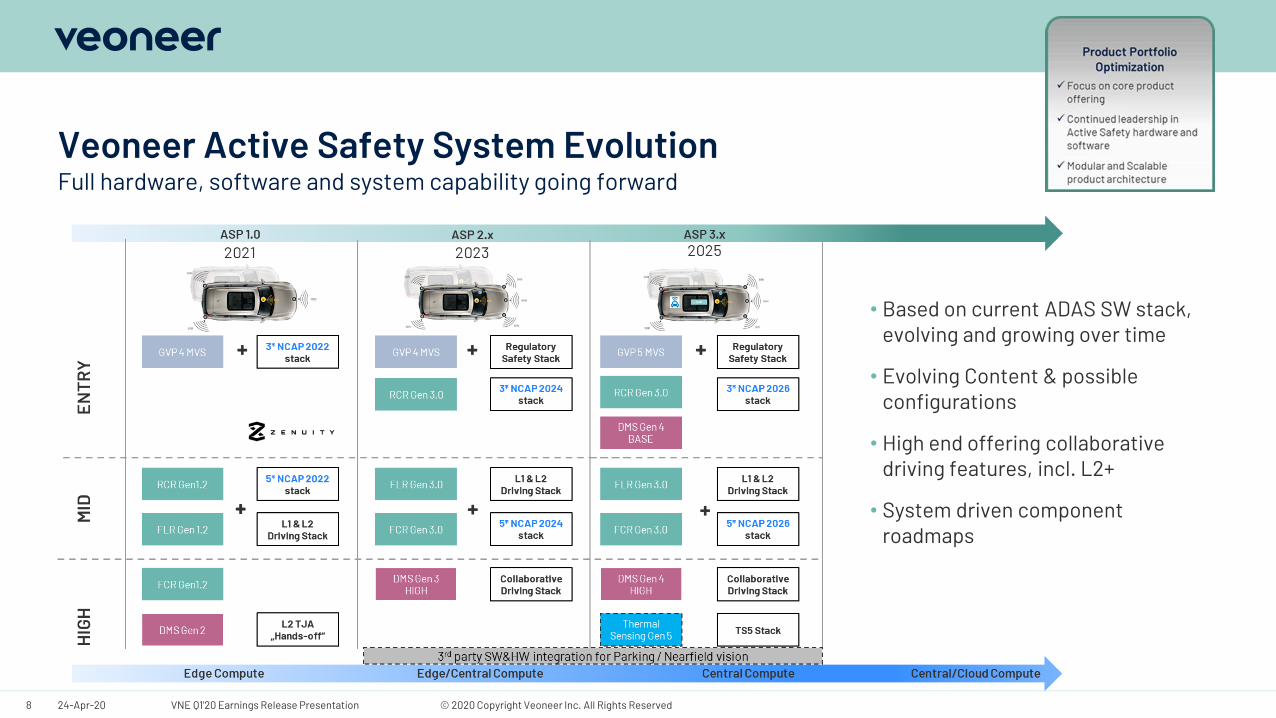
Full hardware, software and system capability going forwardVeoneer Active Safety System Evolution
• Based on current ADAS SW stack, evolving and growing over time
• Evolving Content & possible configurations
• High end offering collaborative driving features, incl. L2+
• System driven component roadmaps
© 2020 Copyright Veoneer Inc. All Rights Reserved
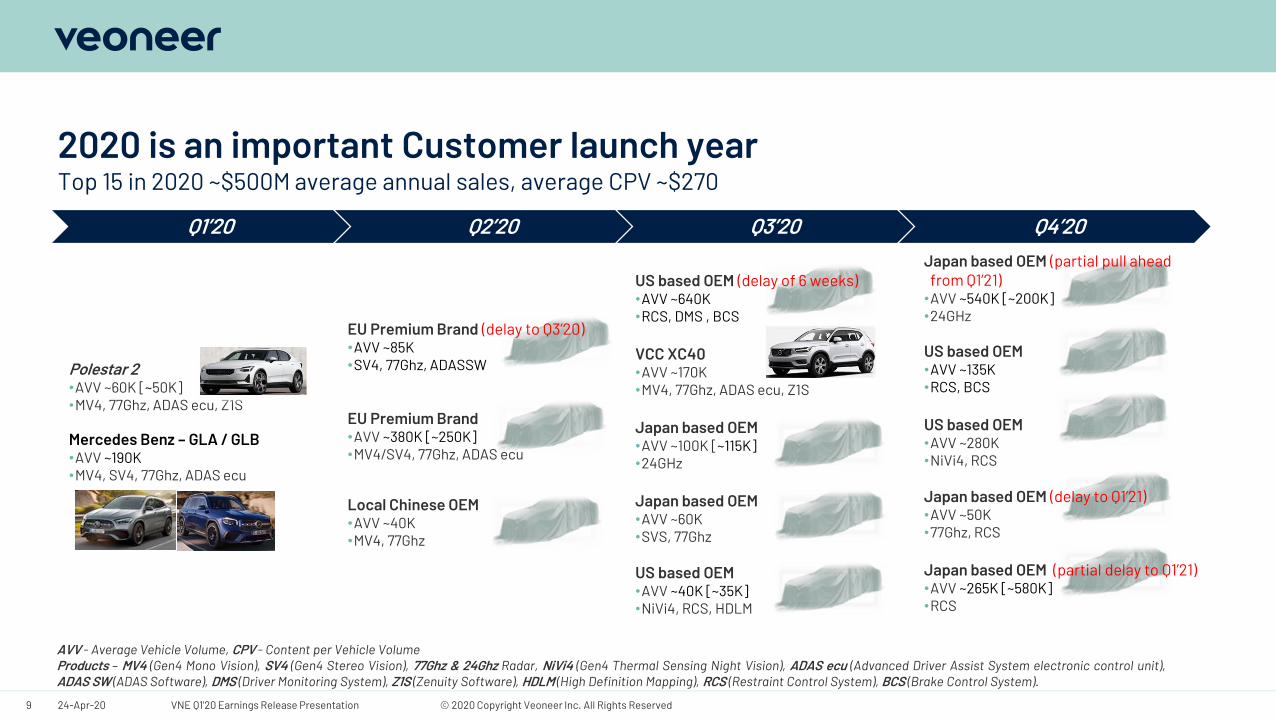
Japan based OEM (partial pull ahead from Q1’21)•AVV ~540K [~200K]•24GHz
US based OEM•AVV ~135K•RCS, BCS
US based OEM•AVV ~280K•NiVi4, RCS
Japan based OEM (delay to Q1’21)•AVV ~50K•77Ghz, RCS
Japan based OEM (partial delay to Q1’21)•AVV ~265K [~580K]•RCS
Polestar 2•AVV ~60K [~50K]•MV4, 77Ghz, ADAS ecu, Z1S
Mercedes Benz – GLA / GLB•AVV ~190K•MV4, SV4, 77Ghz, ADAS ecu
2020 is an important Customer launch yearTop 15 in 2020 ~$500M average annual sales, average CPV ~$270
24-Apr-20 VNE Q1'20 Earnings Release Presentation9
AVV - Average Vehicle Volume, CPV - Content per Vehicle VolumeProducts – MV4 (Gen4 Mono Vision), SV4 (Gen4 Stereo Vision), 77Ghz & 24Ghz Radar, NiVi4 (Gen4 Thermal Sensing Night Vision), ADAS ecu (Advanced Driver Assist System electronic control unit),ADAS SW (ADAS Software), DMS (Driver Monitoring System), Z1S (Zenuity Software), HDLM (High Definition Mapping), RCS (Restraint Control System), BCS (Brake Control System).
EU Premium Brand (delay to Q3’20)•AVV ~85K•SV4, 77Ghz, ADASSW
EU Premium Brand•AVV ~380K [~250K]•MV4/SV4, 77Ghz, ADAS ecu
Local Chinese OEM•AVV ~40K•MV4, 77Ghz
Q1’20 Q2’20 Q3’20 Q4’20
US based OEM (delay of 6 weeks)•AVV ~640K•RCS, DMS , BCS
VCC XC40 •AVV ~170K•MV4, 77Ghz, ADAS ecu, Z1S
Japan based OEM•AVV ~100K [~115K]•24GHz
Japan based OEM•AVV ~60K•SVS, 77Ghz
US based OEM•AVV ~40K [~35K]•NiVi4, RCS, HDLM
© 2020 Copyright Veoneer Inc. All Rights Reserved
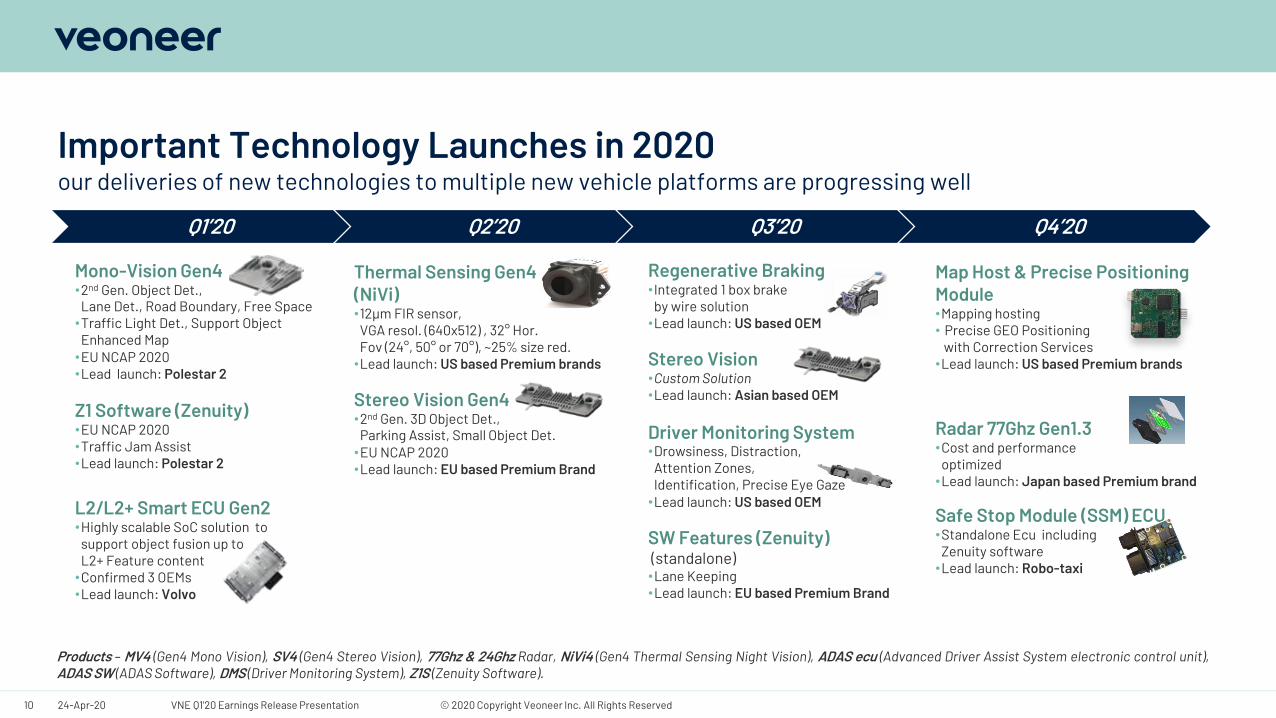
Map Host & Precise Positioning Module•Mapping hosting• Precise GEO Positioning
with Correction Services•Lead launch: US based Premium brands
Radar 77Ghz Gen1.3•Cost and performance
optimized •Lead launch: Japan based Premium brand
Safe Stop Module (SSM) ECU•Standalone Ecu including
Zenuity software•Lead launch: Robo-taxi
Mono-Vision Gen4•2nd Gen. Object Det.,
Lane Det., Road Boundary, Free Space•Traffic Light Det., Support Object
Enhanced Map•EU NCAP 2020•Lead launch: Polestar 2
Z1 Software (Zenuity)•EU NCAP 2020 •Traffic Jam Assist•Lead launch: Polestar 2
L2/L2+ Smart ECU Gen2•Highly scalable SoC solution to
support object fusion up to L2+ Feature content•Confirmed 3 OEMs •Lead launch: Volvo
Regenerative Braking•Integrated 1 box brake
by wire solution•Lead launch: US based OEM
Stereo Vision•Custom Solution •Lead launch: Asian based OEM
Driver Monitoring System•Drowsiness, Distraction,
Attention Zones, Identification, Precise Eye Gaze•Lead launch: US based OEM
SW Features (Zenuity)(standalone)•Lane Keeping•Lead launch: EU based Premium Brand
Important Technology Launches in 2020
24-Apr-20 VNE Q1'20 Earnings Release Presentation10
Thermal Sensing Gen4 (NiVi)•12µm FIR sensor,
VGA resol. (640x512) , 32° Hor. Fov (24°, 50° or 70°), ~25% size red.•Lead launch: US based Premium brands
Stereo Vision Gen4•2nd Gen. 3D Object Det.,
Parking Assist, Small Object Det.•EU NCAP 2020 •Lead launch: EU based Premium Brand
Q1’20 Q2’20 Q3’20 Q4’20
Products – MV4 (Gen4 Mono Vision), SV4 (Gen4 Stereo Vision), 77Ghz & 24Ghz Radar, NiVi4 (Gen4 Thermal Sensing Night Vision), ADAS ecu (Advanced Driver Assist System electronic control unit),ADAS SW (ADAS Software), DMS (Driver Monitoring System), Z1S (Zenuity Software).
our deliveries of new technologies to multiple new vehicle platforms are progressing well
© 2020 Copyright Veoneer Inc. All Rights Reserved
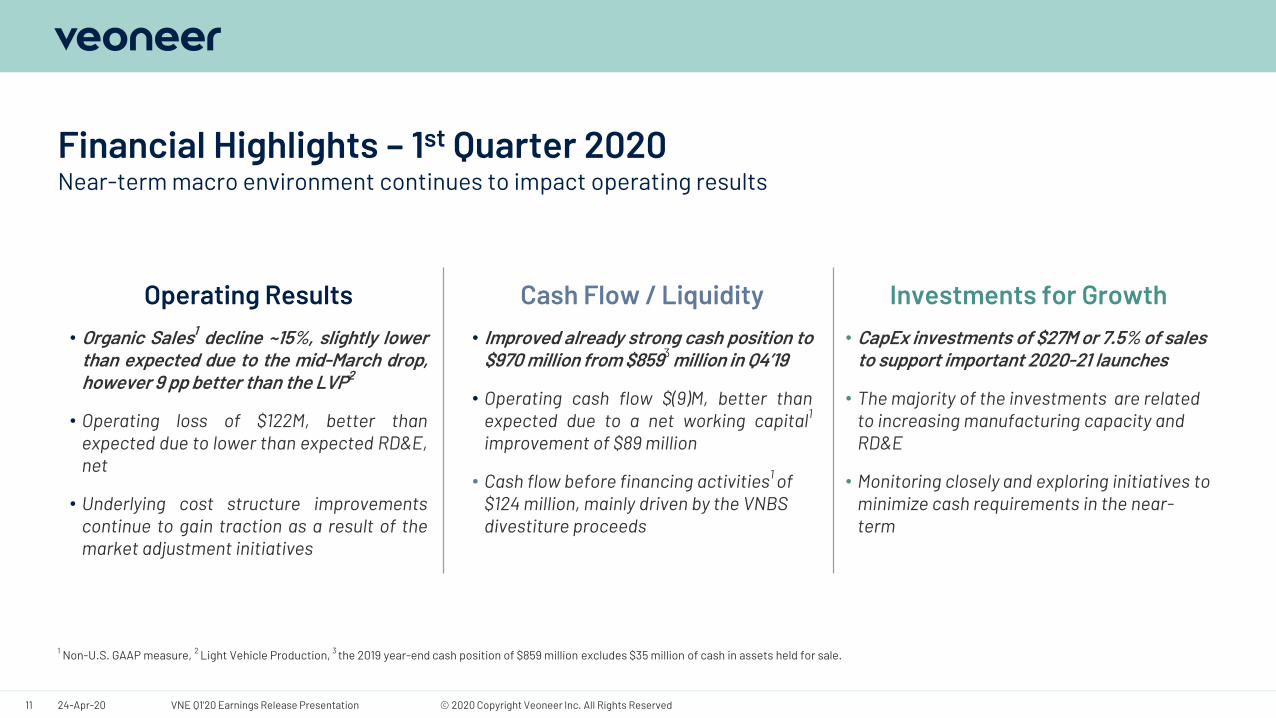
Financial Highlights – 1st Quarter 2020
24-Apr-20 VNE Q1'20 Earnings Release Presentation11
Near-term macro environment continues to impact operating results
Operating Results• Organic Sales1 decline ~15%, slightly lower
than expected due to the mid-March drop,however 9 pp better than the LVP2
• Operating loss of $122M, better thanexpected due to lower than expected RD&E,net
• Underlying cost structure improvementscontinue to gain traction as a result of themarket adjustment initiatives
Cash Flow / Liquidity• Improved already strong cash position to
$970 million from $8593 million in Q4’19
• Operating cash flow $(9)M, better thanexpected due to a net working capital1
improvement of $89 million
• Cash flow before financing activities1 of $124 million, mainly driven by the VNBS divestiture proceeds
Investments for Growth • CapEx investments of $27M or 7.5% of sales
to support important 2020-21 launches
• The majority of the investments are related to increasing manufacturing capacity and RD&E
• Monitoring closely and exploring initiatives to minimize cash requirements in the near-term
1 Non-U.S. GAAP measure, 2 Light Vehicle Production, 3 the 2019 year-end cash position of $859 million excludes $35 million of cash in assets held for sale.
© 2020 Copyright Veoneer Inc. All Rights Reserved24-Apr-20 VNE Q1'20 Earnings Release Presentation12
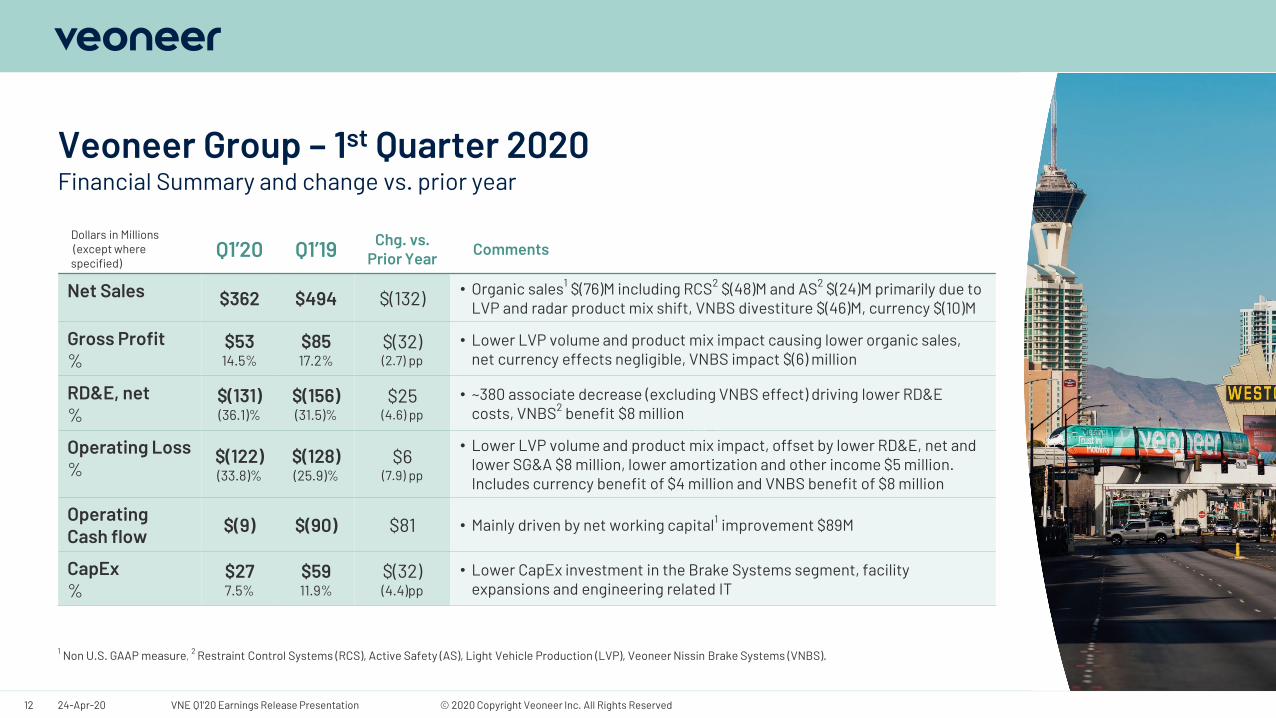
Financial Summary and change vs. prior yearVeoneer Group – 1st Quarter 2020
1 Non U.S. GAAP measure,2 Restraint Control Systems (RCS), Active Safety (AS), Light Vehicle Production (LVP), Veoneer Nissin Brake Systems (VNBS).
Dollars in Millions (except where specified)
Q1’20 Q1’19 Chg. vs. Prior Year
Comments
Net Sales $362 $494 $(132) • Organic sales1 $(76)M including RCS2 $(48)M and AS2 $(24)M primarily due to LVP and radar product mix shift, VNBS divestiture $(46)M, currency $(10)M
Gross Profit%
$5314.5%
$8517.2%
$(32)(2.7) pp
• Lower LVP volume and product mix impact causing lower organic sales, net currency effects negligible, VNBS impact $(6) million
RD&E, net%
$(131)(36.1)%
$(156)(31.5)%
$25(4.6) pp
• ~380 associate decrease (excluding VNBS effect) driving lower RD&E costs, VNBS2 benefit $8 million
Operating Loss%
$(122)(33.8)%
$(128)(25.9)%
$6(7.9) pp
• Lower LVP volume and product mix impact, offset by lower RD&E, net and lower SG&A $8 million, lower amortization and other income $5 million. Includes currency benefit of $4 million and VNBS benefit of $8 million
Operating Cash flow $(9) $(90) $81 • Mainly driven by net working capital1 improvement $89M
CapEx%
$277.5%
$5911.9%
$(32)(4.4)pp
• Lower CapEx investment in the Brake Systems segment, facility expansions and engineering related IT
© 2020 Copyright Veoneer Inc. All Rights Reserved24-Apr-20 VNE Q1'20 Earnings Release Presentation13
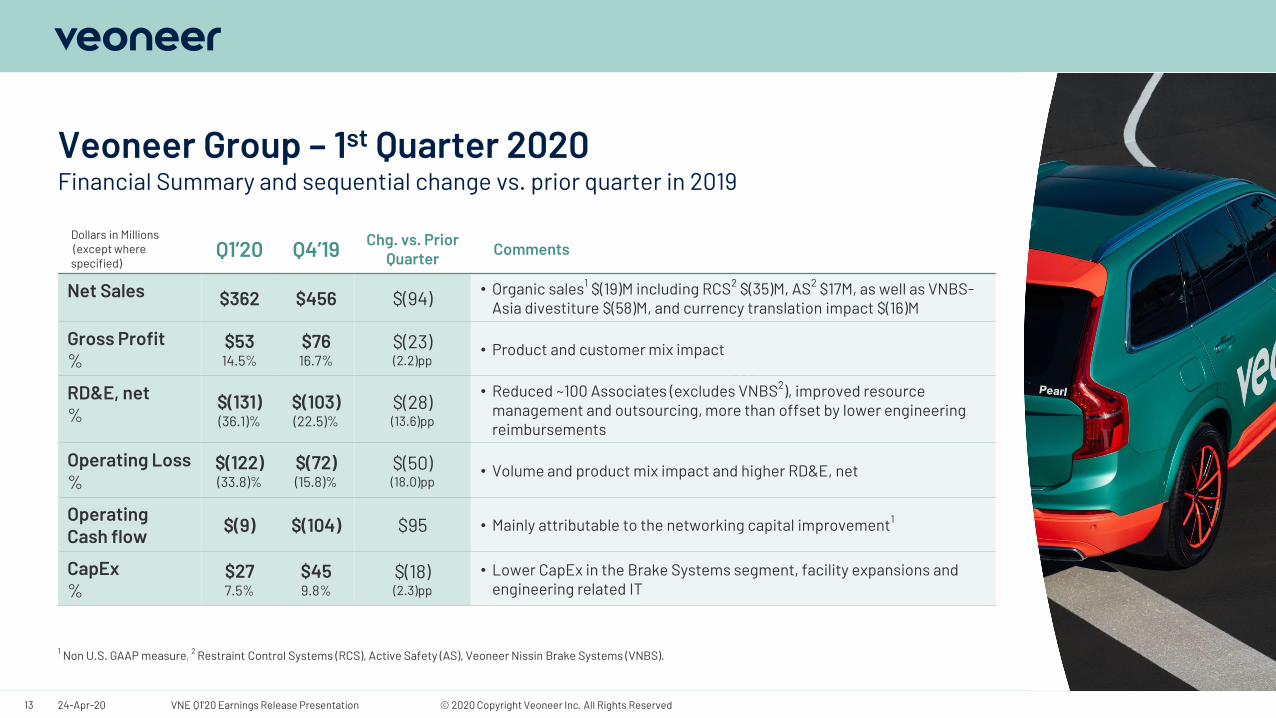
Financial Summary and sequential change vs. prior quarter in 2019Veoneer Group – 1st Quarter 2020
Dollars in Millions (except where specified)
Q1’20 Q4’19 Chg. vs. Prior Quarter
Comments
Net Sales $362 $456 $(94) • Organic sales1 $(19)M including RCS2 $(35)M, AS2 $17M, as well as VNBS-Asia divestiture $(58)M, and currency translation impact $(16)M
Gross Profit%
$5314.5%
$7616.7%
$(23)(2.2)pp
• Product and customer mix impact
RD&E, net%
$(131)(36.1)%
$(103)(22.5)%
$(28)(13.6)pp
• Reduced ~100 Associates (excludes VNBS2), improved resource management and outsourcing, more than offset by lower engineering reimbursements
Operating Loss%
$(122)(33.8)%
$(72)(15.8)%
$(50)(18.0)pp
• Volume and product mix impact and higher RD&E, net
Operating Cash flow $(9) $(104) $95 • Mainly attributable to the networking capital improvement1
CapEx%
$277.5%
$459.8%
$(18)(2.3)pp
• Lower CapEx in the Brake Systems segment, facility expansions and engineering related IT
1 Non U.S. GAAP measure,2 Restraint Control Systems (RCS), Active Safety (AS), Veoneer Nissin Brake Systems (VNBS).
© 2020 Copyright Veoneer Inc. All Rights Reserved
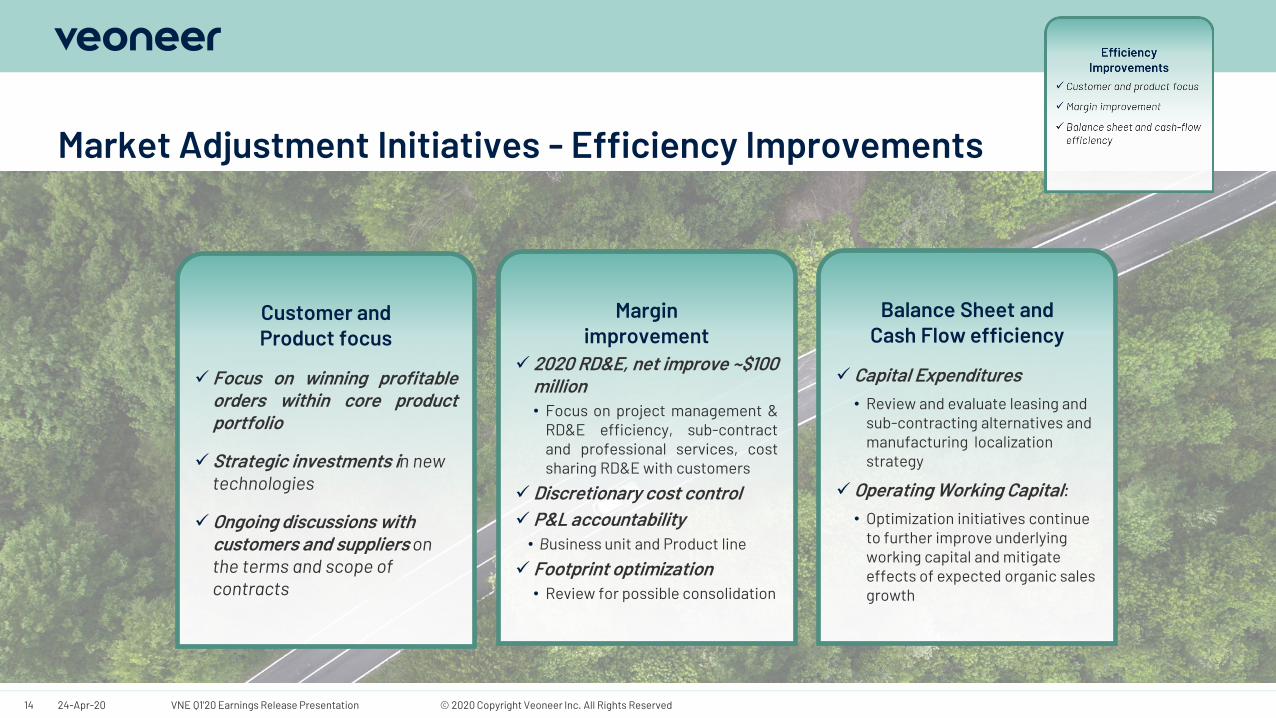
Market Adjustment Initiatives - Efficiency Improvements
14 24-Apr-20 VNE Q1'20 Earnings Release Presentation
Customer and Product focus
✓ Focus on winning profitableorders within core productportfolio
✓Strategic investments in new technologies
✓Ongoing discussions with customers and suppliers on the terms and scope of contracts
Margin improvement
✓ 2020 RD&E, net improve ~$100million• Focus on project management &
RD&E efficiency, sub-contractand professional services, costsharing RD&E with customers
✓Discretionary cost control✓P&L accountability• Business unit and Product line
✓ Footprint optimization• Review for possible consolidation
Balance Sheet and Cash Flow efficiency
✓Capital Expenditures• Review and evaluate leasing and
sub-contracting alternatives and manufacturing localization strategy
✓Operating Working Capital:• Optimization initiatives continue
to further improve underlying working capital and mitigate effects of expected organic sales growth
© 2020 Copyright Veoneer Inc. All Rights Reserved
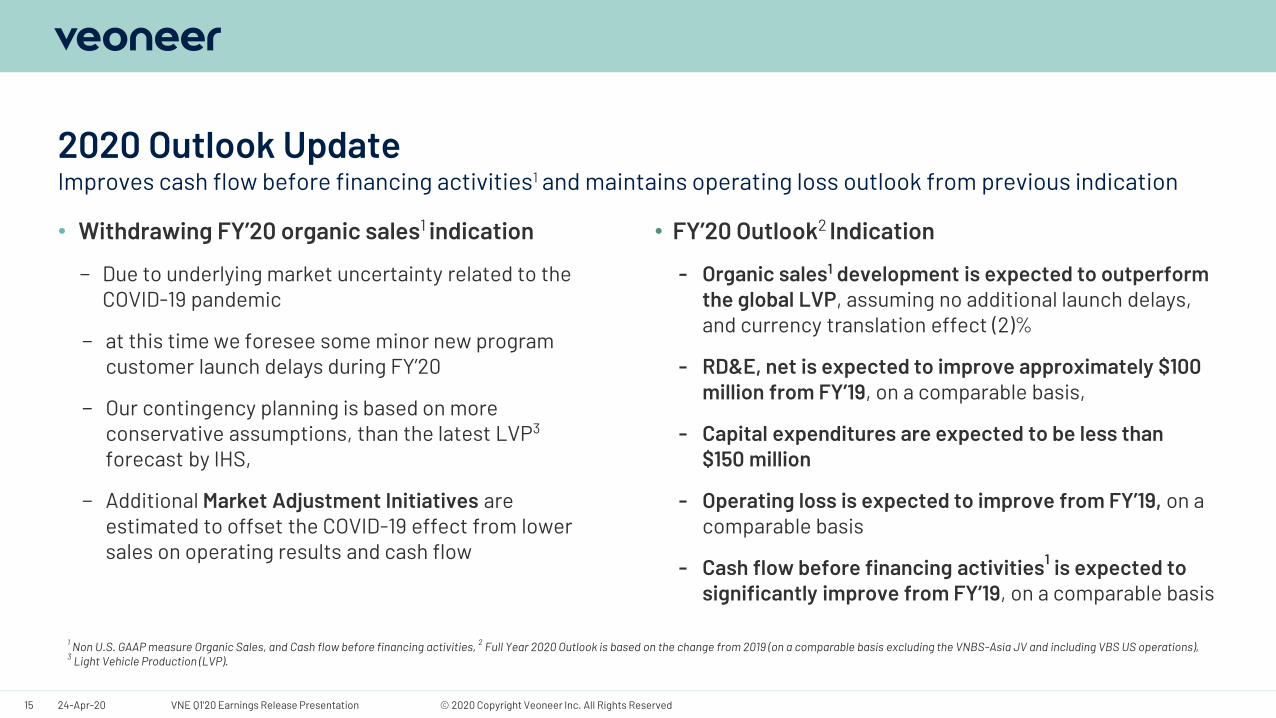
2020 Outlook Update
• FY’20 Outlook2 Indication
- Organic sales1 development is expected to outperform the global LVP, assuming no additional launch delays, and currency translation effect (2)%
- RD&E, net is expected to improve approximately $100 million from FY’19, on a comparable basis,
- Capital expenditures are expected to be less than $150 million
- Operating loss is expected to improve from FY’19, on a comparable basis
- Cash flow before financing activities1 is expected to significantly improve from FY’19, on a comparable basis
Improves cash flow before financing activities1 and maintains operating loss outlook from previous indication
24-Apr-20 VNE Q1'20 Earnings Release Presentation15
1 Non U.S. GAAP measure Organic Sales, and Cash flow before financing activities, 2 Full Year 2020 Outlook is based on the change from 2019 (on a comparable basis excluding the VNBS-Asia JV and including VBS US operations), 3 Light Vehicle Production (LVP).
• Withdrawing FY’20 organic sales1 indication
− Due to underlying market uncertainty related to the COVID-19 pandemic
− at this time we foresee some minor new program customer launch delays during FY’20
− Our contingency planning is based on more conservative assumptions, than the latest LVP3
forecast by IHS,
− Additional Market Adjustment Initiatives are estimated to offset the COVID-19 effect from lower sales on operating results and cash flow
© 2018 Copyright Veoneer Inc. All Rights Reserved24-Apr-20 VNE Q1'20 Earnings Release Presentation16
Creating Trust in MobilityFlawless DeliveryCustomer-Centric CollaborationHuman-Centric Innovation
Thank You!