1st quarter financial results fy ending march 2020
TRANSCRIPT
―― Driving Value Creation ――1st Quarter Financial Results
FY Ending March 2020
July 31, 2019Mitsui & Co., Ltd.
A Cautionary Note on Forward-Looking Statements: This material contains statements (including figures) regarding Mitsui & Co., Ltd. (“Mitsui”)’s corporate strategies, objectives, and views of future developments that are forward-looking in nature and are not simply reiterations of historical facts. These statements are presented to inform stakeholders of the views of Mitsui’s management but should not be relied on solely in making investment and other decisions. You should be aware that a number of known or unknown risks, uncertainties and other factors could lead to outcomes that differ materially from those presented in such forward-looking statements. These risks, uncertainties and other factors referred to above include, but are not limited to, those contained in Mitsui’s latest Annual Securities Report and Quarterly Securities Report, and Mitsui undertakes no obligation to publicly update or revise any forward-looking statements.
COPYRIGHT © MITSUI & CO., LTD. ALL RIGHTS RESERVED.
Contents
Operating Results
Supplementary Information
Segment Data
1
2
3
4
1
Progress of Medium-term Management Plan
COPYRIGHT © MITSUI & CO., LTD. ALL RIGHTS RESERVED.
Progress of Medium-term Management Plan1
2
COPYRIGHT © MITSUI & CO., LTD. ALL RIGHTS RESERVED.
3
FY Mar/2019 Q1
FY Mar/2020 Q1 Change FY Mar/2020
business plan Progress
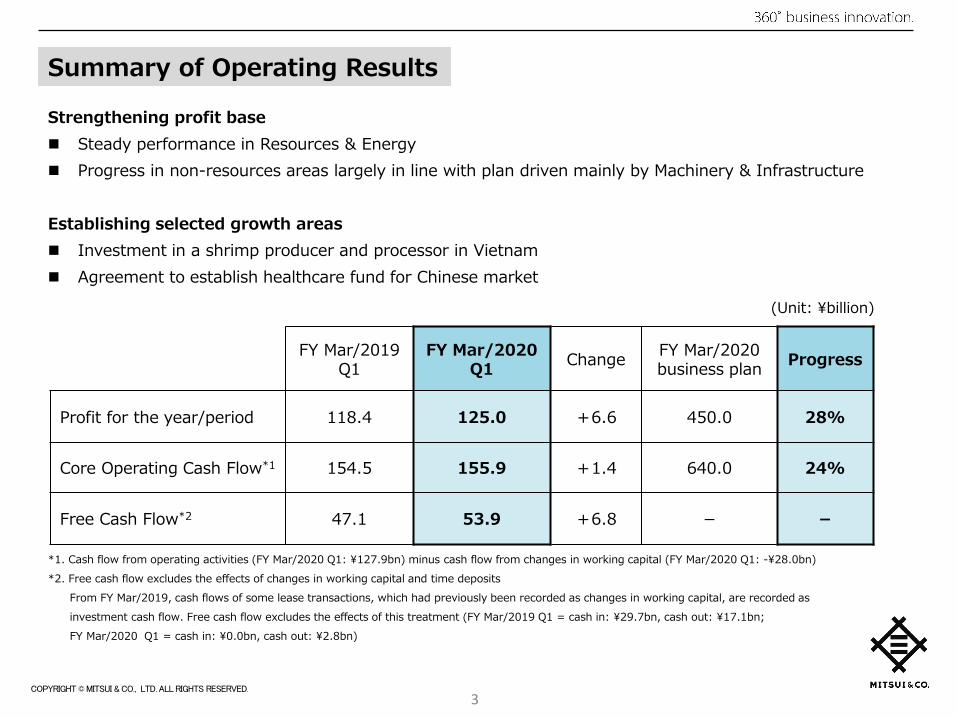
Profit for the year/period 118.4 125.0 +6.6 450.0 28%
Core Operating Cash Flow*1 154.5 155.9 +1.4 640.0 24%
Free Cash Flow*2 47.1 53.9 +6.8 - -
Strengthening profit base Steady performance in Resources & Energy Progress in non-resources areas largely in line with plan driven mainly by Machinery & Infrastructure
Establishing selected growth areas Investment in a shrimp producer and processor in Vietnam Agreement to establish healthcare fund for Chinese market
(Unit: ¥billion)
Summary of Operating Results
*1. Cash flow from operating activities (FY Mar/2020 Q1: ¥127.9bn) minus cash flow from changes in working capital (FY Mar/2020 Q1: -¥28.0bn)*2. Free cash flow excludes the effects of changes in working capital and time deposits
From FY Mar/2019, cash flows of some lease transactions, which had previously been recorded as changes in working capital, are recorded asinvestment cash flow. Free cash flow excludes the effects of this treatment (FY Mar/2019 Q1 = cash in: ¥29.7bn, cash out: ¥17.1bn; FY Mar/2020 Q1 = cash in: ¥0.0bn, cash out: ¥2.8bn)
COPYRIGHT © MITSUI & CO., LTD. ALL RIGHTS RESERVED.
Profit for the year/period Core Operating Cash Flow
FY Mar/2020 Q1 Result
Business plan Progress
FY Mar/2020 Q1 Result
Business plan Progress
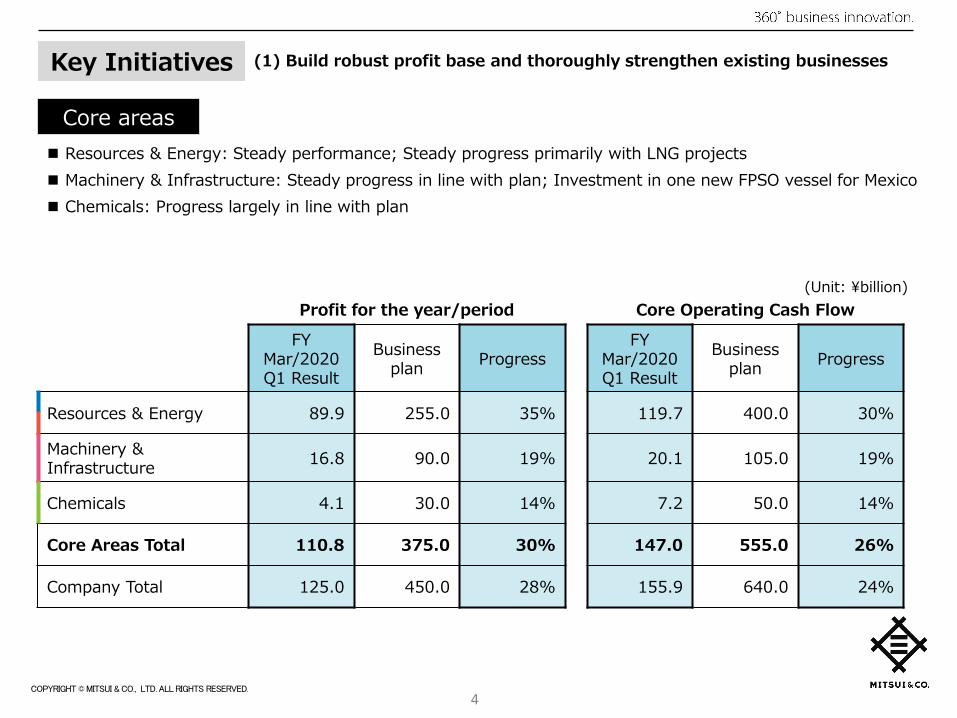
Resources & Energy 89.9 255.0 35% 119.7 400.0 30%
Machinery & Infrastructure 16.8 90.0 19% 20.1 105.0 19%
Chemicals 4.1 30.0 14% 7.2 50.0 14%
Core Areas Total 110.8 375.0 30% 147.0 555.0 26%
Company Total 125.0 450.0 28% 155.9 640.0 24%
4
(Unit: ¥billion)
Core areas Resources & Energy: Steady performance; Steady progress primarily with LNG projects Machinery & Infrastructure: Steady progress in line with plan; Investment in one new FPSO vessel for Mexico Chemicals: Progress largely in line with plan
(1) Build robust profit base and thoroughly strengthen existing businessesKey Initiatives
COPYRIGHT © MITSUI & CO., LTD. ALL RIGHTS RESERVED.
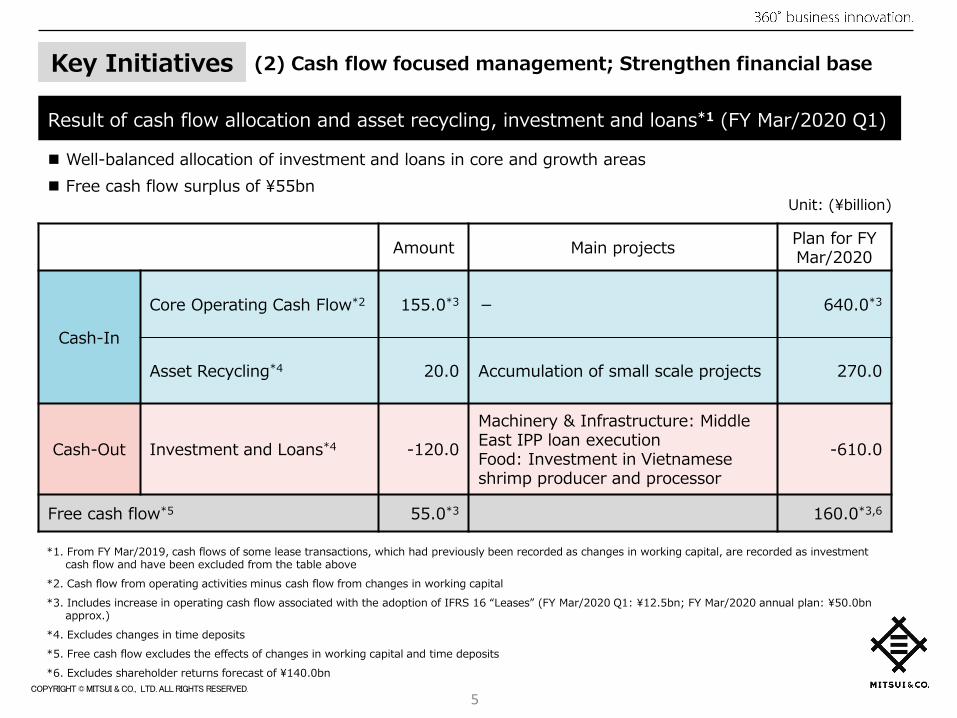
Result of cash flow allocation and asset recycling, investment and loans*1 (FY Mar/2020 Q1)
5
Amount Main projects Plan for FY Mar/2020
Cash-In
Core Operating Cash Flow*2 155.0*3 - 640.0*3
Asset Recycling*4 20.0 Accumulation of small scale projects 270.0
Cash-Out Investment and Loans*4 -120.0Machinery & Infrastructure: Middle East IPP loan executionFood: Investment in Vietnamese shrimp producer and processor
-610.0
Free cash flow*5 55.0*3 160.0*3,6
*1. From FY Mar/2019, cash flows of some lease transactions, which had previously been recorded as changes in working capital, are recorded as investment cash flow and have been excluded from the table above
*2. Cash flow from operating activities minus cash flow from changes in working capital *3. Includes increase in operating cash flow associated with the adoption of IFRS 16 “Leases” (FY Mar/2020 Q1: ¥12.5bn; FY Mar/2020 annual plan: ¥50.0bn
approx.)*4. Excludes changes in time deposits*5. Free cash flow excludes the effects of changes in working capital and time deposits *6. Excludes shareholder returns forecast of ¥140.0bn
Well-balanced allocation of investment and loans in core and growth areas Free cash flow surplus of ¥55bn
Unit: (¥billion)
(2) Cash flow focused management; Strengthen financial baseKey Initiatives
COPYRIGHT © MITSUI & CO., LTD. ALL RIGHTS RESERVED.
8.2
4.0
0.34.2
5.0
2.7
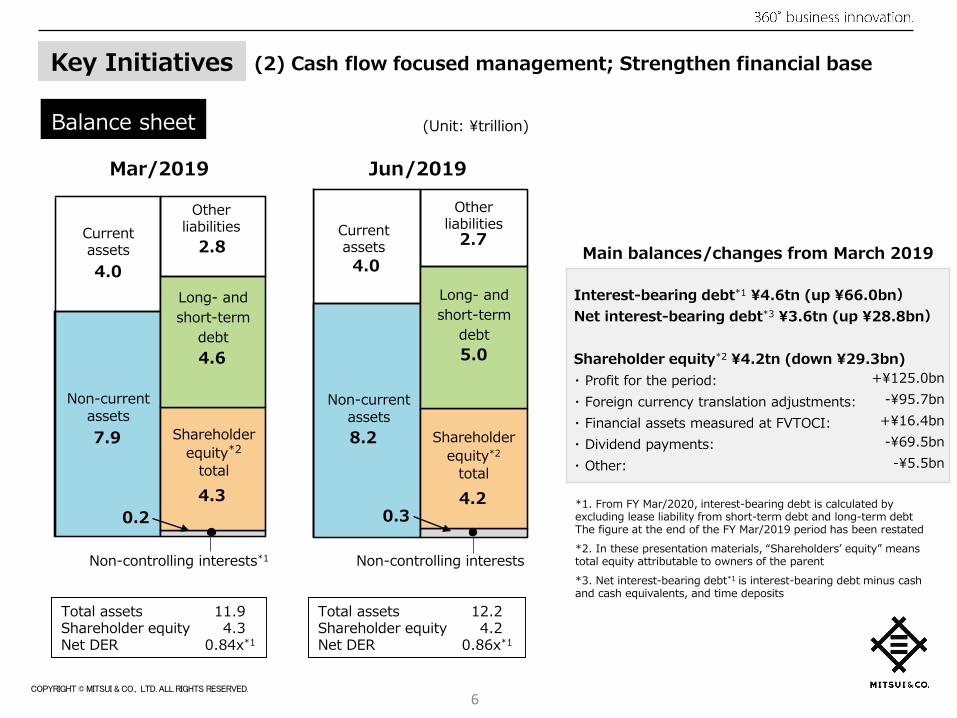
Balance sheet
6
Non-controlling interests
Current assets
Non-current assets
Other liabilities
Shareholder equity*2
total
Total assets 11.9Shareholder equity 4.3Net DER 0.84x*1
Jun/2019
7.9
4.0
0.24.3
4.6
2.8Current assets
Non-current assets
Shareholder equity*2
total
Long- and short-term
debt
Other liabilities
Non-controlling interests*1
(Unit: ¥trillion)
*1. From FY Mar/2020, interest-bearing debt is calculated by excluding lease liability from short-term debt and long-term debt The figure at the end of the FY Mar/2019 period has been restated*2. In these presentation materials, “Shareholders’ equity” means total equity attributable to owners of the parent*3. Net interest-bearing debt*1 is interest-bearing debt minus cash and cash equivalents, and time deposits
Interest-bearing debt*1 ¥4.6tn (up ¥66.0bn)Net interest-bearing debt*3 ¥3.6tn (up ¥28.8bn)
Shareholder equity*2 ¥4.2tn (down ¥29.3bn)・ Profit for the period: ・ Foreign currency translation adjustments:・ Financial assets measured at FVTOCI:・ Dividend payments:・ Other:
Main balances/changes from March 2019
+¥125.0bn-¥95.7bn
+¥16.4bn-¥69.5bn-¥5.5bn
Long- and short-term
debt
Mar/2019
Total assets 12.2Shareholder equity 4.2Net DER 0.86x*1
Key Initiatives (2) Cash flow focused management; Strengthen financial base
COPYRIGHT © MITSUI & CO., LTD. ALL RIGHTS RESERVED.
Operating Results2
7
COPYRIGHT © MITSUI & CO., LTD. ALL RIGHTS RESERVED.
8
1.3 3.010.5 2.1
17.7
7.6
6.8
1.5
9.9
4.1
15.4
16.8
17.1
40.9
39.7 49.0
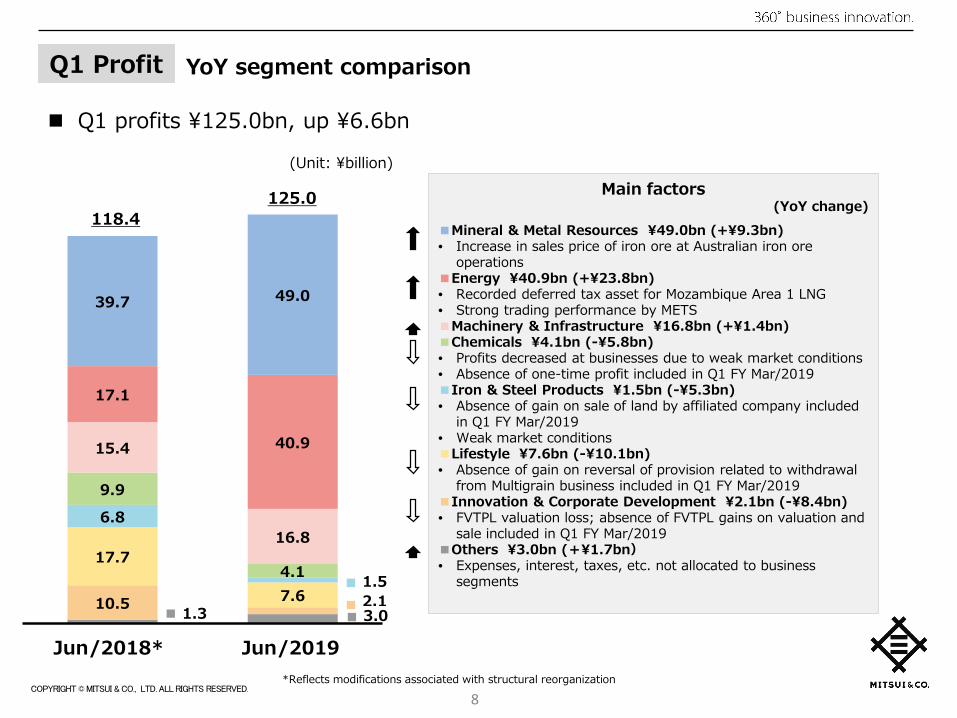
Main factors(YoY change)
■Mineral & Metal Resources ¥49.0bn (+¥9.3bn)• Increase in sales price of iron ore at Australian iron ore
operations■Energy ¥40.9bn (+¥23.8bn)• Recorded deferred tax asset for Mozambique Area 1 LNG• Strong trading performance by METS■Machinery & Infrastructure ¥16.8bn (+¥1.4bn)■Chemicals ¥4.1bn (-¥5.8bn) • Profits decreased at businesses due to weak market conditions• Absence of one-time profit included in Q1 FY Mar/2019 ■Iron & Steel Products ¥1.5bn (-¥5.3bn)• Absence of gain on sale of land by affiliated company included
in Q1 FY Mar/2019• Weak market conditions■Lifestyle ¥7.6bn (-¥10.1bn)• Absence of gain on reversal of provision related to withdrawal
from Multigrain business included in Q1 FY Mar/2019■Innovation & Corporate Development ¥2.1bn (-¥8.4bn)• FVTPL valuation loss; absence of FVTPL gains on valuation and
sale included in Q1 FY Mar/2019■Others ¥3.0bn (+¥1.7bn)• Expenses, interest, taxes, etc. not allocated to business
segments
(Unit: ¥billion)
Jun/2019
Q1 profits ¥125.0bn, up ¥6.6bn
125.0118.4
Jun/2018**Reflects modifications associated with structural reorganization
YoY segment comparisonQ1 Profit
COPYRIGHT © MITSUI & CO., LTD. ALL RIGHTS RESERVED.
-6.1 -1.1
13.2
-1.9
8.5
11.6
0.60.3
15.9
7.2
21.2
20.1
52.9
61.8
48.357.9
9
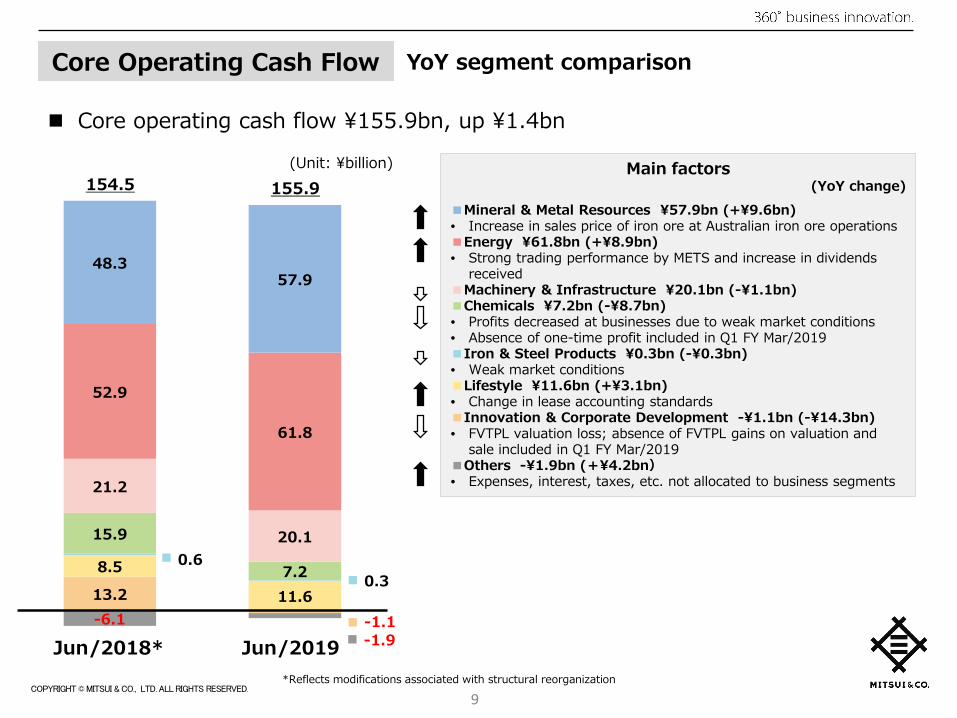
Main factors(YoY change)
■Mineral & Metal Resources ¥57.9bn (+¥9.6bn)• Increase in sales price of iron ore at Australian iron ore operations■Energy ¥61.8bn (+¥8.9bn)• Strong trading performance by METS and increase in dividends
received■Machinery & Infrastructure ¥20.1bn (-¥1.1bn)■Chemicals ¥7.2bn (-¥8.7bn) • Profits decreased at businesses due to weak market conditions• Absence of one-time profit included in Q1 FY Mar/2019 ■Iron & Steel Products ¥0.3bn (-¥0.3bn)• Weak market conditions■Lifestyle ¥11.6bn (+¥3.1bn)• Change in lease accounting standards■Innovation & Corporate Development -¥1.1bn (-¥14.3bn)• FVTPL valuation loss; absence of FVTPL gains on valuation and
sale included in Q1 FY Mar/2019■Others -¥1.9bn (+¥4.2bn)• Expenses, interest, taxes, etc. not allocated to business segments
155.9154.5
Core operating cash flow ¥155.9bn, up ¥1.4bn
Jun/2019Jun/2018*
YoY segment comparisonCore Operating Cash Flow
*Reflects modifications associated with structural reorganization
(Unit: ¥billion)
COPYRIGHT © MITSUI & CO., LTD. ALL RIGHTS RESERVED.
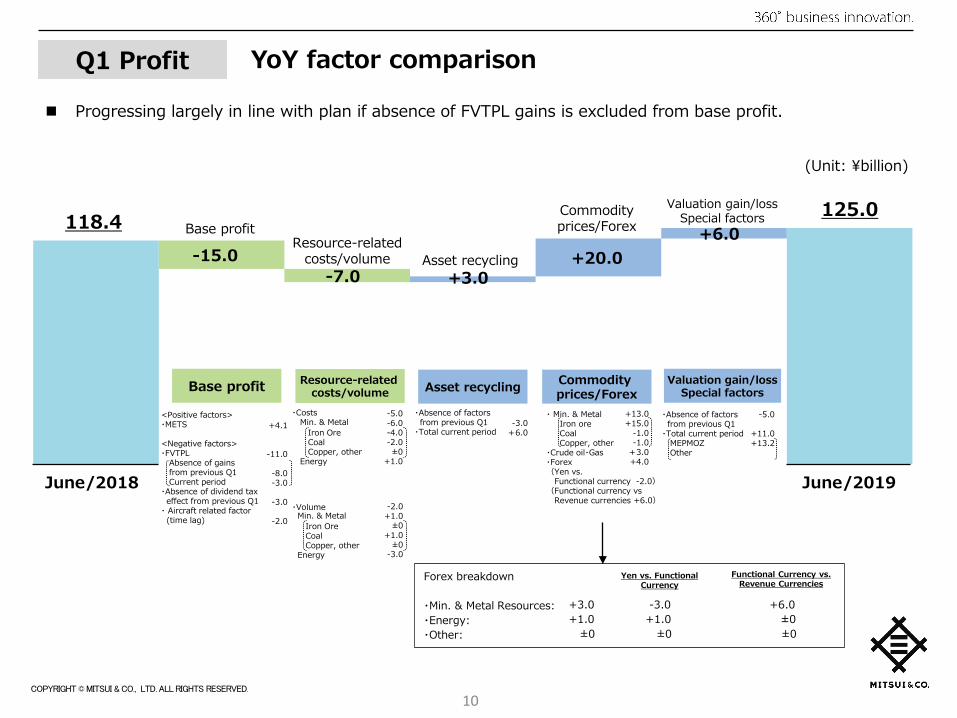
・ Min. & Metal Iron oreCoalCopper, other
・Crude oil・Gas・Forex(Yen vs.
Functional currency -2.0)(Functional currency vs
Revenue currencies +6.0)
+13.0+15.0
-1.0-1.0
+3.0+4.0
Forex breakdown
・Min. & Metal Resources:・Energy:・Other:
Yen vs. Functional Currency
Functional Currency vs. Revenue Currencies
10
Resource-related costs/volume
Commodity prices/ForexBase profit Valuation gain/loss
Special factorsAsset recycling
(Unit: ¥billion)
June/2018
118.4
Asset recycling
Commodity prices/Forex
Resource-related costs/volume
Base profit +6.0
+3.0+20.0-15.0
Valuation gain/lossSpecial factors
Q1 Profit
June/2019
125.0
+3.0+1.0
±0
-3.0 +6.0+1.0 ±0
±0 ±0
-7.0
Progressing largely in line with plan if absence of FVTPL gains is excluded from base profit.
・CostsMin. & Metal
Iron OreCoalCopper, other
Energy
-5.0-6.0-4.0-2.0±0
+1.0
・VolumeMin. & Metal
Iron OreCoalCopper, other
Energy
-2.0+1.0
±0+1.0
±0-3.0
・Absence of factorsfrom previous Q1
・Total current period-3.0
+6.0
・Absence of factorsfrom previous Q1
・Total current periodMEPMOZOther
-5.0
+11.0+13.2
<Positive factors>・METS
<Negative factors>・FVTPL
Absence of gainsfrom previous Q1Current period
・Absence of dividend tax effect from previous Q1
・ Aircraft related factor(time lag)
+4.1
-11.0
-8.0-3.0
-3.0
-2.0
YoY factor comparison
COPYRIGHT © MITSUI & CO., LTD. ALL RIGHTS RESERVED.
Supplementary Information3
11
COPYRIGHT © MITSUI & CO., LTD. ALL RIGHTS RESERVED.
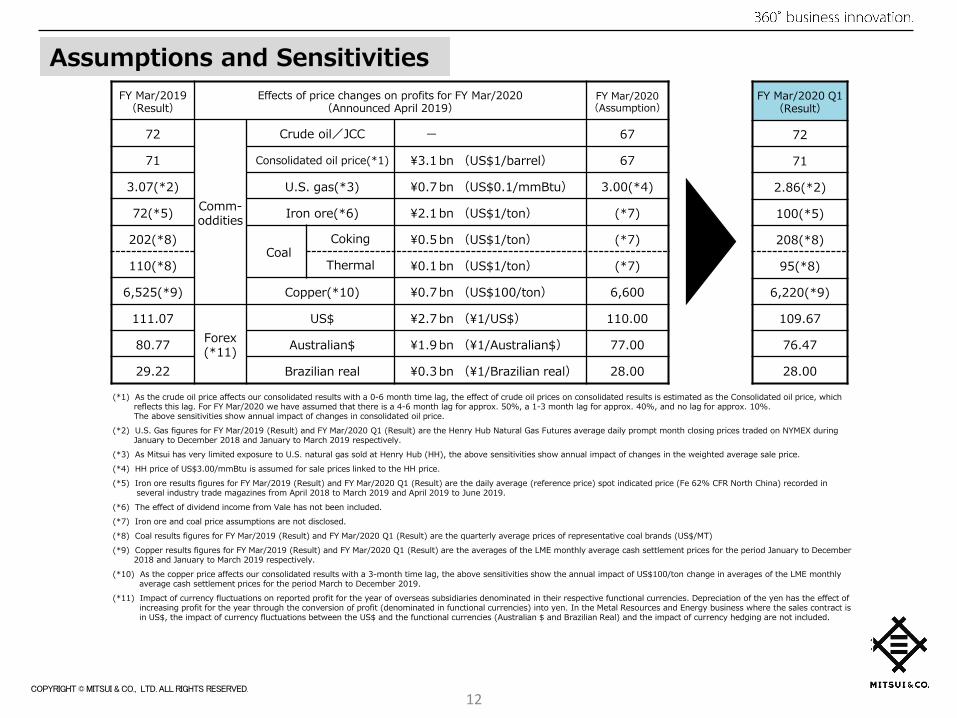
(*1) As the crude oil price affects our consolidated results with a 0-6 month time lag, the effect of crude oil prices on consolidated results is estimated as the Consolidated oil price, whichreflects this lag. For FY Mar/2020 we have assumed that there is a 4-6 month lag for approx. 50%, a 1-3 month lag for approx. 40%, and no lag for approx. 10%. The above sensitivities show annual impact of changes in consolidated oil price.
(*2) U.S. Gas figures for FY Mar/2019 (Result) and FY Mar/2020 Q1 (Result) are the Henry Hub Natural Gas Futures average daily prompt month closing prices traded on NYMEX duringJanuary to December 2018 and January to March 2019 respectively.
(*3) As Mitsui has very limited exposure to U.S. natural gas sold at Henry Hub (HH), the above sensitivities show annual impact of changes in the weighted average sale price.(*4) HH price of US$3.00/mmBtu is assumed for sale prices linked to the HH price.(*5) Iron ore results figures for FY Mar/2019 (Result) and FY Mar/2020 Q1 (Result) are the daily average (reference price) spot indicated price (Fe 62% CFR North China) recorded in
several industry trade magazines from April 2018 to March 2019 and April 2019 to June 2019.(*6) The effect of dividend income from Vale has not been included.(*7) Iron ore and coal price assumptions are not disclosed.(*8) Coal results figures for FY Mar/2019 (Result) and FY Mar/2020 Q1 (Result) are the quarterly average prices of representative coal brands (US$/MT)(*9) Copper results figures for FY Mar/2019 (Result) and FY Mar/2020 Q1 (Result) are the averages of the LME monthly average cash settlement prices for the period January to December
2018 and January to March 2019 respectively.(*10) As the copper price affects our consolidated results with a 3-month time lag, the above sensitivities show the annual impact of US$100/ton change in averages of the LME monthly
average cash settlement prices for the period March to December 2019.(*11) Impact of currency fluctuations on reported profit for the year of overseas subsidiaries denominated in their respective functional currencies. Depreciation of the yen has the effect of
increasing profit for the year through the conversion of profit (denominated in functional currencies) into yen. In the Metal Resources and Energy business where the sales contract is in US$, the impact of currency fluctuations between the US$ and the functional currencies (Australian $ and Brazilian Real) and the impact of currency hedging are not included.
FY Mar/2019(Result)
Effects of price changes on profits for FY Mar/2020(Announced April 2019)
FY Mar/2020(Assumption)
72
Comm-oddities
Crude oil/JCC ― 67
71 Consolidated oil price(*1) ¥3.1 bn (US$1/barrel) 67
3.07(*2) U.S. gas(*3) ¥0.7 bn (US$0.1/mmBtu) 3.00(*4)
72(*5) Iron ore(*6) ¥2.1 bn (US$1/ton) (*7)
202(*8)Coal
Coking ¥0.5 bn (US$1/ton) (*7)
110(*8) Thermal ¥0.1 bn (US$1/ton) (*7)
6,525(*9) Copper(*10) ¥0.7 bn (US$100/ton) 6,600
111.07Forex(*11)
US$ ¥2.7 bn (¥1/US$) 110.00
80.77 Australian$ ¥1.9 bn (¥1/Australian$) 77.00
29.22 Brazilian real ¥0.3 bn (¥1/Brazilian real) 28.00
12
FY Mar/2020 Q1(Result)
72
71
2.86(*2)
100(*5)
208(*8)
95(*8)
6,220(*9)
109.67
76.47
28.00
Assumptions and Sensitivities
COPYRIGHT © MITSUI & CO., LTD. ALL RIGHTS RESERVED.
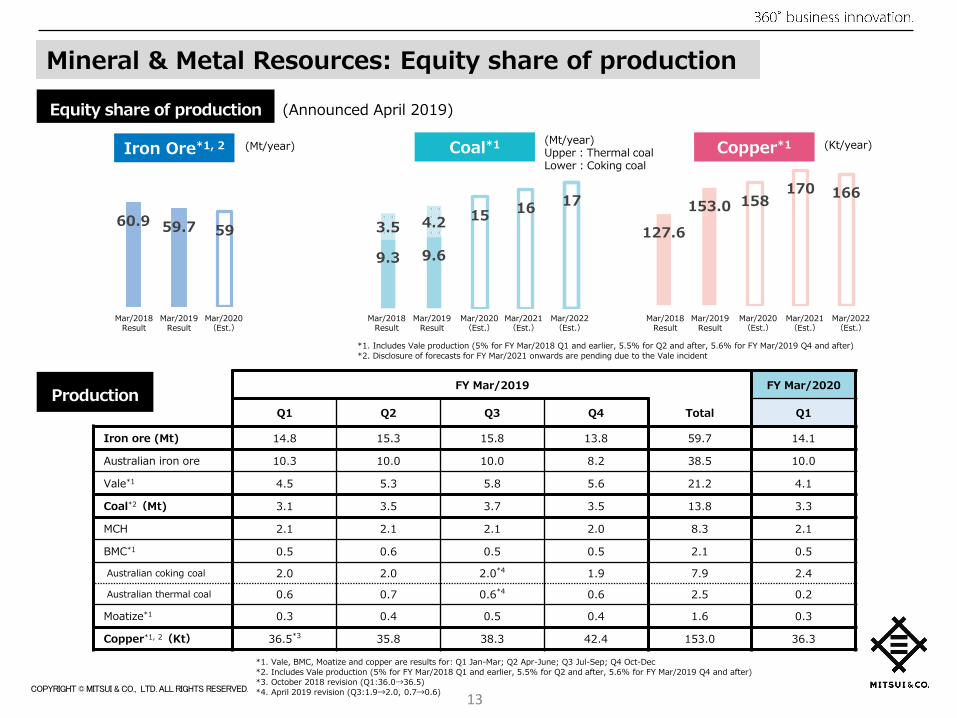
Iron Ore*1, 2 (Mt/year)
13
Equity share of production
Production
Coal*1 Copper*1 (Kt/year)
*1. Vale, BMC, Moatize and copper are results for: Q1 Jan-Mar; Q2 Apr-June; Q3 Jul-Sep; Q4 Oct-Dec*2. Includes Vale production (5% for FY Mar/2018 Q1 and earlier, 5.5% for Q2 and after, 5.6% for FY Mar/2019 Q4 and after)*3. October 2018 revision (Q1:36.0→36.5)*4. April 2019 revision (Q3:1.9→2.0, 0.7→0.6)
60.9 59.7 59
Mar/2018Result
Mar/2019Result
Mar/2020(Est.)
(Announced April 2019)
9.3 9.6
15 16 17
3.5 4.2
Mar/2018Result
Mar/2019Result
Mar/2020(Est.)
(Mt/year)Upper:Thermal coalLower:Coking coal
*1. Includes Vale production (5% for FY Mar/2018 Q1 and earlier, 5.5% for Q2 and after, 5.6% for FY Mar/2019 Q4 and after)*2. Disclosure of forecasts for FY Mar/2021 onwards are pending due to the Vale incident
127.6
153.0 158170 166
Mar/2018Result
Mar/2019Result
Mar/2020(Est.)
FY Mar/2019 FY Mar/2020
Q1 Q2 Q3 Q4 Total Q1
Iron ore (Mt) 14.8 15.3 15.8 13.8 59.7 14.1
Australian iron ore 10.3 10.0 10.0 8.2 38.5 10.0
Vale*1 4.5 5.3 5.8 5.6 21.2 4.1
Coal*2(Mt) 3.1 3.5 3.7 3.5 13.8 3.3
MCH 2.1 2.1 2.1 2.0 8.3 2.1
BMC*1 0.5 0.6 0.5 0.5 2.1 0.5
Australian coking coal 2.0 2.0 2.0*4 1.9 7.9 2.4
Australian thermal coal 0.6 0.7 0.6*4 0.6 2.5 0.2
Moatize*1 0.3 0.4 0.5 0.4 1.6 0.3
Copper*1, 2(Kt) 36.5*3 35.8 38.3 42.4 153.0 36.3
Mineral & Metal Resources: Equity share of production
Mar/2021(Est.)
Mar/2022(Est.)
Mar/2021(Est.)
Mar/2022(Est.)
COPYRIGHT © MITSUI & CO., LTD. ALL RIGHTS RESERVED.
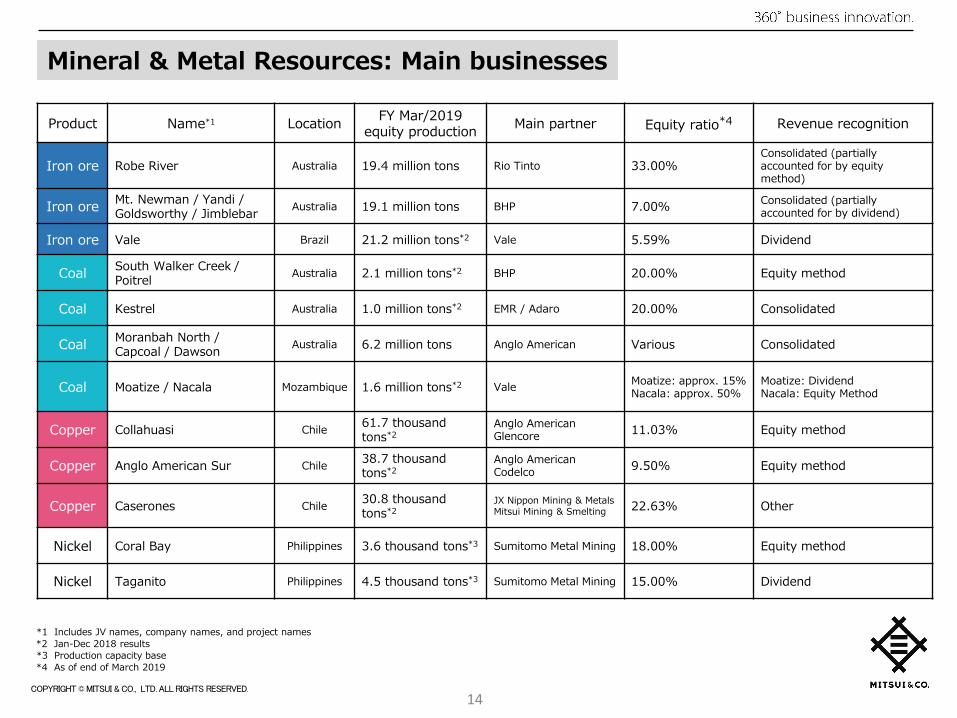
Mineral & Metal Resources: Main businesses
Product Name*1 Location FY Mar/2019equity production Main partner Equity ratio*4 Revenue recognition
Iron ore Robe River Australia 19.4 million tons Rio Tinto 33.00%Consolidated (partially accounted for by equity method)
Iron ore Mt. Newman / Yandi / Goldsworthy / Jimblebar Australia 19.1 million tons BHP 7.00% Consolidated (partially
accounted for by dividend)
Iron ore Vale Brazil 21.2 million tons*2 Vale 5.59% Dividend
Coal South Walker Creek / Poitrel Australia 2.1 million tons*2 BHP 20.00% Equity method
Coal Kestrel Australia 1.0 million tons*2 EMR / Adaro 20.00% Consolidated
Coal Moranbah North / Capcoal / Dawson Australia 6.2 million tons Anglo American Various Consolidated
Coal Moatize / Nacala Mozambique 1.6 million tons*2 Vale Moatize: approx. 15%Nacala: approx. 50%
Moatize: DividendNacala: Equity Method
Copper Collahuasi Chile 61.7 thousand tons*2
Anglo AmericanGlencore 11.03% Equity method
Copper Anglo American Sur Chile 38.7 thousand tons*2
Anglo AmericanCodelco 9.50% Equity method
Copper Caserones Chile 30.8 thousand tons*2
JX Nippon Mining & MetalsMitsui Mining & Smelting 22.63% Other
Nickel Coral Bay Philippines 3.6 thousand tons*3 Sumitomo Metal Mining 18.00% Equity method
Nickel Taganito Philippines 4.5 thousand tons*3 Sumitomo Metal Mining 15.00% Dividend
14
*1 Includes JV names, company names, and project names*2 Jan-Dec 2018 results*3 Production capacity base*4 As of end of March 2019
COPYRIGHT © MITSUI & CO., LTD. ALL RIGHTS RESERVED.
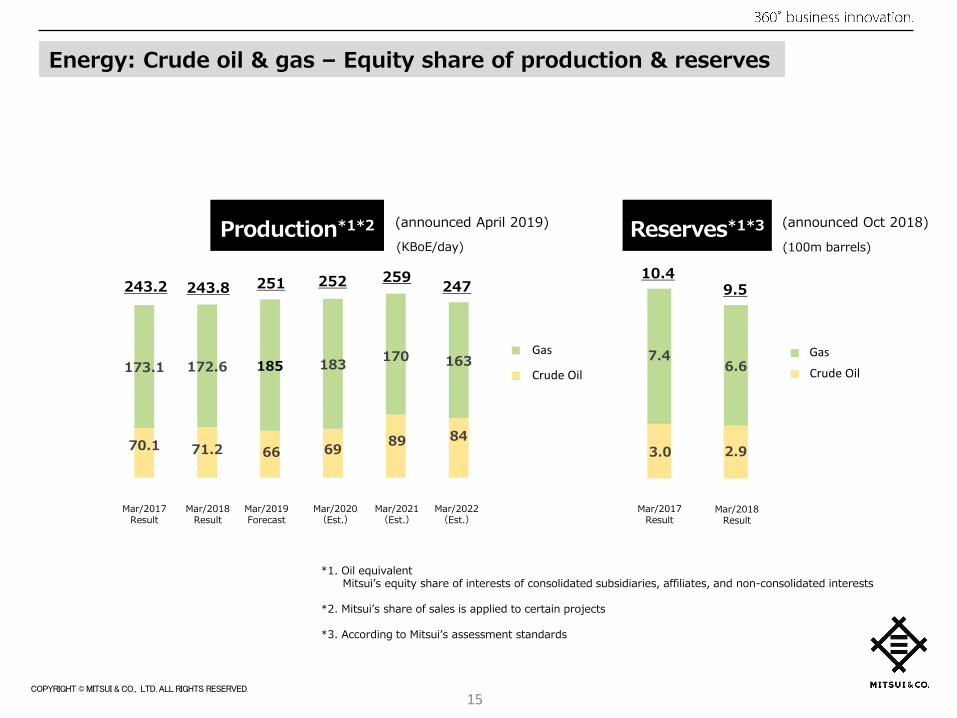
Production*1*2 Reserves*1*3(KBoE/day)
Mar/2017Result
(100m barrels)
15
70.1 71.2 66 69 89 84
173.1 172.6 185 183 170 163ガス原油
243.2 243.8 251 252 259
Mar/2017Result
Mar/2018Result
Mar/2019Forecast
Mar/2020(Est.)
*1. Oil equivalent Mitsui’s equity share of interests of consolidated subsidiaries, affiliates, and non-consolidated interests
*2. Mitsui’s share of sales is applied to certain projects
*3. According to Mitsui’s assessment standards
(announced April 2019)
Energy: Crude oil & gas – Equity share of production & reserves
3.0 2.9
7.46.6
ガス原油
Mar/2018Result
10.49.5
(announced Oct 2018)
Mar/2021(Est.)
Mar/2022(Est.)
247
Gas
Crude Oil Crude Oil
Gas
COPYRIGHT © MITSUI & CO., LTD. ALL RIGHTS RESERVED.
16
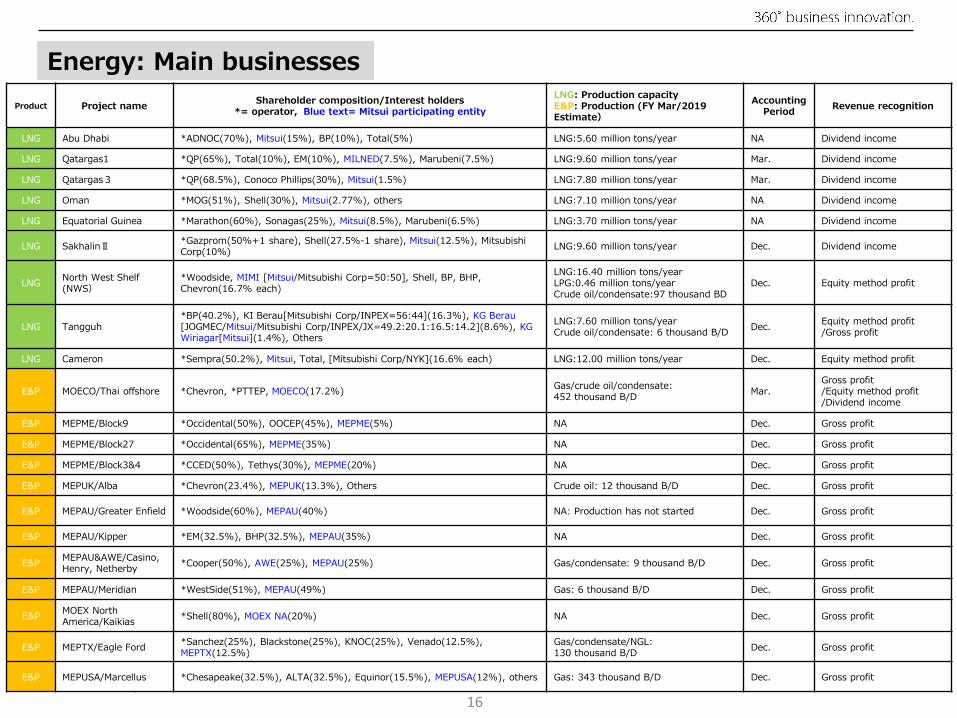
Energy: Main businessesProduct Project name Shareholder composition/Interest holders
*= operator, Blue text= Mitsui participating entityLNG: Production capacityE&P: Production (FY Mar/2019 Estimate)
Accounting Period Revenue recognition
LNG Abu Dhabi *ADNOC(70%), Mitsui(15%), BP(10%), Total(5%) LNG:5.60 million tons/year NA Dividend income
LNG Qatargas1 *QP(65%), Total(10%), EM(10%), MILNED(7.5%), Marubeni(7.5%) LNG:9.60 million tons/year Mar. Dividend income
LNG Qatargas3 *QP(68.5%), Conoco Phillips(30%), Mitsui(1.5%) LNG:7.80 million tons/year Mar. Dividend income
LNG Oman *MOG(51%), Shell(30%), Mitsui(2.77%), others LNG:7.10 million tons/year NA Dividend income
LNG Equatorial Guinea *Marathon(60%), Sonagas(25%), Mitsui(8.5%), Marubeni(6.5%) LNG:3.70 million tons/year NA Dividend income
LNG SakhalinⅡ *Gazprom(50%+1 share), Shell(27.5%-1 share), Mitsui(12.5%), Mitsubishi Corp(10%) LNG:9.60 million tons/year Dec. Dividend income
LNG North West Shelf(NWS)
*Woodside, MIMI [Mitsui/Mitsubishi Corp=50:50], Shell, BP, BHP, Chevron(16.7% each)
LNG:16.40 million tons/yearLPG:0.46 million tons/yearCrude oil/condensate:97 thousand BD
Dec. Equity method profit
LNG Tangguh*BP(40.2%), KI Berau[Mitsubishi Corp/INPEX=56:44](16.3%), KG Berau [JOGMEC/Mitsui/Mitsubishi Corp/INPEX/JX=49.2:20.1:16.5:14.2](8.6%), KG Wiriagar[Mitsui](1.4%), Others
LNG:7.60 million tons/yearCrude oil/condensate: 6 thousand B/D Dec. Equity method profit
/Gross profit
LNG Cameron *Sempra(50.2%), Mitsui, Total, [Mitsubishi Corp/NYK](16.6% each) LNG:12.00 million tons/year Dec. Equity method profit
E&P MOECO/Thai offshore *Chevron, *PTTEP, MOECO(17.2%) Gas/crude oil/condensate:452 thousand B/D Mar.
Gross profit/Equity method profit/Dividend income
E&P MEPME/Block9 *Occidental(50%), OOCEP(45%), MEPME(5%) NA Dec. Gross profit
E&P MEPME/Block27 *Occidental(65%), MEPME(35%) NA Dec. Gross profit
E&P MEPME/Block3&4 *CCED(50%), Tethys(30%), MEPME(20%) NA Dec. Gross profit
E&P MEPUK/Alba *Chevron(23.4%), MEPUK(13.3%), Others Crude oil: 12 thousand B/D Dec. Gross profit
E&P MEPAU/Greater Enfield *Woodside(60%), MEPAU(40%) NA: Production has not started Dec. Gross profit
E&P MEPAU/Kipper *EM(32.5%), BHP(32.5%), MEPAU(35%) NA Dec. Gross profit
E&P MEPAU&AWE/Casino, Henry, Netherby *Cooper(50%), AWE(25%), MEPAU(25%) Gas/condensate: 9 thousand B/D Dec. Gross profit
E&P MEPAU/Meridian *WestSide(51%), MEPAU(49%) Gas: 6 thousand B/D Dec. Gross profit
E&P MOEX North America/Kaikias *Shell(80%), MOEX NA(20%) NA Dec. Gross profit
E&P MEPTX/Eagle Ford *Sanchez(25%), Blackstone(25%), KNOC(25%), Venado(12.5%), MEPTX(12.5%)
Gas/condensate/NGL: 130 thousand B/D Dec. Gross profit
E&P MEPUSA/Marcellus *Chesapeake(32.5%), ALTA(32.5%), Equinor(15.5%), MEPUSA(12%), others Gas: 343 thousand B/D Dec. Gross profit
COPYRIGHT © MITSUI & CO., LTD. ALL RIGHTS RESERVED.
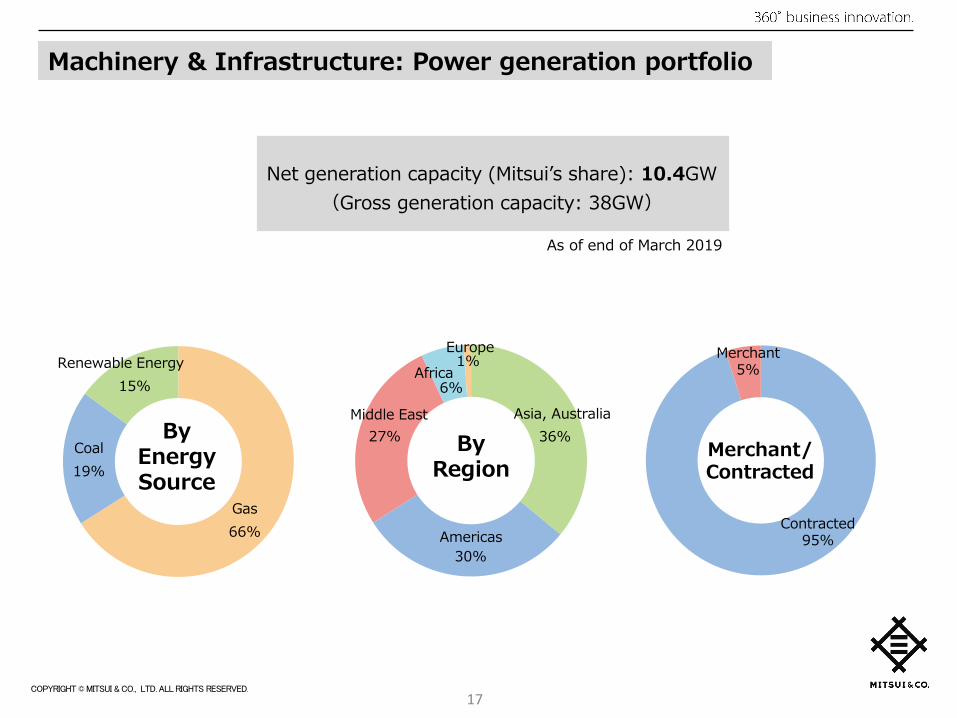
Gas66%
Coal19%
Renewable Energy15%
17
Net generation capacity (Mitsui’s share): 10.4GW(Gross generation capacity: 38GW)
36%
30%
27%
6%
1%
Americas
Asia, Australia
By Region
Middle East
EuropeAfrica
Merchant/Contracted
Contracted95%
Merchant5%
As of end of March 2019
By Energy Source
Machinery & Infrastructure: Power generation portfolio

COPYRIGHT © MITSUI & CO., LTD. ALL RIGHTS RESERVED.
Segment Data4
18
COPYRIGHT © MITSUI & CO., LTD. ALL RIGHTS RESERVED.
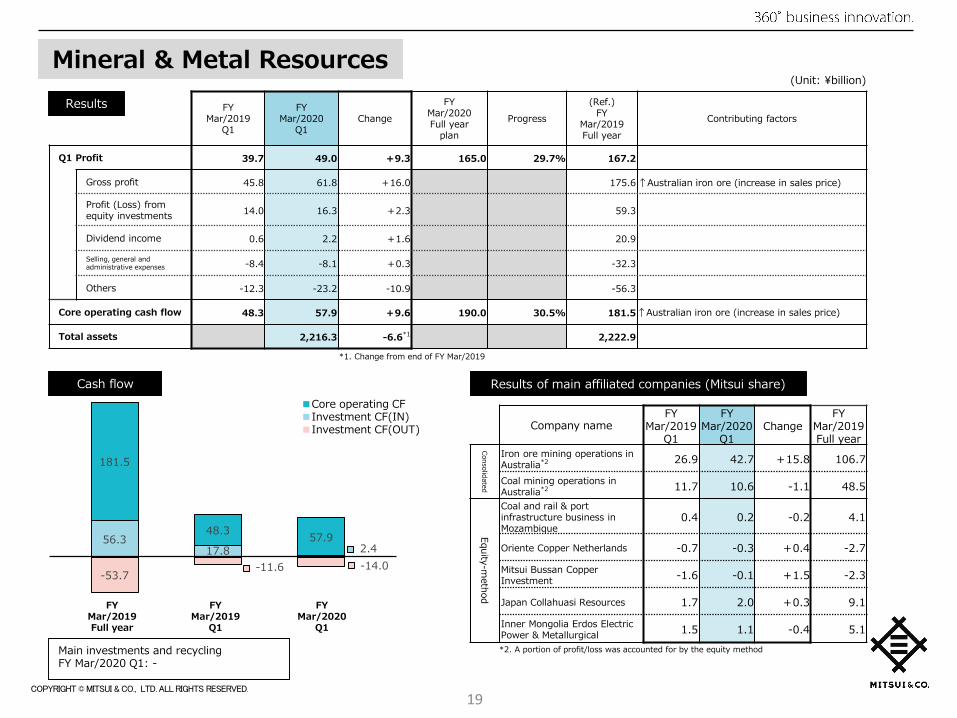
19
-53.7-11.6 -14.0
56.317.8 2.4
181.5
48.3 57.9
FY Mar/2019Full year
FY Mar/2019
Q1
Main investments and recyclingFY Mar/2020 Q1: -
FY Mar/2019
Q1
FY Mar/2020
Q1Change
FY Mar/2020 Full year
planProgress
(Ref.)FY
Mar/2019Full year
Contributing factors
Q1 Profit 39.7 49.0 +9.3 165.0 29.7% 167.2
Gross profit 45.8 61.8 +16.0 175.6 ↑Australian iron ore (increase in sales price)
Profit (Loss) from equity investments 14.0 16.3 +2.3 59.3
Dividend income 0.6 2.2 +1.6 20.9
Selling, general and administrative expenses -8.4 -8.1 +0.3 -32.3
Others -12.3 -23.2 -10.9 -56.3
Core operating cash flow 48.3 57.9 +9.6 190.0 30.5% 181.5↑Australian iron ore (increase in sales price)
Total assets 2,216.3 -6.6*1 2,222.9
Company nameFY
Mar/2019 Q1
FY Mar/2020
Q1Change
FY Mar/2019 Full year
Consolidated
Iron ore mining operations in Australia*2 26.9 42.7 +15.8 106.7
Coal mining operations in Australia*2 11.7 10.6 -1.1 48.5
Equity-method
Coal and rail & port infrastructure business in Mozambique
0.4 0.2 -0.2 4.1
Oriente Copper Netherlands -0.7 -0.3 +0.4 -2.7
Mitsui Bussan Copper Investment -1.6 -0.1 +1.5 -2.3
Japan Collahuasi Resources 1.7 2.0 +0.3 9.1
Inner Mongolia Erdos Electric Power & Metallurgical 1.5 1.1 -0.4 5.1
*1. Change from end of FY Mar/2019
Mineral & Metal Resources
Cash flow
Results
■Core operating CF■Investment CF(IN)■Investment CF(OUT)
Results of main affiliated companies (Mitsui share)
(Unit: ¥billion)
FY Mar/2020
Q1
*2. A portion of profit/loss was accounted for by the equity method
COPYRIGHT © MITSUI & CO., LTD. ALL RIGHTS RESERVED.
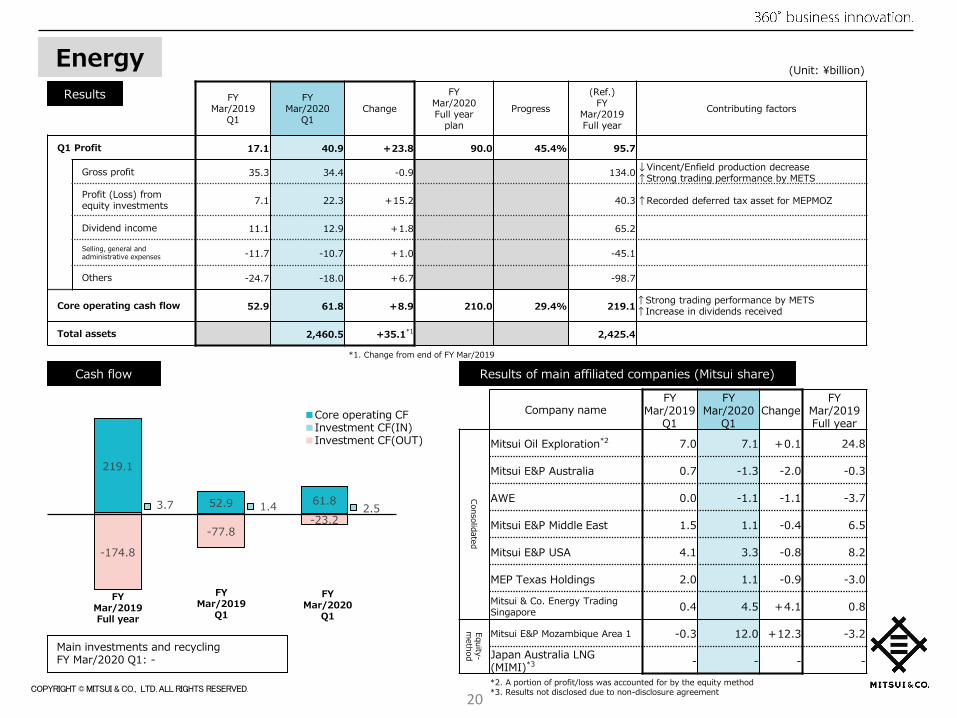
20
-174.8
-77.8-23.2
3.7 1.4 2.5
219.1
52.9 61.8
FY Mar/2019
Q1
FY Mar/2020
Q1Change
FY Mar/2020 Full year
planProgress
(Ref.)FY
Mar/2019Full year
Contributing factors
Q1 Profit 17.1 40.9 +23.8 90.0 45.4% 95.7
Gross profit 35.3 34.4 -0.9 134.0 ↓Vincent/Enfield production decrease↑Strong trading performance by METS
Profit (Loss) from equity investments 7.1 22.3 +15.2 40.3 ↑Recorded deferred tax asset for MEPMOZ
Dividend income 11.1 12.9 +1.8 65.2
Selling, general and administrative expenses -11.7 -10.7 +1.0 -45.1
Others -24.7 -18.0 +6.7 -98.7
Core operating cash flow 52.9 61.8 +8.9 210.0 29.4% 219.1↑Strong trading performance by METS↑Increase in dividends received
Total assets 2,460.5 +35.1*1 2,425.4
Company nameFY
Mar/2019 Q1
FY Mar/2020
Q1Change
FY Mar/2019 Full year
Consolidated
Mitsui Oil Exploration*2 7.0 7.1 +0.1 24.8
Mitsui E&P Australia 0.7 -1.3 -2.0 -0.3
AWE 0.0 -1.1 -1.1 -3.7
Mitsui E&P Middle East 1.5 1.1 -0.4 6.5
Mitsui E&P USA 4.1 3.3 -0.8 8.2
MEP Texas Holdings 2.0 1.1 -0.9 -3.0
Mitsui & Co. Energy Trading Singapore 0.4 4.5 +4.1 0.8
Equity-m
ethod
Mitsui E&P Mozambique Area 1 -0.3 12.0 +12.3 -3.2
Japan Australia LNG (MIMI)*3 - - - -
Main investments and recyclingFY Mar/2020 Q1: -
Energy (Unit: ¥billion)
Results
Cash flow Results of main affiliated companies (Mitsui share)
■Core operating CF■Investment CF(IN)■Investment CF(OUT)
*1. Change from end of FY Mar/2019
FY Mar/2019Full year
FY Mar/2019
Q1
FY Mar/2020
Q1
*2. A portion of profit/loss was accounted for by the equity method*3. Results not disclosed due to non-disclosure agreement

COPYRIGHT © MITSUI & CO., LTD. ALL RIGHTS RESERVED.
21
-238.1
-61.2 -36.6
81.133.6 3.8
74.0
21.2 20.1
Main investments and recyclingFY Mar/2020 Q1: (OUT) Middle East IPP loan execution -14.3
FY Mar/2019
Q1
FY Mar/2020
Q1Change
FY Mar/2020 Full year
planProgress
(Ref.)FY
Mar/2019Full year
Contributing factors
Q1 Profit 15.4 16.8 +1.4 90.0 18.7% 78.4
Gross profit 31.8 30.0 -1.8 130.7
Profit (Loss) from equity investments 18.7 25.7 +7.0 87.5
Dividend income 2.0 1.7 -0.3 5.8
Selling, general and administrative expenses -30.9 -31.9 -1.0 -123.4
Others -6.2 -8.7 -2.5 -22.2
Core operating cash flow 21.2 20.1 -1.1 105.0 19.1% 74.0
Total assets 2,538.6 +88.0*1 2,450.6
Company nameFY
Mar/2019 Q1
FY Mar/2020
Q1Change
FY Mar/2019 Full year
Consolidated
Mitsui & Co. Plant Systems 0.5 0.2 -0.3 2.6
Rolling stock leasing businesses*2 1.0 0.7 -0.3 3.3Construction & industrial machinery businesses*2 1.6 1.1 -0.5 7.1
Equity-method
IPP businesses 3.0 5.2 +2.2 25.1
FPSO/FSO leasing businesses 1.7 1.8 +0.1 9.3
Gas distribution companies 1.8 4.5 +2.7 6.5
Penske Automotive Group 1.9 1.8 -0.1 8.2
Truck leasing and rental businesses 0.2 1.5 +1.3 7.1
Asian motor vehicle businesses 1.6 1.6 0.0 7.2
VLI -0.1 -0.1 0.0 2.7
Machinery & Infrastructure(Unit: ¥billion)
Results
Cash flow Results of main affiliated companies (Mitsui share)
■Core operating CF■Investment CF(IN)■Investment CF(OUT)
*1. Change from end of FY Mar/2019
FY Mar/2019Full year
FY Mar/2019
Q1
FY Mar/2020
Q1
*2. A portion of profit/loss was accounted for by the equity method
COPYRIGHT © MITSUI & CO., LTD. ALL RIGHTS RESERVED.
22
FY Mar/2019
Q1*1
FY Mar/2020
Q1Change
FY Mar/2020 Full year
planProgress
(Ref.)FY
Mar/2019Full year*1
Contributing factors
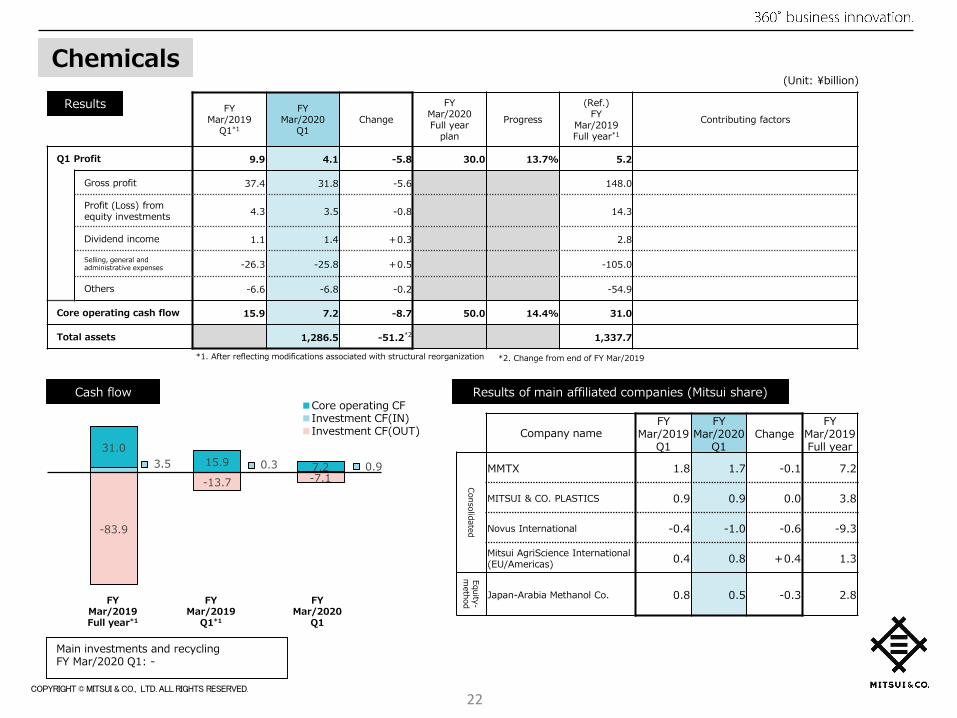
Q1 Profit 9.9 4.1 -5.8 30.0 13.7% 5.2
Gross profit 37.4 31.8 -5.6 148.0
Profit (Loss) from equity investments 4.3 3.5 -0.8 14.3
Dividend income 1.1 1.4 +0.3 2.8
Selling, general and administrative expenses -26.3 -25.8 +0.5 -105.0
Others -6.6 -6.8 -0.2 -54.9
Core operating cash flow 15.9 7.2 -8.7 50.0 14.4% 31.0
Total assets 1,286.5 -51.2*2 1,337.7
-83.9
-13.7 -7.13.5 0.3 0.9
31.015.9 7.2
Company nameFY
Mar/2019 Q1
FY Mar/2020
Q1Change
FY Mar/2019 Full year
Consolidated
MMTX 1.8 1.7 -0.1 7.2
MITSUI & CO. PLASTICS 0.9 0.9 0.0 3.8
Novus International -0.4 -1.0 -0.6 -9.3
Mitsui AgriScience International (EU/Americas) 0.4 0.8 +0.4 1.3
Equity-m
ethod Japan-Arabia Methanol Co. 0.8 0.5 -0.3 2.8
Main investments and recyclingFY Mar/2020 Q1: -
Chemicals(Unit: ¥billion)
Results
Cash flow Results of main affiliated companies (Mitsui share)■Core operating CF■Investment CF(IN)■Investment CF(OUT)
*1. After reflecting modifications associated with structural reorganization *2. Change from end of FY Mar/2019
FY Mar/2019Full year*1
FY Mar/2019
Q1*1
FY Mar/2020
Q1
COPYRIGHT © MITSUI & CO., LTD. ALL RIGHTS RESERVED.
23
FY Mar/2019
Q1
FY Mar/2020
Q1Change
FY Mar/2020 Full year
planProgress
(Ref.)FY
Mar/2019Full year
Contributing factors
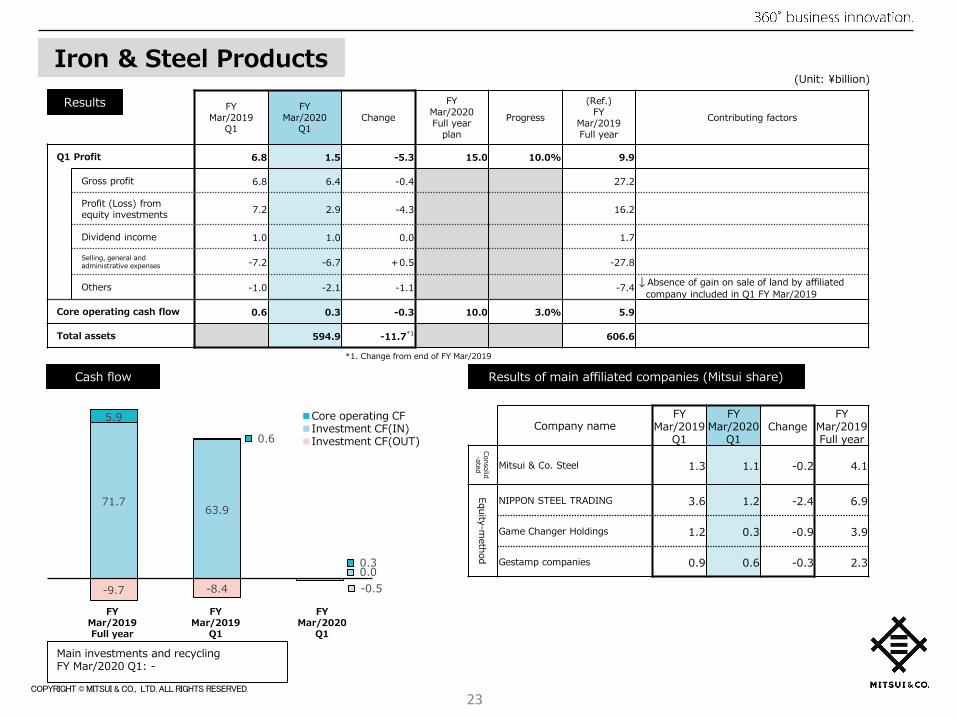
Q1 Profit 6.8 1.5 -5.3 15.0 10.0% 9.9
Gross profit 6.8 6.4 -0.4 27.2
Profit (Loss) from equity investments 7.2 2.9 -4.3 16.2
Dividend income 1.0 1.0 0.0 1.7
Selling, general and administrative expenses -7.2 -6.7 +0.5 -27.8
Others -1.0 -2.1 -1.1 -7.4 ↓Absence of gain on sale of land by affiliated company included in Q1 FY Mar/2019
Core operating cash flow 0.6 0.3 -0.3 10.0 3.0% 5.9
Total assets 594.9 -11.7*1 606.6
-9.7 -8.4 -0.5
71.763.9
0.0
5.9
0.6
0.3
Company nameFY
Mar/2019 Q1
FY Mar/2020
Q1Change
FY Mar/2019 Full year
Consolid-ated Mitsui & Co. Steel 1.3 1.1 -0.2 4.1
Equity-method
NIPPON STEEL TRADING 3.6 1.2 -2.4 6.9
Game Changer Holdings 1.2 0.3 -0.9 3.9
Gestamp companies 0.9 0.6 -0.3 2.3
Main investments and recyclingFY Mar/2020 Q1: -
Iron & Steel Products(Unit: ¥billion)
Results
Cash flow Results of main affiliated companies (Mitsui share)
■Core operating CF■Investment CF(IN)■Investment CF(OUT)
*1. Change from end of FY Mar/2019
FY Mar/2019Full year
FY Mar/2019
Q1
FY Mar/2020
Q1
COPYRIGHT © MITSUI & CO., LTD. ALL RIGHTS RESERVED.
24
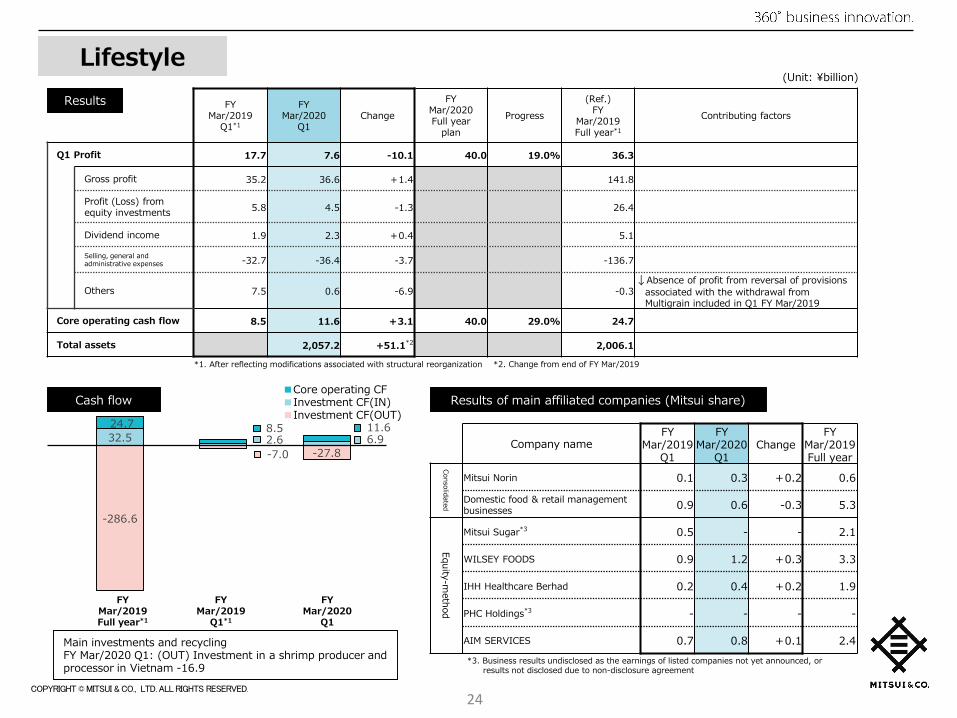
-286.6
-7.0 -27.832.5 2.6 6.924.7 8.5 11.6
Main investments and recyclingFY Mar/2020 Q1: (OUT) Investment in a shrimp producer and processor in Vietnam -16.9
FY Mar/2019
Q1*1
FY Mar/2020
Q1Change
FY Mar/2020 Full year
planProgress
(Ref.)FY
Mar/2019Full year*1
Contributing factors
Q1 Profit 17.7 7.6 -10.1 40.0 19.0% 36.3
Gross profit 35.2 36.6 +1.4 141.8
Profit (Loss) from equity investments 5.8 4.5 -1.3 26.4
Dividend income 1.9 2.3 +0.4 5.1
Selling, general and administrative expenses -32.7 -36.4 -3.7 -136.7
Others 7.5 0.6 -6.9 -0.3↓Absence of profit from reversal of provisions
associated with the withdrawal from Multigrain included in Q1 FY Mar/2019
Core operating cash flow 8.5 11.6 +3.1 40.0 29.0% 24.7
Total assets 2,057.2 +51.1*2 2,006.1
Company nameFY
Mar/2019 Q1
FY Mar/2020
Q1Change
FY Mar/2019 Full year
Consolidated
Mitsui Norin 0.1 0.3 +0.2 0.6
Domestic food & retail management businesses 0.9 0.6 -0.3 5.3
Equity-method
Mitsui Sugar*3 0.5 - - 2.1
WILSEY FOODS 0.9 1.2 +0.3 3.3
IHH Healthcare Berhad 0.2 0.4 +0.2 1.9
PHC Holdings*3 - - - -
AIM SERVICES 0.7 0.8 +0.1 2.4
(Unit: ¥billion)
Results
Cash flow Results of main affiliated companies (Mitsui share)■Core operating CF■Investment CF(IN)■Investment CF(OUT)
Lifestyle
FY Mar/2019Full year*1
FY Mar/2019
Q1*1
FY Mar/2020
Q1
*3. Business results undisclosed as the earnings of listed companies not yet announced, orresults not disclosed due to non-disclosure agreement
*2. Change from end of FY Mar/2019*1. After reflecting modifications associated with structural reorganization

COPYRIGHT © MITSUI & CO., LTD. ALL RIGHTS RESERVED.
25
-96.5
-30.4-1.1
28.25.0 1.6
19.8
13.2
-9.1
FY Mar/2019
Q1*1
FY Mar/2020
Q1Change
FY Mar/2020 Full year
planProgress
(Ref.)FY
Mar/2019Full year*1
Contributing factors
Q1 Profit 10.5 2.1 -8.4 20.0 10.5% 22.0
Gross profit 25.9 8.4 -17.5 78.6↓FVTPL Valuation loss; absence of FVTPL gains on valuation and sale included in Q1 FY Mar/2019
Profit (Loss) from equity investments 1.8 3.5 +1.7 13.1
Dividend income 2.6 2.5 -0.1 3.1
Selling, general and administrative expenses -15.9 -16.5 -0.6 -64.5
Others -3.9 4.2 +8.1 -8.3 ↑Valuation gain related to put option on shareholdings
Core operating cash flow 13.2 -1.1 -14.3 15.0 0.0% 19.8↓FVTPL valuation loss; absence of FVTPL gains on valuation and sale included in Q1 FY Mar/2019
Total assets 1,025.9 +54.1*2 971.8
Company nameFY
Mar/2019 Q1
FY Mar/2020
Q1Change
FY Mar/2019 Full year
ConsolidatedMITSUI KNOWLEDGEINDUSTRY 0.1 0.5 +0.4 3.5
Mitsui & Co. Global Logistics, Ltd. 0.7 1.4 +0.7 2.3
Mitsui Bussan Commodities 1.0 -0.5 -1.5 2.9
Mitsui & Co. Asset Management Holdings 0.4 0.3 -0.1 1.9
Mitsui & Co. Real Estate 0.7 0.0 -0.7 2.6
Equity-method
QVC Japan*3 - - - 5.3
JA Mitsui Leasing 0.8 0.8 0.0 3.8
SABRE INVESTMENTS*3 - - - -
*2. Change from end of FY Mar/2019
Main investments and recyclingFY Mar/2020 Q1: -
Innovation & Corporate Development (Unit: ¥billion)
Results
Cash flow Results of main affiliated companies (Mitsui share)■Core operating CF■Investment CF(IN)■Investment CF(OUT)
*1. After reflecting modifications associated with structural reorganization
FY Mar/2019Full year*1
FY Mar/2019
Q1*1
FY Mar/2020
Q1
*3. Results not disclosed due to non-disclosure agreement