communication sector performance for the quarter ending
TRANSCRIPT

Communication Sector Performance
for the Quarter ending December 2017
1
By the Economic Regulation Unit

Legal Disclaimer
The information and figures contained herein were obtained from licensees’ submissions
to the Commission and other sources available to the Commission. It is intended to
provide a communications market overview to the industry, prospective entrants,
Government, Academia and other stakeholders. We do not give any kind of warranty and
may not be liable for any loss or damage arising from its use or misuse.
2 By the Economic Regulation Unit
Introduction
This review presents the performance of the Post, Broadcasting and
Telecommunications industry market Report for the period ending
December 2017. It covers the following;
1. Highlights in Telecommunication Market space.
2. Trends in service growth and penetration.
3. Product and pricing movements in the industry.
4. Mobile Financial services.
5. Internet & Data services.
6. The Broadcasting services.
7. Postal services.
8. Consumer affairs.
3 By the Economic Regulation Unit

Highlights in Telecommunications
Telecommunications
The global telecommunications market
place in the year 2017 was associated
with news of early commercial trials in
5G technology across major markets
across Asia and Europe. With the US
expected to see its commercial launch
in late 2018.
The none standalone 5G new radio
(NSA 5G NR) specifications were
officially approved in December 2017
hence completing the standardization
of 5G.
The early adopters like Ericsson and
Nokia purport that the technology shall
among others deliver;
- Higher speeds
- Better in building penetration
- reduced intra cell multi user
interference
Artificial Intelligence
Leading telcos in the world have
embraced the benefits of artificial
Intelligence which is dominated by
big tech players in the US such as
Google, Amazon, Apple, Facebook, Microsoft & IBM as well
as Chinese Baidu, Alibaba &
Tencent. (source: GSMA)
4 By the Economic Regulation Unit

5
Uganda’s Telecommunication Sector at a Glance
Dec -16 Mar – 17 June- 17 Sept 17 Dec 17
PIP 24 23 23 23 23
PSP Voice and Data 36 33 33 33 33
Pay TV
Subscriptions 1,159,345 1,618,913 1,691,634 1,634,067 1,627,594
Fixed Lines
subscription
368,243
369,237
384,503
263,963
262,286
Mobile Subscriptions 22,838,486 23,665,556 23,608,610 24,361,551 24,948,878
Tele-density 63.4 63.8 63.7 65.4 66.9
Population est: 37,673,800 (UBOS)
By the Economic Regulation Unit
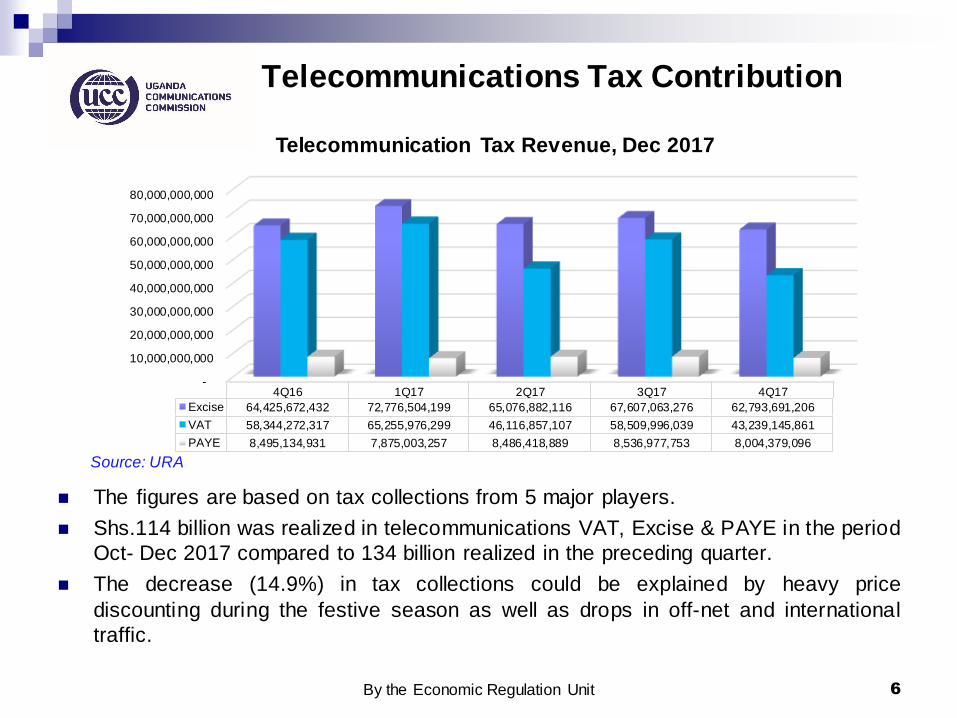
Telecommunications Tax Contribution
The figures are based on tax collections from 5 major players.
Shs.114 billion was realized in telecommunications VAT, Excise & PAYE in the period
Oct- Dec 2017 compared to 134 billion realized in the preceding quarter.
The decrease (14.9%) in tax collections could be explained by heavy price
discounting during the festive season as well as drops in off-net and international
traffic.
6
-
10,000,000,000
20,000,000,000
30,000,000,000
40,000,000,000
50,000,000,000
60,000,000,000
70,000,000,000
80,000,000,000
4Q16 1Q17 2Q17 3Q17 4Q17
Excise 64,425,672,432 72,776,504,199 65,076,882,116 67,607,063,276 62,793,691,206
VAT 58,344,272,317 65,255,976,299 46,116,857,107 58,509,996,039 43,239,145,861
PAYE 8,495,134,931 7,875,003,257 8,486,418,889 8,536,977,753 8,004,379,096
Telecommunication Tax Revenue, Dec 2017
Source: URA
By the Economic Regulation Unit

Fixed Subscriptions
Dec-16 Mar-17 Jun-17 Sep-17 Dec-17
368,243 369,237
384,503
263,963 262,286
-0.64% quarter to quarter
decline in fixed line
subscriptions.
7 By the Economic Regulation Unit

Fixed Line Penetration, Dec 2017
8
10.1 9.8 10.2
7.0 6.9
-
2.0
4.0
6.0
8.0
10.0
12.0
D E C -16 MAR -17 JU N -17 S E P -17 D E C -17
Fixed lines per 1000 Ugandans
Graph above represents the number of fixed lines for every 1000 people in the country.
By the Economic Regulation Unit

Mobile Subscriptions, Dec 2017
587,327 new mobile subscriptions in the
period October –
December 2017.
This largely on account
of seasonality variations
associated with the
festive season.
9
22,838,486
23,665,556 23,608,610
24,361,551
24,948,878
21,500,000
22,000,000
22,500,000
23,000,000
23,500,000
24,000,000
24,500,000
25,000,000
25,500,000
Dec-16 Mar-17 Jun-17 Sep-17 Dec-17
Mobile Subscriptions
2.4%
By the Economic Regulation Unit
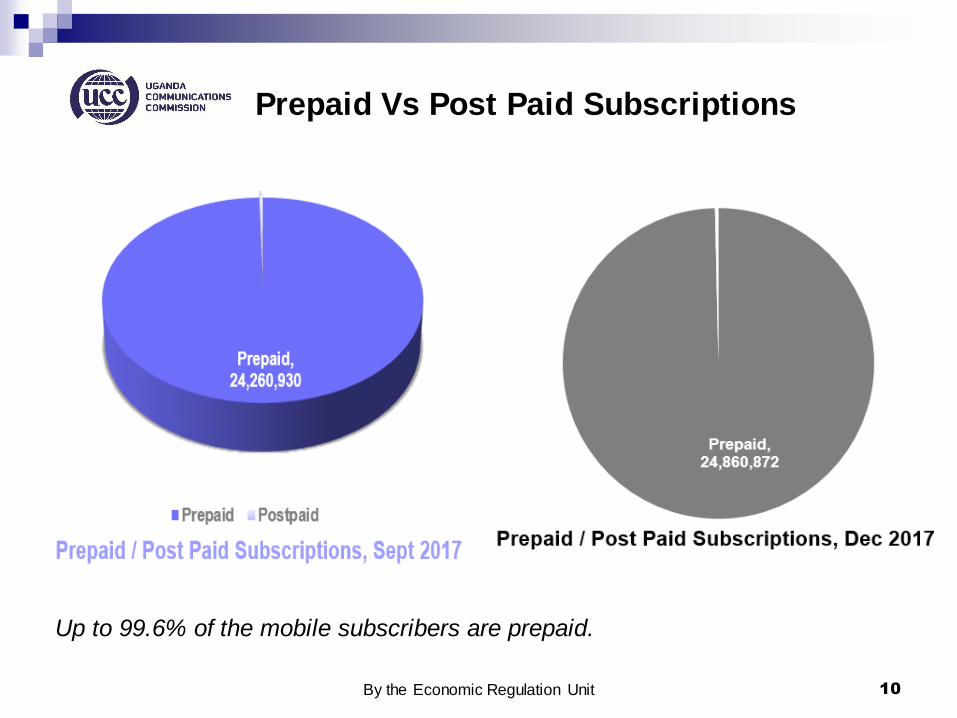
Prepaid Vs Post Paid Subscriptions
10
Up to 99.6% of the mobile subscribers are prepaid.
By the Economic Regulation Unit

Mobile Telephone Access, Dec 2017
11
60.6
62.8 62.7
64.7
66.2
57.0
58.0
59.0
60.0
61.0
62.0
63.0
64.0
65.0
66.0
67.0
D E C -16 MAR -17 JU N -17 S E P -17 D E C -17
Mobile lines per 100 Ugandans
A 1.5% growth in mobile penetration was realized during the quarter.
By the Economic Regulation Unit

Mobile Market Competitiveness, Dec 2017
12
4109.5
4068.0 4064.6
4003.9
3936.3
Dec-16 Mar-17 Jun-17 Sep-17 Dec-17
Mobile Market HHI - Dec 17 (Based on Subscriptions)
HHI
• The downward trend implies increasing mobile market competition.
• This is largely on account of aggressive price and customer acquisition
offerings within the segment
By the Economic Regulation Unit

Aggregate Fixed & Mobile Subscription, Dec 2017
13
The 585,650 growth in mobile subscriptions in the fourth quarter resulted
into a 2.4% increase in tele density.
This growth is credited to the end of year aggressive on net promotions
within the quarter.
Dec-16 Mar-17 Jun-17 Sep-17 Dec-17
fixed & mobile subs 23,206,729 24,034,793 23,993,113 24,625,514 25,211,164
Teledensity 63.4 63.8 63.7 65.4 66.9
63.4 63.8 63.7
65.4
66.9
61.0
62.0
63.0
64.0
65.0
66.0
67.0
68.0
22,000,000
22,500,000
23,000,000
23,500,000
24,000,000
24,500,000
25,000,000
25,500,000
By the Economic Regulation Unit
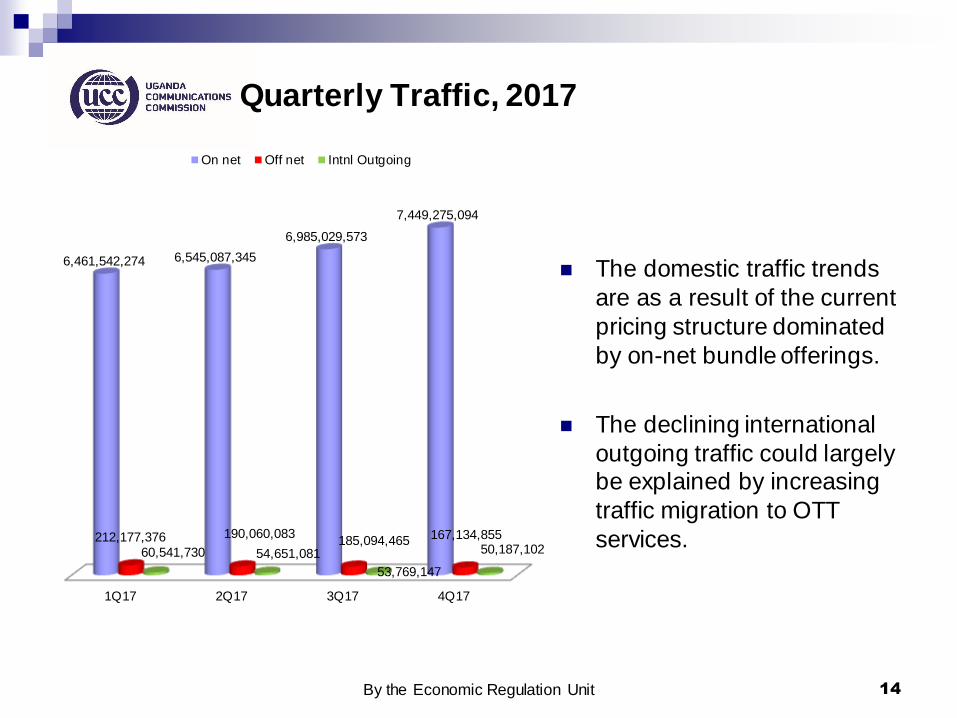
Quarterly Traffic, 2017
1Q17 2Q17 3Q17 4Q17
6,461,542,274 6,545,087,345
6,985,029,573
7,449,275,094
212,177,376 190,060,083 185,094,465 167,134,855
60,541,730 54,651,081
53,769,147
50,187,102
On net Off net Intnl Outgoing
The domestic traffic trends
are as a result of the current
pricing structure dominated
by on-net bundle offerings.
The declining international
outgoing traffic could largely be explained by increasing
traffic migration to OTT
services.
14 By the Economic Regulation Unit
15
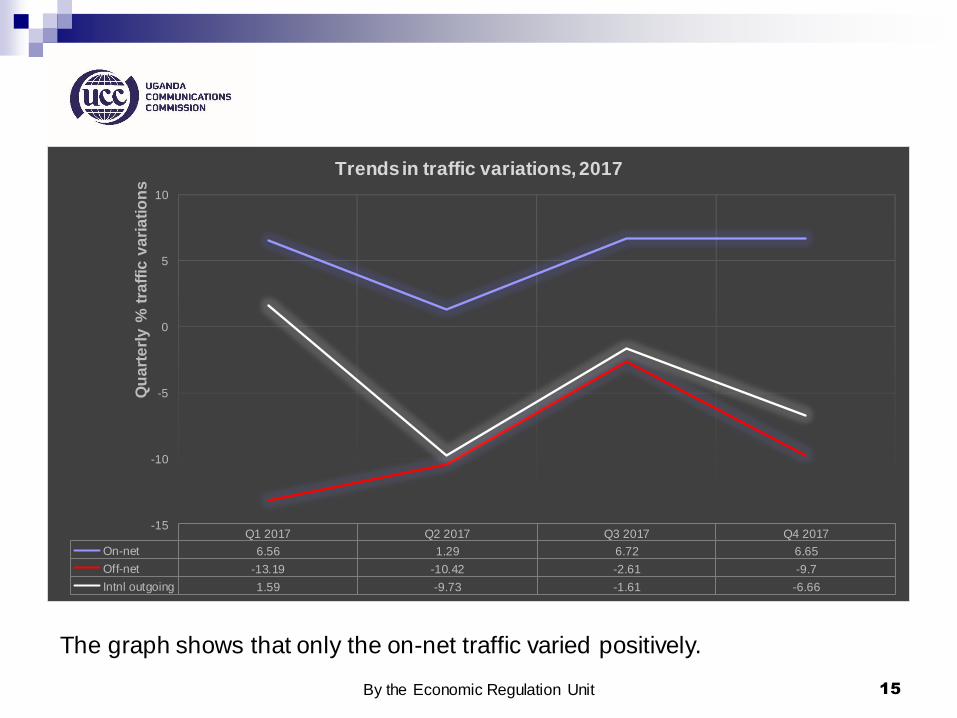
Q1 2017 Q2 2017 Q3 2017 Q4 2017
On-net 6.56 1.29 6.72 6.65
Off-net -13.19 -10.42 -2.61 -9.7
Intnl outgoing 1.59 -9.73 -1.61 -6.66
-15
-10
-5
0
5
10
Qu
art
erl
y %
tra
ffic
va
ria
tio
ns
Trends in traffic variations, 2017
The graph shows that only the on-net traffic varied positively.
By the Economic Regulation Unit

Voice Traffic Distribution, 2017
Jan- June 2017 July- Dec 2017
16
On net 96%
3% off net Intnl
Outgoing 1%
Voice Traffic Distribution Jan-June 17
On net 97%
Off net 2%
Intnl Outgoing
1%
Voice Distribution July - Dec 17
By the Economic Regulation Unit

International Incoming Traffic, 2017
International incoming minutes
continued to grow from 117 million
minutes recorded in the preceding
quarter to 122 million minutes for
the quarter ending December 2017.
This therefore represents a 4.6%
growth from the previous quarter.
17
1Q17 2Q17 3Q17 4Q17
98,475,931
113,135,755
117,391,241
122,751,990
Intnl incoming on Mobile
Intnl incoming on Mobile
By the Economic Regulation Unit

Roaming Minutes
The fourth quarter registered a
total of 20.8 million roaming
minutes in foreign networks
compared to 17.3 million minutes
realized in the previous quarter. Roaming by foreign networks
dropped from 13 million to 12.5
million minutes during the quarter.
This translates to a respective
20.6% growth and 4.2% drop in
roaming minutes.
18
1Q17 2Q17 3Q17 4Q17
16,924,997
18,689,670
17,276,576
20,844,138
7,396,734
9,029,534
13,040,778 12,488,448
Roaming Traffic, Dec 17
Roaming Minutes in Foreign networks
Roaming Minutes by Foreign networks
By the Economic Regulation Unit

SMS Traffic Growth
There was a drop of 7.1% in total
SMS traffic in the fourth quarter of
2017.
This drop is accredited to the
growing popularity and added
functionality of Over The Top (OTT) messaging services.
The On net SMS again dominated
the sms market accounting for 98
% of all SMSs sent, while off net accounted for only 1.5% of SMSs.
19
-
200,000,000
400,000,000
600,000,000
800,000,000
1,000,000,000
1,200,000,000
1,400,000,000
1,600,000,000
1Q17 2Q17 3Q17 4Q17
Onnet Sms 1,207,976, 1,012,684, 1,557,364, 1,444,287,
Off net Sms 23,240,984 20,311,965 20,972,939 21,469,994
Int'nal Out 3,909,315 3,601,890 3,695,974 3,691,904
Incoming Intn'l SMS 22,296,239 13,203,520 16,309,013 12,588,164
Quarterly SMS Traffic Growth, Dec 2017
By the Economic Regulation Unit

Tariffs
Post broadcasting & telecommunication plans are available on the two
UCC accredited price comparison websites;
By the Economic Regulation Unit 20

Mobile Money Services
21 By the Economic Regulation Unit

Mobile Money Services
For the first time since the
inauguration of Mobile money service in Uganda in 2009,
the Industry has realized a
1.5% drop in mobile money
subscriptions.
22
1Q17 2Q17 3Q17 4Q17
Number of Mobilemoney subscribers
22,532,144 22,893,648 23,726,352 23,362,532.0
growth in MM subs 4.4 1.6 3.6 (1.5)
4.4
1.6
3.6
(1.5)
(2.0)
(1.0)
-
1.0
2.0
3.0
4.0
5.0
21,800,000
22,000,000
22,200,000
22,400,000
22,600,000
22,800,000
23,000,000
23,200,000
23,400,000
23,600,000
23,800,000
24,000,000
Mobile Money Subscriptions and growth rates, Dec, 2017
By the Economic Regulation Unit
Mobile Money Transactions
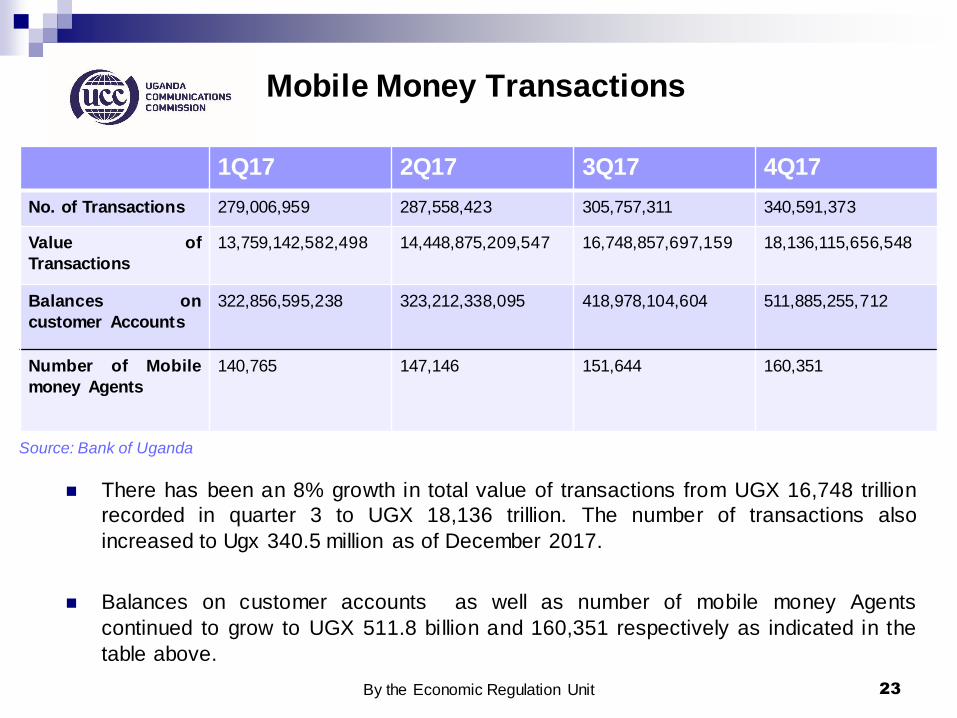
1Q17 2Q17 3Q17 4Q17
No. of Transactions 279,006,959 287,558,423 305,757,311 340,591,373
Value of
Transactions
13,759,142,582,498 14,448,875,209,547 16,748,857,697,159 18,136,115,656,548
Balances on
customer Accounts
322,856,595,238 323,212,338,095 418,978,104,604 511,885,255,712
Number of Mobile
money Agents
140,765 147,146 151,644 160,351
There has been an 8% growth in total value of transactions from UGX 16,748 trillion
recorded in quarter 3 to UGX 18,136 trillion. The number of transactions also
increased to Ugx 340.5 million as of December 2017.
Balances on customer accounts as well as number of mobile money Agents
continued to grow to UGX 511.8 billion and 160,351 respectively as indicated in the
table above.
23
Source: Bank of Uganda
By the Economic Regulation Unit

Communications Infrastructure.
The number of Base
Transceiver Stations (BTSs)
increased during the quarter
by 3% from 4,286 to 4,418.
The number of PIPs remained
the same as of the previous
quarter at 23.
By the Economic Regulation Unit 24

International Bandwidth
By the end of December 2017,
Total international bandwidth had
risen to 75,879.7 mbps from
68,360.1 mbps at the end of
September 2017. (see chart on the right)
85% of the available bandwidth is
provided by sea cables at the East
African Coast such as TEAMS,
ESSAY, Seacom
This has encouraged data usage
leading to declining internet
prices.
25
Mar-17 Jun-17 Sep-17 Dec-17
Total Bandwidth(mbps)
55,482.6 61,585.6 68,360.1 75,879.7
Bandwidth per1,000,000inhabitants
1,472.7 1,634.7 1,814.5 2,014.1
-
200.0
400.0
600.0
800.0
1,000.0
1,200.0
1,400.0
1,600.0
1,800.0
2,000.0
2,200.0
-
10,000.0
20,000.0
30,000.0
40,000.0
50,000.0
60,000.0
70,000.0
80,000.0
Bandwidth Growth, Dec 2017
By the Economic Regulation Unit

Internet Services
26 By the Economic Regulation Unit

Internet Subscriptions & Usage
27
16,484,312
17,102,456
18,148,923
18,825,254
Mar-17 Jun-17 Sep-17 Dec-17
Estimated internet users, Dec 2017
Estimated internet users
8,583,536 9,077,326
9,637,568 10,028,847
153,150 158,000 162,850 167,700
-
2,000,000
4,000,000
6,000,000
8,000,000
10,000,000
12,000,000
As of March2017
As of June2017
As of Sept2017
As of Dec2017
Estimated Internet subscription (Mobile)
Estimated Internet subscription (Fixed)
By the Economic Regulation Unit

Mobile Internet Access
The mobile broadband subscriptions grew to 10 million while fixed internet
subscriptions were 167,700 at the end of December 2017.
The growth in subscriptions resulted in an estimated 18.8 million internet
users translating into a penetration of 49 persons per 100.
Internet growth in subscriptions is largely due to price reduction in internet
bundles as well as increasing availability of data enabled handsets.
28 By the Economic Regulation Unit

Mobile Internet Access
29
30,000
34,500
15,000
35,000
32,000
28,000
- 5,000 10,000 15,000 20,000 25,000 30,000 35,000 40,000
1GB MTN bundle
Africell 1GB
Airtel 1.25GB bundle
1GB (Vodafone)
smile Lite bundle(1GB)
1GB UTL (GPRS/Edge)
Monthly Mobile Internet capacity based pricing, Dec 2017
By the Economic Regulation Unit
BROADCASTING
30 By the Economic Regulation Unit

PAY TV Landscape
31
Eight Pay Televisions players in the market, of which four broadcast using Satellite, 2
Digital Terrestrial, one uses cable and one uses SMS for broadcasting. The only Country
Wide broadcasting is through satellite mode.
By the Economic Regulation Unit
Station Name Mode of Broadcasting Television Coverage
DSTV Satellite Country wide
ZUKU TV Satellite Country wide
AZAM TV Satellite Country wide
STARTIMES Terrestrial Kampala, Masaka, Entebbe,
Jinja,Mbale, Mbarara, Luweero,
Mukono, Fortportal, Gulu, Ssese
Island
GO TV Terrestrial Kampala, Jinja, Iganga, Mbale,Lira,
Gulu,Arua, Kasese, Mbarara,
Masaka,Wakiso
Kampala SITI Cable Cable Kampala & Jinja
KSSU TV SMS Country wide

NUMBER OF CHANNELS RUN BY EACH PAY TV, 4Q17
32 By the Economic Regulation Unit

PAY TV Subscriptions, Dec 2017
Q1 Q2 Q3 Q4
1,559,913
1,614,404
1,544,615
1,627,594
By the Economic Regulation Unit 33

POST & COURIER SERVICES
34 By the Economic Regulation Unit

Postal & Courier Access
35
Indicator 1Q17 2Q17 3Q17 4Q17
Number of
Permanent
Post Offices
334 334 334 334
Number of
Permanent
Post Offices
connected to
the internet
33 33 49 33
Post Offices
offering public
internet
services
25 25 32 25
Private letter
boxes
82,900 82,900 82,900 82,900
Courier Access
points
846 851 858 867
By the Economic Regulation Unit

Postal distribution in Uganda
36 By the Economic Regulation Unit

Quarterly Postal Mail Volumes
37
1Q17 2Q17 3Q17 4Q17
52,144
39,210
44,460
67,246
1,126 2,605 2,589 6,826
34,076
59,602
32,584
47,045
Domestic Postal Mail Volumes, Dec 17
Domestic Ordinary letter post Domestic Registered Letter Post Domestic EMS
By the Economic Regulation Unit

Quarterly Domestic Courier Volumes
38
-
100,000
200,000
300,000
400,000
500,000
600,000
700,000
800,000
1Q17 2Q17 3Q17 4Q17
442,177
513,589 530,612
742,857
54,133 63,422 64,960
84,447
Domestic Courier Volumes,Dec 17
Courier items collected & posted within Kla Courier items collected & posted outside Kla
By the Economic Regulation Unit

Select International Postal Traffic, Dec 2017
39
1Q17 2Q17 3Q17 4Q17
6,835 5,312 6,096 6,781
740 1,191
701 1,489
44,519
31,252
41,416
65,464
23,025 22,238
60,178
111,014
Select International Postal Traffic, Dec 2017
East African Letter post East African Letter post European Letter post European Letter post
By the Economic Regulation Unit
Consumer Affairs
Consumers of communication
services when dissatisfied with a
service are required to first lodge
complaints with their respective
service providers. Where a consumer remains dissatisfied, they can then
lodge complaints with UCC, at which
point it becomes a second level
complaint. The data used in this
report represent second level complaints to UCC. However, the
figures may include some first level
complaints from consumers who
claim inability to access their service
providers.
By the Economic Regulation Unit 40

Consumer Empowerment, Dec,2017
41 By the Economic Regulation Unit

Consumer Empowerment, Cont’
Operators are expected to resolve 90% of all complaints received within a
24-hour period.
The data analyzed included tickets for inquiries, queries and complaints.
The ticket items include feedback provided to customers within a call
session of a customer calling the call center. The feedback includes
guidance, advise, information and actual complaint resolution given to a
complainant. It is noted that in several instances a resolution to a complaint may be reached after several customer calls.
42 By the Economic Regulation Unit
