konica minolta, inc. quarter/fy2020 ending in march 2021
TRANSCRIPT
Konica Minolta, Inc.Konica Minolta, Inc.
Konica Minolta, Inc.2nd Quarter/FY2020 ending in March 2021 Consolidated Financial Results
Three months: July 1, 2020 – September 30, 2020Six months: April 1, 2020 - September 30, 2020- Announced on October 29, 2020 -
Shoei YamanaPresident and CEOKonica Minolta, Inc.

Konica Minolta, Inc.Konica Minolta, Inc.
The points covered in today's session
◼ FY2020 First-Half Performance Overview: 1Q to 2Q and Monthly Changes
and Factors
◼ Targeted Profit Structure in and after FY2020 3Q
◼ FY2020 Full-Year Earnings Forecast with Priority Initiatives by Businesses
◼ Basic policies and Targeted Profit Levels towards FY2022
◼ Policy on Shareholder Returns and Dividend Forecast in FY2020
1

Konica Minolta, Inc.Konica Minolta, Inc.
FY2020 First-Half Performance Overview
2
Konica Minolta, Inc.Konica Minolta, Inc.
FY2020 FY2019 YoY FY2020 FY2019 YoY FY2020 FY2019
1H 1H (W/O Forex) 2Q 2Q (W/O Forex) 1Q 1Q
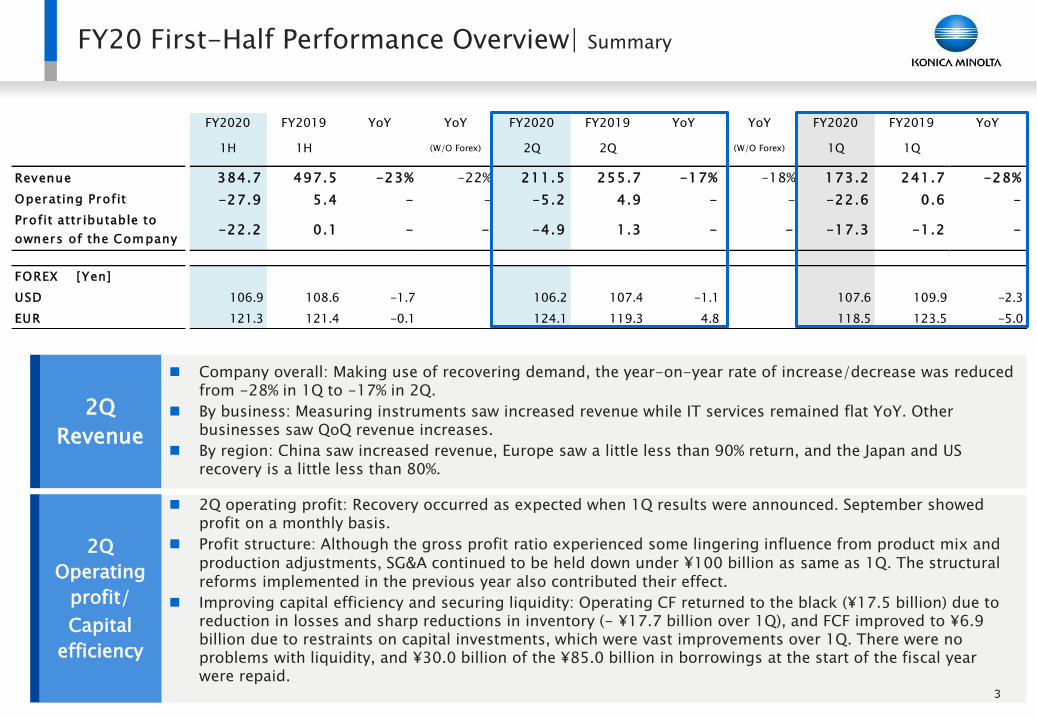
Revenue 384.7 497.5 -23% -22% 211.5 255.7 -17% -18% 173.2 241.7 -28%
Operating Profit -27.9 5.4 - - -5.2 4.9 - - -22.6 0.6 -
Profit attr ibutable to
owners of the Company-22.2 0.1 - - -4.9 1.3 - - -17.3 -1.2 -
FOREX [Yen]
USD 106.9 108.6 -1.7 106.2 107.4 -1.1 107.6 109.9 -2.3
EUR 121.3 121.4 -0.1 124.1 119.3 4.8 118.5 123.5 -5.0
YoY YoY YoY
2Q
Revenue
FY20 First-Half Performance Overview| Summary
◼ Company overall: Making use of recovering demand, the year-on-year rate of increase/decrease was reduced from -28% in 1Q to -17% in 2Q.
◼ By business: Measuring instruments saw increased revenue while IT services remained flat YoY. Other businesses saw QoQ revenue increases.
◼ By region: China saw increased revenue, Europe saw a little less than 90% return, and the Japan and US recovery is a little less than 80%.
◼ 2Q operating profit: Recovery occurred as expected when 1Q results were announced. September showed profit on a monthly basis.
◼ Profit structure: Although the gross profit ratio experienced some lingering influence from product mix and production adjustments, SG&A continued to be held down under ¥100 billion as same as 1Q. The structural reforms implemented in the previous year also contributed their effect.
◼ Improving capital efficiency and securing liquidity: Operating CF returned to the black (¥17.5 billion) due to reduction in losses and sharp reductions in inventory (- ¥17.7 billion over 1Q), and FCF improved to ¥6.9 billion due to restraints on capital investments, which were vast improvements over 1Q. There were no problems with liquidity, and ¥30.0 billion of the ¥85.0 billion in borrowings at the start of the fiscal year were repaid.
2Q
Operating
profit/
Capital
efficiency
3
Konica Minolta, Inc.Konica Minolta, Inc.
0.0
50.0
100.0
150.0
200.0
250.0
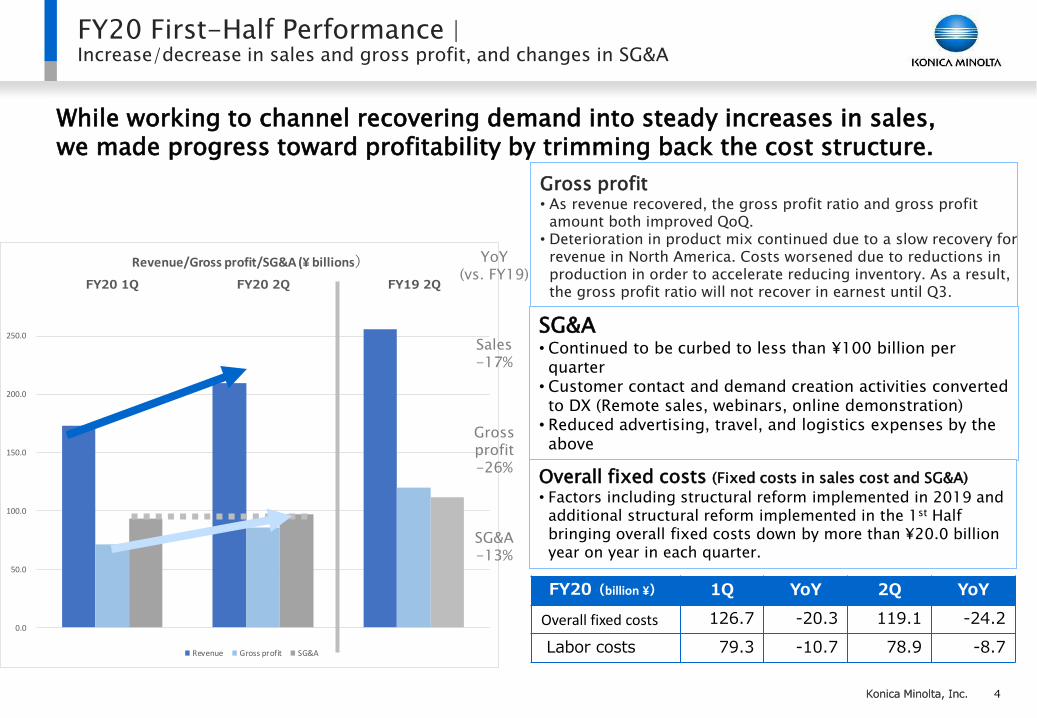
FY20 1Q FY20 2Q FY19 2Q
Revenue/Gross profit/SG&A (¥ billions)
Revenue Gross profit SG&A
YoY(vs. FY19)
Sales-17%
Gross profit-26%
SG&A-13%
FY20 First-Half Performance | Increase/decrease in sales and gross profit, and changes in SG&A
While working to channel recovering demand into steady increases in sales, we made progress toward profitability by trimming back the cost structure.
SG&A• Continued to be curbed to less than ¥100 billion per quarter
• Customer contact and demand creation activities converted to DX (Remote sales, webinars, online demonstration)
• Reduced advertising, travel, and logistics expenses by the above
Overall fixed costs (Fixed costs in sales cost and SG&A)
• Factors including structural reform implemented in 2019 and additional structural reform implemented in the 1st Half bringing overall fixed costs down by more than ¥20.0 billion year on year in each quarter.
Gross profit• As revenue recovered, the gross profit ratio and gross profit amount both improved QoQ.
• Deterioration in product mix continued due to a slow recovery for revenue in North America. Costs worsened due to reductions in production in order to accelerate reducing inventory. As a result, the gross profit ratio will not recover in earnest until Q3.
FY20(billion ¥) 1Q YoY 2Q YoY
Overall fixed costs 126.7 -20.3 119.1 -24.2
Labor costs 79.3 -10.7 78.9 -8.7
4

Konica Minolta, Inc.Konica Minolta, Inc.
Office
Professional
Whole
Company
Whole Company
(el iminating the effect of increased
VAT in the last year)
-50%
-40%
-30%
-20%
-10%
0%
10%
20%
Jan Feb Mar Apr May Jun Jul Aug Sep
Transition of Sales / Month, Y o Y
The recovery in revenue continued after bottoming out in May, and in general, every business has shown a smooth recovery.
*1 The decline in revenue in September for Professional Print was due to sales recognition brought forward to August and delayed until October.
*2 The decline in Healthcare revenue was due to a reactionary decline after last-minute demand before a consumption tax hike took effect in the previous year. The dotted lines indicate the rate of decline in revenue, excluding the monetary effect.
*1 *2
FY20 First-Half Performance | Monthly Sales Increase/Decrease
5

Konica Minolta, Inc.Konica Minolta, Inc.
FY2019 YoY FY2020 FY2019 YoY FY2020 QoQ
1H (W/O Forex) 2Q 2Q (W/O Forex) 1Q
Office 209.9 273.2 -23% -22% 115.9 138.6 - 16% -17% 94.0 +23%
Professional Print 73.5 103.3 -29% -28% 41.7 52.7 - 21% -21% 31.8 +31%
Healthcare 35.5 45.1 -21% -20% 19.1 26.4 - 28% -26% 16.4 +16%
Industrial Business 48.9 56.0 -13% -12% 25.6 27.9 - 8% -8% 23.3 +9%
Optical systems for industrial 15.3 14.6 +5% +7% 8.0 7.4 +8% +8% 7.3 +10%
Materials and Components 33.6 41.4 -19% -19% 17.6 20.5 - 14% -14% 16.1 +9%
New business 16.6 19.5 -15% -14% 9.1 9.9 - 8% -9% 7.5 +21%
Bio-healthcare 9.9 14.6 -32% -31% 5.9 7.4 - 21% -20% 4.1 +44%
Others 6.7 4.9 +37% +37% 3.2 2.5 +28% +26% 3.5 -6%
Corporate, etc. 0.3 0.4 -26% -26% 0.2 0.2 - 1% -1% 0.1 +71%
Company overall 384.7 497.5 -23% -22% 211.5 255.7 - 17% -18% 173.2 +22%
FY2019 YoY FY2020 FY2019 YoY FY2020 QoQ
1H (W/O Forex) 2Q 2Q (W/O Forex) 1Q
Office -5.2 -2.5% 17.1 - - 2.3 2.0% 9.4 - 76% -67% -7.5 -
Professional Print -8.8 -11.9% 2.1 - - -1.7 -4.1% 1.0 - - -7.1 -
Healthcare -0.5 -1.5% 0.4 - - 0.6 3.0% 0.7 - 16% +1% -1.1 -
Industry 6.5 13.2% 9.7 -34% -32% 3.2 12.6% 4.9 - 35% -33% 3.2 -1%
New business -12.4 - -11.0 - - -5.8 - -4.6 - - -6.5 -
Corporate, etc. -7.4 - -12.9 - - -3.8 - -6.6 - - -3.6 -
Company overall -27.9 -7.2% 5.4 - - -5.2 -2.5% 4.9 - - -22.6 -
RevenueFY2020 YoY YoY
1H
Operating profit/OPMFY2020 YoY YoY
1H
FY20 First-Half Performance | Revenue & Operating Profit by Segment
[¥ billions]Industrial Business continued to post profits, as in 1Q. Office and Healthcare Business return in the blackin 2Q. Professional Print lagged behind the Office, as expected, but improved significantly QoQ. Losses in New businesses declined.
6

Konica Minolta, Inc.Konica Minolta, Inc.
1Q to 2Q Change Points and Factors in Each Business
Main KPI progress, etc. (YoY)Analysis of change points
1Q 2Q
Office
NH sales69%A3 MFP units79%ITS sales86%
NH sales80%A3 MFP units86%ITS sales100%
• China sales are sustaining their momentum from June, when revenue turned to increase, Europe is at over 80% year on year, and the US is at over 75%, but recovering steadily.All improved greatly in September. There is no great difference in HW and NH recovery.
• ITS business recovered to previous-year levels and revenue increased in September thanks to contributions from solution projects from major clients in Europe and the US.
Professional Print
PP NH sales62%PP units57%IP NH sales95%
PP NH sales75%PP units71%IP NH sales118%
• PP demand is having a delayed effect comparing Office, as expected, but it has recovered nearly 80% in Europe and over 70% in the US. There is no great difference between HW and NW.
• Industrial printing is showing significantly increased NH revenue in both Europe and the US. HW takes time for the acceptance inspection needed to record a sale, and order backlogs are growing.
Healthcare/Bio-healthcare (BHC)
DR quantity134%Number of genetic tests76%Order backlogs in drug discovery support services127%
DR quantity77%Number of genetic tests104%Order backlogs in drug discovery support services
153%
• Sales activities expands according to the recovering trend in outpatient numbers at hospitals and clinics
• Genetic diagnostics: The number of genetic tests is recovering steadily. The number in September was approximately 93% relative to February before the impact of COVID-19. The number of COVID-19 test is also expanding.
• Drug discovery support services: With growing pipeline and delays in clinical trials, order backlog amounts are expanding significantly. The increase is 150% or more even relative to the end of March.
Industrial
Measuring instruments sales¥7.1 billionPerformance materials sales¥9.8 billion
Measuring instruments sales¥7.6 billionPerformance materials sales¥11.6 billion
• Acquisition of demand related to smartphone manufacturing is maintaining revenue growth.
• With stay-at-home demand, the outlook for year-end sales demands in large TVs is improving. Inventory adjustments in the supply chain are also resolving. September showed increased revenue.
*HW: Hardware; NH: Non-hard
7

Konica Minolta, Inc.Konica Minolta, Inc.
Targeted Profit Structure in and after FY2020 3QFY2020 Full-Year Earnings Forecast with Priority
Initiatives by Businesses
8
Konica Minolta, Inc.Konica Minolta, Inc.9
Perceptions and Assumptions of Environment after 3Q by Business
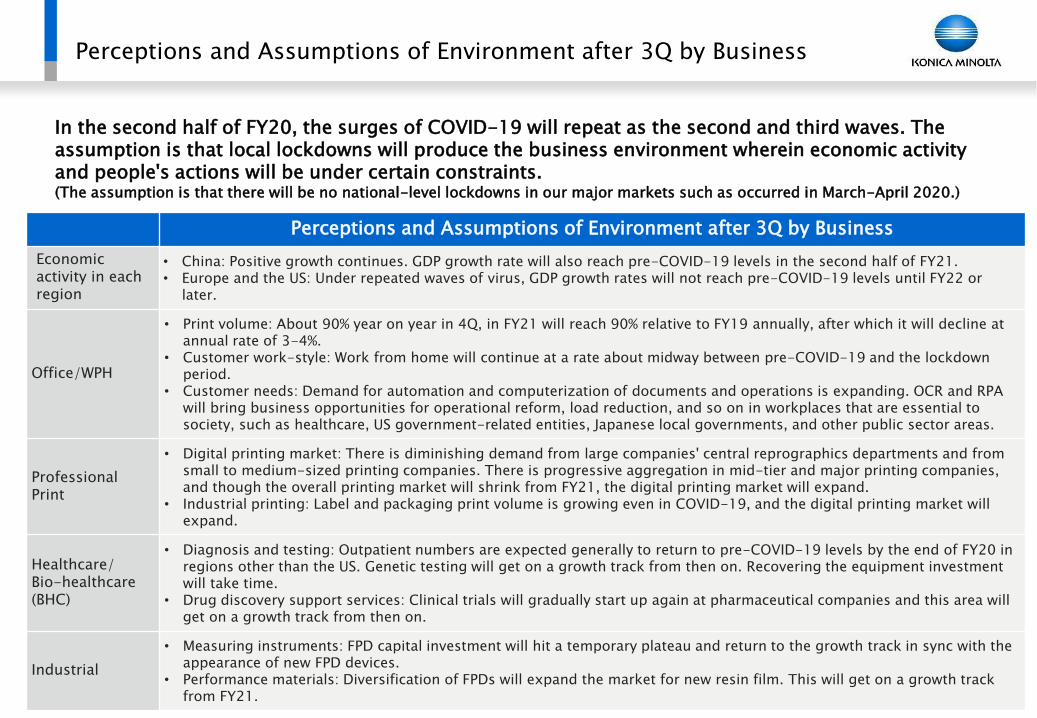
In the second half of FY20, the surges of COVID-19 will repeat as the second and third waves. The assumption is that local lockdowns will produce the business environment wherein economic activity and people's actions will be under certain constraints.(The assumption is that there will be no national-level lockdowns in our major markets such as occurred in March-April 2020.)
Perceptions and Assumptions of Environment after 3Q by Business
Economic activity in each region
• China: Positive growth continues. GDP growth rate will also reach pre-COVID-19 levels in the second half of FY21.• Europe and the US: Under repeated waves of virus, GDP growth rates will not reach pre-COVID-19 levels until FY22 or
later.
Office/WPH
• Print volume: About 90% year on year in 4Q, in FY21 will reach 90% relative to FY19 annually, after which it will decline at annual rate of 3-4%.
• Customer work-style: Work from home will continue at a rate about midway between pre-COVID-19 and the lockdown period.
• Customer needs: Demand for automation and computerization of documents and operations is expanding. OCR and RPA will bring business opportunities for operational reform, load reduction, and so on in workplaces that are essential to society, such as healthcare, US government-related entities, Japanese local governments, and other public sector areas.
Professional Print
• Digital printing market: There is diminishing demand from large companies' central reprographics departments and from small to medium-sized printing companies. There is progressive aggregation in mid-tier and major printing companies, and though the overall printing market will shrink from FY21, the digital printing market will expand.
• Industrial printing: Label and packaging print volume is growing even in COVID-19, and the digital printing market will expand.
Healthcare/Bio-healthcare (BHC)
• Diagnosis and testing: Outpatient numbers are expected generally to return to pre-COVID-19 levels by the end of FY20 in regions other than the US. Genetic testing will get on a growth track from then on. Recovering the equipment investment will take time.
• Drug discovery support services: Clinical trials will gradually start up again at pharmaceutical companies and this area willget on a growth track from then on.
Industrial
• Measuring instruments: FPD capital investment will hit a temporary plateau and return to the growth track in sync with the appearance of new FPD devices.
• Performance materials: Diversification of FPDs will expand the market for new resin film. This will get on a growth track from FY21.
Konica Minolta, Inc.Konica Minolta, Inc.
0
100
200
300
400
500
FY20 1st half FY20 2nd half FY19 2nd half
Sales/Gross profit/SG&A (¥ billions)
Revenue Gross profit SG&A
Impact ofCOVID-19
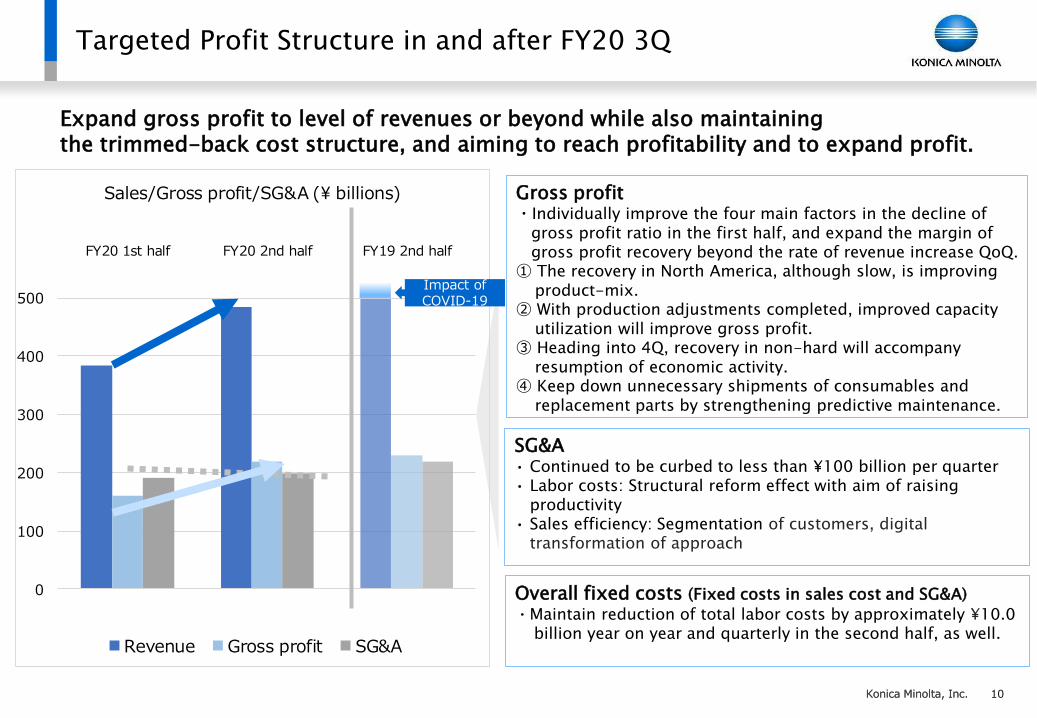
Targeted Profit Structure in and after FY20 3Q
SG&A• Continued to be curbed to less than ¥100 billion per quarter • Labor costs: Structural reform effect with aim of raising
productivity • Sales efficiency: Segmentation of customers, digital
transformation of approach
Expand gross profit to level of revenues or beyond while also maintaining the trimmed-back cost structure, and aiming to reach profitability and to expand profit.
Overall fixed costs (Fixed costs in sales cost and SG&A)
・Maintain reduction of total labor costs by approximately ¥10.0 billion year on year and quarterly in the second half, as well.
Gross profit・Individually improve the four main factors in the decline of
gross profit ratio in the first half, and expand the margin of gross profit recovery beyond the rate of revenue increase QoQ.
① The recovery in North America, although slow, is improving product-mix.
② With production adjustments completed, improved capacity utilization will improve gross profit.
③ Heading into 4Q, recovery in non-hard will accompany resumption of economic activity.
④ Keep down unnecessary shipments of consumables and replacement parts by strengthening predictive maintenance.
10

Konica Minolta, Inc.Konica Minolta, Inc.
FY20 Earnings Forecast | Overview
Full-year
earnings
forecast
[¥ billions]
◼ Revenue: This forecast takes into account assumptions about the business environment and has been set at a level that does not depend too heavily on improvements in this environment.
◼ Operating profit: In H2, we expect to maintain H1 fixed costs while improving gross profit more than the recovery in revenue, with effective operating profit rising to ¥21.4 billion. We expect to post an additional ¥6.5 billion in one-off costs for drastic reforms to the revenue structure in the Office business, and thus forecast ¥14.9 billion in operating profit in H2.
◼ Capital efficiency: Inventory reductions will continue, and the number of fiscal-year-end inventory turnover in months will improve to levels recorded in FY18 and earlier. Capital investment will be curbed while carefully selecting investments, such as those in the new Mikawa factory. FCF will remain in the black, as in 2Q, due to improved capacity to generate revenue and controls on investments.
FY2019 12M
1H Results 2H Forcast 12M Forecast Results
Revenue 384.7 485.3 870.0 996.1 -13%
Operating Profit -27.9 14.9 -13.0 8.2 -
21.4 -6.5
Turnover (months) 3.8 2.9 3.6
CAPEX 21.4 26.1 47.5 50.8
FCF -7.1 5.6 -1.5 -19.9
FOREX [Yen]
USD 106.9 108.7EUR 121.3 120.8
YoY
Profit attr ibutable to
owners of the Company-3.1 --22.2 4.2 -18.0
FY2020
※Operating profit except for the cost for structural reform in Office business
11

Konica Minolta, Inc.Konica Minolta, Inc.
FY20 Earnings Forecast | Segments
[¥ billions]
1H Results 2H Forcast YoY
Office 209.9 250.1 460.0 546.5 - 16%
Professional Print 73.5 106.5 180.0 210.1 - 14%
Healthcare 35.5 44.5 80.0 87.9 - 9%
Industrial 48.9 56.1 105.0 109.6 - 4%
Optical systems for industrial use 15.3 17.2 32.5 30.8 + 6%
Materials and components 33.6 41.4 75.0 78.8 - 5%
New business 16.6 28.4 45.0 41.2 + 9%
Bio-Healthcare 9.9 17.6 27.5 30.6 - 10%
Others 6.7 8.3 15.0 10.6 + 41%
Corporate, etc. 0.3 -0.3 0.0 0.8 - 100%
Company overall 384.7 485.3 870.0 996.1 - 13%
1H Results 2H Forcast YoY
Office -5.2 12.2 7.0 1.5% 23.9 4.4% - 71%
Professional Print -8.8 6.3 -2.5 -1.4% 4.4 2.1% -
Healthcare -0.5 3.0 2.5 3.1% 0.6 0.7% + 288%
Industrial 6.5 8.5 15.0 14.3% 19.2 17.5% - 22%
New business -12.4 -7.6 -20.0 - -17.7 -
Corporate, etc. -7.4 -7.6 -15.0 - -22.2 -
Company overall -27.9 14.9 -13.0 -1.5% 8.2 0.8% -
RevenueFY2019 12M
12M Forecast Results
FY2020
12M Forecast ResultsOperating Profit
FY2019 12MFY2020
※
※incl. one-off expense of ¥6.5bn for structural reform in Office business
※ ※
※
12
Konica Minolta, Inc.Konica Minolta, Inc.
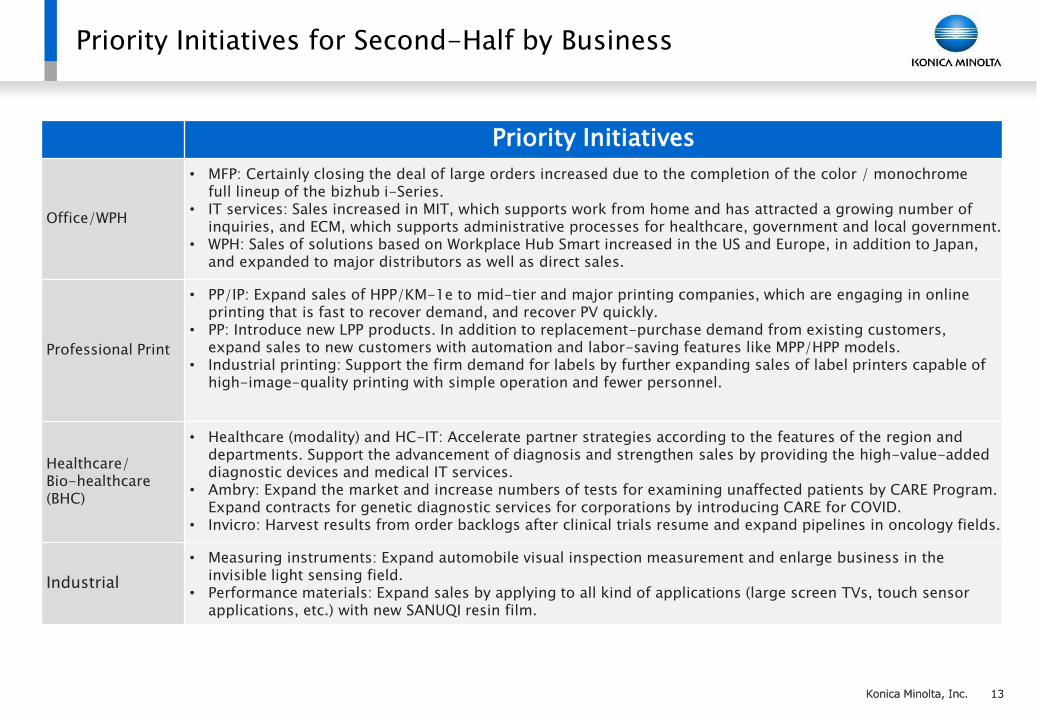
Priority Initiatives for Second-Half by Business
Priority Initiatives
Office/WPH
• MFP: Certainly closing the deal of large orders increased due to the completion of the color / monochrome full lineup of the bizhub i-Series.
• IT services: Sales increased in MIT, which supports work from home and has attracted a growing number of inquiries, and ECM, which supports administrative processes for healthcare, government and local government.
• WPH: Sales of solutions based on Workplace Hub Smart increased in the US and Europe, in addition to Japan, and expanded to major distributors as well as direct sales.
Professional Print
• PP/IP: Expand sales of HPP/KM-1e to mid-tier and major printing companies, which are engaging in online printing that is fast to recover demand, and recover PV quickly.
• PP: Introduce new LPP products. In addition to replacement-purchase demand from existing customers, expand sales to new customers with automation and labor-saving features like MPP/HPP models.
• Industrial printing: Support the firm demand for labels by further expanding sales of label printers capable of high-image-quality printing with simple operation and fewer personnel.
Healthcare/Bio-healthcare (BHC)
• Healthcare (modality) and HC-IT: Accelerate partner strategies according to the features of the region and departments. Support the advancement of diagnosis and strengthen sales by providing the high-value-added diagnostic devices and medical IT services.
• Ambry: Expand the market and increase numbers of tests for examining unaffected patients by CARE Program. Expand contracts for genetic diagnostic services for corporations by introducing CARE for COVID.
• Invicro: Harvest results from order backlogs after clinical trials resume and expand pipelines in oncology fields.
Industrial
• Measuring instruments: Expand automobile visual inspection measurement and enlarge business in the invisible light sensing field.
• Performance materials: Expand sales by applying to all kind of applications (large screen TVs, touch sensor applications, etc.) with new SANUQI resin film.
13
Konica Minolta, Inc.Konica Minolta, Inc.
Basic Policies and Targeted Profit Levels towards FY20Policy on Shareholder Returns and Dividend Forecast in FY20
14
Konica Minolta, Inc.Konica Minolta, Inc.
624
82
-279
149
FY18 FY19 FY20上期
実績
FY20下期
見通し
FY21 FY22
全社営業利益
-19.3 -17.7-20.0
FY18 FY19 FY20見通し FY21 FY22
② Accelerate improvements of profit in New Business
Corporate Operating Profit
409227
472
23970
FY18 FY19 FY20見通し FY21 FY22
①オフィス事業の営業利益を18年度レベルまで一気に回復
オフィス(FY20為替水準)
為替影響
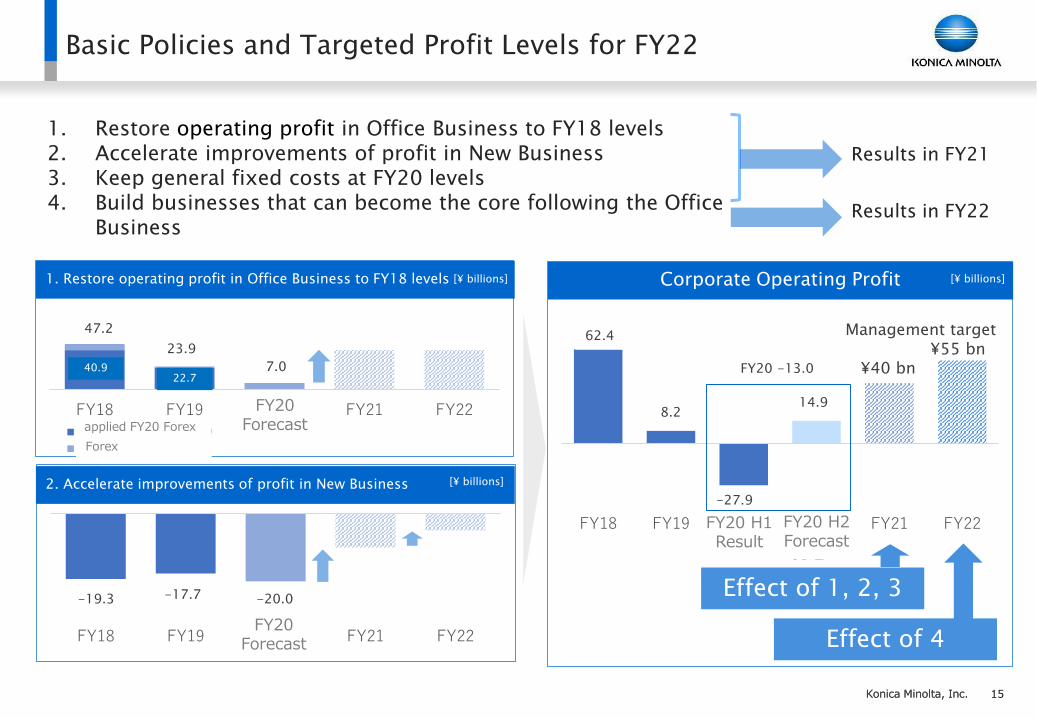
Basic Policies and Targeted Profit Levels for FY22
2. Accelerate improvements of profit in New Business
1. Restore operating profit in Office Business to FY18 levels
Effect of 1, 2, 3
Effect of 4
Management target¥55 bn
¥40 bn
[¥ billions]
1. Restore operating profit in Office Business to FY18 levels2. Accelerate improvements of profit in New Business 3. Keep general fixed costs at FY20 levels 4. Build businesses that can become the core following the Office
Business
Results in FY21
Results in FY22
[¥ billions]
FY20Forecast
FY20Forecast
FY20 H1Result
15
applied FY20 Forex
Forex
[¥ billions]
47.2
23.9
7.0
62.4
8.2
-27.9
-19.3 -17.7 -20.0
40.922.7
14.9
FY20 H2Forecast
FY20 -13.0

Konica Minolta, Inc.Konica Minolta, Inc.
1. Restore operating profit in Office Business to FY18 levels
One-off costs in FY20 and Expected result in FY21
• Carry out reassignment and optimization of 10% of Office personnel.
• For reassignment, consider transfer to IT services and WPH, which will continue growing in the future, and to growth fields other than Office.
• One-off expenses incurred in the present period for these structural reforms are expected to amount to an estimated sum of approximately ¥6.5 billion.
• We forecast the effect in FY21 relative to FY20 to be over ¥25.0 billion, primarily from reductions in labor costs (about ¥15.0 billion), sales costs and R&D costs.
Increasedsales, greater efficiency
⚫ Raise win ratio and improve efficiency ➢ Improve win ratio and gross profit ratio by
expanding a scientific approach globally➢ Optimize the marketing process based on the
customer segment(Higher efficiency achieved through inside sales and up/cross-selling using digital customer interaction, and separate use of face-to-face consultation)
Increase in gross profit (reduction in costs)
⚫ Manufacturing costs➢ Process reforms through product design by
integrated development and production team➢ Parts purchase and common design with external
cooperation➢ Expand benefits reaped from digital
manufacturing investment (automation, ICT) ⚫ Service costs➢ In addition to the “Shift Left” strategy, improve
productivity of services by expanding number of machines in the field that are compatible with remote services
Reduction in SG&A expenses
⚫ R&D expenses➢ Narrow down MFP development themes and move
software engineers to divisions in which they will interact with customers
⚫ Logistics rationalization and optimization ⚫ Back office➢ Expansion of shared services➢ Simplification and acceleration of consolidated
business management process
16

Konica Minolta, Inc.Konica Minolta, Inc.
2. Accelerate improvements of profit in New Business
Workplace Hub
⚫ In order to cope with customer need for scanning speed, making it available for customers to select MFP engine as a part for WPH composition leveraging assets from MFP development. And shift OS from Linux to Windows to improve accessibility to cloud platform and applications. By those changes, we strengthen competitiveness of the product and services and reduce development cost drastically (¥2.0bn in FY21)
⚫ This change will improve handling of WPH by major dealers, partners and even for us, expanding series of available applications. Also we focus on specific application packages for certain sectors, utilizing both edge and cloud on WPH to strengthen our capability to support customers operational efficiency.
Bio-healthcare
⚫ Genetic diagnosis: Expand the growth by entering in massive market targeting healthy and unaffected individuals by CARE Program and the Japanese market (plans for insurance reimbursement)
⚫ Pursuing profit with improving efficiency: Reduce costs by introducing new high-speed genetic analysis devices and significantly reduce time required for mutation analysis and improve diagnostic accuracy by AI.
⚫ Drug discovery support services: Bring the Multi-Omics Platform, which can analyze causal associations across the genome, pathology and medical images overall, onto the Cloud and make it part of SaaS to provide to global clinical trials
⚫ Capital policy: KMPM which integrates Ambry Genetics and Invicro has great opportunities for growth investment as a global key player because of the analytic platform in molecular level. Pursuing potential options for capital resources.
Other new business
⚫ Rigorous quantitative assessment in terms of growth potential, profitability and capital efficiency. ⚫ In the case of businesses whose profitability is not expected to improve, we will use other companies’ capital
and make decisions about selection and concentration.
17
Konica Minolta, Inc.Konica Minolta, Inc.
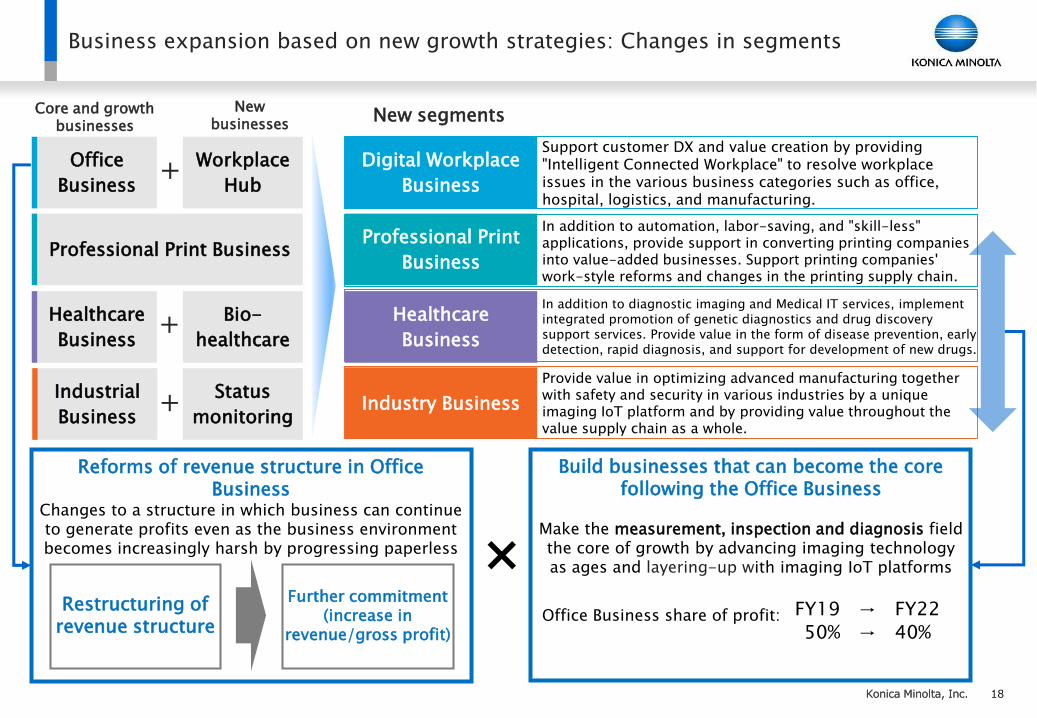
Support customer DX and value creation by providing "Intelligent Connected Workplace" to resolve workplace issues in the various business categories such as office, hospital, logistics, and manufacturing.
In addition to automation, labor-saving, and "skill-less" applications, provide support in converting printing companies into value-added businesses. Support printing companies' work-style reforms and changes in the printing supply chain.
In addition to diagnostic imaging and Medical IT services, implement integrated promotion of genetic diagnostics and drug discovery support services. Provide value in the form of disease prevention, early detection, rapid diagnosis, and support for development of new drugs.
Provide value in optimizing advanced manufacturing together with safety and security in various industries by a unique imaging IoT platform and by providing value throughout the value supply chain as a whole.
Office
Business
Workplace
Hub
Professional Print Business
Healthcare
Business
Industrial
Business
Bio-
healthcare
Status
monitoring
Digital Workplace
Business
Professional Print
Business
Healthcare
Business
Industry Business
Core and growthbusinesses
Newbusinesses
New segments
+
+
+
Business expansion based on new growth strategies: Changes in segments
Reforms of revenue structure in Office Business
Changes to a structure in which business can continue to generate profits even as the business environment becomes increasingly harsh by progressing paperless
Restructuring of revenue structure
Further commitment (increase in
revenue/gross profit)
×
Build businesses that can become the core following the Office Business
Make the measurement, inspection and diagnosis field the core of growth by advancing imaging technology as ages and layering-up with imaging IoT platforms
FY19 → FY22
50% → 40%Office Business share of profit:
18
Konica Minolta, Inc.
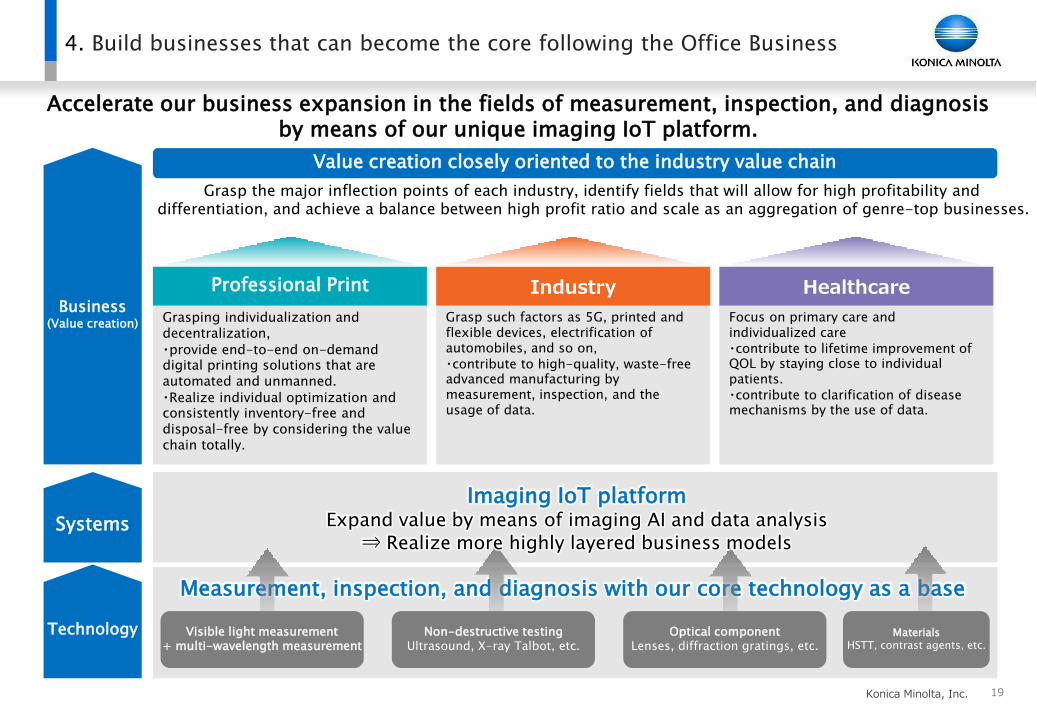
4. Build businesses that can become the core following the Office Business
Grasp such factors as 5G, printed and flexible devices, electrification of automobiles, and so on,
・contribute to high-quality, waste-free advanced manufacturing by measurement, inspection, and the usage of data.
Industry
Focus on primary care and individualized care ・contribute to lifetime improvement of QOL by staying close to individual patients.・contribute to clarification of disease mechanisms by the use of data.
Healthcare
Grasping individualization and decentralization,
・provide end-to-end on-demand digital printing solutions that are automated and unmanned.
・Realize individual optimization and consistently inventory-free and disposal-free by considering the value chain totally.
Professional Print
Technology
Measurement, inspection, and diagnosis with our core technology as a base
Systems
Business(Value creation)
Grasp the major inflection points of each industry, identify fields that will allow for high profitability and differentiation, and achieve a balance between high profit ratio and scale as an aggregation of genre-top businesses.
Imaging IoT platformExpand value by means of imaging AI and data analysis
⇒ Realize more highly layered business models
Visible light measurement+ multi-wavelength measurement
Non-destructive testingUltrasound, X-ray Talbot, etc.
Optical componentLenses, diffraction gratings, etc.
MaterialsHSTT, contrast agents, etc.
Value creation closely oriented to the industry value chain
Accelerate our business expansion in the fields of measurement, inspection, and diagnosis by means of our unique imaging IoT platform.
19

Konica Minolta, Inc.Konica Minolta, Inc.
FY20 Earnings Forecast | Dividend forecast
Regarding interim dividend and period-end dividend forecast
◼ Capital policy: Thoroughly raise ability to generate cash with revenue structure reforms and changes of business portfolio; maintain and improve shareholder returns while making carefully selected growth
investments.
◼ Earnings fell to a loss in FY2020 due to the COVID-19 outbreak, but based on the basic policy for FY2022, there is a high probability that profit levels will return to original levels in FY2021 and FY2022.
◼ According to the above approach, the annual dividend forecast is to be ¥25 per share (interim dividend of ¥10 per share and period-end dividend of ¥15 per share).
20

Konica Minolta, Inc.Konica Minolta, Inc. 21
【億円】
FY20 Earnings Forecast | New Segments
1H Results 2H Forecast YoY
Digital Workplace 211.3 253.7 465.0 549.0 - 15%
Professional Print 73.5 106.5 180.0 210.1 - 14%
Healthcare 45.4 62.1 107.5 118.5 - 9%
Healthcare 35.5 44.5 80.0 87.9 - 9%
Precision medicine 9.9 17.6 27.5 30.6 - 10%
Industry 54.0 63.5 117.5 117.2 + 0%
Sensing 14.7 14.3 29.0 27.5 + 5%
Materials and components 33.6 41.4 75.0 78.8 - 5%
Imaging-IoT solutions 5.7 7.8 13.5 10.9 + 24%
Corporate, etc. 0.6 -0.6 0.0 1.3 - 100%
Company overall 384.7 485.3 870.0 996.1 - 13%
1H Results 2H Forecast YoY
Digital Workplace -9.3 9.3 0.0 - 17.7 3.2% -
Professional Print -8.8 6.3 -2.5 - 4.4 2.1% -
Healthcare -6.6 1.1 -5.5 - -4.4 - -
Industry 5.1 6.4 11.5 9.8% 14.3 12.2% - 20%
Corporate, etc. -8.3 -8.2 -16.5 -23.8 -
Company overall -27.9 14.9 -13.0 - 8.2 0.8% -
RevenueFY2020 12M FY2019 12M
Forecast Results
Forecast ResultsOperating Profit
FY2019 12MFY2020 12M
※incl. one-off expense of ¥6.5bn for structural reform in Office business
※

Konica Minolta, Inc.Konica Minolta, Inc.
Appendix
Konica Minolta, Inc.Konica Minolta, Inc.
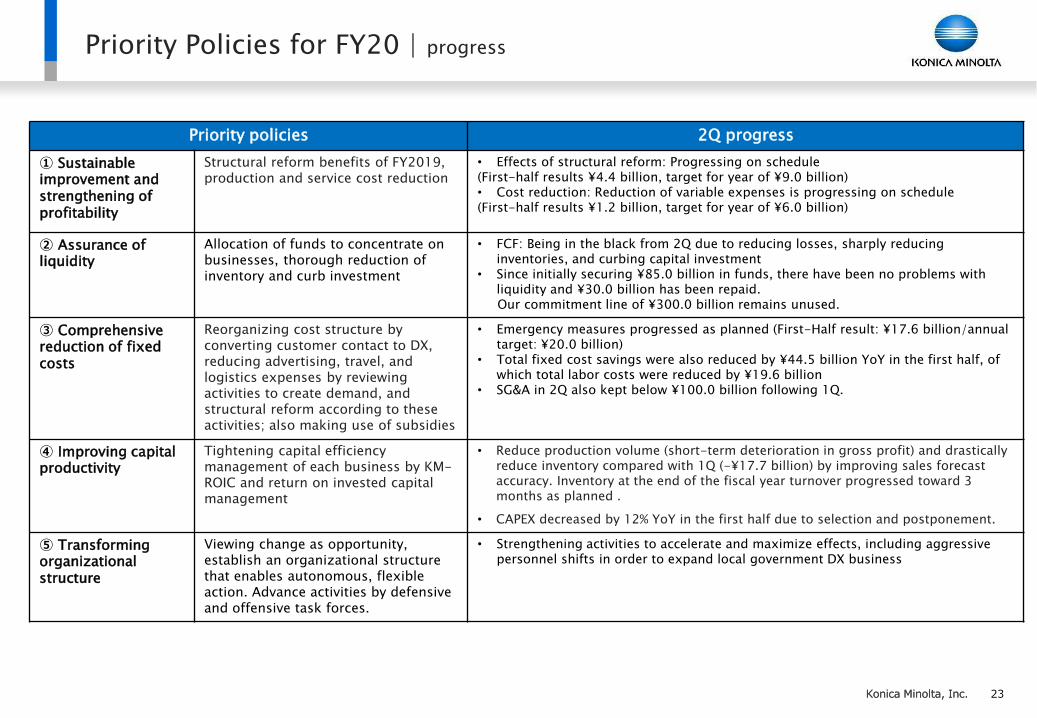
Priority Policies for FY20 | progress
Priority policies 2Q progress
① Sustainable improvement and strengthening of profitability
Structural reform benefits of FY2019, production and service cost reduction
• Effects of structural reform: Progressing on schedule(First-half results ¥4.4 billion, target for year of ¥9.0 billion)• Cost reduction: Reduction of variable expenses is progressing on schedule(First-half results ¥1.2 billion, target for year of ¥6.0 billion)
② Assurance of liquidity
Allocation of funds to concentrate on businesses, thorough reduction of inventory and curb investment
• FCF: Being in the black from 2Q due to reducing losses, sharply reducing inventories, and curbing capital investment
• Since initially securing ¥85.0 billion in funds, there have been no problems with liquidity and ¥30.0 billion has been repaid.Our commitment line of ¥300.0 billion remains unused.
③ Comprehensive reduction of fixed costs
Reorganizing cost structure by converting customer contact to DX, reducing advertising, travel, and logistics expenses by reviewing activities to create demand, and structural reform according to these activities; also making use of subsidies
• Emergency measures progressed as planned (First-Half result: ¥17.6 billion/annual target: ¥20.0 billion)
• Total fixed cost savings were also reduced by ¥44.5 billion YoY in the first half, of which total labor costs were reduced by ¥19.6 billion
• SG&A in 2Q also kept below ¥100.0 billion following 1Q.
④ Improving capital productivity
Tightening capital efficiency management of each business by KM-ROIC and return on invested capital management
• Reduce production volume (short-term deterioration in gross profit) and drastically reduce inventory compared with 1Q (-¥17.7 billion) by improving sales forecast accuracy. Inventory at the end of the fiscal year turnover progressed toward 3 months as planned .
• CAPEX decreased by 12% YoY in the first half due to selection and postponement.
⑤ Transforming organizational structure
Viewing change as opportunity, establish an organizational structure that enables autonomous, flexible action. Advance activities by defensive and offensive task forces.
• Strengthening activities to accelerate and maximize effects, including aggressive personnel shifts in order to expand local government DX business
23

Konica Minolta, Inc.Konica Minolta, Inc.
The recovery in revenue continued after bottoming out in May, and in general, every business has
shown a smooth recovery. Revenue in China turned to increase, the recovery in Europe is 90%, and the
recovery in japan and the US is nearly 80%.
24
Business ImpactImpact on revenue
Impact onprofit
Office/Professional Print
• Hardware sales were affected by the delay in business negotiations and installations due to
the restriction of the sales activities with visits to customers.
• Non-hard sales in office were affected by the restriction of the client company employees
coming in to work, while those in production print is affected by a decline in customers’
taking orders. Both hardware and non-hard are recovering since June.
• IT-services and NH in Industrial Print have recovered and achieved YoY growth.
OfficeAround ¥23
billion Prof. PrintNearly ¥9
billion
OfficeAround ¥6
billion Prof. PrintOver ¥5 billion
Healthcare • Continued decline in patients’ visit to hospitals, delayed investment decisions by hospitals and clinics
Nearly ¥ 3 billion
Around ¥1.5 billion
Materialas and Components
• Sluggish sales of IJ components due to spread of COVID-19 in customers’ export countries
• Sales of projector lenses declined due to the decreased demand of entertainment industry in
Optical components.
• Performance materials recovered to the previous year's level
Nearly ¥ 4 billion
Around ¥2 billion
Optical Systems for Industrial Use
• Number of visitors is recovering in visual solutions (planetarium) but still below the previous
year's level
Nearly ¥ 1 billion
Around ¥0.5 billion
New Business • Bio-healthcare in US is recovering in genetic testing numbers, but the impact of the lock-
down on patients visits to hospital continues. Sales of drug discovery support services
continued to be affected by the delay of clinical trials.
Around ¥3 billion
Nearly ¥ 2.5 billion
Company overallAround ¥42
billionAround ¥17.5
billion
FY20 First-Half Performance | 2Q impact of COVID-19

Konica Minolta, Inc.Konica Minolta, Inc.
FY20 Business Segment | Digital Workplace Business
25
YoY
2Q SummaryRevenue ・ Operating Profit
1H
Quart
erly F
inancia
l Results
[¥ billions]
IT Services Solutions(ITS)
Office(OP)
Workplace Hub(WPH)
FY19 1Q 2Q 3Q 4Q
OP 116.4 120.9 119.6 116.6
ITS 18.1 17.7 19.4 17.7
WPH 0.4 0.5 0.5 1.1
5.5 7.8 4.3 0.1
FY20 1Q 2Q 3Q 4Q YoY
OP 78.3 98.2 0.0 0.0 -19%
ITS 15.7 17.7 0.0 0.0 -0%
WPH 0.6 0.8 +58%
-9.6 0.3 0.0 0.0 -96%
Revenue
Revenue
OP
OP
- 26%
- 7%
+ 54%YoY -23%
YoY -
237.4 176.5
35.9
33.4
274.1
211.3 0.9
1.4
FY19 FY20
Revenue
OP ITS WPH
◼ Unit sales of color models, which are our principal products, have steadily increased since 1Q, and the decrease has also shrunk compared to the previous year (July: down 17%, August: down 19%, September: down 12%).
◼ By region, momentum has been sustained since June, when revenue began to increase in China, and in Europe revenue has reached over 80% of the previous year’s levels. In the US, sales are down just under 75%, but are steadily recovering. There was a significant improvement for both in September.
◼ The recovery for non-hard was remarkable in W.W., with a recovery of more than 10% since 1Q (rate of reduction in non-hard over previous year fell from 31% in 1Q to 19% in 2Q).
◼ The performance of ITS recovered to levels on par with the previous year, with revenue up in August and September, thanks to solutions projects from major clients in Europe and the US.
◼ Expansion of new models (WPH Pro) and products (applications such as tools to automatically produce manuals) contributed and sales increased steadily; revenue increased over the previous year.

Konica Minolta, Inc.Konica Minolta, Inc.
YoY
FY20 Business Segment | Professional Print Business
2Q SummaryRevenue ・ Operating Profit
1H
Quart
erly F
inancia
l Results
[¥ billions]
FY19 1Q 2Q 3Q 4Q
PP 34.2 35.4 37.5 33.5
IP 3.8 5.8 5.1 6.0
MS 12.6 11.5 12.8 11.9
1.1 1.0 2.9 -0.7
FY20 1Q 2Q 3Q 4Q YoY
PP 20.4 27.1 0.0 0.0 -23%
IP 2.9 4.3 0.0 0.0 -25%
MS 8.4 10.2 0.0 0.0 -11%
-7.1 -1.7 0.0 0.0 -OP
OP
Revenue
Revenue
69.6 47.5
9.6
7.2
24.1
18.7
103.3
73.5
FY19 FY20
Revenue
PP IP MS
- 32%
- 24%
- 22%
YoY -29%YoY -
◼ Unit sales of both color and monochrome models increased over 1Q; the rate of reduction in revenue over the previous year has also improved since August. (July: down 48%, August: down 29%, September: down 15%) Europe recovered just under 80% and the US recovered over 70%.
◼ HPP unit sales were strong due to large orders.
◼ The rebound in non-hard was marked globally, and sales recovered more than 10% since 1Q (rate of reduction for non-hard over the previous year declined from 38% in 1Q to 25% in 2Q).
◼ Demand declined as customer marketing and sales promotion activities fell in Europe and the US, but revenue recovered in Asia and in Japan, new clients were brought in and digital solution services were strong performers, resulting in a recovery trend.
◼ In industrial print, non-hard revenue turned to increase in 2Q and further gains are expected.
◼ More time is needed for inspections before HW sales can be posted, and the order backlog increased. While unit sales by competitors are falling in half for labels, revenue increased due to higher sales in Europe and the US.
Marketing services
Industrial print
Production print
26

Konica Minolta, Inc.Konica Minolta, Inc. 27
YoY
Healthcare (HC)
Precision medicine(APM)
[¥ billions]
2Q SummaryRevenue ・ Operating Profit
1H
Quart
erly F
inancia
l Results
FY20 Business Segment | Healthcare Business
FY19 1Q 2Q 3Q 4Q
Revenue HC 18.6 26.4 18.1 24.7
APM 7.2 7.4 7.7 8.3
-2.1 -1.2 -0.4 -0.6
FY20 1Q 2Q YoY
Revenue HC 16.4 19.1 -28%
APM 4.1 5.9 -21%
-4.7 -1.8 -
OP
OP
45.1 35.5
14.6
9.9
59.7
45.4
FY19 FY20
Revenue
HC APM
- 21%
- 32%YoY -24%
YoY -
◼ DR volume declined year-on-year due partly to the effects of the last-minute surge demand before the consumption tax hike in Japan last fiscal year.
◼ In diagnostic ultrasound system, we fought hard over obstetrics inside and outside Japan, but in orthopedics in Japan, that above mentioned last-minute demand was not made up so that volume declined year-on-year.
◼ Although informity sales continue to expand in Japan, PACS sales declined due to limitations on sales activity.
◼ In genetic testing, the number of samples on a monthly basis is on-track to recovery. The number of samples is expanding in both RNA testing and the CARE program, which are areas for priority measures.
◼ In drug discovery support services, sales are on-track to recovery but projects still remain on hold due to the decline in numbers of clinical trial participants. The clinical trial backlog in the central nervous system field is growing due to the acquisition of multiple large orders.

100
86
78 78
60 65
90 97
100 94 95 94
127
145 134
128
(100)
(50)
0
50
100
150
200
0
50
100
150
200
Q1 Q2 Q3 Q4 Q1 Q2 Q3 Q4
FY19 FY20
Invicro: Fluctuations in revenue and backlog*
Revenue ¥bn Backlog total
Precision medicine Ambry Genetics and Invicro: FY19 to FY20 earnings trends (revenue/KPI)
Ambry(AG) Invicro(IC)
*Indexed with April FY2019 as 100. *Indexed with FY2019 1Q as 100.
28
100
118
106 112
126
115
147
131 123
140 136
101
64
80
103
120 120 127
141
116
138 131
141
168
100
121 119
114 134
133
127
139 154
127
133
194
51 57
77 88
94
123 118
102
137
109
126
166
(200)
(150)
(100)
(50)
0
50
100
150
200
250
0
50
100
150
200
250
300
4月
5月
6月
7月
8月
9月
10月
11月
12月
1月
2月
3月
4月
5月
6月
7月
8月
9月
10月
11月
12月
1月
2月
3月
Ambry Genetics: Fluctuations in revenue and samples received*
その他 RNA CARE 売上高 億円
FY19 FY20
Others Revenue
Ap
rM
ayJu
nJu
lA
ug
Sep
Oct
No
vD
ecJa
nFe
bM
arA
pr
May
Jun
Jul
Au
gSe
pO
ctN
ov
Dec
Jan
Feb
Mar
*The figures after 3Q in FY2020 is the company’s plan*The figures after 3Q in FY2020 is the company’s plan
PlanPlan

Konica Minolta, Inc.Konica Minolta, Inc. 29
Precision Medicine Target Market Trends (Forecast at Beginning of FY20)
Source : Kalorama Information Reports
2.0 2.4 3.1 4.26.1
9.61.8 2.4
3.34.5
6.1
8.3
3.94.3
4.7
5.2
5.7
6.3
3.23.4
3.6
3.8
4.0
4.3
1113
15
18
22
28
0.0
20.0
40.0
2019 2020 2021 2022 2023 2024
遺伝子(先天性) 遺伝子(後天性) 病理 イメージング
($Bn)
21.2%
Annual growth of 21% is expected, but the market for genetic diagnostics in germline for healthy individuals has a possibility of more growth as shown on the next page.
Germline Somatic Pathology Imaging

Konica Minolta, Inc.
Background to the potential expansion of the market for genetic diagnostics in germline for healthy individuals
650,000
21,000,000
0
12,500,000
25,000,000
実際の検査数(2019) NCCNガイドライン適合
x32
21 million people in the US as the subjects of the testing
Source: Cancer statistics、NCCNガイドライン
2,500万人
1,250万人
CARE Program creates a market for genetic diagnostics in germline of 32 times the number of tests in FY2019, with healthy and unaffected individuals being tested.
30Source: Cancer statistics, NCCN Guideline
The number of testing in 2019
The number of people applied to NCCN guideline
12.5 mil. people
25.0 mil. people

Konica Minolta, Inc.Konica Minolta, Inc. 31
YoY
FY20 Business Segment | Industry Business
[¥ billions]
2Q SummaryRevenue ・ Operating Profit
1H
Quart
erly F
inancia
l Resu
lts
FY20 1Q 2Q 3Q 4Q
MI 6.6 6.7 7.3 7.0
PM 12.6 11.9 10.8 11.3
OC 4.8 5.3 5.2 4.4
IJ 3.6 3.2 2.9 2.7
IIS 1.9 2.0 1.6 2.2
VS 0.6 0.8 0.7 1.2
3.2 3.7 4.2 3.1
FY20 1Q 2Q 3Q 4Q YoY
MI 7.1 7.6 0.0 0.0 +14%
PM 9.8 11.6 0.0 0.0 -3%
OC 3.8 3.2 0.0 0.0 -41%
IJ 2.5 2.8 0.0 0.0 -13%
IIS 2.7 2.3 0.0 0.0 +19%
VS 0.2 0.4 -42%
2.8 2.2 0.0 0.0 -41%
OP
Revenue
Revenue
OP
13.2 14.7
24.5 21.4
10.1 6.9
6.8 5.3
3.8 5.0
1.3 0.6
59.9 54.0
FY19 FY20
Revenue
MI PM OC IJ IIS VS
6.9 5.1
12%
9%
FY19 FY20
Operating Profit
+ 11%
- 13%
- 32%- 22%
+ 32%- 53%
YoY -10%
YoY - 27%
Optical systems for industrial use: Measuring instruments(MI)
◼ Sales of object color measurement instruments rose to the falling impact of COVID-19.
◼ Sales of light-source color measurement instruments were solid due to ongoing investments by major clients in China and elsewhere.
◼ Orders of automobile visual inspection equipment were delayed due to the impact of COVID-19, but business talks and demonstrations are recovering.
◼ Performance materials: Sales of high-value-added products and ultra-thin films were solid, and revenue recovered to about the same level as the same period in the previous year.
◼ Optical components: Revenue decreased over the previous year due to ongoing restrictions on events due to the COVID-19 impact.
◼ IJ (Inkjet) components: Although sales are recovering from the impact of COVID-19 as exhibits resume, revenue decreased over the previous year.
Imaging-IoT solutions: imaging-IoT solutions (IIS),
visual solutions (VS)
Materials and components: Performance materials (PM), Optical components (OC), IJ (Inkjet) components
◼ Imaging-IoT solutions: Sales of contact-less thermal cameras by MOBOTIX have been strong, and revenue rose over the previous year.
◼ Visual solutions: Although sales are recovering from the impact of COVID-19 infections, revenue is down compared to the previous year.

Konica Minolta, Inc.Konica Minolta, Inc.
139.5 144.7
162.6 155.0 153.4
2.81 2.89
3.55 3.43 3.76
0.00
1.00
2.00
3.00
4.00
5.00
6.00
7.00
0.00
20.00
40.00
60.00
80.00
100.00
120.00
140.00
160.00
180.00
Mar
2018
Mar
2019
Mar
2020
Sep
2019
Sep
2020
Inventories Turnover (months)
1203.9 1219.0 1276.8 1276.1 1274.6
Mar
2018
Mar
2019
Mar
2020
Sep
2019
Sep
2020
32
FY20 Financial Position | Major Items from Statements of Financial Position
Total Assets[¥billions]
Inventory/Turnover[¥billions]
Inventory turnover, in months = Inventory balance at end of fiscal year / Average cost of sales for most recent three months
Unchanged from the end of FY19 due to
increased cash to secure liquidity on
hand and reduced account receivables
from sales in COVID-19 circumstances.
Inventory reduced successfully towards
target inventory turnover of 2.8 months
by the end of FY21 to secure liquidity.

Konica Minolta, Inc.Konica Minolta, Inc.
293.7 273.7
403.5 383.3
460.9 0.560.49
0.77 0.73
0.93
-0.80
-0.30
0.20
0.70
1.20
0.00
50.00
100.00
150.00
200.00
250.00
300.00
350.00
400.00
450.00
Mar
2018
Mar
2019
Mar
2020
Sep
2019
Sep
2020
Interest-bearing debts
Debt-to-equity ratio (times)
524.5 555.7 523.7 526.9 494.2
43.6 45.6
41.0
0.0
41.3 38.8
0.00
5.00
10.00
15.00
20.00
25.00
30.00
35.00
40.00
45.00
50.00
0.00
100.00
200.00
300.00
400.00
500.00
600.00
Mar
2018
Mar
2019
Mar
2020
Sep
2019
Sep
2020
Shareholders' equity Equity ratio(%)
33
FY20 Financial Position | Major Items from Statements of Financial Position
Equity & Equity RatioAttributable to owners of the parent company
Interest-Bearing Debt &D/E Ratio
[¥billions]
[¥billions]
Equity ratio = Equity attributable to owners of the parent / Total assets
(For CompanyRating 42.6%)
Equity = Equity attributable to owners of the parent
¥30 bn of the ¥85 bn in borrowings at
the start of the fiscal year was repaid.
Net D/E ratio is 0.68.
Equity was reduced relative to the end of the previous fiscal year due to the decline in profit attributable to owners of the company and dividend
Konica Minolta, Inc.Konica Minolta, Inc. 34
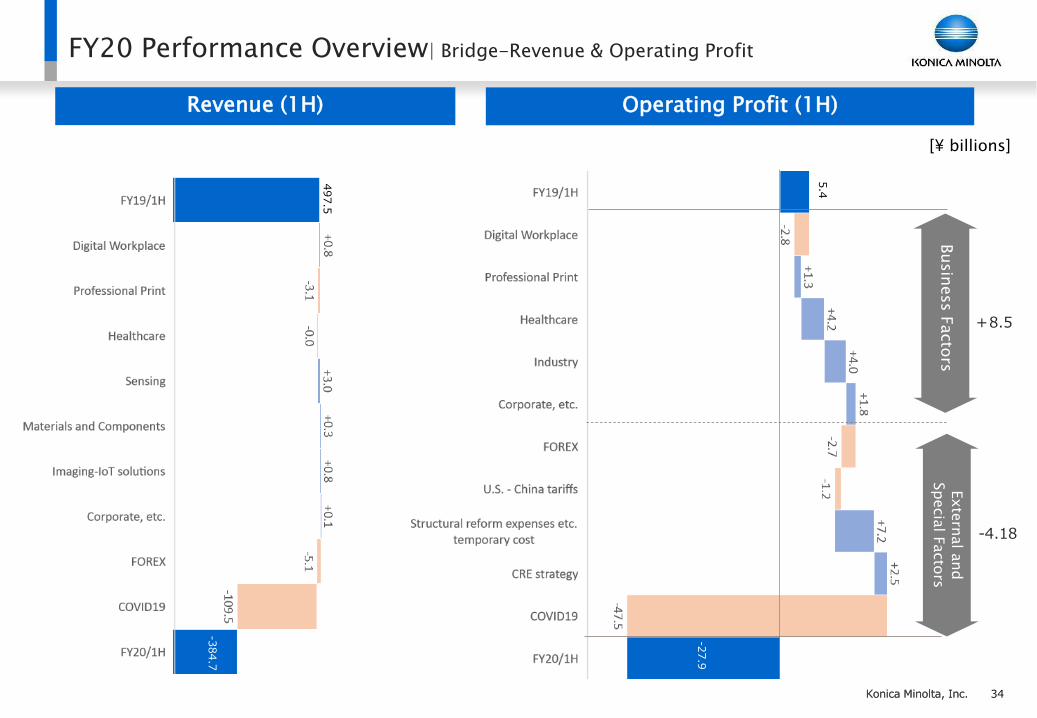
Exte
rnal a
nd
Specia
l Facto
rsBusin
ess F
acto
rs
+8.5
-4.18
-27.9
FY20 Performance Overview| Bridge-Revenue & Operating Profit
Revenue (1H) Operating Profit (1H)
[¥ billions]
5.4
-384.7
497.5

Konica Minolta, Inc.Konica Minolta, Inc. 35
Appendix Financial Result - Overview
[¥ billions]
FY2020 FY2019 FY2020 FY2019
1H 1H YoY 2Q 2Q YoY
Revenue 384.7 497.5 - 23% 211.5 255.7 - 17%
Gross Profit 161.0 236.9 - 32% 89.3 120.2 - 26%
Gross Profit ratio 41.8% 47.6% -5.8pt 42.2% 47.0% -4.8pt
Operating Profit -27.9 5.4 - -5.2 4.9 -
Operating Profit ratio - 1.1% - - 1.9% -
Profit before tax -30.9 1.6 - -7.1 2.9 -
Profit before tax ratio - 0.3% - - 1.1% -
Profit attributable to owners of the Company -22.2 0.1 - -4.9 1.3 -
Profit attributable to owners of the Company ratio - 0.0% - - 0.5% -
EPS [Yen] -44.93 0.21 -9.98 2.66
CAPEX 21.4 24.3 15.0 14.6
Depreciation and Amortization Expenses 28.5 28.1 14.3 14.1
R&D expenses 32.6 38.7 16.5 19.7
FCF -7.1 -18.6 6.9 -3.6
Investment and lending 3.7 3.9 3.5 0.2
FOREX [Yen] USD 106.9 108.6 -1.7 106.2 107.4 -1.1
EUR 121.3 121.4 -0.1 124.1 119.3 4.8
* Depreciation and amortization expenses:IFRS16 right-of- use assets amortization expenses not included.

Konica Minolta, Inc.Konica Minolta, Inc. 36
Appendix SG&A-Other Income/ Expenses-Finance Income/Loss
[¥ billions]
SG&A: FY2020 FY2019 FY2020 FY2019
1H 1H 2Q 2Q
Selling expenses - variable 16.1 22.7 - 6.5 9.1 11.4 - 2.3
R&D expenses 32.6 38.7 - 6.1 16.5 19.7 - 3.3
Personnel expenses 91.1 102.6 - 11.5 45.6 50.4 - 4.8
Others 51.1 60.6 - 9.5 26.1 30.3 - 4.2
SG&A total 190.9 224.6 - 33.6 97.3 111.8 - 14.5
* Forex impact:
Other income:
Other income total 7.5 1.2 +6.4 4.4 0.6 +3.8
Other expenses
Loss on sales of property, plant and equipment 0.4 3.1 - 2.7 0.2 0.6 - 0.4
Business structure improvement costs 2.8 1.3 +1.6 0.4 0.9 - 0.4
Other expenses 2.2 3.6 - 1.5 1.0 2.6 - 1.7
Other expenses total 5.4 8.0 - 2.6 1.6 4.1 - 2.5
Finance income/loss:
Interest income/Dividends received/Interest expense -2.0 -2.1 +0.1 -1.1 -1.3 +0.2
Foreign exchange gain/loss (net) -0.6 -1.5 +0.9 -0.3 -0.7 +0.3
Others -0.5 -0.2 - 0.3 -0.4 0.1 - 0.4
Finance income/loss, net -3.1 -3.8 +0.7 -1.8 - 1.9 +0.1
YoY YoY
-1.9bn. (Actual: -31.8 bn.) 0.4 bn. (Actual: -14.9 bn.)
Konica Minolta, Inc.Konica Minolta, Inc. 37
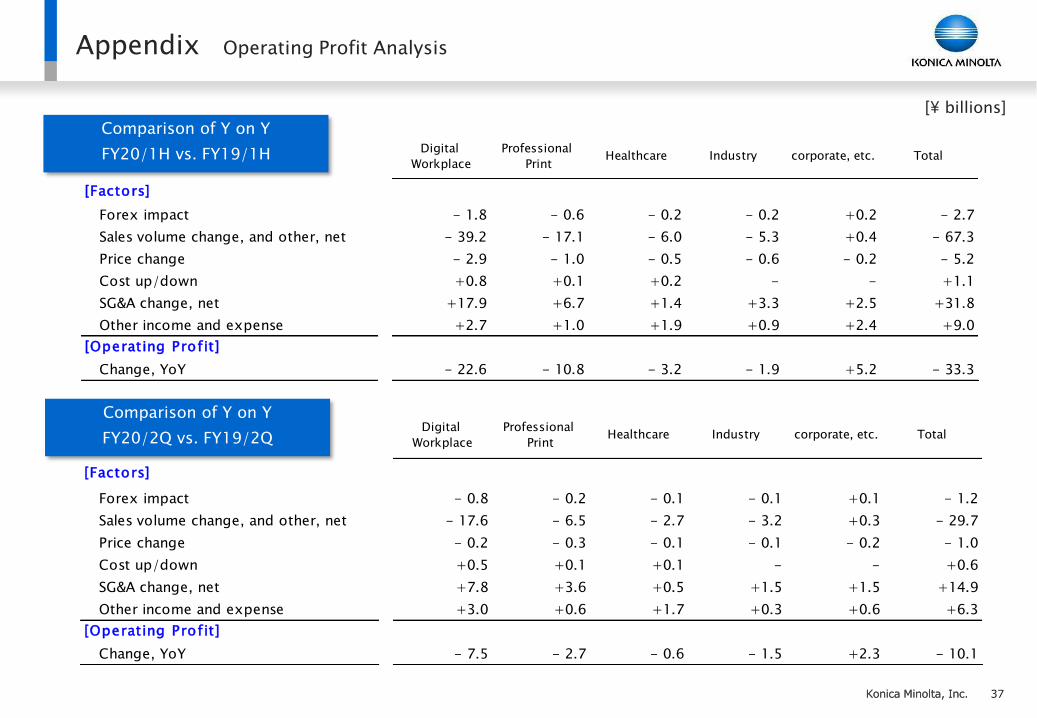
Appendix Operating Profit Analysis
[¥ billions]
Comparison of Y on Y
FY20/2Q vs. FY19/2Q
Comparison of Y on Y
FY20/1H vs. FY19/1H Digital
Workplace
Professional
PrintHealthcare Industry corporate, etc. Total
Forex impact - 1.8 - 0.6 - 0.2 - 0.2 +0.2 - 2.7
Sales volume change, and other, net - 39.2 - 17.1 - 6.0 - 5.3 +0.4 - 67.3
Price change - 2.9 - 1.0 - 0.5 - 0.6 - 0.2 - 5.2
Cost up/down +0.8 +0.1 +0.2 - - +1.1
SG&A change, net +17.9 +6.7 +1.4 +3.3 +2.5 +31.8
Other income and expense +2.7 +1.0 +1.9 +0.9 +2.4 +9.0
Change, YoY - 22.6 - 10.8 - 3.2 - 1.9 +5.2 - 33.3
[Factors]
[Operating Profit]
Digital
Workplace
Professional
PrintHealthcare Industry corporate, etc. Total
Forex impact - 0.8 - 0.2 - 0.1 - 0.1 +0.1 - 1.2
Sales volume change, and other, net - 17.6 - 6.5 - 2.7 - 3.2 +0.3 - 29.7
Price change - 0.2 - 0.3 - 0.1 - 0.1 - 0.2 - 1.0
Cost up/down +0.5 +0.1 +0.1 - - +0.6
SG&A change, net +7.8 +3.6 +0.5 +1.5 +1.5 +14.9
Other income and expense +3.0 +0.6 +1.7 +0.3 +0.6 +6.3
Change, YoY - 7.5 - 2.7 - 0.6 - 1.5 +2.3 - 10.1
[Operating Profit]
[Factors]
Konica Minolta, Inc.Konica Minolta, Inc.
68.7 65.4 57.2
30.1
46.0 70.6
133.7
41.5
50.0 47.5
-1.9 -33.0
15.7
-19.9 -1.5
35.4
INCJ
FCF
Net cash flows from investing activities
Net cash flows from operating activities
38.9 38.7
52.5 50.8 47.5
51.8 56.3
59.0 57.0 55.0
0.0
10.0
20.0
30.0
40.0
50.0
60.0
70.0
80.0
FY2016 FY2017 FY2018 FY2019 FY2020
Capital expenditures
Depreciation and amortization
38
FY2016
FY2017
FY2018
FY2019
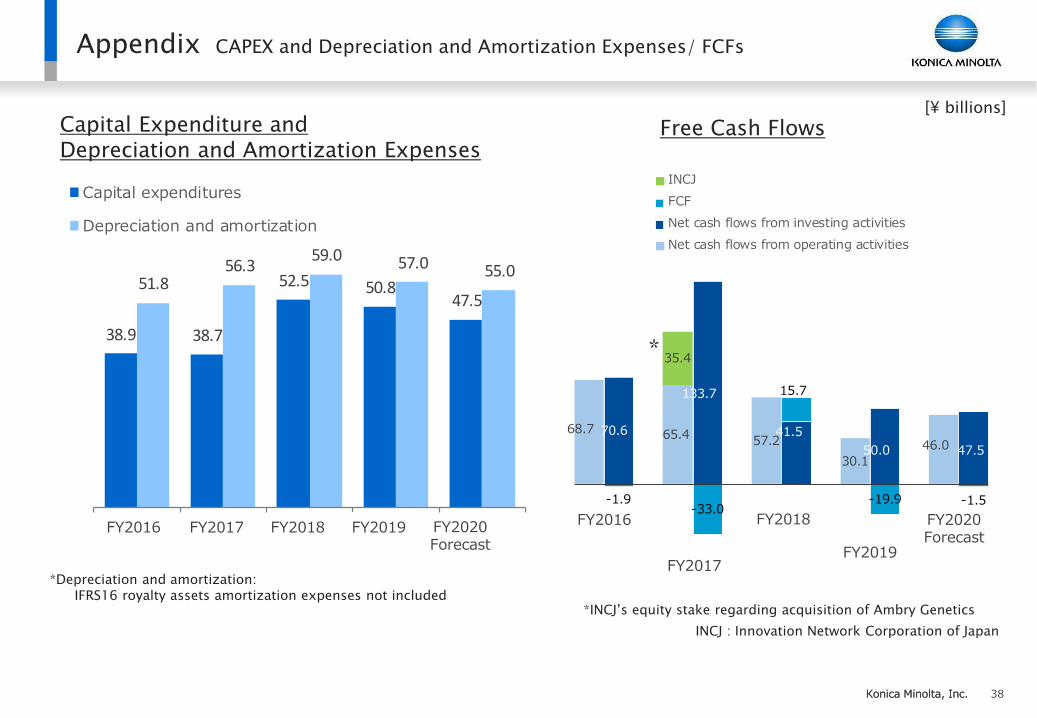
Appendix CAPEX and Depreciation and Amortization Expenses/ FCFs
[¥ billions]
Free Cash FlowsCapital Expenditure andDepreciation and Amortization Expenses
INCJ : Innovation Network Corporation of Japan
FY2020Forecast
FY2020Forecast
FY2016 FY2017 FY2018 FY2019
*INCJ’s equity stake regarding acquisition of Ambry Genetics
*Depreciation and amortization: IFRS16 royalty assets amortization expenses not included
*
Konica Minolta, Inc.Konica Minolta, Inc.
FY2020 12M FY2019 12M
Forcast (current) Results YoY
Revenue 870.0 996.1 - 13%
Operating Profit -13.0 8.2 -
Operating Profit ratio - 0.8% -
Profit before tax -20.0 0.3 -
Profit attributable to owners of the Company -18.0 - 3.1 -
Profit attributable to owners of the Company ratio - - -
EPS [Yen] -36.27 - 6.21
ROE(%) -3.5% -0.6%
CAPEX 47.5 50.8
Depreciation and Amortization Expenses 55.0 57.0
R&D expenses 65.0 74.0
FCF -1.5 - 19.9
Investment and loan 10.0 7.9
FOREX [Yen] USD 105.0 108.7
EUR 120.0 120.8
39
*1
*2
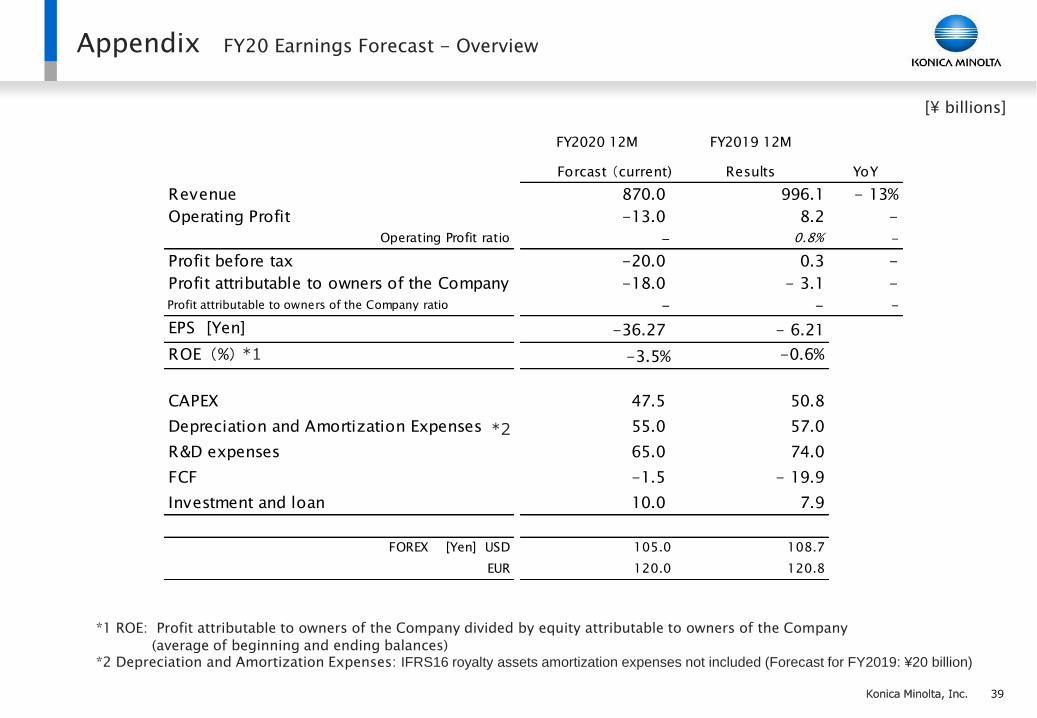
Appendix FY20 Earnings Forecast - Overview
[¥ billions]
*1 ROE: Profit attributable to owners of the Company divided by equity attributable to owners of the Company
(average of beginning and ending balances)*2 Depreciation and Amortization Expenses: IFRS16 royalty assets amortization expenses not included (Forecast for FY2019: ¥20 billion)

Konica Minolta, Inc.Konica Minolta, Inc. 40
Appendix FOREX Impact on Revenue and Operating Profit
[FOREX:¥][Impact, Sensitivity:¥ billions]
*1 European currency: Currencies used in Europe including EUR/GBP
*2 FOREX Sensitivity: FOREX impact at ¥1 change (annual)
FY19 FY20
6M 6M Revenue OP Revenue OP
USD 108.63 106.92 - 2.1 +0.2 +2.8 - 0.2
EUR 121.42 121.30 +0.3 - 0.5 +1.6 +0.4
GBP 136.73 135.38 - 0.1 +0.0 +0.2 +0.0
European Currency*1 ー ー - 0.8 - 0.5 +2.2 +0.7
CNY 15.68 15.26 - 0.6 - 0.2 +2.9 +0.8
AUD 75.25 73.28 - 0.2 - 0.1 +0.4 +0.1
Other ー ー - 1.3 - 0.3 ー ー
Exchange contract
effectー ー +0.1 - 1.8 ー ー
Total ー ー - 4.9 - 2.7 ー ー
YoY Impact FX Sensitivity*2

Konica Minolta, Inc.Konica Minolta, Inc. 41
◼ Composition of revenue by region (in yen)
◼ Change in revenue by region (w/o FOREX)
◼ Percentage of color in sales of hardware
AppendixQuarterly Unit Sales Trends | Digital Workplace Business/Professional Print - Regional
1Q 2Q 3Q 4Q 1Q 2Q 3Q 4Q 1Q 2Q
Japan 13% 12% 12% 12% 12% 13% 13% 14% 15% 14%
North America 33% 33% 33% 33% 34% 33% 33% 33% 33% 32%
EU 36% 36% 36% 36% 36% 34% 37% 37% 35% 36%
Others 18% 19% 18% 18% 17% 19% 17% 16% 18% 18%
FY2020FY2018 FY2019
1Q 2Q 3Q 4Q 1Q 2Q 3Q 4Q 1Q 2Q
Japan +4% +1% +2% +3% -8% +4% +1% -3% -19% -18%
North America +5% +4% +5% +4% -2% -2% -3% -12% -34% -27%
EU +4% +1% +1% +0% -2% -1% +6% -7% -31% -23%
Others +16% +8% +10% +10% -6% +1% +0% -17% -25% -21%
FY2018 FY2019 FY2020
1Q 2Q 3Q 4Q 1Q 2Q 3Q 4Q 1Q 2Q
Office 73% 73% 73% 74% 72% 73% 72% 75% 69% 76%
Professional Print 81% 80% 80% 81% 78% 82% 76% 80% 75% 80%
FY2018 FY2019 FY2020

Konica Minolta, Inc.Konica Minolta, Inc.
100
118 118 116
72
100
0 0
1Q 2Q 3Q 4Q
FY19 FY20
100 114
100
71
76
101
0 0
1Q 2Q 3Q 4Q
FY19 FY20
100
116 111 107
51
85
0 0
1Q 2Q 3Q 4Q
FY19 FY20
100 110
94
80
59
75
0 0
1Q 2Q 3Q 4Q
FY19 FY20
100 116 110
97
74
100
0 0
1Q 2Q 3Q 4Q
FY19 FY20
100 114 105
98
54
81
0 0
1Q 2Q 3Q 4Q
FY19 FY20
42
Appendix Quarterly Unit Sales Trends | office/production print - Products
◼ A3 Color MFP- Units* ◼ A3 monochrome MFP- Units* ◼ A3 MFP- Units*
◼ Color Production Print - Units* ◼ Monochrome Production Print – Units* ◼ Production Print - Units*
*Base Index: “FY2019-1Q = 100
YoY -16% YoY -11%
YoY -27% YoY -32%
YoY -14%
YoY -29%

Konica Minolta, Inc.Konica Minolta, Inc.
+1.7%-0.6%+1.0%-0.7%
-38.5%-25.5%
-50.0%
-40.0%
-30.0%
-20.0%
-10.0%
+0.0%
+10.0%
1Q
FY19
2Q
FY19
3Q
FY19
4Q
FY19
1Q
FY20
2Q
FY20
-2.3% -2.0% -0.7%
-2.9%
-31.1%
-19.7%
-35.0%
-30.0%
-25.0%
-20.0%
-15.0%
-10.0%
-5.0%
+0.0%
+5.0%
+10.0%
1Q
FY19
2Q
FY19
3Q
FY19
4Q
FY19
1Q
FY20
2Q
FY20
62.4 60.5 62.3 60.1 42.1 48.9
53%50% 52% 51% 53%
50%
0%
10%
20%
30%
40%
50%
60%
70%
80%
0.0
10.0
20.0
30.0
40.0
50.0
60.0
70.0
1Q
FY19
2Q
FY19
3Q
FY19
4Q
FY19
1Q
FY20
2Q
FY20
20.3 19.9 21.5 19.8 12.2 14.8
59%56% 57% 59% 60%
55%
0%
10%
20%
30%
40%
50%
60%
70%
80%
0.0
10.0
20.0
30.0
40.0
50.0
60.0
70.0
1Q
FY19
2Q
FY19
3Q
FY19
4Q
FY19
1Q
FY20
2Q
FY20 43
Appendix Sales Results for Non-Hard | office/production print Print
Office [¥ billions] 【Total】 【Regional YoY】
Revenue & ratio of non-hard YoY revenue increase in non-hard (w/o FOREX)
Production print
-2.4%-1.5% -0.6% -1.6%
-14.6%JP,-10.4%
-1.2%-1.3%
-1.9% -3.8%
-37.8%
US,-26.9%
-3.5% -2.1%
+1.1% -0.4%
-34.3%
EP,-18.5%
+7.3% +9.7%+4.1%
-15.9%
+6.7% CN,+4.9%
+3.0%
+16.2% +9.2%
+1.4%
-48.1%
IN,-31.7%
1QFY19
2QFY19
3QFY19
4QFY19
1QFY20
2QFY20
-0.9% -2.3%
-3.7% -6.4% -24.0%JP,-17.8%-3.7%
-1.9%
-1.6% -4.8%
-47.6% US, -32.6%
+1.4%
-2.7%
-1.2% +0.3%
-36.2%
EP,-22.8%
+27.5%
+16.7%
+18.5%
+4.6%+13.0%
CN,+16.8%+20.2%
+19.0%
+18.5%
+10.2%
-66.1%
In, -29.1%
1QFY19
2QFY19
3QFY19
4QFY19
1QFY20
2QFY20

Konica Minolta, Inc.Konica Minolta, Inc. 44
Appendix Quarterly Financial Results |Segments
[¥ billions]
1Q 2Q 3Q 4Q 1Q 2Q 3Q 4Q 1Q 2Q
Digital Workplace Business 143.5 147.2 145.7 151.4 135.0 139.1 139.5 135.4 94.6 116.7
Professional Print Business 53.4 55.9 55.8 62.7 50.6 52.7 55.4 51.4 31.8 41.7
Healthcare Business 24.5 28.2 27.5 36.8 25.9 33.8 25.9 33.0 20.5 24.9
Healthcare 18.6 21.6 20.9 29.8 18.6 26.4 18.1 24.7 16.4 19.1
Precision medicine 5.9 6.5 6.6 6.9 7.2 7.4 7.7 8.3 4.1 5.9
Industry Business 33.5 30.3 31.0 30.4 30.0 29.8 28.5 28.9 26.1 27.9
Sensing 9.6 7.2 7.7 7.6 6.6 6.7 7.3 7.0 7.1 7.6
Materials and Components 21.5 20.1 20.6 19.3 21.0 20.5 18.9 18.5 16.1 17.6
Imaging-IoT solutions 2.4 2.9 2.6 3.4 2.5 2.7 2.3 3.4 2.9 2.8
Corporate etc. 0.3 0.3 0.5 0.3 0.3 0.3 0.3 0.5 0.2 0.3
Company overall 255.2 261.9 260.5 281.5 241.7 255.7 249.5 249.1 173.2 211.5
1Q 2Q 3Q 4Q 1Q 2Q 3Q 4Q 1Q 2Q
Digital Workplace Business 7.7 11.9 9.9 10.6 5.5 7.8 4.3 0.1 -9.6 0.3
Professional Print Business 1.7 3.7 3.3 5.1 1.1 1.0 2.9 -0.7 -7.1 -1.7
Healthcare Business -1.6 0.9 -1.3 0.6 -2.1 -1.2 -0.4 -0.6 -4.7 -1.8
Industry Business 5.3 3.5 4.3 2.1 3.2 3.7 4.2 3.1 2.8 2.2
Corporate etc. 2.4 -0.9 -0.3 -6.5 -7.0 -6.5 -5.9 -4.4 -4.1 -4.2
Company overall 15.4 19.2 15.9 11.9 0.6 4.9 5.1 -2.4 -22.6 -5.2
FY20
【Revenue】
【Operating Profit】
FY19FY18

Konica Minolta, Inc.Konica Minolta, Inc. 45
Glossary
・ MFP (Multi Functional Peripheral) Speed Segment: Digital Workplace BusinessSeg. 1 to 20ppm, Seg.2 21-30ppm, Seg.3 31-40ppm, Seg.4 41-69ppm, Seg.5 70~ppm (A4 vertical, minute speed)
・ Workplace Hub (WPH): Digital Workplace BusinessEdge IoT platform provided by Konica Minolta. In addition to multi functional peripheral, a server is integrated to create a solution that drives efficiencies by reducing the overall costs of IT infrastructure management, providing real-time data-driven visibility of IT usage patterns that help to improve business processes. This will link people and data, and empower them to make smarter decisions and solve problems in the office.
・ Color production print Machine Segments: Professional Print BusinessELPP(Entry Light Production Print, Monthly printing volume: 1-0.3 million sheets
for low-priced products mainly for large companies' centralized printing rooms)LPP(Light Production Print, Monthly printing volume: 0.1-0.3 million sheets for commercial printers)MPP(Mid Production Print , Monthly printing volume: 30-1 million sheets for commercial printing products)HPP(Heavy Production Print , Monthly printing volume:1 million sheets or more for commercial printing products)
・ X-ray kinetic analysis and Digital X-ray Dynamic Digital Radiography Systems: Healthcare BusinessThese devices and systems enable more detailed diagnoses by using continuously captured X-ray images to observe patients in motion.
・ informity: Healthcare Business
Our ICT service platform for helping hospitals and clinics deliver care in a variety of ways. Offerings include our
Collaboration Box Service, which allows multiple institutions to share medical data such as examination images and
reports, and remote diagnostic support services that facilitate requests for image interpretation.
・CARE Program: Healthcare Business
Program to provide total support for effective pick-up and genetic diagnostics of the high-risk group of genetic breast
cancer.
・CARE for COVIT: Healthcare Business
Healthcare program which is aimed to prevent the infection of COVID-19. It offers safety and security to employees and
citizens through counselling with AI technology, PCR testing, and telemedicine.
・ SANUQI: Industry BusinessTrademark of a new resin film, used as a material in electronic devices for displays.
Konica Minolta, Inc.Konica Minolta, Inc.
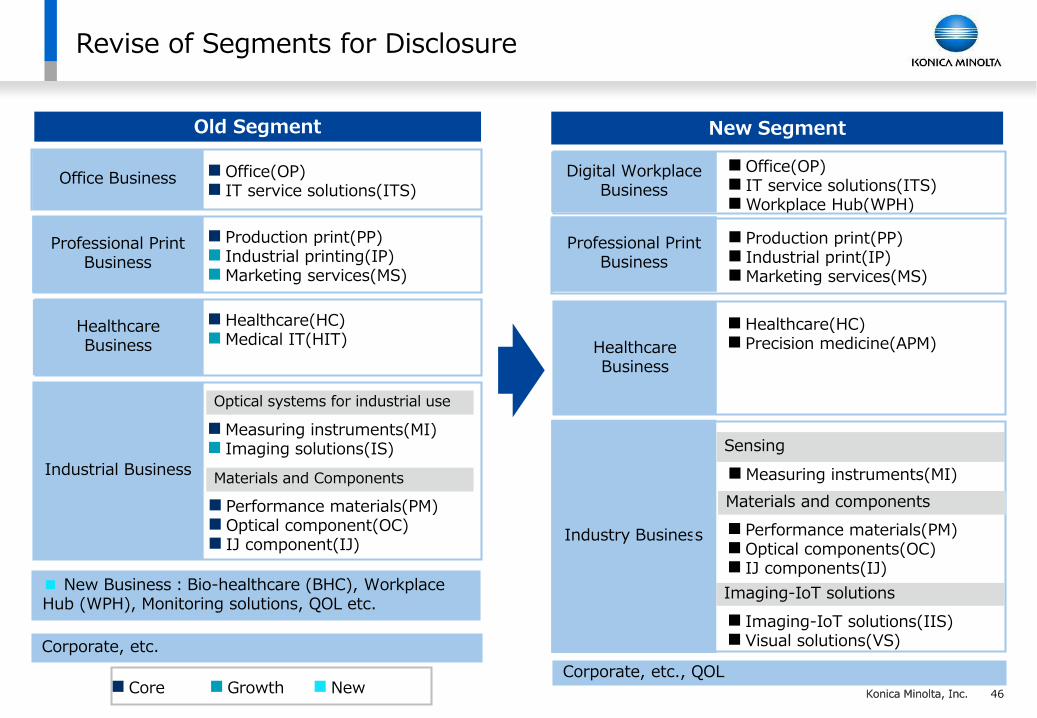
Revise of Segments for Disclosure
◼ Office(OP)◼ IT service solutions(ITS)
Old Segment
Office Business
◼ Production print(PP)◼ Industrial printing(IP)◼Marketing services(MS)
Professional Print Business
◼ Healthcare(HC)◼Medical IT(HIT)
Healthcare Business
◼Measuring instruments(MI)◼ Imaging solutions(IS)
Industrial Business
Optical systems for industrial use
◼ Performance materials(PM)◼ Optical component(OC)◼ IJ component(IJ)
Materials and Components
■ New Business:Bio-healthcare (BHC), Workplace Hub (WPH), Monitoring solutions, QOL etc.
◼ Core ◼ Growth ◼ New
Corporate, etc.
◼ Office(OP)◼ IT service solutions(ITS)◼Workplace Hub(WPH)
Digital Workplace Business
◼ Production print(PP)◼ Industrial print(IP)◼Marketing services(MS)
Professional Print Business
◼ Healthcare(HC)◼ Precision medicine(APM)Healthcare
Business
Industry Business
Corporate, etc., QOL
New Segment
Sensing
◼Measuring instruments(MI)
◼ Imaging-IoT solutions(IIS)◼ Visual solutions(VS)
Imaging-IoT solutions
◼ Performance materials(PM)◼ Optical components(OC)◼ IJ components(IJ)
Materials and components
46
Konica Minolta, Inc.
Cautionary Statement:The forecasts mentioned in this material are the results of estimations based on currentlyavailable information, and accordingly, contain risks and uncertainties. The actual results ofbusiness performance may sometimes differ from those forecasts due to various factors.
Remarks:Yen amounts are rounded to the nearest 100 million.