1st quarter results for fiscal year ending 3/2011 quarter ... · 1st quarter results for fiscal...
TRANSCRIPT

August 4August 4thth, 2010, 2010
eAccess LimitedeAccess Limited【【94279427】】
11stst Quarter Results for Fiscal Year Ending 3/2011Quarter Results for Fiscal Year Ending 3/2011((4/2010 ~ 6/20104/2010 ~ 6/2010))

2
Page 3I. FY3/2011 1Q Results Highlight
II. Operational Update
III. Appendix
Page 14
Page 29

3
I. FY3/2011 1Q Results Highlight
II. Operational Update
III. Appendix
Page 3
Page 14
Page 29

4
FY3/2011 1Q Results HighlightsFY3/2011 1Q Results Highlights
Consolidated net profit rose by over 5X YoY
EMOBILE revenue up 48.6% YoY
Combined pro-forma of eAccess & EMOBILE 1Q EBITDA doubled YoY
Maintain leadership position in mobile broadband data market
To launch Japan’s fastest mobile data service 42Mbps in October 2010
Expect to realize further synergies after eAccess EMOBILE combination
5
Revenue
Net Income
Capex
(billion yen)
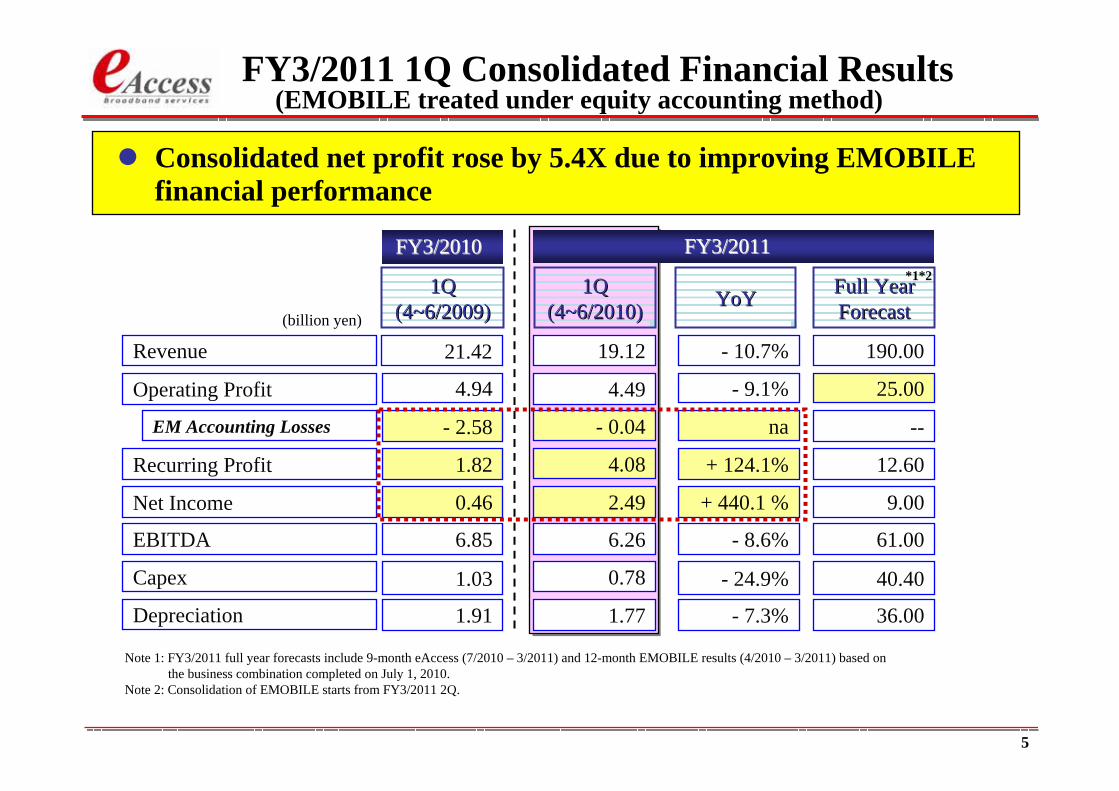
FY3/2011 1Q Consolidated Financial Results(EMOBILE treated under equity accounting method)
Operating Profit
Recurring Profit
Depreciation
EBITDA
1Q1Q(4~6/2010)(4~6/2010)
1Q1Q(4~6/2009)(4~6/2009) YoYYoY Full YearFull Year
ForecastForecast
FY3/2011FY3/2011FY3/2010FY3/2010
1.77 36.00- 7.3%
0.78 40.40- 24.9%
6.26 61.00- 8.6%
2.49 9.00+ 440.1 %
4.08 12.60+ 124.1%
4.49
--na
19.12 190.00- 10.7%
EM Accounting Losses - 0.04
- 9.1% 25.00
*1*2
1.91
1.03
6.85
0.46
1.82
- 2.58
21.42
4.94
Consolidated net profit rose by 5.4X due to improving EMOBILE financial performance
Note 1: FY3/2011 full year forecasts include 9-month eAccess (7/2010 – 3/2011) and 12-month EMOBILE results (4/2010 – 3/2011) based onthe business combination completed on July 1, 2010.
Note 2: Consolidation of EMOBILE starts from FY3/2011 2Q.
6
Combined Combined eAccesseAccess & EMOBILE Pro& EMOBILE Pro--forma Basis forma Basis (For Financial Comparison Purpose)(For Financial Comparison Purpose)

77
ConsolidatedRevenue: 190.00 billion yenEBITDA: 61.00 billion yen
Prior EMOBILEshareholders
eAccessShareholders
100% consolidatedsubsidiary (as of 7/1/2010)
Consolidation of EMOBILEConsolidation of EMOBILE
Equity accountingaffiliate (38.2%)
(as of 6/30/2010)
EMOBILEshareholders
eAccessShareholders
Successful completion of EMOBILE consolidation through theshare-exchange transaction on 7/1/2010.
Stand-aloneRevenue: 73.00 billion yenEBITDA: 24.00 billion yen
Note 1: Financial figures are based on the forecasts for FY3/2011.
Stand-aloneRevenue: 150.00 billion yenEBITDA: 43.00 billion yen
Stand-aloneRevenue: 150.00 billion yenEBITDA: 43.00 billion yen
8
Revenue
Net Income (Losses)
Capex
(billion yen)
Operating Profit (Losses)
Recurring Profit (Losses)
Depreciation
EBITDA
Operating FCF
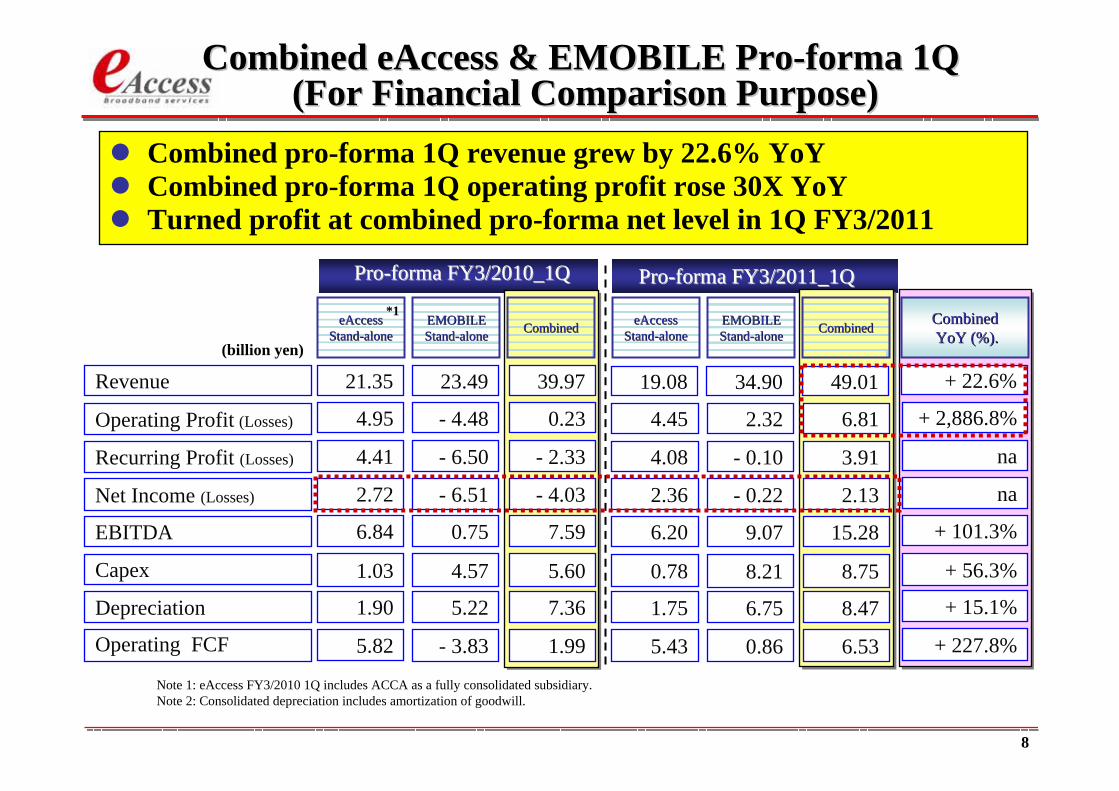
Combined pro-forma 1Q revenue grew by 22.6% YoYCombined pro-forma 1Q operating profit rose 30X YoYTurned profit at combined pro-forma net level in 1Q FY3/2011
ProPro--forma FY3/2011_1Qforma FY3/2011_1Q
CombinedCombinedYoYYoY (%).(%).
ProPro--forma FY3/2010_1Qforma FY3/2010_1Q
Combined Combined eAccesseAccess & EMOBILE Pro& EMOBILE Pro--forma 1Qforma 1Q(For Financial Comparison Purpose)(For Financial Comparison Purpose)
+ 227.8%
+ 15.1%
+ 56.3%
+ 101.3%
na
na
+ 22.6%
+ 2,886.8%
eAccesseAccessStandStand--alonealone
5.82
1.90
1.03
6.84
2.72
4.41
21.35
4.95
EMOBILEEMOBILEStandStand--alonealone CombinedCombined eAccesseAccess
StandStand--alonealoneEMOBILEEMOBILEStandStand--alonealone CombinedCombined
- 3.83
5.22
4.57
0.75
- 6.51
- 6.50
23.49
- 4.48
1.99
7.36
5.60
7.59
- 4.03
- 2.33
39.97
0.23
5.43
1.75
0.78
6.20
2.36
4.08
19.08
4.45
0.86
6.75
8.21
9.07
- 0.22
- 0.10
34.90
2.32
6.53
8.47
8.75
15.28
2.13
3.91
49.01
6.81
Note 1: eAccess FY3/2010 1Q includes ACCA as a fully consolidated subsidiary.Note 2: Consolidated depreciation includes amortization of goodwill.
*1

9
Revenue
Net Income (Losses)
Capex
(billion yen)
Operating Profit (Losses)
Recurring Profit (Losses)
Depreciation
EBITDA
Operating FCF
Combined pro-forma full year EBITDA to grow 48% YoYCombined full year operating profit to grow 145% YoY (record high)Expect sharp turnaround in combined recurring and net profit
ProPro--forma FY3/2011 Forecastsforma FY3/2011 Forecasts
CombinedCombinedYoYYoY (%).(%).
ProPro--forma FY3/2010 Resultsforma FY3/2010 Results
na
+ 18.9%
- 26.1%
+ 48.3%
na
+ 2,242.1%
+ 15.0%
+ 144.5%
eAccesseAccessStandStand--alonealone
22.48
7.45
4.01
26.49
9.71
16.67
82.81
19.04
EMOBILEEMOBILEStandStand--alonealone CombinedCombined eAccesseAccess
StandStand--alonealoneEMOBILEEMOBILEStandStand--alonealone Combined.Combined.
- 35.18
22.77
53.39
18.21
- 14.88
- 14.77
113.60
- 6.09
- 10.98
31.13
55.50
44.52
- 6.25
0.68
176.48
11.86
20.80
7.20
3.20
24.00
8.40
14.10
73.00
16.80
4.00
30.00
39.00
43.00
4.00
4.00
150.00
13.00
25.00
37.00
41.00
66.00
11.00
16.00
203.00
29.00
*1
Note 1: eAccess FY3/2010 1Q includes ACCA as a fully consolidated subsidiary.Note 2: Consolidated depreciation includes amortization of goodwill.
Combined Combined eAccesseAccess & EMOBILE Pro& EMOBILE Pro--formaformaFull Year Financial ForecastsFull Year Financial Forecasts

10
7.59
44.52
15.28
66.00
0.00
10.00
20.00
30.00
40.00
50.00
60.00
70.00 FY3/2010FY3/2011
39.97
176.48
49.01
203.00
0.00
50.00
100.00
150.00
200.00
250.00FY3/2010FY3/2011
Combined Combined eAccesseAccess & EMOBILE Pro& EMOBILE Pro--formaformaRevenue & EBITDA GrowthRevenue & EBITDA Growth
(billion yen)
(billion yen)(billion yen)
Combined Pro-forma Revenue(Reflecting 100% EMOBILE consolidation)
Combined Pro-forma EBITDA (Reflecting 100% EMOBILE consolidation)
15.0%Revenue growth
48.3%EBITDA growth
FY3/20101Q
FY3/20111Q
FY3/2010Full-year
FY3/2011Full-year (E)
FY3/20101Q
FY3/20111Q
FY3/2010Full-year
FY3/2011Full-year (E)
Note 1: eAccess FY3/2010 includes ACCA as a fully consolidated subsidiary.

11
-4.03-6.25
2.13
11.00
-10.00
-5.00
0.00
5.00
10.00
15.00 FY3/2010FY3/2011
0.23
11.86
6.81
29.00
0.00
5.00
10.00
15.00
20.00
25.00
30.00 FY3/2010FY3/2011
Combined Combined eAccesseAccess & EMOBILE Pro& EMOBILE Pro--formaformaOperating Profit & Net Income GrowthOperating Profit & Net Income Growth
(billion yen)
(billion yen)(billion yen)
Combined Pro-forma Operating Profit(Reflecting 100% EMOBILE consolidation)
Combined Pro-forma Net Income(Reflecting 100% EMOBILE consolidation)
FY3/20101Q
2.5X Operating
profit growth17.25 billion yen
net profit growth
FY3/20111Q
FY3/2010Full-year
FY3/2011Full- year (E)
FY3/20101Q
FY3/20111Q
FY3/2010Full-year
FY3/2011Full-year (E)
Note 1: eAccess FY3/2010 includes ACCA as a fully consolidated subsidiary.

12
Cash & cash deposit
Debt
Shareholders’ equity
Total assets
Net debt
Net assets
335.36
72.27
153.29
230.82
72.27
130.44
58.27
47.18
59.66
58.36
EMOBILEEMOBILEStandStand--alonealone
6/20106/2010
eAccesseAccessstandstand--alonealone
6/20106/2010
77.5312.48
(billion yen)
10.72
GoodwillGoodwill
409.06
70.82
200.47
290.47
70.82
ProPro--formaformaBalance SheetBalance Sheet
PostPost--transactiontransaction
90.00
*1==
Asset and cash injection from EMOBILE to eAccess combinedpro-forma balance sheet with relatively small goodwill amortization.
EliminationElimination
- 67.47
- 59.72
- 59.80
Net debt/EBITDA ratio
Net debt/net assets ratio
3.0x
2.8x
Note 1: Goodwill of 10.72 billion yen is expected to be amortized over 10 years.Note 2: Based on pro-forma FY3/2011 EBITDA figures. See page 9 of this presentation for details.
3.6x
2.1x
2.0x
0.8x*2
Combined Combined eAccesseAccess & EMOBILE Pro& EMOBILE Pro--formaforma(Post Share(Post Share--Exchange) Balance SheetExchange) Balance Sheet

13
Shareholder ReturnsShareholder Returns
DividendDividend
Share buybackShare buyback
Appraisal rights(relating to EMOBILEBusiness Combination)
Appraisal rights(relating to EMOBILEBusiness Combination)
Plan to preserve cash for growth
Enhance shareholders equity value by lowering leverage
1,800 yen per share extraordinary dividend to shareholders
as of 6/30/2010 is scheduled to be paid on 9/10/2010.
Plan to preserve cash for growth
Enhance shareholders equity value by lowering leverage
1,800 yen per share extraordinary dividend to shareholders
as of 6/30/2010 is scheduled to be paid on 9/10/2010.
Purchased back 8,777 shares, or approx. 0.5 billion yen
in 7/2010.
Purchased back 8,777 shares, or approx. 0.5 billion yen
in 7/2010.
Appraisal rights of 36,800 shares, or approx. 2.3 billion yen
is expected to be exercised in 8/2010.
Appraisal rights of 36,800 shares, or approx. 2.3 billion yen
is expected to be exercised in 8/2010.

14
I. FY3/2011 1Q Results Highlight
II. Operational Update
III. Appendix
Page 3
Page 14
Page 29
15
EMOBILE StrengthsEMOBILE Strengths
Leader in SpeedLeader in Leader in SpeedSpeed
Leader in Mobile Broadband NetworkLeader in Mobile BroadbandLeader in Mobile Broadband NetworkNetwork
Leader in ProductLeader in Leader in ProductProduct
Leader in SpeedLeader in Leader in SpeedSpeed111
222
333
16
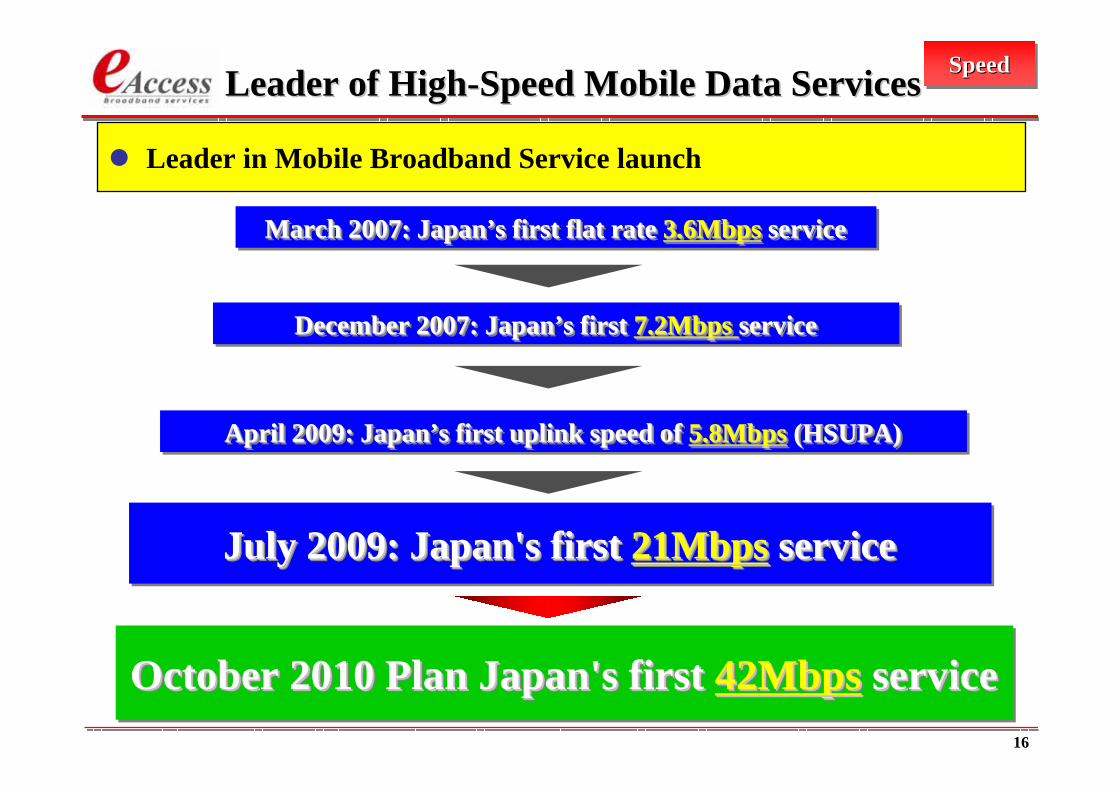
Leader in Mobile Broadband Service launch
Leader of HighLeader of High--Speed Mobile Data ServicesSpeed Mobile Data Services
October 2010 Plan Japan's first 42Mbps serviceOctober 2010 Plan Japan's first October 2010 Plan Japan's first 42Mbps42Mbps serviceservice
March 2007: Japan’s first flat rate 3.6Mbps serviceMarch 2007: JapanMarch 2007: Japan’’s first flat rate s first flat rate 3.6Mbps3.6Mbps serviceservice
December 2007: Japan’s first 7.2Mbps serviceDecember 2007: JapanDecember 2007: Japan’’s first s first 7.2Mbps 7.2Mbps serviceservice
April 2009: Japan’s first uplink speed of 5.8Mbps (HSUPA)April 2009: JapanApril 2009: Japan’’s first uplink speed of s first uplink speed of 5.8Mbps5.8Mbps (HSUPA)(HSUPA)
July 2009: Japan's first 21Mbps serviceJuly 2009: Japan's first July 2009: Japan's first 21Mbps21Mbps serviceservice
SpeedSpeedSpeed

1717
3.6Mbps3.6Mbps
7.2Mbps7.2Mbps
42Mbps42Mbps
21Mbps21Mbps
3/2007 2009 2010 20112008
December
42Mbps42Mbps
December
40Mbps40Mbps
DC-HSDPA / LTE
3.5G
Downlink Speed
3.1Mbps3.1Mbps
AC
B
E
April
February
July
SpeedSpeedSpeedMobile Broadband Speed ComparisonMobile Broadband Speed Comparison

18
DCDC--HSDPA 42Mbps DemonstrationHSDPA 42Mbps Demonstration SpeedSpeedSpeed
Achieved top downlink speed of over 40 Mbps by using DC- HSDPA

19
LTE4x4
MIMO
LTE2x2
MIMO
LTEHSPA4x4
MIMO
HSPA2x2
MIMO
HSPATechnologyTechnology
40
80
120
80
160
240
20
40
60
80
160
240
40205 MHz x 2
804010 MHz x 2
1206015 MHz x 2
HSPA LTE
DCDC--HSDPAHSDPA
(Source: Ericsson)
(Mbps)
Peak Rates vs Technology Peak Rates vs Technology SpeedSpeedSpeed
No speed difference between HSPA and LTE technology

20
Nationwide 6/2010
Outdoor 91.5%
Subway 97.2%
Hokkaido6/2010
Outdoor 86.0%Subway 95.7%
Tohoku6/2010
Outdoor 78.8%Subway 100.0%
Kanto6/2010
Outdoor 98.6%Subway 96.8%
Tokai6/2010
Outdoor 94.6%Subway 100.0%
Kinki6/2010
Outdoor 96.1%Subway 97.3%
Shikoku 6/2010
Outdoor 75.7%
Shinetu6/2010
Outdoor 84.1%
Okinawa6/2010
Outdoor 91.7%
Hokuriku6/2010
Outdoor 85.2%
Chugoku6/2010
Outdoor 77.0%Subway 100.0%
Kyusyu6/2010
Outdoor 87.0%Subway 85.3%
NetworkNetworkNetworkMobile Broadband Network CoverageMobile Broadband Network Coverage
Near completion of major outdoor & subway coverageFocus on capacity increase and speed upgrade

21
(Source: GfK Japan)
ProductProductProductPocket WiFi: Number 1 Best SellerPocket WiFi: Number 1 Best Seller
Number 1 best seller of mobile broadband routerMCF Mobile Project Award 2010 (The Best Hardware Prize)MM Research Institute Award 2010 (The Best Topic Prize)
No.1 Best Seller for 7 consecutive monthsNo.1 Best Seller for 7 consecutive months((Data communication category from 12/2009 to 6/2010Data communication category from 12/2009 to 6/2010))

22Note 1: Super light data plan + Ninen M Note 2: ISP charge(525 yen) is included Note 3: Only company F SIM(Source: EMOBILE)
4 hours3.5 hours2.5 hours6 hours4 hoursAirtime(catalog spec)
Aterm WM3300R
80g117g145g105g80gWeight
54×99×14mm104×62×14.8mm67×94×22mm95×64.4×17.4mm48.6×95.5×14.1mmDimension
300/300Kbps40/10Mbps7.2/5.7Mbps7.2/5.8MbpsSpeed
(Down/Up)
none30 days2 year2 yearContract
BM-MF30URoad-7000DWR-PG
Pocket WiFi(D25HW)
Productname
EMOBILE
---30 hours100 hoursStandby time(catalog spec)
2,483 yen380~4,980 yen1,525~6,510 yen1,400~5,380 yenMonthlycharge
19,800 yen19,800 yen34,800 yen5,980 yenUnit Price
FEACompany
**11
**22 **33
ProductProductProductMobile Mobile WiFiWiFi Routers ComparisonRouters Comparison
23
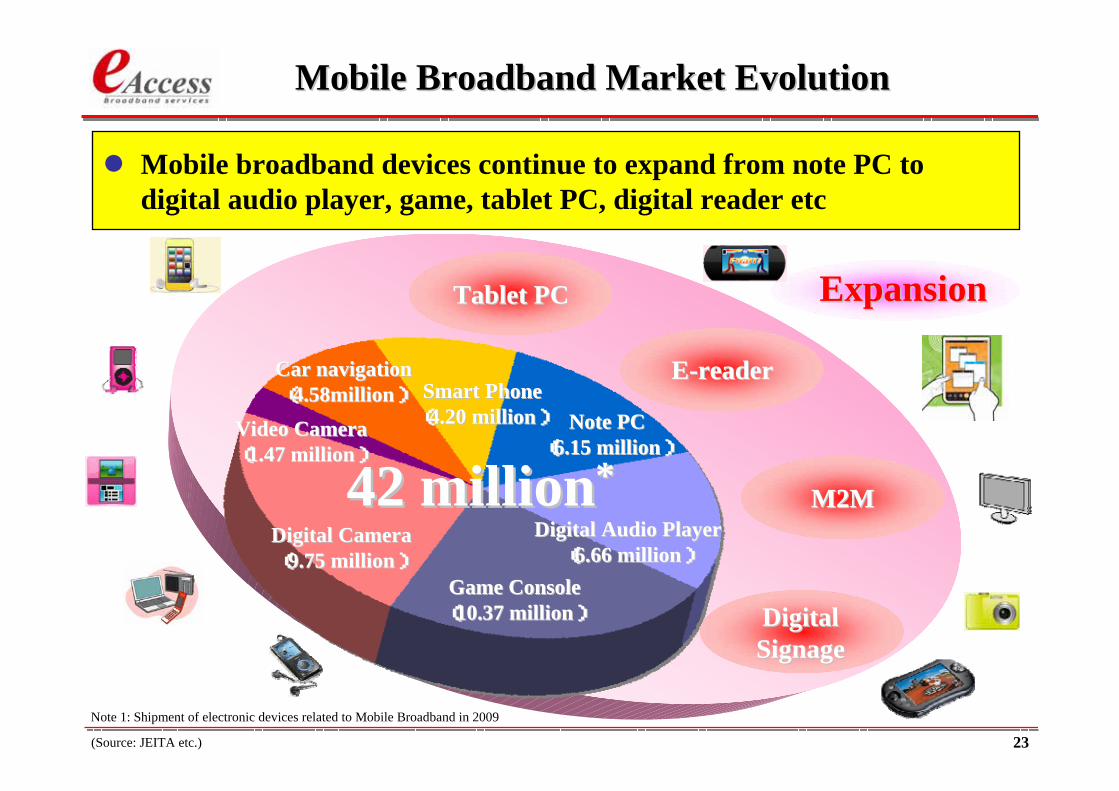
ExpansionExpansion
Smart PhoneSmart Phone((4.20 million4.20 million))
(Source: JEITA etc.)
Digital Digital SignageSignage
M2MM2M42 million42 million**Note PCNote PC
((6.15 million6.15 million))
Game ConsoleGame Console((10.37 million10.37 million))
Digital Audio PlayerDigital Audio Player((6.66 million6.66 million))
Digital CameraDigital Camera((9.75 million9.75 million))
Video CameraVideo Camera((1.47 million1.47 million))
Car navigationCar navigation((4.58million4.58million))
Tablet PCTablet PC
Note 1: Shipment of electronic devices related to Mobile Broadband in 2009
EE--readerreader
Mobile Broadband Market EvolutionMobile Broadband Market Evolution
Mobile broadband devices continue to expand from note PC to digital audio player, game, tablet PC, digital reader etc
24
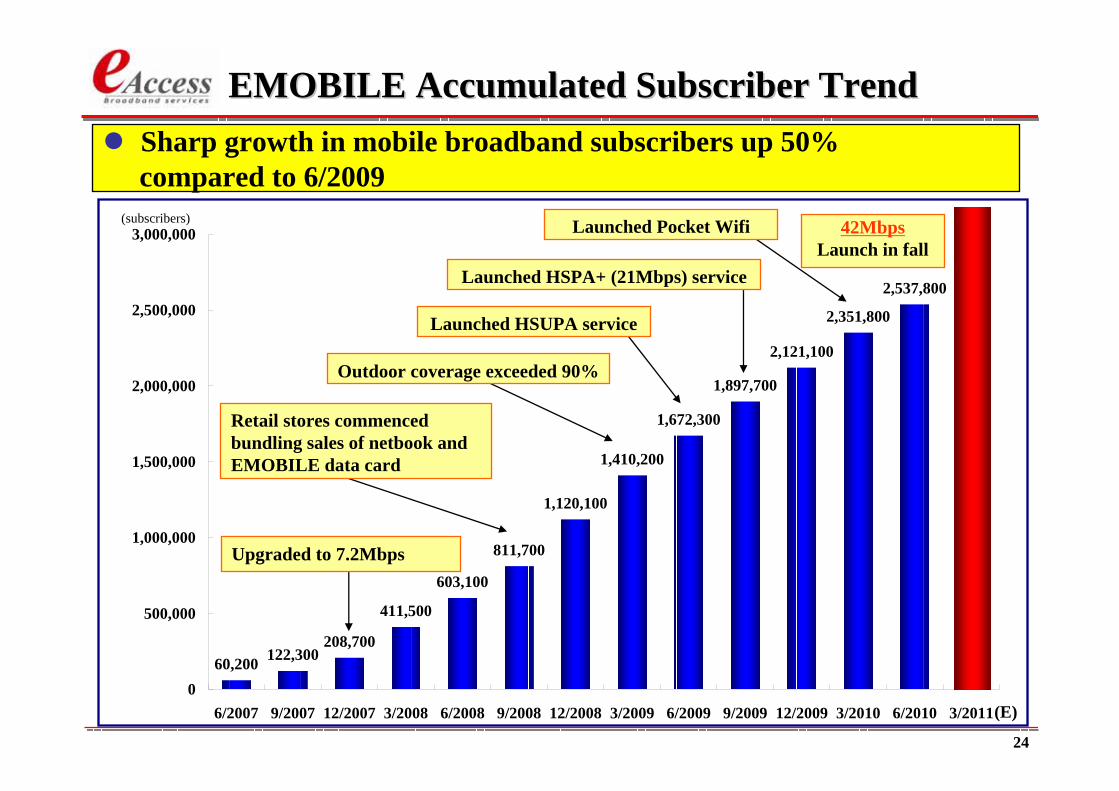
60,200 122,300208,700
411,500
603,100
811,700
1,120,100
1,410,200
1,672,300
1,897,700
2,121,100
2,537,800
2,351,800
0
500,000
1,000,000
1,500,000
2,000,000
2,500,000
3,000,000
6/2007 9/2007 12/2007 3/2008 6/2008 9/2008 12/2008 3/2009 6/2009 9/2009 12/2009 3/2010 6/2010 3/2011
Launched HSPA+ (21Mbps) service
Retail stores commenced bundling sales of netbook and EMOBILE data card
Launched Pocket Wifi
Outdoor coverage exceeded 90%
Launched HSUPA service
Upgraded to 7.2Mbps
42MbpsLaunch in fall
(E)
Sharp growth in mobile broadband subscribers up 50%compared to 6/2009
EMOBILE Accumulated Subscriber TrendEMOBILE Accumulated Subscriber Trend
(subscribers)
25
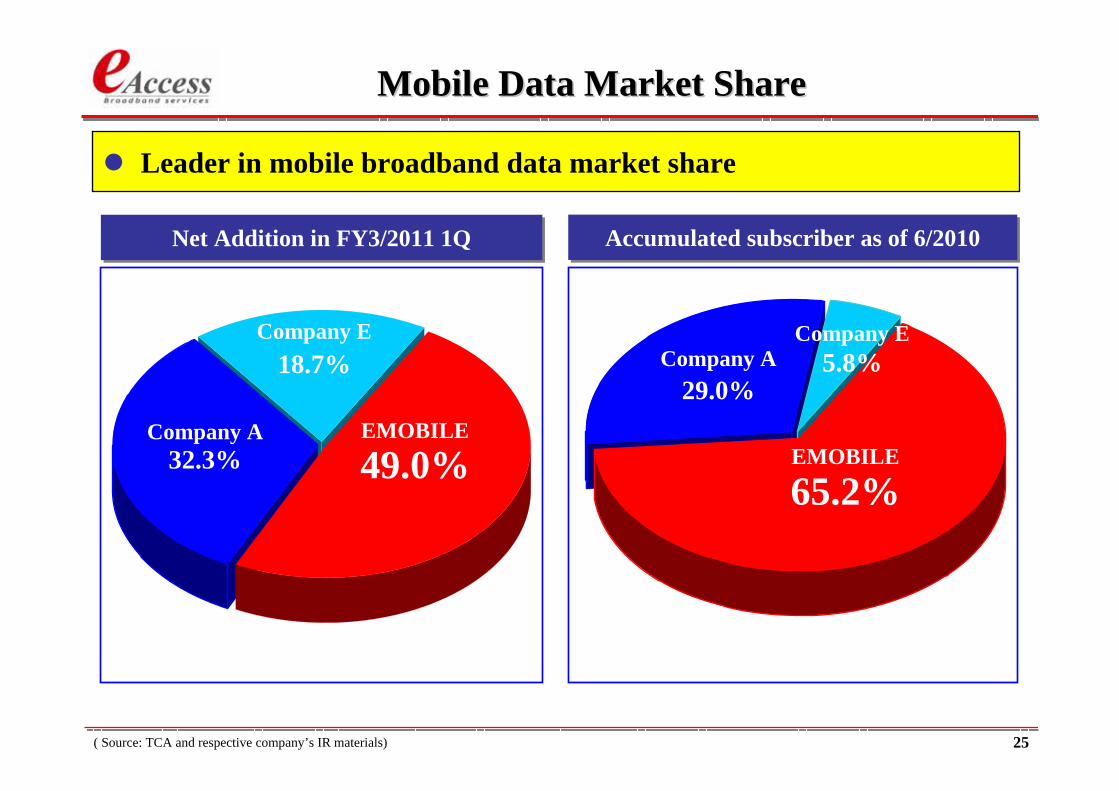
Mobile Data Market Share Mobile Data Market Share
( Source: TCA and respective company’s IR materials)
Company E
EMOBILECompany A
Company E
EMOBILE
Company A
Net Addition in FY3/2011 1QNet Addition in FY3/2011 1Q Accumulated subscriber as of 6/2010Accumulated subscriber as of 6/2010
Leader in mobile broadband data market share
49.0%32.3%
18.7%
65.2%
29.0%5.8%

26
Note 1: ACCA was consolidated from 9/1/2008. Subscribers, ARPU and churn rate include ACCA consumer and corporate subscribers from 9/1/2008. Note 2: ARPU definition changed from FY3/2010 4Q due to accounting rule changes.Note 3: SAC stands for per subscriber acquisition cost.
Monthly churn rate
Subscriber #
ARPU (yen)
SAC (yen)
EMOBILE
2.072.07%% approx.approx. 1.89%1.89%1.821.82%%
ForecastResults
FY3/2010FY3/20104Q4Q
FY3/2010FY3/20103Q3Q
ARPU (yen) 1,9951,995 approx.approx. 1,9501,9502,008 2,008
2.122.12%%
FY3/2011FY3/20111Q1Q
1,9731,973
SAC (yen) 11,00011,000 approx.approx. 8,0008,0007,0007,000 8,0008,000
FY3/2011FY3/2011fullfull--yearyear
Subscriber #
Fixed-line(ADSL)
1.671.67%%2.022.02%%
FY3/2010FY3/20102Q2Q
FY3/2010FY3/20101Q1Q
2,0222,0222,032 2,032
9,0009,0009,0009,000
2,285,0002,285,0002,364,0002,364,000 2,204,0002,204,000 approx.approx. 1,900,0001,900,0002,439,0002,439,0002,497,0002,497,000
Monthly churn rate
*2
*3
approx.approx.1.40%1.40%
approx. approx. 3,3003,300
25,000 25,000 -- 30,00030,000
approx.approx. 3,200,0003,200,000
0.92%0.92%
2,121,1002,121,100
3,260 3,260
25,00025,000
1.18%1.18%
2,351,8002,351,800
3,4503,450
1.37%1.37%
2,537,3002,537,300
3,4003,400
25,00025,000 25,00025,000
0.97%0.97%
1,672,3001,672,300
3,330 3,330
30,00030,000
1.10%1.10%
1,897,7001,897,700
3,3103,310
30,00030,000
*3
eAccesseAccess & EMOBILE Key Performance Metrics& EMOBILE Key Performance Metrics
Key performance metrics of fixed-line and mobile operations are progressing in-line with our full-year forecast for FY3/2011.

27
New pricing plan “Ninen toku wari”(Zero yen for the month for Zero usage)Provide “used” terminals at low prices for replacementDirect mail promotion for new models upgrade
Traffic shaping (for heavy traffic users)Deploy 2nd Carrier (5MHz x 2) for speed enhancement and traffic management
Provide data card value-added option services
EMOBILE Customer SatisfactionEMOBILE Customer Satisfaction
ARPU Enhancement 157 yenTrouble Support Service
Monthly ChargeMonthly ChargeService NameService Name
EM Security 498 yen
Remote Support Service 315 yen
EM Wide Support 525 yen
Note 1: for data card service users Note2: for users who expired two years contract and renew the contract for “Data Plan”.
Customer
Satisfaction
Customer
Retention
Network
Quality
Continued initiatives to improve customer satisfaction & experience
*1
*2

28
Retails/GMS
Approx. 2,000 stores with 900
sales staff
TV shoppingmail order
Tel OperatorsMVNOs, ISPs
Carrier’s nationwide channels /
over 20 ISPs
WEB/TMDirect sales
Approx. 40,000(incl. SME)
ExtensiveExtensiveSales ChannelsSales Channels
Continue to expand sales channels in retails, distributors, telecom operators and TV shopping
Expanding Sales ChannelsExpanding Sales Channels
29
I. FY3/2011 1Q Results Highlight
II. Operational Update
III. Appendix
Page 3
Page 14
Page 29
30
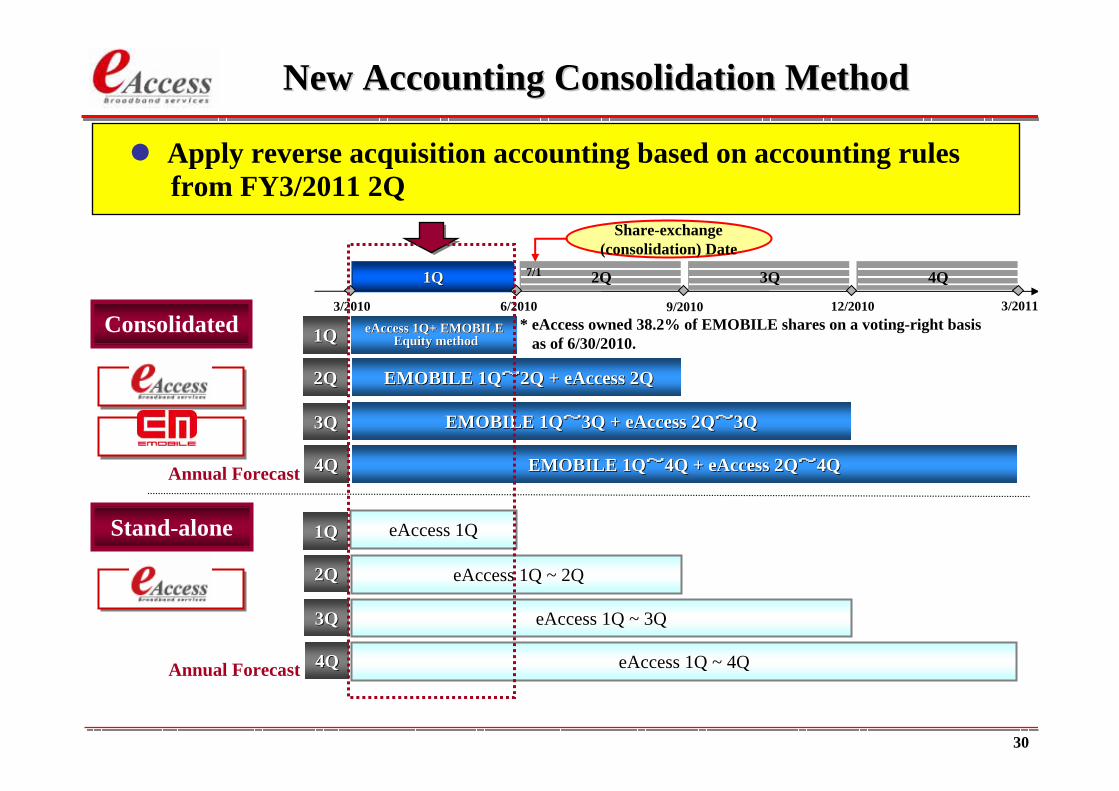
1Q1Q 2Q2Q 3Q3Q 4Q4Q
3/20113/2010 6/2010 9/2010 12/2010
eAccess 1QeAccess 1Q
Share-exchange(consolidation) Date
7/1
New Accounting Consolidation MethodNew Accounting Consolidation Method
eAccess 1Q ~ 2QeAccess 1Q ~ 2Q
eAccess 1Q ~ 3QeAccess 1Q ~ 3Q
eAccess 1Q ~ 4QeAccess 1Q ~ 4Q
* eAccess owned 38.2% of EMOBILE shares on a voting-right basisas of 6/30/2010.
EMOBILE 1QEMOBILE 1Q~~2Q + eAccess 2Q2Q + eAccess 2Q
EMOBILE 1QEMOBILE 1Q~~3Q + eAccess 2Q3Q + eAccess 2Q~~3Q3Q
EMOBILE 1QEMOBILE 1Q~~4Q + eAccess 2Q4Q + eAccess 2Q~~4Q4Q
eAccess 1Q+ EMOBILEeAccess 1Q+ EMOBILEEquity methodEquity method
Annual Forecast
Annual Forecast
Apply reverse acquisition accounting based on accounting rulesfrom FY3/2011 2Q
2Q2Q
3Q3Q
4Q4Q
1Q1Q
2Q2Q
3Q3Q
4Q4Q
1Q1Q
Consolidated
Stand-alone

31
Consolidated Cash FlowsConsolidated Cash Flows(EMOBILE 1Q treated under equity accounting method)
EBITDA
Tax
Net FCF
(billion yen)
Capex
Interest (net of interest income)
Dividend (net of div. income)
1Q1Q(4~6/2010)(4~6/2010)
1Q1Q(4~6/2009)(4~6/2009) YoYYoY Full YearFull Year
ForecastForecast
FY3/2011FY3/2011FY3/2010FY3/2010
1.15 4.30- 62.7%
- 0.85 - 4.30+ 7.6%
- 3.00 - 3.00+ 62.2%
- 0.48 - 9.00+ 380.0%
- 0.78
20.60- 5.7%
6.26 61.00- 8.6%
5.48
- 24.9% - 40.40
*2
3.08
- 0.79
- 1.85
- 0.10
5.82
6.85
- 1.03
Net free cash flow decreased mainly due to an increase in1Q tax payment.
Operating FCF
*1
Note 1: eAccess consolidated ACCA from 9/1/2008 and fully merged with ACCA on 6/25/2009.Note 2: FY3/2011 full year forecasts are based on the forecasts announced on 5/12/2010.Note 3: Dividends of full year forecast are based on the current dividend policy. Note 4: Consolidation of EMOBILE starts from FY3/2011 2Q.

32
Consolidated Balance SheetsConsolidated Balance Sheets(EMOBILE treated under equity accounting method)
17 billion yen cash investment to EMOBILE was completed in 6/2010.Shareholders equity is steadily increasing from 9/2009.
Cash & cash deposit
Debt
Shareholders’ equity
Total assets
Net debt/net assets ratio
Net debt
Minority interest
Net assets
Net debt/EBITDA ratio 1.0x
2.0x
129.50
13.01
0.52
26.47
94.67
12.58
1.1x
2.6x
112.75
11.27
0.53
29.43
87.15
11.01
12/20099/2009
68.2057.72
(billion yen)
1.1x
2.2x
86.86
13.16
0.51
28.94
55.05
12.61
3/2010
26.11
1.8x
3.2x
86.83
14.66
0.50
46.55
59.66
14.25
6/2010
13.11
1.3x
2.7x
112.99
12.03
0.54
32.69
90.33
11.78
6/2009
57.64

33
23.5%
17.6%
25.7%25.6%
23.0%
4.49
3.51
5.245.464.94
0.00
1.00
2.00
3.00
4.00
5.00
6.00
2009/1Q 2009/2Q 2009/3Q 2009/4Q 2010/1Q0.0%
10.0%
20.0%
30.0%
Operating profit (Device)Operating profit (Network)Consolidated operating margin (%)
3.082.92 3.00 2.96
18.37 18.29 17.4516.91 16.16
3.05
21.42 21.3720.37
19.1219.91
0.00
5.00
10.00
15.00
20.00
25.00
30.00
2009/1Q 2009/2Q 2009/3Q 2009/4Q 2010/1Q
Revenue (Device)Revenue (Network)Consolidated Revenue
Consolidated Revenue & Operating Profit TrendConsolidated Revenue & Operating Profit Trend(EMOBILE treated under equity accounting method)
(billion yen)
(billion yen)(billion yen)
Revenue Trend Operating Profit/Operating Profit Margin
Note 1: eAccess consolidated ACCA from 9/1/2008 and fully merged with ACCA on 6/25/2009.Note 2: Consolidation of EMOBILE starts from FY3/2011 2Q.
Revenue declined in 1Q in-line with expectationsOperating margin 1Q improved to 23.5%
34
4.36
2.31
4.08
1.822.34
0.94
2.49
0.270.46
2.48
0.00
1.00
2.00
3.00
4.00
5.00
2009/1Q 2009/2Q 2009/3Q 2009/4Q 2010/1Q
Recurring proift Net Income
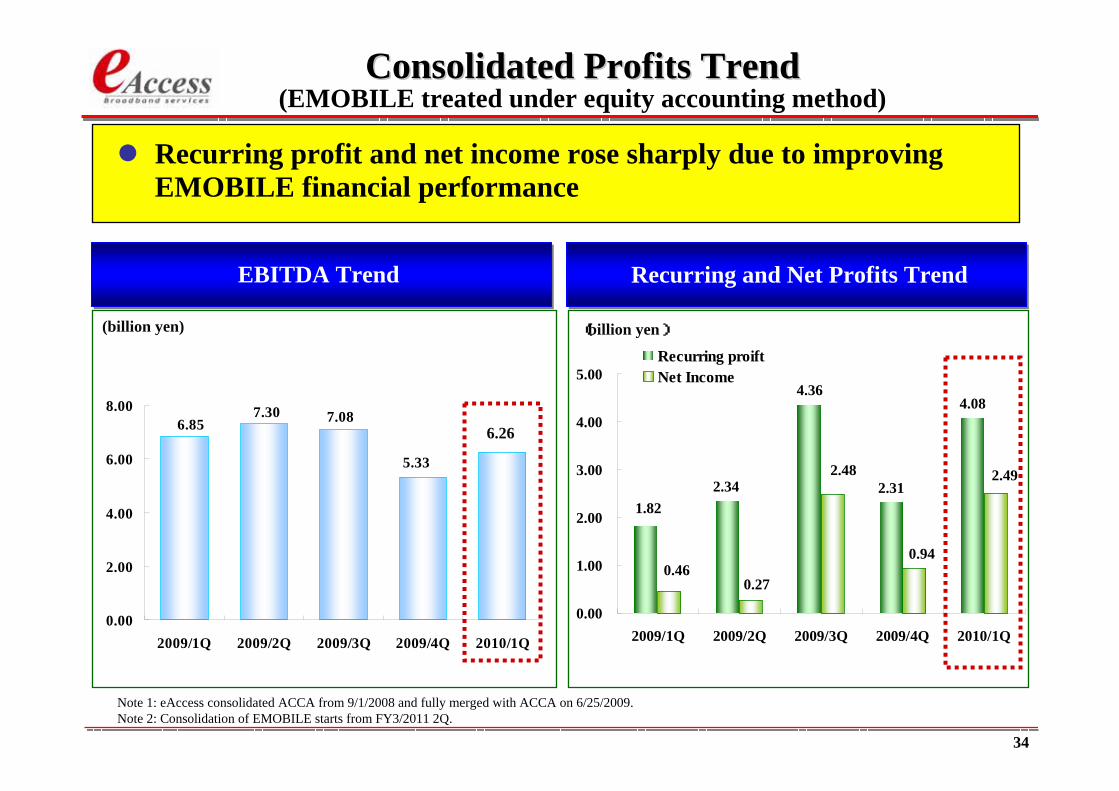
Consolidated Profits TrendConsolidated Profits Trend(EMOBILE treated under equity accounting method)
(billion yen)
(billion yen)(billion yen)
EBITDA Trend Recurring and Net Profits Trend
6.857.30
6.245.33
7.08
0.00
2.00
4.00
6.00
8.00
2009/1Q 2009/2Q 2009/3Q 2009/4Q 2010/1Q
6.26
Note 1: eAccess consolidated ACCA from 9/1/2008 and fully merged with ACCA on 6/25/2009.Note 2: Consolidation of EMOBILE starts from FY3/2011 2Q.
Recurring profit and net income rose sharply due to improving EMOBILE financial performance

35
6.42
4.05
5.466.26
5.82
0.00
2.00
4.00
6.00
8.00
2009/1Q 2009/2Q 2009/3Q 2009/4Q 2010/1Q
0.78
1.28
0.66
1.041.03
0.00
0.50
1.00
1.50
2.00
2009/1Q 2009/2Q 2009/3Q 2009/4Q 2010/1Q
Consolidated Consolidated CapexCapex & Operating FCF Trends& Operating FCF Trends(EMOBILE treated under equity accounting method)
Operating FCF TrendCapex Trend
* Operating FCF = EBITDA - Capex
(billion yen) (billion yen)
5.84 5.48
Note 1: eAccess consolidated ACCA from 9/1/2008 and fully merged with ACCA on 6/25/2009.Note 2: Consolidation of EMOBILE starts from FY3/2011 2Q.
Capex 1Q decreased 24.9% YoY with relatively high operating FCF

36
FY3/2011 1Q Results (Segment Info.)FY3/2011 1Q Results (Segment Info.)(EMOBILE treated under equity accounting method)
Note 1: Network business : ADSL Business, Retail Business, Backbone Business and MVNO Business.Note 2: Consolidation of EMOBILE starts from FY3/2011 2Q.
RevenueRevenue
Net IncomeNet Income
EBITDAEBITDA
CAPEXCAPEX
DepreciationDepreciation
EMOBILEetc. Consolidated
Operating ProfitOperating Profit
Recurring ProfitRecurring Profit
NetworkBusiness
DeviceBusiness
FY3/2011 1Q (4-6/2010)
(billion yen)
-0.04
16.16
4.35
4.12
0.77
1.73
19.12
4.49
4.08
2.49
6.26
0.78
1.77
2.96
0.14
0.01
0.04
2.53
6.11 0.15
*1
- 0.04

37
Revenue
Net Income (Losses)
(billion yen)
FY3/2011 1Q EMOBILE Financial Results
Operating Profit (Losses)
Recurring Profit (Losses)
EBITDA
1Q1Q(4~6/2010)(4~6/2010)
1Q1Q(4~6/2009)(4~6/2009) YoYYoY
EBITDA margin
Full YearFull YearForecastForecast
FY3/2011FY3/2010
26.0% 28.7%+ 22.8 point
9.07 43.00+ 1,115.6%
- 0.22 4.00na
- 0.10 4.00na
2.32
34.90 150.00+ 48.6%
na 13.00
3.2%
0.75
- 6.51
- 6.50
23.49
- 4.48
Capex
Depreciation 6.75 30.00+ 29.2%
8.21 39.00+ 79.6%
5.22
4.57
ProgressProgress
na
21.1%
na
na
23.3%
17.9%
22.5%
21.1%
Note 1: FY3/2011 full-year forecasts are based on the forecasts announced on 5/12/2010.
*1
Revenue increased by 48.6% YoY due to rapid subscriber growthEBITDA 1Q increased 12X YoYEBITDA 1Q margin reached 26% compared with 3.2% 1Q FY3/2010

38
EMOBILE Cash FlowsEMOBILE Cash Flows
EBITDA
Tax
Net FCF
(billion yen)
Capex
Interest (net of interest income)
1Q1Q(4~6/2010)(4~6/2010)
1Q1Q(4~6/2009)(4~6/2009) YoYYoY Full YearFull Year
ForecastForecast
FY3/2011FY3/2010
- 1.09 - 3.20na
- 0.02 - 0.00na
- 1.93 - 7.20na
- 8.21
4.00na
9.07 43.00+ 1,115.6%
0.86
+ 79.6% - 39.00
*2
- 5.63
- 0.02
- 1.79
- 3.83
0.75
- 4.57
Operating FCF *1
Note 1: Operating FCF = EBITDA – CapexNote 2: FY3/2011 full-year forecasts are based on the forecasts announced on 5/12/2010.
Positive 1Q operating FCF achieved due to continued and sustainedEBITDA growth
39
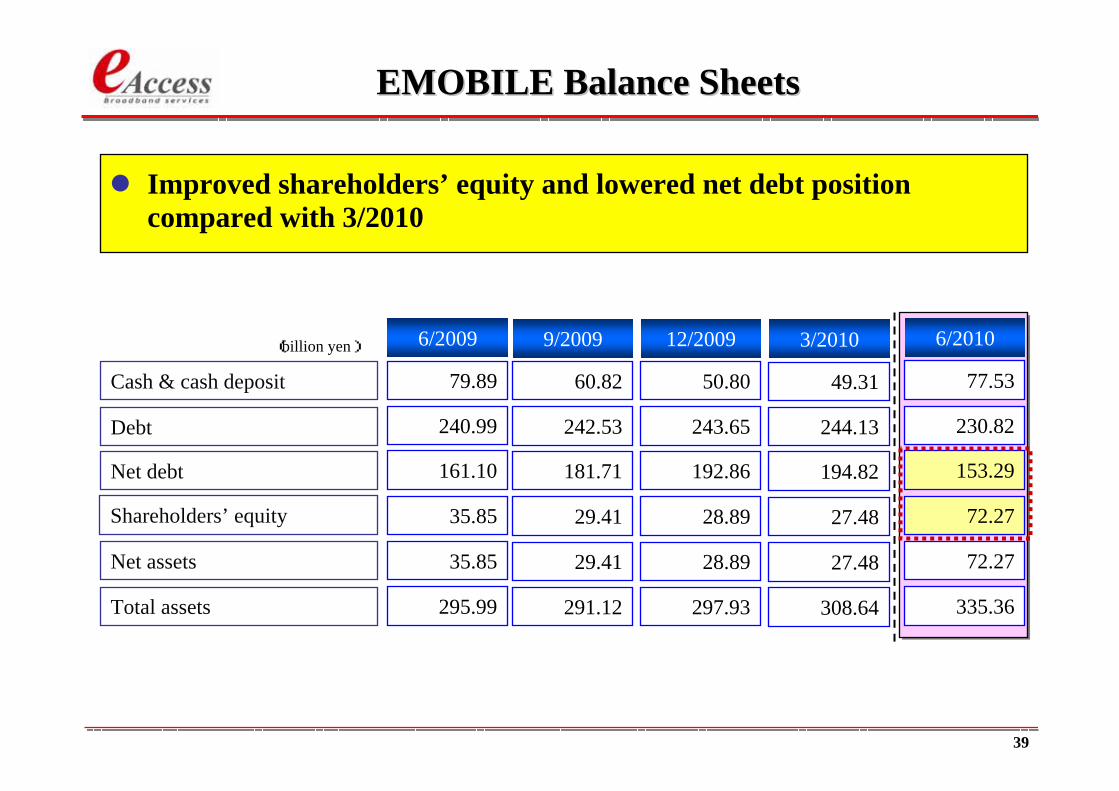
EMOBILE Balance SheetsEMOBILE Balance Sheets
Cash & cash deposit
Debt
Shareholders’ equity
Total assets
Net debt
Net assets
297.93
28.89
192.86
243.65
28.89
291.12
29.41
181.71
242.53
29.41
12/20099/2009
50.8060.82
(billion yen)
308.64
27.48
194.82
244.13
27.48
3/2010
49.31
335.36
72.27
153.29
230.82
72.27
6/2010
77.53
295.99
35.85
161.10
240.99
35.85
6/2009
79.89
Improved shareholders’ equity and lowered net debt position compared with 3/2010

40
This presentation has been prepared by eAccess Ltd. (“the Company”). This presentation contains forward-looking statements, which are subject to risks, uncertainties, and assumptions. This presentation is being presented solely for your information and is subject to change without notice. No representation or warranty, expressed or implied, is made and no reliance should be placed on the accuracy, actuality, fairness, or completeness of the information presented. The Company accept no liability whatsoever for any losses arising from any information contained in the presentation.
This presentation does not constitute an offer or invitation to purchase or subscribe for any shares of the Company, and no part of this presentation shall form the basis of or be relied upon in connection with any contract or commitment.
DisclaimerDisclaimer